Abstract
Glycerol is accumulated in response to environmental stresses in a diverse range of organisms. Understanding of favorable in vivo effects of this solute requires insight into its interactions with biological macromolecules, and one access to this information is the quantification of so-called preferential interactions in glycerol-biopolymer solutions. For model membrane systems, preferential interactions have been discussed, but not directly measured. Hence, we have applied a new differential vapor pressure equipment to quantify the isoosmotic preferential binding parameter, Γμ1, for systems of unilamellar vesicles of DMPC in aqueous glycerol. It is found that Γμ1 decreases linearly with the glycerol concentration with a slope of −0.14 ± 0.014 per molal. This implies that glycerol is preferentially excluded from the membrane-solvent interface. Calorimetric investigations of the same systems showed that the glycerol-DMPC interactions are weakly endothermic, and the temperature of the main phase transition increases slightly (0.16°C per molal) with the glycerol concentration. The results are discussed with respect to a molecular picture which takes into account both the partitioning of glycerol into the membrane and the preferential exclusion from the hydration layer, and it is concluded that the latter effect contributes about four times stronger than the former to the net interaction.
INTRODUCTION
The effects of glycerol on cells and isolated biopolymers have been extensively discussed in a broad forum covering biology, biochemistry, biotechnology, and medicine. A particularly interesting aspect of the biochemistry of glycerol is its accumulation in a variety of organisms in response to environmental stresses such as drought, high salinity, or cold. Hence, glycerol is an important member of the evolutionary conserved group of solute species—so-called compatible solutes—which regulate the solution microenvironment to support enzyme function under harsh conditions (Hochachka and Somero, 1984; Yancey et al., 1982). At severe stress levels, such as (partially) frozen or profoundly dehydrated states, where metabolism is strongly reduced (Storey and Storey, 1988) glycerol serves as a protectant, which is thought to stabilize native configurations in the macromolecules and thus enhance survival upon the return to normal conditions (compare to Anchordoguy et al., 1987; Carpenter et al., 1990). Some in vivo examples of pronounced glycerol synthesis include overwintering insects (Lee, 1991; Ramløv, 2000) and salt-stressed algae and yeasts (Hochachka and Somero, 1984; Andreishcheva and Zvyagilskaya, 1999). The protective and regulatory properties of glycerol also make it an interesting compound in biotechnology, where it is used both in vitro (e.g., at lyophilization and low temperature preservation protocols) and in vivo (Restrepo and Balish, 2000; Wagner, 1999).
The main effect of glycerol as a compatible solute is the retention of liquid water brought about by its colligative effect on the aqueous bulk. However, understanding of the particular compatibility of glycerol and related compounds requires detailed insight into their interactions with biopolymers. Such knowledge will not only elucidate stress adaptation on the molecular level, but also pave the way for a rational application in the formulation of biotechnological products. One access to information of this type is the thermodynamic characterization of the interaction, and this approach has already been extensively utilized for model systems comprising soluble proteins. Indeed, the thermodynamic interpretation of protein-compatible solute (or protectant) relationships forms the basis for the current understanding of the underlying mechanisms (Somero and Yancey, 1997; Timasheff, 1998; Courtenay et al., 2000). More specifically, it has been shown that the affinity of the protein surface for water is higher than that for glycerol, and hence that the solvent adjacent to the protein is enriched in water (or depleted for glycerol) compared to the bulk. This condition of so-called preferential hydration (or preferential exclusion of glycerol) has been demonstrated for several compatible solutes and protectants, and the extent of the preferential interaction is considered a key parameter for understanding their effects.
Despite the success within compatible solute-protein studies, preferential interactions parameters have not been directly measured for lipid membrane systems. However, the approach has been discussed (Epan and Bryszewska, 1988; Wolfe and Bryant, 1999), and may be of particular relevance in discussions of stabilizing mechanisms in severely stressed cells. Thus, the cellular membrane is thought to be the most susceptible site of damage during exposure to freezing or dehydration, and several mechanisms of membrane injury, including leakage, fusion, and phase separations, has been put forward (Anchordoguy et al., 1987; Crowe et al., 1990). In some cases, naturally occurring protectants such as glycerol have been shown to counteract such changes in model systems of phospholipid membranes (Anchordoguy et al., 1987; Crowe et al., 1990; Loomis, 1991), and Crowe, Crowe, and co-workers (Crowe and Crowe, 1991; Crowe et al., 1993) have suggested that the effects of polyhydroxy compounds may be directly related to a preferential hydration of the membrane–solvent interface.
To address this experimentally we have utilized a recently developed vapor pressure instrument (Andersen et al., 2002), along with more established calorimetric techniques, to the study of preferential interactions of glycerol and unilamellar vesicles of dimyristoyl phosphatidylcholine (DMPC). The former equipment is capable of resolving lipid-induced changes well below 0.01% of the total vapor pressure, and thus to quantify preferential interactions with satisfactory precision. The results show that in glycerol solutions of a few mol (kg water)−1, DMPC membranes are indeed preferentially hydrated, and that the extent of the preferential hydration, when normalized with respect to the solvent accessible surface area, is about twice that typically observed for globular proteins. Moreover, the glycerol–DMPC interaction is weakly endothermic. Together with available structural data, these observations can be rationalized with respect to a molecular picture, which combines the preferential interactions at the membrane–solvent interface and partitioning of glycerol into the membrane.
METHODS AND MATERIALS
Dry DMPC >99% was purchased from Avanti Polar Lipids (Alabaster, AL). The lipid was hydrated in distilled water, and extruded to unilamellar vesicles through two stacked nucleopore filters (100-nm pore size) using Lipex equipment (Northern Lipids, Vancouver, BC; see Hope et al., 1985).
The concentration of the extruded vesicle suspension (5–6% w/w) was determined gravimetrically. To minimize errors from evaporative loss during the weighing procedure, the mass of 60 μl aliquots was recorded over a 2-min time span, and the (linear) mass versus time course extrapolated to the time of sample application. The SD on parallel determinations was 0.05% w/w. Glycerol (>99.5%) was purchased from Merck (Darmstadt, Germany).
Vapor pressure measurements
The net (free energy) effect of glycerol-DMPC interactions was measured in homemade vapor-pressure equipment, which has recently been described in detail (Andersen et al., 2002). In this setup, the vapor pressure difference between a cell and a reference is determined with high resolution (0.5 μbar at best). The principle of the current measurements is to quantify the pressure difference, ΔP, in a situation where the glycerol concentration (in moles per kg water) is exactly the same in cell and reference, whereas DMPC vesicles are present only in the cell. Since water is the only compound with a detectable vapor pressure, ΔP will reflect the effect of the vesicles on the chemical potential of water (the difference in chemical potential of water arising from the presence of the vesicles is RT ln[(Pref + ΔP)/Pref], where Pref is the vapor pressure of the reference, and R and T are respectively the gas constant and the absolute temperature). The significance of ΔP may be explained in terms of the osmotic pressure of the bulk solution. Thus, addition of DMPC may change the osmotic pressure of the bulk remote from the vesicles in one of two ways. If glycerol accumulates preferentially near the vesicles, then the osmotic pressure in the bulk solution falls. In this case, the bulk solution in the DMPC suspension will have an osmotic pressure lower (or a water vapor pressure higher) than that of the equilibrated reference without DMPC. If glycerol is preferentially excluded, as reported here, then the bulk solution has a higher osmotic pressure (i.e., lower vapor pressure) than does the reference solution.
Solutions for the cell (DMPC–glycerol–water) and reference (glycerol–water) were prepared gravimetrically and ≈4-ml weighed aliquots were transferred to the vapor pressure equipment so that the amounts of glycerol and water in the cell and reference were approximately equal. The cell and reference were hermetically sealed and after removal of atmospheric air by repeated exposures to a previously evacuated 0.5-L flask (Andersen et al., 2002) and adjustment of the water content to yield equal glycerol:water mole ratios, ΔP and Pref were recorded until a constant (equilibrium) value was obtained. Details of the relevant procedures are described elsewhere (Andersen et al., 2002).
To evaluate preferential interactions as a function of the glycerol concentration, ΔP and Pref were measured after sequential removals of controlled amounts of water vapor from the cell and reference. The gas phase (P, V, T) quantification of the removed water was precise to within 0.05%, and thus allowed to keep a strict balance of the cell and reference composition. The three experimental trials involved respectively seven, eleven, and nine such removals, which totaled 70% of the water originally loaded. For all trials, the initial DMPC concentration was ∼70 mmol DMPC (kg water)−1 although the initial glycerol concentration ranged from 0.22 to 1.18 mol glycerol (kg water)−1. The DMPC concentration at the end of the trials was 2−300 mmol (kg water)−1, which translates into 180–280 water molecules per lipid (i.e., much more than the 20–30 water molecules required for the hydration of DMPC). The data allowed calculation of preferential interaction data (see below) in the 0.3–3 mol glycerol (kg water)−1 concentration range. The experimental reproducibility was found to be ±4 μbar, and the temperature was 30°C.
To investigate the temperature dependence of glycerol-DMPC interactions, and elucidate possible effects of the gel-to-fluid phase transition at 24°C, ΔP, and Pref were recorded as a function of temperature for some samples (about every third). Hence, after the pressure measurement at 30°C, the sample was taken through heating and/or cooling scans at 1°C/h during continuous monitoring of ΔP and Pref.
Calorimetry
The transfer enthalpy of DMPC vesicles from water to water–glycerol mixtures was measured by a four-step procedure (Westh and Koga, 1997), which has recently been adapted to vesicle systems (Trandum et al., 1999, 2000). Data at 30°C and 40°C were retrieved with a MSC-ITC calorimeter (Microcal, Amherst, MA).
The effect of glycerol on the main transition temperature of unilamellar vesicles was measured in an MC2 differential scanning calorimeter (Microcal). Samples of DMPC vesicles (5 mmol (kg water)−1) in glycerol solutions ranging from 0 to 2.5 mol (kg water)−1 were prepared volumetrically from a freshly extruded vesicle suspension (80 mmol (kg water)−1) and a 30% w/w glycerol stock solution. The glycerol–DMPC–water mixtures were equilibrated for 24 h and then analyzed in the scanning calorimeter (heating from 10 to 40°C at 60°C/h).
RESULTS AND DATA TREATMENT
In the following we will use the well-established notation where subscript 1 denotes the primary solvent (water), 2 is the biomolecule (DMPC), and 3 the cosolvent (glycerol).
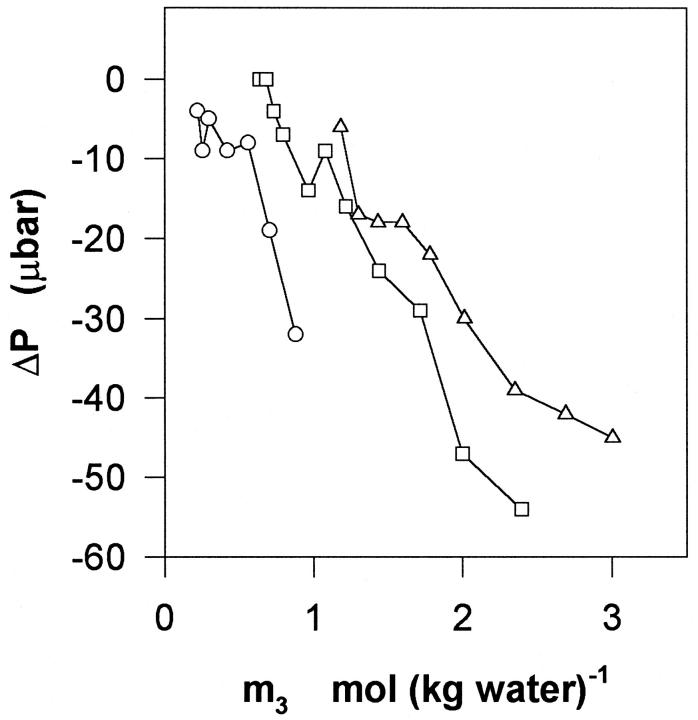
Raw data from the vapor pressure measurements showing the cell-reference pressure difference, ΔP, as a function of the glycerol concentration, m3, in moles (kg water)−1, is illustrated in Fig. 1. It appears that ΔP attains small negative values under the investigated conditions. This implies that the presence of DMPC vesicles in the cell acts to decrease the chemical potential of water, or, in the language used for protein–cosolvent interactions, that DMPC is preferentially hydrated in mixed glycerol–water solvents. Due to parallel variations in m2 and m3, dictated by the experimental procedure, different data points in Fig. 1 are not immediately comparable. To get the data on a common footing, it was interpreted along the lines of the theory of preferential binding (Casassa and Eisenberg, 1968; Timasheff, 1998; Courtenay et al., 2000). Inasmuch as in this work we monitor the chemical potential of water, the so-called isoosmotic preferential binding parameter Γμ1
 |
(1) |
can be readily used. In Eq. 1, m denotes molal concentrations and T, P, and μ are respectively temperature, pressure, and chemical potential. A comprehensive discussion of the isoosmotic preferential binding parameter and its relation to the general thermodynamic concepts of preferential interactions has recently been published (Zhang et al., 1996; Courtenay et al., 2000; Anderson et al., 2002). Here, we only emphasize that Γμ1 signifies the (positive or negative) number of glycerol (3) molecules needed to reestablish the chemical potential of water upon the addition of one DMPC (2) molecule. Thus, positive values of Γμ1 indicate that the affinity of the membrane for glycerol is higher than for water and vice versa. To numerically evaluate the derivative in Eq. 1, the data in Fig. 1 has to be combined with the measurement of the vapor pressure of the reference, Pref. Since the cell-reference pressure difference is ΔP, and the slope dPref/dm3 is known, the change in glycerol concentration Δm3 required to balance out (small values of) ΔP (i.e., to bring the chemical potential of water in the cell to the level of the reference) is
 |
(2) |
If it is assumed that the cell-reference difference in DMPC concentration is small, the derivative in Eq. 1 can be replaced with the ratio of concentration changes and combined with Eq. 2.
 |
(3) |
FIGURE 1.
Raw data from the vapor pressure measurements. The graph shows the cell-reference pressure difference, ΔP, as a function of the concentration of glycerol in moles (kg water)−1. Negative values of ΔP show that the presence of DMPC vesicles in the cell reduces the chemical potential of water. The glycerol:DMPC mole ratio for the three trials was respectively 2.79 (circles), 9.08 (squares), and 16.28 (triangles). The experimental reproducibility was ±4 μbar.
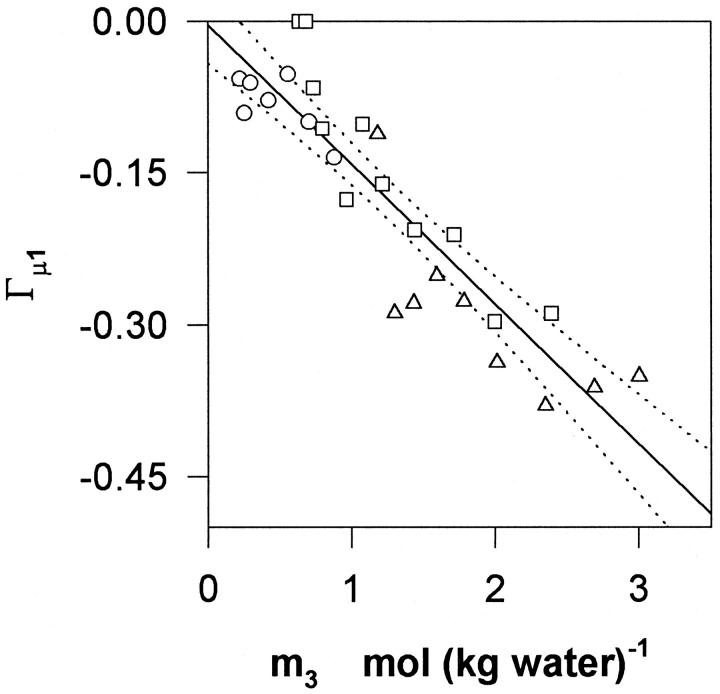
As it will appear below, the validity of this assumption was confirmed inasmuch as for a given glycerol concentration, Γμ1 shows no systematic dependence on m2. Fig. 2 shows Γμ1, calculated according to Eq. 3, and plotted as a function of the glycerol concentration, m3. It appears that Γμ1 decreases approximately linearly with m3 with a slope of −0.14 ± 0.014 per molal. Hence, introduction of DMPC vesicles into a glycerol solution brings about a reduction in the water vapor pressure, which can be balanced out by the removal of (0.14 × m3) moles glycerol per mole DMPC added. This provides a measure of the free energy of glycerol–DMPC interactions, and to put this into more conventional units we used the relationship (Schellman, 1993; Poklar et al., 1996):
 |
(4) |
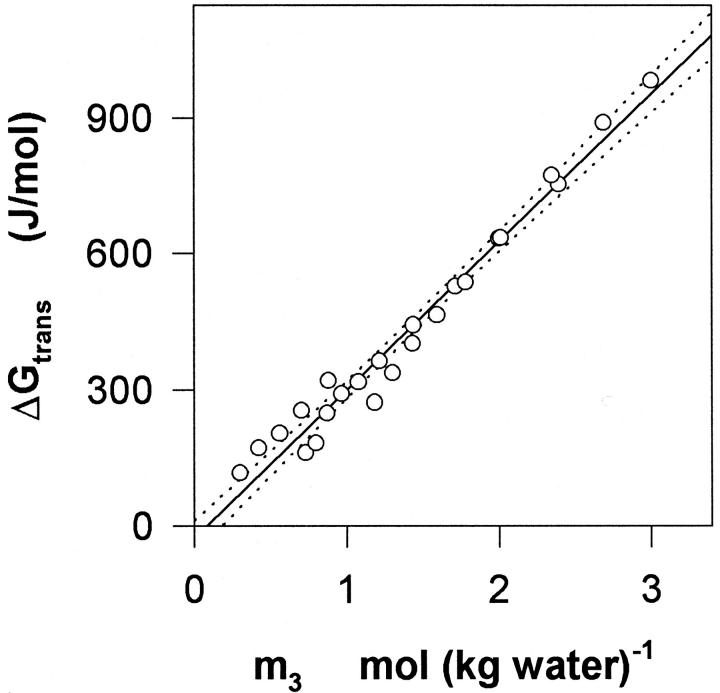
where ΔGtrans is the change in free energy upon transfer of DMPC vesicles from water to aqueous glycerol, A is the activity and Γμ3 is the preferential binding parameter at constant temperature, pressure, and chemical potential of glycerol. The measured values of Γμ1 were converted into Γμ3 as described by Courtenay et al. (2000), and it was found that the numerical difference between the two parameters was small (Γμ3 was 1–3% smaller). This similarity has been noted before (Schellman, 1993), and relationships between the preferential binding parameters has recently been discussed in detail (Anderson et al., 2002). Hence, Γμ1-values from Fig. 2 were directly introduced in Eq. 4 instead of Γμ3. The activities required in Eq. 4 were calculated using our recent data on binary aqueous glycerol (To et al., 1999). The transfer free energy, ΔGtrans, was estimated by numerical integration of Eq. 4, and plotted as a function of m3 in Fig. 3. This derivation of ΔGtrans is based on the general theory of preferential interactions. However, for the current system the same parameter can be estimated by an alternative, somewhat simpler approach briefly discussed in the Appendix.
FIGURE 2.
The isoosmotic preferential binding parameter, Γμ1, calculated according to Eq. 3 from the data in Fig. 1, and plotted as a function of the glycerol concentration, m3. The solid curve indicates the best linear fit and dotted lines specify the 95% confidence interval.
FIGURE 3.
The free energy change, ΔGtrans, at 30°C for the transfer of unilamellar DMPC vesicles from water to aqueous glycerol in the 0–3 mol (kg water)−1 range. Best linear fit and 95% confidence are illustrated as in Fig. 2.
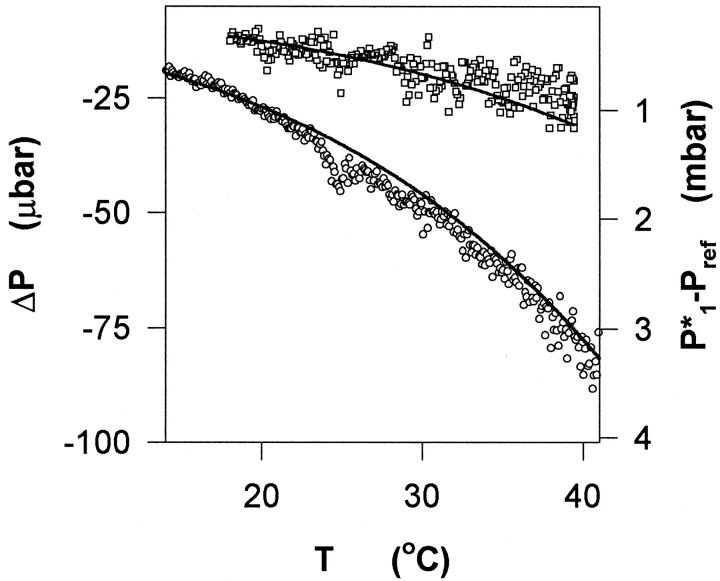
The temperature dependence of ΔP for two samples is shown in Fig. 4 (open symbols, left ordinate). This figure also includes (solid lines, right ordinate) the vapor pressure lowering (compared to pure water) of the reference (P1* − Pref, where P1* is the vapor pressure of pure water). It appears that the two functions (ΔP and P1* − Pref) are practically superimposed, or in other words, that during temperature scans, ΔP is proportional to the vapor pressure lowering in the reference.
FIGURE 4.
Vapor pressure measurements showing the cell-reference pressure difference, ΔP (left ordinate), as a function of temperature. The two trials represent different compositions. For the lower dataset (circles) the concentrations of respectively glycerol and DMPC were 2.393 and 0.263 mol (kg water)−1, whereas for the upper curve (squares) the concentrations were 0.880 and 0.315 mol (kg water)−1. Also shown in the figure is the vapor pressure lowering of the reference, P1*−Pref (solid line, right ordinate). The accordance between the two sets of functions shows that the effect of the lipid, ΔP, is proportional to the vapor pressure lowering, and hence, as discussed in the text, that the net glycerol–DMPC interaction is fairly insensitive to temperature changes.
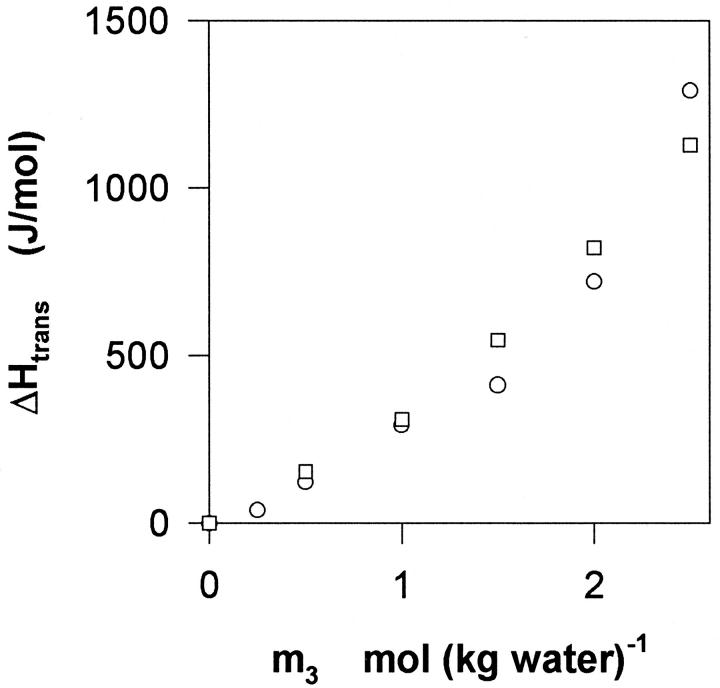
Thermochemical effects of DMPC–glycerol interactions are further illustrated in Fig. 5. It appears that the transfer of vesicles is endothermic (ΔHtrans < 0). This implies that membrane–glycerol interactions are enthalpically less favorable (i.e., higher energy) than water–DMPC interactions. Moreover, the interaction becomes progressively more endothermic as the glycerol content increases as signified by the positive curvature. The data in Fig. 5 does not identify any temperature dependence of ΔHtrans, suggesting that the interaction does not bring about large changes in the heat capacity of the system.
FIGURE 5.
The enthalpy change, ΔHtrans, for the transfer of unilamellar DMPC vesicles from water to aqueous glycerol, as a function of the glycerol concentration, m3. The experimental temperatures were 30°C (circles) and 40°C (squares). The experimental uncertainty is ∼10%.
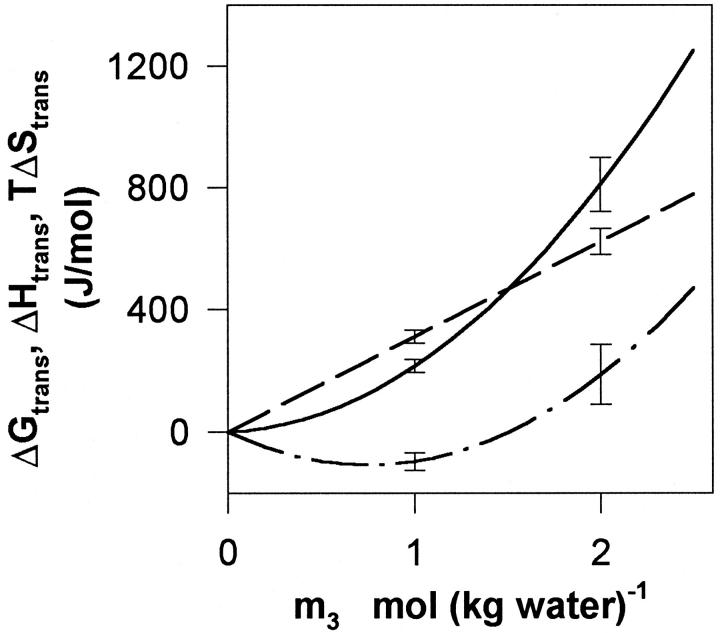
The entropic contribution to the transfer process, TΔStrans = ΔHtrans − ΔGtrans was calculated and illustrated, together with smooth curves of ΔGtrans and ΔHtrans in Fig. 6. This figure, which provides an overview of the thermodynamics of DMPC–glycerol interactions at 30°C, shows that the unfavorable free energy of transfer is dominated by the enthalpic contribution.
FIGURE 6.
Summary of the thermodynamics of DMPC–glycerol interactions showing the transfer functions ΔGtrans (dashed line), ΔHtrans (solid line), and TΔStrans (dot-and-dash line), as a function of the glycerol concentration, m3.
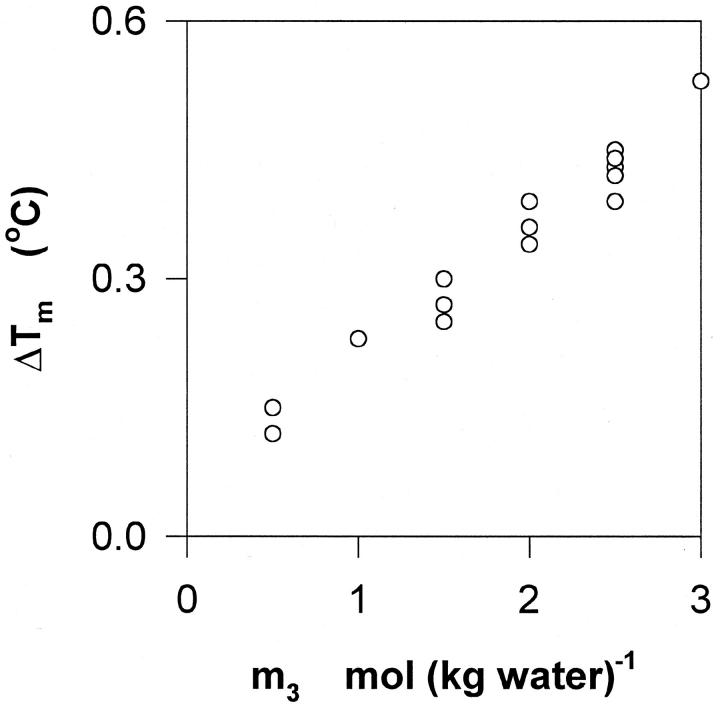
The effect of glycerol on the gel–fluid–phase transition temperature of unilamellar DMPC vesicles, Tm, is illustrated in Fig. 7. It appears that Tm increases with the glycerol concentration at a rate of ∼0.16°C/(mol (kg water)−1).
FIGURE 7.
Effect of glycerol on the main transition temperature of glycerol. The graph illustrates the increase in transition temperature, ΔTm, detected by scanning calorimetry as a function of the glycerol concentration, m3.
DISCUSSION
Thermodynamics
The free energy change, ΔGtrans, of transferring fluid-phase DMPC liposomes from water to aqueous glycerol is moderately positive and proportional to the glycerol concentration. Thus, there is no sign of binding, specific or nonspecific, of glycerol to this type of membrane. The analogous enthalpy transfer parameter, ΔHtrans, is also positive over the investigated composition range, but shows an upward curvature. This endothermic nature of glycerol–DMPC interaction parallels that found for both the interaction of glycerol with a protein (Westh and Koga, 1997), and that of DMPC with other small alcohols (Trandum et al., 1999; 2000). However, the magnitude of the interaction enthalpy, specified by the slope of the curves in Fig. 5, is much smaller for the current system. The transfer entropy, illustrated as TΔStrans in Fig. 6, is numerically very small at the lower glycerol concentrations and becomes positive at higher m3.
Glycerol–DMPC interactions are only weakly dependent on temperature. This appears, for example, from the small values of ΔStrans, which suggest that the net effect of the interaction is insensitive to temperature changes (dΔGtrans/dT = −ΔStrans ≈ 0). This is further supported by the observation (Fig. 4) that ΔP is practically proportional to the vapor pressure lowering P1* − Pref over the 10–40°C temperature range. Since P1* − Pref ≈ m3dPref/dm3 the proportionality of the two functions in Fig. 4 suggests that dPref/dm3 (and hence Γμ1; compare to Eq. 3) is temperature-independent. This is in strong contrast to the pronounced T-dependence observed for monohydric alcohols of the same size (Trandum et al., 1999; 2000).
Fig. 4 also shows that the change in Γμ1 at the gel-to-fluid phase transition is below the level of detection in the vapor pressure measurements (extrapolated curves from before and after the transition merge). A more sensitive test of the changes in preferential interaction around the phase transition is provided by the data in Fig. 7. Here it appears that the phase transition temperature, Tm, increases slightly with the glycerol concentration. An analogous, but stronger effect of glycerol has previously been observed for membranes of phosphatidylethanolamines (Sanderson et al., 1991; Williams et al., 1991; Koynova et al., 1997). Also, sugars and polyhydroxy alcohols other than glycerol, have been shown to bring about a pronounced increase in Tm for various phospholipid membranes (Koynova and Caffrey, 1998; Crowe and Crowe, 1991). The increase in Tm is consistent with negative values of Γμ1 (Fig. 2) inasmuch as preferentially excluded cosolvents tend to favor configurations with smaller surface area (e.g., see Crowe et al., 1993; Cevc, 1988); the lateral surface area of DPPC membranes increases by about a third upon the gel-to-fluid phase transition (Nagle and Tristram-Nagle, 2000).
Molecular picture of DMPC–glycerol interactions
The interaction of small organic compounds with lipid membranes is traditionally discussed on the basis of a model, which partitions the organic compound into two distinct states. One part is dissolved in the membrane whereas the rest is in aqueous solution in the bulk. This partitioning model is linked to macroscopic properties through the equilibrium (or partitioning) constant Kp = memm3 / bulkm3, where memm and bulkm specify respectively local concentrations in the membrane and aqueous bulk. If the two solutions are considered ideal, the concomitant standard free energy change for the water-membrane transfer of the solute is ΔG° = −RTlnKp. For small values of Kp, this interpretation becomes questionable (Schellman, 1990, 1993; Westh and Trandum, 1999; Westh et al., 2001), and this limitation is readily illustrated by the present measurements. Thus, if the lipid takes up any glycerol, ΔP should increase in response to the concomitant decrease in bulkm3. If no glycerol partitioned (Kp = 0) the partitioning picture would predict ΔP = 0, but the negative ΔP values (as those observed here) cannot be accounted for. The fact that glycerol readily permeates membranes (Efimov and Sharonov, 1985; Mitragotri et al., 1999) demonstrates its presence there, and precise isotope-label methods have quantified Kp for DMPC bilayers to be 0.06 (in molal units) at 30°C (Katz and Diamond, 1974). From this value, the number of membrane partitioned glycerol molecules, memn3, can be determined as (Westh et al., 2001):
 |
(5) |
where w is the lipid-to-water-mass ratio of the sample and totn3 is the total number of moles of glycerol. Insertion in Eq. 5 suggests that 0.2–1% of the glycerol (depending on the lipid concentration) will be membrane-partitioned in the samples investigated here. Removal of this amount of glycerol from the aqueous phase translates into a positive contribution to ΔP in the 1–15 μbar range, or a constant (positive) contribution to Γμ1 of 0.040 per molal glycerol. This prediction is obviously in contrast to the observed slope of −0.14 ± 0.014 kg water (mol)−1 in Fig. 2. However, the discrepancy does not necessarily imply that the determination of either ΔP or Kp is flawed. It merely stresses that the picture of the partitioning model is too crude to rationalize the free energy of membrane–glycerol interactions.
A more general approach to the interpretation of biopolymer interactions in mixed solvents is provided by the so-called local-bulk domain model (Record et al., 1998). In analogy with the partitioning model, the idea is to illustrate biopolymer–solvent interactions in terms of local variations in concentrations. Unlike the partitioning model, however, the latter is rigorously connected to the general thermodynamic theory of preferential interactions. The local-bulk domain model is devised for protein solutions, and inasmuch as the protein molecule is impenetrable to the solvent, it is intuitive to define the local domain as the hydration layer. For membrane systems, on the other hand, the definition of a local domain is somewhat more ambiguous inasmuch as changes in bulkm3 can be brought about by (at least) two mechanisms: i) the partitioning of glycerol (and water) into the membrane and ii) redistribution of the solvent constituents adjacent to the membrane surface. In the light of this, we suggest a modified model where the local domain consists of two zones, respectively lipid membrane and hydration layer, with distinct glycerol contents. This approach allows reconciliation of the shortcomings of the partitioning model discussed above, inasmuch as the amount of glycerol lost from the bulk can be counterweighted by its preferential exclusion from the membrane-solvent interface. Moreover, the approach is experimentally accessible inasmuch as the glycerol concentration of the two local zones can be derived through the combination of the data in Fig. 2 (elucidating differences between the bulk and the average of the two local zones), and memm3 (Eq. 5) giving the glycerol content of the membrane. Thus, the measured isoosmotic binding parameter is Γμ1/m3 = −0.14 kg water (mol)−1, and process i contributes +0.04 kg water (mol)−1. It follows that the preferential exclusion of glycerol in the hydration layer (ii) is Γμ1(ii)/m3 = −0.18 kg water (mol)−1. These numbers illustrate the important conclusion that the thermodynamics of glycerol–DMPC interactions are dominated by interfacial effects (ii), whereas glycerol partitioning (i) is less important.
A key relationship derived from the local-bulk domain model is (Record et al., 1998),
 |
(6) |
where B1 and B3 denote respectively the number of water and glycerol molecules, in the local domain. Γμ1,μ3 is the preferential binding parameter measured by dialysis experiments, where both 1 and 3 are equilibrated over the membrane. Analogously to the treatment of Eq. 4 we find, based on the thermodynamic relationships of Courtenay et al. (2000), that this quantity is practically identical to Γμ1 under the conditions investigated here. Numerical utilization of Eq. 6 requires additional information. This could be an estimate of the amount, B1, of water involved in full hydration of DMPC, but a structurally more meaningful definition of a local domain comes from recent studies showing that at 30°C, seven to eight water molecules per lipid intercalate into the polar region of the fluctuating membrane interface (Balgavy et al., 2001; Nagle and Tristram-Nagle, 2000). If, based on this, we accept B1 = 7–8, Eq. 6 shows that B3 ≅ 0. This implies that the preferential interaction of glycerol and DMPC corresponds to a full exclusion of the cosolvent from water-filled defects in the polar region of DMPC membranes.
As discussed above preferential exclusion of glycerol has previously been observed for globular proteins, and it would be interesting to compare these data with the current measurements. To do so, Γμ1/m3 must be normalized with respect to the size of the biopolymer, for example by introducing the biopolymer-solvent interfacial area. For DMPC the lateral projected area is 59.6 Å2/molecule at 30°C (Balgavy et al., 2001), but the surface area accessible to the solvent is larger due to fluctuations and the protruding choline phosphate moiety. To estimate the solvent accessible surface area (ASA) we have recently applied the algorithm of Lee and Richards (1971) to simulated phospholipid membranes. For DPPC, we found an average ASA of 135 ± 15 Å2/molecule (at 52°C) equivalent to 2.2 times the projected area (Tuchsen et al., in preparation). If the same factor is valid for DMPC the ASA will be ∼131 Å2, and the normalized preferential exclusion of glycerol becomes 1.1 × 10⁻³ kg water (mol)−1Å−2. This normalized extent of preferential exclusion is two to three times that found for globular proteins. These latter values ranged from 2.9 × 10⁻⁴ Å−2 (kg water) mol−1 for β-lactoglobulin, lysozyme, and RNaseA to 5.3 × 10⁻⁴ Å−2 (kg water) mol−1for chymotrypsinogen A (Courtenay et al., 2000).
Implications for biological membranes
A primary mechanism underlying the regulatory and protective functions of glycerol in vivo is its colligative effect on the aqueous bulk. Nevertheless, elucidation of glycerol–biopolymer interactions is imperative for the understanding of the exceptional lack of cellular perturbation caused by this solute, even at molar concentrations (Hochachka and Somero, 1984). For enzyme function, this noneffect has been directly related to the preferential exclusion of glycerol (Somero and Yancey, 1997), and the current results show that a comparable exclusion is observed for a phospholipid membrane. Moreover, the absence of conspicuous differences in the ASA-normalized preferential exclusion may suggest that glycerol will be rather uniformly distributed over lipid and protein domains of a biological membrane.
In addition to colligative effects, some reports have suggested stabilization by glycerol in severely stressed systems originating from its specific interaction with membranes (e.g., see Anchordoguy et al., 1987; Loomis, 1991; Ramløv, 2000), and this may also be related to the preferential interaction. Thus, Crowe, Crowe, and co-workers have proposed that the preferential exclusion from the membrane–solvent interface is a key factor underlying effects of polyhydroxy compounds on membranes (Crowe and Crowe, 1991; Crowe et al., 1993). The observation of preferential exclusion for a natural protectant calls for further elucidation of this mechanism for protective effects in vivo.
Closing remarks
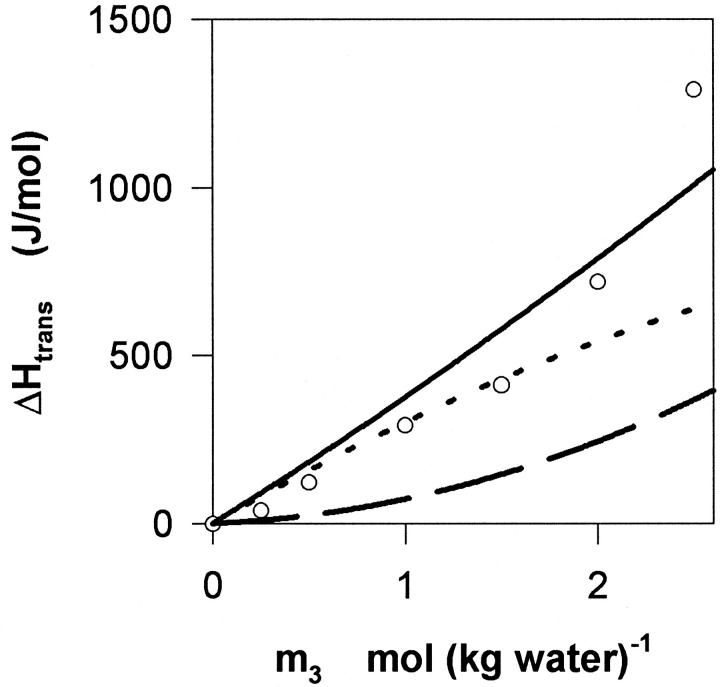
Based on the current preferential interaction data and previously published structural information (Katz and Diamond, 1974; Balgavy et al., 2001) we suggest a simplified view in which glycerol–DMPC interactions are governed by two effects: membrane partitioning of glycerol and preferential exclusion of the solute from the membrane interface. These effects (denoted respectively i and ii) contribute to the net interaction with opposite signs, and their relative strength is ∼1:4 (ii being the stronger). This picture may be further investigated by considering the thermochemical data (this approach is generally more sensitive due to the pronounced enthalpy–entropy compensation, which is common to aqueous systems, and tends to make free energy measurements less conspicuous). Fig. 8 illustrates such an analysis where the experimental ΔHtrans data (from Fig. 5) are compared with estimates of the enthalpic contribution of i (ΔHtrans(i), dotted line) and ii (ΔHtrans(ii), dashed line) as well as the sum of the two (solid line). The calculated values are based on the local changes in the solvent composition discussed above (Eqs. 5 and 6), and the heat of mixing of binary aqueous glycerol (To et al., 1999). This approach neglects the energetic contribution of direct glycerol–DMPC contacts, which is tantamount to the assumption that the membrane partitioned glycerol, memn3, has the same enthalpy as in the pure organic liquid. An analogous assumption has proven acceptable for several other small alcohols partitioned into DMPC membranes (Trandum et al., 1999; 2000). The reasonable coincidence of the calculated and measured values in Fig. 8 supports the suggested picture, and it is in accord with the absence of strong enthalpic effects of DMPC–glycerol contacts. In the light of this we suggest that dominant driving forces for processes i and ii are respectively the mixing entropy of dissolving glycerol in the membrane, and the steric exclusion of glycerol from packing defects in the fluctuating membrane interface.
FIGURE 8.
Thermochemistry of the transfer of DMPC vesicles from water to aqueous glycerol. The circles show experimental results at 30°C. The dotted line indicate the enthalpy contribution arising from the partitioning of glycerol into the membrane (ΔHtrans(i)), defined in the main text) and the dashed line quantifies effects due to preferential interactions at the membrane-solvent interface (ΔHtrans(ii)). The solid line indicates the sum ΔHtrans(i) + (ΔHtrans(ii)). The figure suggests that enthalpic effects due to local changes in composition described in the discussion accounts rather well for the measured heat of transfer. Also it appears that process i dominates the measured ΔHtrans and low concentrations, inasmuch as ii becomes increasingly important with increasing m3.
Acknowledgments
The author thanks Dr. Christa Trandum for helpful discussion.
The work was supported by the Carlsberg Foundation, the Novo-Nordisk Foundation, and the Danish National Research Foundation, through the establishment of the MEMPHYS Center for Biomembrane Physics.
APPENDIX
The main discussion is based on a general thermodynamic approach for ternary systems. This allows comparisons to literature concerned with protein interactions; in particular, the local-bulk domain model. It may be argued, however, that the present system consists of two dispersed phases (respectively water + glycerol and lipid + glycerol + water). This interpretation, which is supported by the observation (∂μ1/∂m1)m3 ≈ 0 in water-rich suspensions of DMPC (Andersen et al., 2002), allows a simpler access to the ΔGtrans. Thus, at equilibrium the perturbation induced by the lipid can be balanced out by a concentration change in the aqueous phase, Δm3, specified in Eq. 2. The concomitant change in free energy can be derived from the standard relationship G = ∑miμi, and after normalization with respect to the amount of lipid, m2, ΔGtrans can be approximated
 |
(A1) |
In Eq. A1, the activity coefficients at respectively m3 and m3 + Δm3 are assumed to be equal, and the amount of lipid transferred is accepted to be small enough to neglect the dependence of ΔGtrans on m2. Values of ΔGtrans calculated according to Eq. A1 were in accordance with those of Eq. 4, plotted in Fig. 3. However, the scatter of this approach (Eq. A1) is much larger due to the absence of the smoothening provided by the integration process in Eq. 4.
References
- Anchordoguy, T. J., A. S. Rudolph, J. F. Carpenter, and J. H. Crowe. 1987. Modes of interaction of cryoprotectant and phospholipids during freezing. Cryobiology. 24:324–331. [DOI] [PubMed] [Google Scholar]
- Andersen, K. B., Y. Koga, and P. Westh. 2002. A high sensitivity vapor pressure equipment for investigations of biopolymer interactions. J. Biochem. Biophys. Meth. 50:269–288. [DOI] [PubMed] [Google Scholar]
- Anderson, C. F., E. S. Courtenay, and M. T. Record, Jr. 2002. Thermodynamic expressions relating different types of interaction coefficients in solution containing two solute components. J. Phys. Chem. B. 106:418–433. [Google Scholar]
- Andreishcheva, E. N., and R. A. Zvyagilskaya. 1999. Adaptations of yeasts to salt stress. Appl. Biochem. Microbiol. 35:217–228. [Google Scholar]
- Balgavy, P., M. Dubnickova, N. Kucerka, M. A. Kiselev, S. P. Yaradaikin, and D. Uhrikova. 2001. Bilayer thickness and lipid interface area in unilamellar extruded 1,2–diacylphosphatidylcholine liposomes: a small angle neutron scattering study. Biochim. Biophys. Acta. 1512:40–52. [DOI] [PubMed] [Google Scholar]
- Carpenter, J. F., J. H. Crowe, and T. Arakawa. 1990. Comparison of solute-induced protein stabilization in aqueous solution and in frozen and dry states. J. Dairy Sci. 73:3627–3636. [Google Scholar]
- Casassa, E. F., and H. Eisenberg. 1968. Thermodynamic analysis of multicomponent solutions. Adv. Prot. Chem. 19:287–395. [DOI] [PubMed] [Google Scholar]
- Cevc, G. 1988. Effect of lipid head groups and (nonelectrolyte) solution on the structural and phase properties of bilayer membranes. Ber. Bunsenges. Phys. Chem. 92:953–961. [Google Scholar]
- Courtenay, E. S., M. W. Capp, C. F. Anderson, and M. T. Record, Jr. 2000. Vapor pressure osmometry studies of osmolyte-protein interactions: Implications for the action of osmoprotectants in vivo and the interpretation of “osmotic stress” experiments in vitro. Biochemistry. 39:4455–4471. [DOI] [PubMed] [Google Scholar]
- Crowe, J. H., J. F. Carpenter, L. M. Crowe, and T. J. Anchordoguy. 1990. Are freezing and dehydration similar stress vectors? A comparison of modes of interaction of stabilizing solutes with biomolecules. Cryobiology. 27:219–231. [Google Scholar]
- Crowe, L. M., and J. H. Crowe. 1991. Solution effects on the thermotropic phase transition of unilamellar liposomes. Biochim. Biophys. Acta. 1064:267–274. [DOI] [PubMed] [Google Scholar]
- Crowe, L. M., C. A. Wistrom, and J. H. Crowe. 1993. Does the preferential exclusion hypothesis apply to hydrated phospholipid bilayers? Cryobioliogy. 30:224–225. [Google Scholar]
- Efimov, V. B., and B. P. Sharonov. 1985. Permeability of Escherichia coli cellular membrane for thiourea, dimethylsulfoxide and glycerol. Biofizika. 30:446–449. [PubMed] [Google Scholar]
- Epan, R. E., and M. Bryszewska. 1988. Modulation of the bilayer to hexagonal phase transition and solvation of phosphatidylethanolamines in aqueous salt solutions. Biochemistry. 27:8776–8779. [DOI] [PubMed] [Google Scholar]
- Hochachka, P. W., and G. N. Somero. 1984. Biochemical Adaptation. Princeton University Press, Princeton, New Jersey. 304–355.
- Hope, M. J., M. B. Bally, G. Webb, and P. R. Cullis. 1985. Production of large unilamellar vesicles by a rapid extrusion procedure. Characterization of size distribution, trapped volume, and ability to maintain membrane potential. Biochim. Biophys. Acta. 812:55–65. [DOI] [PubMed] [Google Scholar]
- Katz, Y., and J. M. Diamond. 1974. Thermodynamic constants for nonelectrolyte partitioning between dimyristoyl lecithin and water. J. Membr. Biol. 17:101–120. [DOI] [PubMed] [Google Scholar]
- Koynova, R., J. Brankov, and B. Tenchov. 1997. Modulation of lipid phase behavior by kosmotropic and chaotropic solutes. Eur. Biophys. J. 25:261–274. [DOI] [PubMed] [Google Scholar]
- Koynova, R., and M. Caffrey. 1998. Phases and phase transitions of the phosphatidylcholines. Biochim. Biophys. Acta. 1376:91–145. [DOI] [PubMed] [Google Scholar]
- Lee, R. E., Jr. 1991. Principles of insect low-temperature tolerance. In Insects at Low Temperature. R. E. Lee, Jr., and D. L. Denlinger, editors. Chapman and Hall, New York. 17–46.
- Lee, B., and F. M. Richards. 1971. Interpretation of protein structures— estimation of static accessibility. J. Mol. Biol. 55:379–400. [DOI] [PubMed] [Google Scholar]
- Loomis, S. H. 1991. Comparative invertebrate cold hardiness. In Insects at Low Temperature. R. E. Lee, Jr., and D. L. Denlinger, editors. Chapman and Hall, New York. 301– 317.
- Mitragotri, S., M. A. Johnson, D. Blankschtein, and R. Langer. 1999. Analysis of the size selectivity of solute partitioning, diffusion, and permeation across lipid bilayers. Biophys. J. 77:1268–1283. [DOI] [PMC free article] [PubMed] [Google Scholar]
- Nagel, J. F., and S. Tristram-Nagel. 2000. Structure of lipid bilayers. Biochim. Biophys. Acta. 1469:159–195. [DOI] [PMC free article] [PubMed] [Google Scholar]
- Poklar, N., G. Vesnaver, and S. Lapanje. 1996. Interactions of α-chymotrypsinogen A with alkylureas. Biophys. Chem. 57:279–289. [DOI] [PubMed] [Google Scholar]
- Ramløv, H. 2000. Aspects of natural cold tolerance in ectothermic animals. Hum. Reprod. 15:26–46. [DOI] [PubMed] [Google Scholar]
- Record, M. T., Jr., W. Zhang, and C. F. Anderson. 1998. Analysis of effects of salts and uncharged solutes on protein and nucleic acid equilibria and processes: A practical guide to recognizing and interpreting polyelectrolyte effects, Hofmeister effects and osmotic effects of salts. Adv. Prot. Chem. 51:282–355. [DOI] [PubMed] [Google Scholar]
- Restrepo, L., and M. Balish. 2000. Role of glycerol in cerebrovascular disease. Neurologist. 6:338–347. [Google Scholar]
- Sanderson, P. W., L. J. Lis, P. J. Quinn, and W. P. Williams. 1991. The Hofmeister effect in relation to membrane lipid phase stability. Biochim. Biophys. Acta. 1067:43–50. [DOI] [PubMed] [Google Scholar]
- Schellman, J. A. 1990. A simple model for solvation in mixed solvents: applications to the stabilization and destabilization of macromolecular structures. Biophys. Chem. 37:121–140. [DOI] [PubMed] [Google Scholar]
- Schellman, J. A. 1993. The relation between the free energy of interaction and binding. Biophys. Chem. 45:273–279. [Google Scholar]
- Somero, G. N., and P. H. Yancey. 1997. Osmolytes and cell-volume regulation: physiological and evolutionary principles. Section 14. In Handbook of Physiology. J. F. Hoffman, and J. D. Jamieson, editors. 441–484.
- Storey, K. B., and J. M. Storey. 1988. Freeze tolerance in animals. Physiol. Rev. 68:27–84. [DOI] [PubMed] [Google Scholar]
- Timasheff, S. N. 1998. Control of protein stability and reactions by weakly interacting cosolvents: The simplicity of the complicated. Adv. Prot. Chem. 51:356–432. [DOI] [PubMed] [Google Scholar]
- To, E. C. H., J. V. Davies, M. Tucker, P. Westh, C. Trandum, K. S. H. Suh, and Y. Koga. 1999. Excess chemical potentials, excess partial molar enthalpies, entropies, volumes and isobaric thermal expansivities of aqueous glycerol. J. Sol. Chem. 28:1137–1157. [Google Scholar]
- Trandum, C., P. Westh, K. Jørgensen, and O. G. Mouritsen. 1999. A calorimetric investigation of the interaction of short chain alcohols with unilamellar DMPC lipsomes. J. Phys. Chem. B. 103:4751–4756. [Google Scholar]
- Trandum, C., P. Westh, K. Jørgensen, and O. G. Mouritsen. 2000. Thermodynamic Study of the Effects of Cholesterol on the Interaction Between Liposomes and Ethanol. Biophys. J. 78:2486–2492. [DOI] [PMC free article] [PubMed] [Google Scholar]
- Wagner, D. R. 1999. Hyperhydrating with glycerol. J. Am. Diet. Assoc. 99:207–212. [DOI] [PubMed] [Google Scholar]
- Westh, P., and Y. Koga. 1997. Intermolecular interactions of lysozyme and small alcohols: a calorimetric investigation. J. Phys. Chem B. 101:5755–5758. [Google Scholar]
- Westh, P., and C. Trandum. 1999. Thermodynamics of alcohol-lipid bilayer interactions: application of a binding model. Biochim. Biophys. Acta. 1421:261–272. [DOI] [PubMed] [Google Scholar]
- Westh, P., C. Trandum, and Y. Koga. 2001. Binding of small alcohols to a lipid bilayer membrane: does the partitioning coefficient express the net affinity? Biophys. Chem. 89:53–63. [DOI] [PubMed] [Google Scholar]
- Williams, W. P., P. J. Quinn, L. I. Tsonev, and R. D. Koynova. 1991. The effects of glycerol on the phase behavior of hydrated distearoylphophatidylethanolamine and its possible relation to the mode of action of cryoprotectants. Biochim. Biophys. Acta. 1062:123–132. [DOI] [PubMed] [Google Scholar]
- Wolfe, J., and G. Bryant. 1999. Freezing, drying, and/or vitrification of membrane-solute-water systems. Cryobiology. 39:103–129. [DOI] [PubMed] [Google Scholar]
- Yancey, P. H., M. E. Clark, S. C. Hand, R. D. Bowlus, and G. N. Somero. 1982. Living with water stress: Evolution of osmolyte systems. Science. 217:1214–1222. [DOI] [PubMed] [Google Scholar]
- Zhang, W., M. W. Capp, J. P. Bond, C. A. Anderson, and M. T. Record, Jr. 1996. Thermodynamic characterization of interactions of native bovine serum albumin with highly excluded (glycine betaine) and moderately accumulated (urea) solutes by a novel application of vapor pressure osmometry. Biochemistry. 35:10506–10516. [DOI] [PubMed] [Google Scholar]


