

Abstract
α-Helical transmembrane peptides, named WALP, with a hydrophobic sequence of leucine and alanine of varying length bordered at both ends by two tryptophans as membrane anchors, were synthesized to study the effect of hydrophobic matching in lipid bilayers. WALPs of 13-, 16-, and 19-residues were incorporated into 1,2-dilauroyl-sn-glycero-3-phosphocholine (12C), 1,2-tridecanoyl-sn-glycero-3-phosphocholine (13C), and 1,2-dimyristoyl-sn-glycero-3-phosphocholine (14C) bilayers in the form of oriented multilayers. Oriented circular dichroism spectra and x-ray diffraction patterns showed that the peptides were homogenously distributed in the lipid bilayers with the helical axes oriented approximately normal to the plane of bilayers. But in all cases, x-ray diffraction showed that the peptides did not alter the thickness of the bilayer. This is contrary to the case of gramicidin where 1,2-dimyristoyl-sn-glycero-3-phosphocholine and 1,2-dilauroyl-sn-glycero-3-phosphocholine clearly thinned and thickened, respectively, to approach the hydrophobic thickness of the gramicidin channels. The result seems to indicate that the packing of lipid chains around a single helix is fundamentally different from the way the chains pack against a large protein surface.
INTRODUCTION
Hydrophobic matching, in which a transmembrane protein causes the surrounding lipid bilayer to adjust its hydrocarbon thickness to match the hydrophobic surface of the protein, is a commonly accepted idea in membrane biophysics. The stress resulting from the membrane deformation may affect the protein's conformation or influence the protein's conformational changes. The stress may also induce membrane-mediated protein-to-protein interactions. Indeed, it was shown in previous papers (Harroun et al., 1999a,b) that the dimyristoyl phosphatidylcholine (DMPC) bilayer became thinner by 2.6 Å upon inclusion of transmembrane gramicidin channels, whereas a thinner dilauroyl phosphatidylcholine (DLPC) bilayer thickened by 1.3 Å. Concomitantly, the in-plane gramicidin-to-gramicidin correlation length in DMPC was shorter than in DLPC by 3.5 Å, providing a direct proof of membrane-mediated protein-protein interactions.
There are two major classes of transmembrane proteins: single-pass transmembrane proteins and multipass transmembrane proteins (Alberts et al., 1994). With an external diameter ∼20 Å, a gramicidin channel resembles a multipass transmembrane protein (in size) for the effect of hydrophobic matching. In view of the gramicidin result, it is of interest to study the same effect for single-pass transmembrane proteins. Some of us have designed and studied α-helical transmembrane peptides, named WALP, with a hydrophobic sequence of leucine and alanine of varying length, bordered at both ends by two tryptophan membrane anchors (Killian et al., 1996; de Planque et al., 1998; van der Wel et al., 2000). These peptides have proven to be ideal for the study of hydrophobic matching, because we can vary the length of the hydrophobic helix.
We have developed a precise method of measuring the changes of lipid bilayer thickness by x-ray diffraction from oriented multilayers (Olah et al., 1991; Wu et al., 1995). Besides the hydrophobic matching effect by gramicidin mentioned above (Harroun et al., 1999a,b), we have also detected and measured the membrane thinning effect due to peptides embedded in the headgroup region (Wu et al., 1995; Ludtke et al., 1995; Heller et al., 2000; Weiss et al., 2002). To our surprise, none of the WALPs of various lengths seem to alter the thickness of three different lipid bilayers. To ensure that the WALPs were incorporated and homogeneously distributed in the lipid bilayers, we have performed oriented circular dichroism measurement in addition to examining the diffraction profile around a Bragg peak. The results seem to indicate that the packing of lipid chains around a single helix is fundamentally different from the way the chains pack against a large protein surface.
MATERIALS AND METHODS
Sample preparation
WALP peptides were synthesized as described previously (Van der Wel et al., 2000; Greathouse et al., 2001). The sequences used here include acetyl-GWW(LA)3LWWA-ethanolamide (WALP13), acetyl-GWW(LA)5WWA-ethanolamide (WALP16), and acetyl-GWW(LA)6LWWA-ethanolamide (WALP19).
1,2-dilauroyl-sn-glycero-3-phosphocholine (DLPC), 1,2-tridecanoyl-sn-glycero-3-phosphocholine (DTPC), and 1,2-dimyristoyl-sn-glycero-3-phosphocholine (DMPC), were purchased from Avanti Polar Lipids (Alabaster, AL). Chloroform and trifluoroethanol (TFE) were purchased from Sigma Chemicals Company (St. Louis, MO). All chemicals were used without further purification.
Oriented multilayered samples were prepared for both circular dichroism (CD) and x-ray measurements following the method described in Ludtke et al. (1995) and Heller et al. (1998). First, solid substrates, quartz plates for oriented circular dichroism (OCD) and polished silicon wafers for x ray, were cleaned in hot sulfuric-chromic acid and rinsed thoroughly first with distilled water, and then with ethanol. The plates were dried in an oven, ready for use. Next, a total amount of 0.3–0.5 mg lipid was codissolved with peptide at the desired peptide-to-lipid molar ratio P/L in a mixture of chloroform and TFE. The dissolved mixture was deposited on the clean plate and the solvent was allowed to evaporate. During the evaporation of the solvent the sample self-assembled into aligned multilayers parallel to the substrate surface. The chloroform/TFE ratio was varied, ranging from 3:1 to 1:3 (v/v) to optimize the uniformity of the sample on the substrate (Ludtke et al., 1995). Once the solvent evaporated, it was placed in a vacuum freezedryer for at least 1 h to ensure a complete removal of the solvent residues. The vacuumed sample was then slowly hydrated in a temperature-humidity chamber. A good sample had a visually smooth and flat surface, and showed up to eight orders of Bragg diffraction by x ray indicating that it was a stack of parallel lipid bilayers. The degree of alignment was measured by a two-dimensional ω–θ scan (see below).
Oriented circular dichroism
Oriented circular dichroism is a simple method for detecting the orientation change of peptides embedded in lipid bilayers using a conventional CD machine (Olah and Huang, 1988; Wu et al., 1990). A Jasco J-500A spectropolarimeter (Jasco, Tokyo, Japan) was used for this experiment. The procedure of OCD measurement is the same as the conventional CD measurement, except that an oriented sample is used. For most experiments as in this one, normal (rather than oblique) incidence OCD is sufficient for spectral analysis (Wu et al., 1990). The sample mount for OCD was allowed to rotate around an axis normal to the surface of the sample substrate and coincident with the incident light. If OCD changes with the rotational angle, it implies that the signal contains artifacts due to linear dichroism (Wu et al., 1990). In this experiment, the OCD of our samples did not change with the rotational angle. Samples of DMPC were measured at 35°C. Samples of DTPC and DLPC were measured at 25°C.
For solution CD with lipid vesicles, the peptide and lipids at P/L = 1/20 were mixed in organic solvent. The solvent was blown off under dry N2 and removed under vacuum. Distilled water was added to the mixture to result in a total vesicle concentration of 1 mg/ml, which was then vortexed vigorously and sonicated for a period of 10 min before the measurement.
X-ray lamellar diffraction
The sample mount for lamellar diffraction was allowed to rotate (angle ω) around an axis normal to the plane of scattering. Lamellar diffraction was collected on a Diffractus 581 (Enraf-Nonius, Delft, Holland) and a four-circle goniometer (Huber, Rimsting, Germany), with a line-focused (10 mm vertical × 1 mm horizontal) Cu Kα source (λ = 1.542 Å) operating at 40 kV and 15–30 mA. At a 6° takeoff angle (the projected source dimension 10 × 0.1 mm2) the incident beam was collimated by a horizontal Soller slit and two vertical slits on the front and the back sides of the Soller slit. The horizontal and vertical divergence of the incident beam were 0.23° and 0.3°, respectively. The diffracted beam first passed through a vertical slit and then was discriminated by a bent graphite monochromator before entering a scintillation detector, which was biased to discriminate against higher harmonics. A diffracted beam monochromator has the advantage over an incident beam monochromator in that the Compton scattering and the fluorescence from the sample are screened; consequently the background signal is greatly reduced, which in turn allows the measurement of high diffraction orders.
One unique feature of membrane diffraction is that the repeat spacing is more than 30 times the x-ray wavelength. The momenta Q satisfying the Bragg law lie very close to the surface of the Ewald sphere. As a consequence, it is very easy to obtain incorrect diffraction amplitudes with the sample misaligned in χ without realizing it. (χ is the rotational angle around the line of intersection between the plane of scattering and the sample plane.) We have established an elaborate routine for positioning and orienting lamellar samples, which was described in Wu et al. (1995). A two-dimensional ω−θ scan around the second or third Bragg order was used to check the alignment of the ω–angle. A correctly aligned sample has the peak position exactly at 2ω = 2θ in the ω−θ plane. Also the quality of the sample could be assessed from this scan: a well-aligned sample exhibited a single Bragg peak on a flat even background, whereas poor alignment showed up as a broad shoulder along ω.
To record diffraction patterns, the sample was housed in a temperature-humidity chamber as described in Weiss et al. (2002). The diffraction patterns were recorded by ω−2θ scan, repeated four to five times every hour from ω = 0° to ∼10° with the step size Δω = 0.02°. An Al-attenuator was used to reduce the count rate for the first two diffraction orders not to saturate the detector. The data of WALPs in DMPC were taken at 35°C, and in DTPC and DLPC at 30°C, each for a series of humidity settings ranging from RH ∼70% to ∼99%. Only consecutive scans that overlapped within the experimental error indicating that the sample conditions didn't change during the scan were averaged and subsequently analyzed. For each sample, the data sets consisting of scans for 5–10 different relative humidities at the same temperature were collected. Also, several samples of the same lipid–peptide composition were measured to ensure reproducibility.
RESULTS
Oriented circular dichroism spectra
A representative OCD spectrum of WALPs embedded in lipid bilayers is shown in Fig. 1, along with its vesicular CD. The OCD of an α-helix has been analyzed in detail previously (Olah and Huang, 1988; Wu et al., 1990). It is well-known that a solution CD of α-helix has three bands: a positive π-π* band at ∼190 nm, a negative π-π* band at ∼205 nm, and a negative n-π* band at ∼222 nm, as can be seen from the vesicular CD of WALP. The negative π-π* band at ∼205 nm has its electric transition dipole polarized parallel to the helical axis. Thus if a helix is oriented along the direction of incident light, its OCD is most prominently characterized by the absence of the negative π-π* band at ∼205 nm. Two other noticeable characteristics are 1) the decrease of the magnitude of the 222-nm band relative to that of the 190-nm band and 2) the red shift of the positive 190-nm band. The magnitudes of these changes vary somewhat from one helical peptide to another. As has been observed in earlier OCD spectra of WALP17 (Killian et al., 1996) and WALP23 (De Planque et al., 1999), the OCD of WALP19 shown in Fig. 1 is consistent with helices approximately parallel to the light, or perpendicular to the plane of the bilayers. Indeed, 2H-NMR data show that labeled WALP19 is tilted only ∼4° from the bilayer normal in DMPC or DLPC (Van der Wel et al., 2002). All other OCD spectra of WALP13, WALP16, and WALP19 in DLPC, DTPC, and DMPC bilayers are similar.
FIGURE 1.

Vesicular CD and OCD of WALP. (Top) CD of WALP19 in DLPC vesicles. (Bottom) OCD of WALP19 in oriented DLPC multilayers. The amplitudes are not normalized. The spectra were independent of lipids. The spectra of WALP13 and WALP16 are similar (not shown).
X-ray diffraction
Quality of multilamellar samples
Both OCD and x-ray diffraction rely on homogeneous, well-aligned multilayer samples. We have used many methods to characterize the quality of such samples, including conoscopy (Powers and Pershan, 1977; Huang and Olah, 1987), artifacts of OCD (Wu et al., 1990), in-plane scattering (He et al., 1993), oriented 2H-NMR (Van der Wel et al., 2002), polarized microscopy (Asher and Pershan, 1979; He et al., 1996), and two-dimensional ω−θ scan to be described below. It is easy to prepare good multilamellar samples of pure phospholipids (Powers and Pershan, 1977). It is relatively harder with peptide–lipid mixtures, and in general the degree of difficulty increases with peptide concentration and varies somewhat with the type of peptide. In the past, we have successfully produced excellent multilamellar samples with naturally produced membrane-active peptides, including gramicidin (Huang and Olah 1987; Harroun et al., 1999a,b), alamethicin, melittin, magainin, protegrin (see review, Huang, 2000), θ-defensin (Weiss et al., 2002), and many of their analogs even at a high peptide-to-lipid ratio P/L = 1/10. So far we have found that naturally produced membrane-active peptides tend to mix homogenously in lipid bilayers. We have not found that to be the case with many artificially designed peptides. However, WALPs seem to be an exception. The WALP samples appeared to be smooth and uniform, like samples containing natural peptides. This excludes the possibility of macroscopic aggregations of peptides with size >1 μm. The possibility of aggregations of the order of 100 nm or less is excluded by the lack of significant powder signal from x-ray diffraction, as will be explained below.
Fig. 2 shows a two-dimensional ω−θ scan around the third Bragg peak of a WALP in DMPC multilayer sample. An intensity cut along ω through the peak gives the conventional rocking curve. The width of the rocking curve (FWHM ∼0.1°) is the same as the limiting resolution of our apparatus, implying extremely good alignment of the multilayers. If the sample has a powder (misaligned) component, the ω−θ scan would show a constant platform of a width ∼0.1° in 2θ (from ∼5.25° to ∼5.35°) along the ω-axis and it would show up as a constant background in the rocking curve. The background of the rocking curve (after the removal of the Bragg peak by a Gaussian fit) is negligible. If, for example, there were sub-100-nm aggregations of peptides in the sample, they would have produced a much higher powder background.
FIGURE 2.

(Left) A representative two-dimensional ω−θ scan around the third Bragg peak of an aligned multilayer sample of WALP13 in DMPC bilayers (P/L = 1/20). The sample was well aligned and showed a single peak on a flat background. (Right) A cut through the center of the peak at constant θ corresponds to the ω rocking curve. The FWHM of the rocking curve is 0.1°, the same as the limiting resolution of the apparatus. The background below the Gaussian fit to the rocking curve is negligible, implying very little powder diffraction.
Electron density profiles
All diffraction patterns of WALP samples consist of at least six Bragg orders (Fig. 3). The data reduction procedure has been described in detail in previous publications (Olah et al., 1991; Wu et al., 1995; Chen et al., 1997). Briefly, it consists of the following steps. A background curve was generated by removing all of the Bragg peaks from all of the data sets of a particular sample, and then averaging the results and interpolating over any remaining gaps. After the background removal, a correction for the sample size versus the beam size, i.e., the diffraction volume, together with the absorption correction, was carried out for each data point. Each Bragg peak was then fit with a Gaussian and integrated to obtain the intensity of that order. The integrated intensity was corrected for the polarization and the Lorentz factors. The square root of the integrated intensity is the relative magnitude of the scattering amplitude. Phasing diagrams were constructed by the Blaurock method (Blaurock, 1971). A representative phasing diagram is shown in Fig. 4. With the phases determined, the relative scattering amplitudes were Fourier-transformed to produce unnormalized electron density profiles (Fig. 5), from which the peak-to-peak (PtP) distance was measured. PtP is unaffected by normalization of the electron density profile (Wu et al., 1995). Fig. 6 shows the PtP of three lipids with and without WALPs at the peptide-to-lipid molar ratio P/L = 1/20, plotted as a function of the repeat spacing D.
FIGURE 3.

Representative diffraction patterns of pure DMPC (bottom) and DMPC containing WALP13 at P/L = 1/20, both measured at 35°C. (The patterns are displaced for clarity.) An attenuator was used to reduce the count rate for the first two diffraction orders in order not to saturate the detector.
FIGURE 4.

Phasing diagram for the diffraction patterns of WALP13 in DMPC at P/L = 1/20. The diffraction amplitudes at different degrees of hydration (different repeat spacing D) are connected by a smooth curve, showing the correct assignment of the phases.
FIGURE 5.
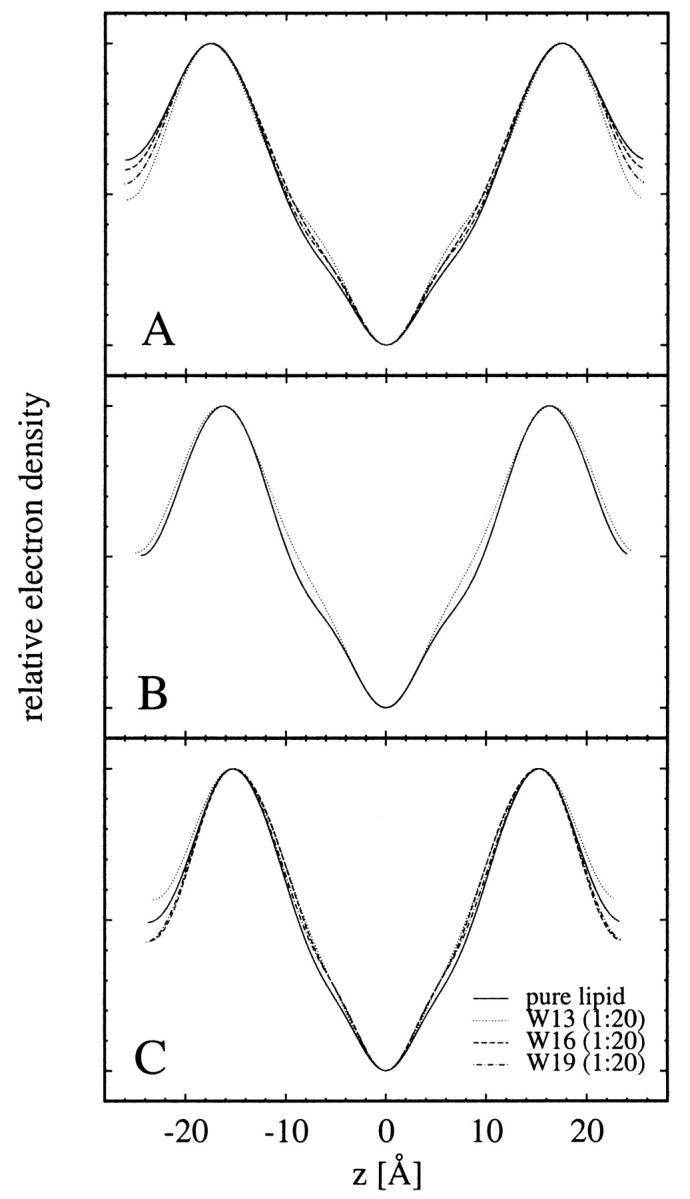
Electron density profiles for (A) DMPC with and without WALPs at 35°C, (B) DTPC with and without WALPs at 30°C, and (C) DLPC with and without WALPs at 30°C. The changes of the electron density profiles in the central region clearly indicate the presence of peptides in the lipid bilayers.
FIGURE 6.

The peak-to-peak (PtP) distance of lipid bilayer with and without WALPs.
DISCUSSION
First we established that the peptides were homogenously distributed and aligned in the lipid bilayers. As stated above, visual inspection and examination by x ray indicated no aggregations of peptide. The OCD measurements also indicate no aggregation effects. This is seen as follows.
Modern conventional CD spectrometers follow the design of Velluz, Legrand, and Grosjean (1965). A linearly polarized light is modulated periodically (usually 50 kHz) to become alternatively left and right circularly polarized before passing through the sample. The output of the spectrometer is the ratio of the AC (50-kHz) to DC signals (Iac/Idc) that provides a direct measure of the circular dichroism. A great advantage of this method is that the ratio is independent of the sample absorption, because both Iac and Idc are proportional to the transmission. However, if the sample is not homogenous, the CD will be distorted. This can be seen by considering a sample consisting of two parts: e.g., part 1 containing peptide, but part 2 devoid of peptide. In our case, both the CD and the UV absorption are due mainly to the peptides, so the output CD = Iac(1) / [Idc(1) + Idc(2)]. As the wavelength decreases, both Iac(1) and Idc(1) decrease exponentially according to the peptide absorption, but Idc(2) remains relatively large because of the absence of peptide absorption. As a result the CD output would appear to attenuate toward the short wavelengths. Also, if a peptide had a tendency to aggregate, its OCD would most likely vary from sample to sample due to different degrees of aggregation. Our OCD spectrum shown in Fig. 1 does not exhibit any sign of attenuation toward short wavelengths, as compared with the solution CD or OCD of other helical peptides (Wu et al., 1990; Ludtke et al., 1994; Yang et al., 2001). Additionally, the spectra of all WALP samples were reproduced without fail. Thus we conclude that the peptides were homogenously distributed in all of the WALP samples, and OCD indicates that the helices were oriented in a direction essentially perpendicular to the plane of bilayers.
We chose the peptide-to-lipid ratio for the WALP samples to be P/L = 1/20, so as to compare with our previous measurement of gramicidin at P/L = 1/10. This takes into account the fact that the gramicidin channel is a dimer, so both WALP and gramicidin samples have the same density of transmembrane rods. The modification of the electron density profiles in the chain region (Fig. 5) clearly indicates the presence of WALP peptides in the lipid bilayers. The diameter of a WALP helix (∼10 Å) is nevertheless smaller than that of a gramicidin channel (∼20 Å), so that each WALP cylinder will be expected to make immediate direct contact with fewer lipid molecules than gramicidin at any given moment in time.
The height of the hydrophobic surface of the gramicidin channel has been estimated to be hG ∼22 Å (Elliott et al., 1983; Harroun et al., 1999a,b). The thickness of the hydrocarbon region of a lipid bilayer is estimated by subtracting twice the length of the glycerol region (from the phosphate to first methylene of the hydrocarbon chain), i.e., ∼10 Å, from PtP (McIntosh and Simon, 1986; Nagle et al., 1996; Harroun et al., 1999a,b). From Fig. 6, as well as previous measurements (Harroun et al., 1999a,b), we obtained the estimated hydrocarbon thickness 25.3 Å for DMPC, 22.7 Å for DTPC, and 20.8 Å for DLPC. Our previous measurement (Harroun et al., 1999a,b) showed that the inclusion of gramicidin channels thinned the DMPC bilayer by 2.6 Å and thickened the DLPC bilayer by 1.3 Å, consistent with the expectation of hydrophobic matching. By the same technique, we have also measured membrane thinning by inclusion of peptides in the headgroup region; for example, alamethicin (Wu et al., 1995) and magainin (Ludtke et al., 1995) induced a membrane thinning of ∼2 Å at P/L ∼1/50, protegrin ∼1 Å at P/L ∼1/70 (Heller et al., 2000), and θ-defensin ∼1 Å at P/L ∼1/10 (Weiss et al., 2002). In all of these latter cases, the membrane thickness was measured for a series of peptide concentrations, and the thinning was consistently proportional to the peptide concentration. It is important to point out that in each case, including the case of gramicidin, when there was a membrane thickness change, the whole PtP versus D curve was clearly displaced from the PtP versus D curve of the pure lipid.
Compared with all of these previous measurements, Fig. 6 shows that, within the experimental errors, there was no significant change in thickness for each of three lipid bilayers by the inclusion of three different WALP peptides. The hydrophobic lengths of WALPs are estimated to be ∼21 Å, 25 Å, and 30 Å for WALP13, WALP16, and WALP19, respectively (Van der Wel et al., 2000). Even allowing a possible over- or underestimation of these hydrophobic lengths, it is clear that lipid thickness adjustment in response to hydrophobic matching did not take place between WALP13, 16, or 19, and DMPC or DLPC; nor did it take place between WALP13 and DTPC. This result is counterintuitive, for the energetic argument for hydrophobic matching, at least for the case of gramicidin, is rather clear (Harroun et al., 1999b)—namely, the energy cost of hydrophobic mismatch is greater than the energy cost of the membrane deformation resulting from matching.
One should compare the present results to the lipid-chain order parameters that have been determined by 2H NMR in similar systems (De Planque et al., 1998). The influence of WALP16 and WALP19, as well as of gramicidin, upon the lipids DLPC and DMPC has been investigated by 2H-NMR spectroscopy of fully deuterated lipids (De Planque et al., 1998). In this case, the relative differences in lipid properties between samples that contain different sizes of peptide inclusions could be more readily interpreted than particular absolute differences that are observed with and without peptide. In DLPC (at 10°C) WALP19 modulates the lipid-chain segmental order parameters to a significantly greater extent than does WALP16. In DMPC (at 34°C)—as well as in DPPC and DSPC at higher temperatures—the effects of WALP19 and WALP16 (all measured at P/L = 1/30) upon the lipid 2H-NMR quadrupolar splittings are rather small (De Planque et al., 1998), yet nevertheless very systematic with respect to the peptide length.
In terms of absolute effects, the three peptides, gramicidin, WALP16, and WALP19 all have an ordering effect on the acyl chains of DLPC and DMPC, with the order parameter profiles for both lipids increasing along the series: (no peptide) < WALP16 < WALP19 < gramicidin (De Planque et al., 1998). The chain-ordering effect could be attributed to a side-by-side “near neighbor” influence of the peptides upon the lipid motions. Nevertheless, the chain-ordering series is not preserved when one examines the lipid thickness by x-ray diffraction. We note that there are some experimental differences: e.g., the extent of hydration was varied in the x-ray experiments (Fig. 6), but was never as high as in the NMR experiments; in the x-ray studies oriented bilayers were used, whereas the NMR studies were carried out on nonoriented systems; and also the peptide/lipid ratios were different in the two studies. Nevertheless, we cannot exclude another explanation, namely that the overall chain order and PtP distance are somewhat independent (or at least uncoupled) properties that are not directly correlated in all cases.
It has been suggested that tryptophans might function as interfacial anchors for membrane proteins because they tend to be located near the membrane/water interface (O'Connell et al., 1990; Schiffer et al., 1992). Indeed WALP was designed with two tryptophans on each end to imitate this feature of membrane proteins (Killian et al., 1996; de Planque et al., 1998; van der Wel et al., 2000). Thus the small influence of WALP19, WALP16, and even WALP13 upon lipid PtP distance is surprising, especially inasmuch as we also did not detect deformation or significant tilt of WALP helices. Analysis of 2H-NMR spectra from labeled alanines showed that WALP19 exhibited a tilt of ∼4° away from the membrane normal in DLPC, DMPC, and DOPC (Van der Wel et al., 2002).
One interesting difference between WALPs and gramicidin in their interactions with lipid is worth mentioning. In a previous study of gramicidin in DLPC (Olah et al., 1991), we noted that while the electron density profile of pure lipid changed continuously with hydration, the profile of the lipid containing gramicidin did not vary (within experimental errors) with changes of hydration. In the present study we have noticed that DLPC containing WALPs had varying electron density profiles at different hydrations just like pure lipid. Apparently gramicidin channels clamped the bilayer thickness but WALPs did not. We note that the diameter of an isolated membrane-spanning α-helix (which is ∼10 Å) is comparable to a lipid molecule (which has a diameter ∼8.7 Å, assuming a cross section area ∼60 Å2; Nagle and Tristram-Nagle, 2000). Perhaps the continuum theory of membrane elasticity breaks down on such interface, so that the energy argument which was used successfully for gramicidin channels (Huang, 1986; Goulian et al., 1998; Harroun et al., 1999a,b) is not applicable for a single helix. In an overall sense, we conclude that the packing of lipid chains around a single helix is fundamentally different from the way the chains pack against a larger protein surface, such as the surface of the gramicidin channel.
Acknowledgments
H.W.H. was supported by grant GM55203 from the National Institutes of Health and by the Robert A. Welch Foundation. R.E.K. was supported by grant MCB-9816063 from the National Science Foundation.
References
- Alberts, B., D. Brays, J. Lewis, M. Raff, K. Roberts, and J. D. Watson. 1994. Molecular Biology of the Cell, 3rd ed. Garland Publishing, New York. 487.
- Asher, S. A., and P. S. Pershan. 1979. Alignment and defect structures in oriented phosphatidylcholine multilayers. Biophys. J. 27:393–422. [DOI] [PMC free article] [PubMed] [Google Scholar]
- Blaurock, A. E. 1971. Structure of the nerve myelin membrane: proof of the low resolution profile. J. Mol. Biol. 56:35–52. [DOI] [PubMed] [Google Scholar]
- Chen, F. Y., W. C. Hung, and H. W. Huang. 1997. Critical swelling of phospholipid bilayers. Phys. Rev. Lett. 79:4026–4029. [Google Scholar]
- De Planque, M. R. R., D. V. Greathouse, R. E. Koeppe II, H. Schäfer, D. Marsh, and J. A. Killian. 1998. Influence of lipid/peptide hydrophobic mismatch on the thickness of diacylphosphatidylcholine bilayers: a 2H-NMR and ESR study using designed transmembrane α-helical peptides and gramicidin A. Biochemistry. 37:9333–9345. [DOI] [PubMed] [Google Scholar]
- De Planque, M. R. R., J. A. Kruijtzer, R. M. Liskamp, D. Marsh, D. V. Greathouse, R. E. Koeppe II, B. de Kruijff, and J. A. Killian. 1999. Different membrane anchoring positions of tryptophan and lysine in synthetic transmembrane alpha-helical peptides. J. Biol. Chem. 274:20839–20846. [DOI] [PubMed] [Google Scholar]
- Elliott, J. R., D. Needham, J. P. Dilger, and D. A. Haydon. 1983. The effects of bilayer thickness and tension on gramicidin single-channel lifetime. Biochim. Biophys. Acta. 735:95–103. [DOI] [PubMed] [Google Scholar]
- Goulian, M., O. N. Mesquita, D. K. Fygenson, E. Moses, C. Nielsen, O. S. Andersen, and A. Libchaber. 1998. Gramicidin channel kinetics under tension. Biophys. J. 74:328–337. [DOI] [PMC free article] [PubMed] [Google Scholar]
- Greathouse, D. V., R. L. Goforth, T. Crawford, P. C. A. van der Wel, and J. A. Killian. 2001. Optimized aminolysis conditions for cleavage of N-protected hydrophobic peptides from solid-phase resins. J. Pept. Res. 57:519–527. [DOI] [PubMed] [Google Scholar]
- Harroun, T. A., W. T. Heller, T. M. Weiss, L. Yang, and H. W. Huang. 1999a. Experimental evidence for hydrophobic matching and membrane-mediated interactions in lipid bilayers containing gramicidin. Biophys. J. 76:937–945. [DOI] [PMC free article] [PubMed] [Google Scholar]
- Harroun, T. A., W. T. Heller, T. M. Weiss, L. Yang, and H. W. Huang. 1999b. Theoretical analysis of hydrophobic matching and membrane-mediated interactions in lipid bilayers containing gramicidin. Biophys. J. 76:3176–3185. [DOI] [PMC free article] [PubMed] [Google Scholar]
- He, K., S. J. Ludtke, Y. Wu, and H. W. Huang. 1993. X-ray scattering with momentum transfer in the plane of membrane: application to gramicidin organization. Biophys. J. 64:157–162. [DOI] [PMC free article] [PubMed] [Google Scholar]
- He, K., S. J. Ludtke, D. L. Worcester, and H. W. Huang. 1996. Neutron scattering in the plane of membranes: structure of alamethicin pores. Biophys. J. 70:2659–2666. [DOI] [PMC free article] [PubMed] [Google Scholar]
- Heller, W. T., A. J. Waring, R. I. Lehrer, and H. W. Huang. 1998. Multiple states of β-sheet peptide protegrin in lipid bilayers. Biochemistry. 37:17331–17338. [DOI] [PubMed] [Google Scholar]
- Heller, W. T., A. J. Waring, R. I. Lehrer, T. A. Harroun, T. M. Weiss, L. Yang, and H. W. Huang. 2000. Membrane thinning effect of the β-sheet antimicrobial protegrin. Biochemistry. 39:139–145. [DOI] [PubMed] [Google Scholar]
- Huang, H. W. 1986. Deformation free energy of bilayer membrane and its effect on gramicidin channel lifetime. Biophys. J. 50:1061–1070. [DOI] [PMC free article] [PubMed] [Google Scholar]
- Huang, H. W., and G. A. Olah. 1987. Uniformly oriented gramicidin channels embedded in thick monodomain lecithin multilayers. Biophys. J. 51:989–992. [DOI] [PMC free article] [PubMed] [Google Scholar]
- Huang, H. W. 2000. Action of antimicrobial peptides: two-state model. Biochemistry. 39:8347–8352. [DOI] [PubMed] [Google Scholar]
- Killian, J. A., I. Salemink, M. R. R. de Planque, G. Lindblom, R. E. Koeppe II, and D. V. Greathouse. 1996. Induction of nonbilayer structures in diacylphosphatidylcholine model membranes by transmembrane α-helical peptides: importance of hydrophobic mismatch and proposed role of tryptophans. Biochemistry. 35:1037–1045. [DOI] [PubMed] [Google Scholar]
- Ludtke, S. J., K. He, Y. Wu, and H. W. Huang. 1994. Cooperative membrane insertion of magainin correlated with its cytolytic activity. Biochim. Biophys. Acta. 1190:181–184. [DOI] [PubMed] [Google Scholar]
- Ludtke, S., K. He, and H. W. Huang. 1995. Membrane thinning caused by magainin 2. Biochemistry. 34:16764–16769. [DOI] [PubMed] [Google Scholar]
- McIntosh, T. J., and S. A. Simon. 1986. Area per molecule and distribution of water in fully hydrated dilauroylphosphatidylethanolamine bilayers. Biochemistry. 25:4948–4952. [DOI] [PubMed] [Google Scholar]
- Nagle, J. F., R. Zhang, S. Tristram-Nagle, W. Sun, H. I. Petrache, and R. M. Suter. 1996. X-ray structure determination of fully hydrated La phase dipalmitoylphosphatidylcholine bilayers. Biophys. J. 70:1419–1431. [DOI] [PMC free article] [PubMed] [Google Scholar]
- Nagle, J. F., and S. Tristram-Nagle. 2000. Structure of lipid bilayers. Biochim. Biophys. Acta. 1469:159–195. [DOI] [PMC free article] [PubMed] [Google Scholar]
- O'Connell, A. M., R. E. Koeppe II, and O. S. Andersen. 1990. Kinetics of gramicidin channel formation in lipid bilayers: transmembrane monomer association. Science. 250:1256–1259. [DOI] [PubMed] [Google Scholar]
- Olah, G. A., and H. W. Huang. 1988. Circular dichroism of oriented α-helices. I. Proof of the exciton theory. J. Chem. Phys. 89:2531–2538. [Google Scholar]
- Olah, G. A., H. W. Huang, W. Liu, and Y. Wu. 1991. Location of ion binding sites in the gramicidin channel by x-ray diffraction. J. Mol. Biol. 218:847–858. [DOI] [PubMed] [Google Scholar]
- Powers, L., and P. S. Pershan. 1977. Monodomain samples of dipalmitoyl phosphatidylcholine with varying concentrations of water and other ingredients. Biophys. J. 20:137–152. [DOI] [PMC free article] [PubMed] [Google Scholar]
- Schiffer, M., C. H. Chang, and F. J. Stevens. 1992. The functions of tryptophan residues in membrane proteins. Protein Engr. 5:213–214. [DOI] [PubMed] [Google Scholar]
- Van der Wel, P. C. A., T. Pott, W. Morein, D. V. Greathouse, R. E. Koeppe II, and J. A. Killian. 2000. Tryptophan-anchored transmembrane peptides promote formation of nonlamellar phases in phosphatidylethanolamine model membranes in a mismatch-dependent manner. Biochemistry. 39:3124–3133. [DOI] [PubMed] [Google Scholar]
- Van der Wel, P. C. A., E. Strandberg, J. A. Killian, and R. E. Koeppe, Ii. 2002. Geometry and intrinsic tilt of a tryptophan-anchored transmembrane alpha-helix determined using 2H NMR. Biophys. J. 83:1479–1488. [DOI] [PMC free article] [PubMed] [Google Scholar]
- Velluz, L., M. Legrand, and M. Grosjean. 1965. Optical Circular Dichroism. Academic Press, New York. 57–72.
- Weiss, T. M., L. Yang, L. Ding, A. J. Waring, R. I. Lehrer, and H. W. Huang. 2002. Two states of cyclic antimicrobial peptide RTD-1 in lipid bilayers. Biochemistry. 41:10070–10076. [DOI] [PubMed] [Google Scholar]
- Wu, Y., H. W. Huang, and G. A. Olah. 1990. Method of oriented circular dichroism. Biophys. J. 57:797–806. [DOI] [PMC free article] [PubMed] [Google Scholar]
- Wu, Y., K. He, S. J. Ludtke, and H. W. Huang. 1995. X-ray diffraction study of lipid bilayer membrane interacting with amphiphilic helical peptides: diphytanoyl phosphatidylcholine with alamethicin at low concentrations. Biophys. J. 68:2361–2369. [DOI] [PMC free article] [PubMed] [Google Scholar]
- Yang, L., T. A. Harroun, T. M. Weiss, L. Ding, and H. W. Huang. 2001. Barrel-stave model or toroidal model? A case study on melittin pores. Biophys. J. 81:1475–1485. [DOI] [PMC free article] [PubMed] [Google Scholar]