

Abstract
Fluorescence interference-contrast (FLIC) microscopy is a powerful new technique to measure vertical distances from reflective surfaces. A pattern of varying intensity is created by constructive and destructive interference of the incoming and reflected light at the surface of an oxidized silicon chip. Different levels of this pattern are probed by manufacturing silicon chips with terraces of oxide layers of different heights. Fluorescence collected from membranes that are deposited on these terraces is then used to measure the distance of the fluorescent probes from the silicon oxide surface. Here, we applied the method to measure the distance between supported lipid bilayers and the surface of oxidized silicon chips. For plain fluid phosphatidylcholine bilayers, this distance was 1.7 ± 1.0 nm. The cleft distance was increased to 3.9 ± 0.9 nm in bilayers that were supported on a 3400-Da polyethylene glycol cushion. This distance is close to the Flory distance (4.8 nm) that would be expected for a grafted random coil of this polymer. In a second application, the distance of a membrane-bound protein from the membrane surface was measured. The integral membrane protein syntaxin1A/SNAP25 (t-SNARE) was reconstituted into tethered polymer-supported bilayers. A soluble form of the green fluorescent protein/vesicle-associated membrane protein (GFP-VAMP) was bound to the reconstituted t-SNAREs. The distance of the GFP from the membrane surface was 16.5 ± 2.8 nm, indicating an upright orientation of the rod-shaped t-SNARE/v-SNARE complex from the membrane surface.
INTRODUCTION
Supported lipid bilayer membranes (Tamm and McConnell, 1985) have found wide application as models of cellular membranes in fundamental and applied biophysical research (see Sackmann and Tanaka, 2000; Boxer, 2000, for recent reviews). Interest in supported membranes ranges from studies of lipid-protein interactions and membrane self-assembly to the design of membrane-based biosensors and modeling interactions between cell surfaces in the immune system and elsewhere. We have recently been interested in reconstituting biological, i.e., protein-mediated membrane fusion in a supported bilayer membrane format (Hinterdorfer et al., 1994; Wagner and Tamm, 2001).
A common problem of membranes that are directly supported on hydrophilic glass or other hard substrates is that integral membrane proteins, such as cell surface receptors are not laterally mobile in these systems. To overcome this problem, several investigators have suggested supporting the membranes on soft polymer cushions that are intercalated between the hard surface and the lipid bilayer membrane. To detach the membrane proteins from the glass support in a physiological environment, the polymer must be well soluble in water (i.e., water must approximate a theta solvent for the polymer of choice) and must exhibit minimal interactions with the supporting glass and the lipids and proteins of the supported membrane. We have chosen polyethylene glycol as a polymer that fulfills these criteria. To achieve a stable attachment of the cushioned bilayer to the solid support, we have designed a tripartite molecule (DPS), which consists of a lipid, a 3400 molecular weight polyethylene glycol, and a reactive silane for covalent attachment to glass or quartz supports. Supported lipid bilayers containing 3 mol % of DPS in the leaflet facing the solid substrate could be stably attached to quartz or glass, were uniformly fluorescent, and allowed membrane lipids and proteins to diffuse relatively freely in the plane of the membrane (Wagner and Tamm, 2000; 2001). In this previous work, we estimated from simple polymer theory that the distance between the support and bilayer should be of the order of 4.8 nm, i.e., the Flory diameter of PEG3400. Although some membrane proteins diffused laterally, the bilayer-support separation distance has not been directly measured in this system.
Neutron reflectivity with deuterium-labeled components is a relatively established technique to measure distances of layers of different scattering density in supported membranes (Naumann et al., 1996; Wong et al., 1999). However, the technique requires relatively large amounts of material, expensive equipment, and a model-dependent data analysis. Neutron reflectivity measurements also have a poor lateral resolution. Ellipsometry unfortunately works only in samples exposed to air. Surface plasmon resonance and quartz crystal microbalance techniques simply detect refractive index and surface mass changes, respectively, and therefore are insufficient to resolve structural details of the supported layers.
A very promising new optical technique to probe details of stratified layers on reflective surfaces is fluorescence interference-contrast microscopy (Lambacher and Fromherz, 1996). In this technique, an interference pattern between the incoming and reflected light is generated on the surface of an oxidized silicon chip. The fluorescence intensity of a deposited layer varies depending on the distance of the layer from the reflective surface. To simultaneously probe several distances in the same sample and thereby provide for an internal standard, Fromherz and co-workers suggested using patterned silicon chips with oxide layers of different thickness. These workers showed that supported lipid bilayers (without an interstitial polymer layer) are supported on a 1–2 nm thin film of water (Fromherz et al., 1999), as had been suspected from lateral diffusion measurements (Tamm and McConnell, 1985) and later measured by neutron reflectivity (Johnson et al., 1991). In the present work, we are using FLIC microscopy to measure the distance between the silicon dioxide surface of an oxidized silicon chip and a DPS-polymer supported bilayer. We also demonstrate the first application of this method to measure the surface distance of a fluorescent labeled protein ligand (GFP-VAMP) after its specific binding to integral membrane receptors (t-SNAREs) that were functionally reconstituted into polymer-supported bilayers. Fig. 1 illustrates the general configuration of the two types of experiments.
FIGURE 1.

Diagram of the tethered polymer-supported membrane systems used in this work. Oxidized silicon chips are used as substrates for polymer-supported lipid bilayers. The polymer (3400 molecular weight polyethylene glycol) is covalently attached at its two ends to the silicon oxide surface and to 3 mol % of the membrane lipids, respectively, and serves as a soft cushion between the membrane and chip surface. (A) The membrane is labeled with fluorescent lipid analogs (diI for FLIC measurements, NBD-eggPE for FRAP measurements). (B) t-SNARE receptors are reconstituted into tethered polymer-supported bilayers. After reconstitution, soluble GFP-VAMP proteins are specifically bound to the t-SNAREs in the membrane.
MATERIALS AND METHODS
Materials
POPC, DOPC, and NBD-eggPE were purchased from Avanti Polar Lipids (Alabaster, AL). DiI was purchased from Molecular Probes (Eugene, OR). DPS (Wagner and Tamm, 2000) was custom-synthesized by Shearwater Polymers (Huntsville, AL). Expressed full-length syntaxin1A/SNAP25-His6 (Parlati et al., 1999) and soluble GFP-VAMP (with the transmembrane domain deleted) were kind gifts of Dr. James Rothman, Memorial Sloan-Kettering Cancer Center. GFP was fused to the N-terminal end of the soluble domain of VAMP in these constructs.
FLIC substrates
Four-inch silicon wafers (100 surface) were oxidized at 1000°C in wet oxygen to obtain 350 nm of homogenous oxide. Surfaces with four and 16 levels of oxide with quadratic terraces of 5 μm × 5 μm and 2.5 μm × 2.5 μm, respectively were fabricated by photolithography and HF etching (Braun and Fromherz, 1997; Braun and Fromherz, 1998). The oxide thickness ranged 10–200 nm on four-level chips and 20–330 nm on 16-level chips. The wafers were cut into 10 mm × 35 mm chips.
Before each experiment, the chips were cleaned by soaking in concentrated H2SO4 and 30% H2O2 at a volume ratio of 3:1, followed by extensive rinsing with 7 L of double-distilled water. After cleaning, the chips were kept in double-distilled water not longer than 30 min. This cleaning procedure lead to hydrophilic oxide surfaces without removing or adding oxide (Lambacher and Fromherz, 2001). Oxide thicknesses were measured by microellipsometry (Plasmos SD2000, Munich, Germany).
Lipid monolayers
Lipid monolayers consisting of 97 mol % DOPC and 3 mol % DPS were spread from 10-mM solutions of lipid in chloroform at near-zero surface pressure at the air-water interface of a Langmuir-Blodgett trough (Nima 611, Coventry, Great Britain). For measurements of the bilayer distance by FLIC, 0.5 mol % diI was included in the monolayer and DOPC was adjusted to 96.5 mol %. The subphase was 10 mM Tris-acetic acid (pH 5.0) made from double-distilled water. Solvents were allowed to evaporate for 20 min before the monolayers were compressed at a compression rate of 30 cm2/min to a final surface pressure of 32 mN/m. A clean FLIC chip was dried under nitrogen and attached to the dipper of the trough and was quickly (200 mm/min) immersed through the monolayer. A monolayer was transferred by withdrawing the chip from the subphase at a rate of 5 mm/min under constant surface pressure (32 mN/m). The transfer ratio during immersion was below 5%. Monolayer transfer was efficient during withdrawel and was close to 100%. The coated chips were dried in a desiccator overnight and cured at 70°C in an oven for 40 min to covalently link (tether) DPS to the chip surface (Wagner and Tamm, 2000). The hot chips were transferred to a desiccator, allowed to equilibrate at room temperature and used within two days.
Large unilamellar vesicles
DiI and POPC in a molar ratio of 1:200 or NBD-eggPE and POPC in a molar ratio of 1:100 were mixed in stock chloroform solutions and dried on the bottom of glass test tubes by a stream of nitrogen. After desiccating under vacuum for at least 30 min, the lipids were hydrated by the addition of HEPES buffer (5 mM HEPES, pH 7.4, containing 150 mM NaCl) to give a total lipid concentration of 1 mM. The resulting suspensions were vigorously vortexed, freeze-thawed five times, and extruded nine times through two polycarbonate membranes of 100 nm pore size, using a syringe-type extruder (Avestin, Ottawa, ON, Canada).
Polymer-supported lipid bilayers
Dry tethered polymer-supported monolayers were assembled in a closed home-built measuring cell (Tamm, 1993). The measuring cell was modified slightly to hold FLIC chips in a central position and closed tightly with a quartz slide between chip and top cell frame; 1.1 ml of 100 μM lipid vesicles were added. The formation of bilayers was followed in epifluorescence on a Zeiss Axiovert 35 microscope (Carl Zeiss, Thornwood, NY) using a 63× water immersion objective. After 1 h of equilibration at room temperature, excess unfused vesicles were flushed out of the measuring cell with 5.5 ml HEPES buffer.
Reconstitution of t-SNAREs into polymer-supported lipid bilayers
To reconstitute t-SNAREs into vesicles and into supported lipid bilayers by vesicle fusion, we followed previously described procedures (Wagner and Tamm, 2001). Syntaxin1A/SNAP25 (t-SNARE) was stored in small aliquots in 25 mM HEPES/KOH containing 100 mM KCl, 10% glycerol, 1 mM dithiothreitol, and 1% β-OG at −80°C. t-SNAREs were thawed on ice, stored at 4°C, and used within one week. For experiments with fluorescently labeled t-SNAREs, the samples were labeled with Alexa Fluor 488 succinimidyl ester (Molecular Probes, Eugene, OR) after adjusting the pH to 8.3 with 1 M sodium bicarbonate; 0.5 μmol POPC in chloroform stock solution were dried in test tubes under nitrogen and placed under vacuum for at least 30 min. DiI was added at this step if desired. The dried lipid film was solubilized with a volume of 1% β-OG in reconstitution buffer (RB) followed by the addition of a volume containing 1.25 nmol syntaxin1A/SNAP25 to give a final volume of 166 μl and the desired protein-lipid ratio of 1:400. The mixture was equilibrated at room temperature for 1 h followed by addition of 333 μl of RB to bring the β-OG concentration below the critical micellar concentration. The mixture was dialyzed with a regenerated cellulose irradiated dispodialyzer (No. 135062, Spectrum Laboratories Inc., Rancho Dominguez, CA) for 19 h against 1 L of RB at 4°C with one change of buffer after 4 h. The resulting vesicle solution was used within one week.
Diluted t-SNARE vesicles in the amount of 1.1 ml 100 μM lipid were added to FLIC chips with DPS monolayers in the TIRFM measuring cell in the same way as described above for polymer-supported lipid bilayers. After 2 h of equilibration at room temperature, excess unfused t-SNARE vesicles were flushed out with 5.5 ml of RB. The t-SNARE-containing bilayers were then treated by flushing the cell with 5.5 ml of RB adjusted to pH 5.0, followed by a 20 min equilibration before returning the pH to 7.4 by flushing with another 5.5 ml RB. This pH treatment heals relatively rare defects in supported lipid bilayers (Wagner and Tamm, 2001).
GFP-VAMP binding
t-SNARE containing bilayers were flushed with 2.2 ml of 200 μg/ml soluble GFP-VAMP in RB at room temperature. After 1 h incubation, nonspecifically bound GFP-VAMP was washed away with 11 ml of RB.
Lateral diffusion measurements
Lateral diffusion of proteins and lipids in supported bilayers was measured by FRAP as described in detail elsewhere (Tamm, 1988; Kalb et al., 1992; Wagner and Tamm, 2000). We used a Zeiss Axiovert 35 fluorescence microscope (Carl Zeiss) together with an Innova 300-8W argon ion laser (Coherent, Palo Alto, CA) as light source. The emission wavelength of the laser was set to 488 nm. The intensity of the laser beam was controlled by an AOM-40 acoustooptic modulator (IntraAction, Bellwood, IL) before it entered the epiillumination path of the microscope. A pattern of parallel stripes with a periodicity of 12.7 μm was imaged onto an ∼150 μm diameter area of the sample. The fluorescence was collected from the bottom of the cell through a 40× (0.75 N.A.) water-immersion objective (Carl Zeiss) and was measured by an EMI 9658A photomultiplier tube and stored in the computer as a function of time. Mechanical shutters (Vincent Associates, Rochester, NY) were placed in the excitation and emission paths to protect sample and photomultiplier tube from overexposure. Laser intensity, mechanical shutters and data acquisition were controlled by a home-built automated program using Labview (National Instruments, Austin, TX).
The durations of bleach pulses were ∼100 ms for experiments with Alexa 488 labeled t-SNAREs experiments and NBD-eggPC. The fluorescence recovery curves recorded after the bleach pulse were fit to the equation:
 |
(1) |
where DL is the lateral diffusion coefficient, a = 2π/(stripe period), and F0 and F∞ are the fluorescence intensities immediately after and a very long time after the bleach pulse, respectively. In pattern photobleaching, the mobile fraction in percent is defined as
 |
(2) |
where Fpre is the fluorescence intensity before the bleach pulse.
Photometry
We used the same microscope as for the lateral diffusion experiments, but with a mercury lamp as excitation light source and a 63× (0.95 N.A.) water-immersion objective to obtain epifluorescence images. Images were taken with an EG&G 512 × 512 cooled charge-coupled device camera (Model 1530-P, Roper Scientific, Mercerville, NJ) with a dynamic range of 18 bit. To focus on the chip surface, the samples were illuminated through a 1% neutral density filter, a longpass (LP620, Chroma, Brattleboro, VT) and a beamsplitter (50/50BS, Chroma). After focusing, one image of the reflected red light was taken with an exposure time of 50 ms. The filter holder was then moved to a second filter set for recording fluorescent images. Samples with diI were illuminated through a 1% neutral density filter (Chroma), a 546-nm bandpass filter (BP546/10, Schott Glaswerke, Mainz, Germany), and dichroic mirror (FT580, Chroma). Fluorescence was detected at 610 nm through a bandpass filter (D610/60, Chroma). Samples with GFP were excited at 436 nm through a bandpass filter (D436/10, Chroma) and a dichroic mirror (FT510, Chroma). Fluorescence was detected at 535 nm through a band passfilter (D535/40M, Chroma). Images were recorded with 3.2-s exposure times.
FLIC analysis
A diagram of the basic principle of FLIC microscopy of supported membranes on a silicon chip with terraces of silicon oxide is shown in Fig. 2 A. The interference of incoming and reflected light creates standing modes in front of the reflecting silicon surface. Therefore, the excitation and emission of fluorescent probes in the supported membrane depend on the distance of the probe from the Si/SiO2 interface. Chips with oxide terraces of different thickness position the probes at defined distances from the Si/SiO2 interface. Each distance is the sum of the oxide thickness and the distance of the fluorophore from the oxide surface. Fluorescence intensities are recorded as a function of oxide thickness and fitted to an electromagnetic theory that takes into account all directions, polarizations, and wavelengths of the incident and emitted light, and the interaction of the electromagnetic field with the semiconductor surface and the fluorophore as defined by its absorption and fluorescence spectra and the orientation of its transition moments (Lambacher and Fromherz, 1996). The calculated fluorescence intensity F depends on the probability of detected quanta per unit time Pem and the probability of excitation per unit time Pex. The probability of finding a molecule in the excited state further depends on the rates of fluorescence kf and nonradiative decay knr. Therefore,
 |
(3) |
FIGURE 2.

Fluorescence interference contrast (FLIC) microscopy. (A) Principle of fluorescence interference contrast microscopy. A fluorescent labeled membrane is supported on a patterned silicon chip with microscopic steps of silicon dioxide. The fluorescence intensity depends on the position of the dye with respect to the standing modes of the exciting and emitting light in front of the reflecting silicon surface. The position is determined by the variable height of the oxide steps and the constant width of the cleft between silicon oxide and lipid membrane. (B) Optical layer model used for the evaluation of FLIC experiments with polymer-supported membranes. Five layers are considered for the case of the fluorescent membrane: bulk silicon (refractive index nsi, attenuation index κsi), silicon dioxide (thickness dox, refractive index nox), cleft (thickness dcleft, refractive index nH2O), stained membrane (thickness dmem, refractive index nmem), and bulk water (refractive index nH2O). An additional layer is considered for the case of the fluorescent protein; namely the protein layer above the membrane surface (distance of fluorophore to membrane surface dprot, refractive index nH2O).
The optical layer model with the parameters that are required to compute the excitation and emission probabilities Pex and Pem of experiments with supported membranes is shown in Fig. 2 B. It consists of bulk silicon, a layer of silicon dioxide of thickness dox, a layer of water of thickness dcleft, the supported membrane of thickness dmem, and bulk water above the membrane. For the case of a receptor-bound fluorescent protein (see, for example, Fig. 1 B), the optical model includes an additional protein layer with the fluorophore positioned at dprot (Fig. 2 B). Numerical values for the complex refractive index of silicon [refractive index nsi = 4.904 (435 nm), 4.138 (535 nm), 4.093 (545 nm), 3.916 (610 nm); attenuation index κsi = 0.143 (435 nm), 0.036 (535 nm), 0.032 (545 nm), 0.020 (610 nm)] were taken from Jellison and Modine (1982) and the refractive indices of silica [nox = 1.4696 (435 nm), 1.4634 (535 nm), 1.4630 (545 nm), 1.4605 (610 nm)] were from Landolt and Börnstein (1962). The membrane was modeled with dmem = 4 nm and nmem = 1.45 (Gingell and Todd, 1979). The refractive index of water (nH2O = 1.333) was used for the cleft between the oxide and the membrane and for the bulk solution above the membrane with or without polymer or protein, respectively. The transition moments of excitation and emission of diI were assumed to be aligned parallel to the membrane plane with random orientation in the plane (Axelrod, 1979). Recent results show that the angle of the transition dipole to the membrane normal in fluid lipid bilayers is 62° (Lambacher and Fromherz, 2002). However, calculations show that the influence of this deviation on the fit results is much smaller than the fitting errors. The transition moments of GFP were assumed to be randomly orientated. The fluorescence lifetimes and therefore, kf and knr depend on the distance of the fluorophores from the silicon surface. This effect was taken into account as described in Lambacher and Fromherz (2002).
Fig. 3 shows theoretical fluorescence intensity curves that were calculated according to Eq. 3 for the two described layer systems. Fig. 3 A shows the effect of changing the cleft distance between the substrate and the supported membrane in the range between 0 and 10 nm. Fig. 3 B illustrates the dependence of the intensity profiles on the distance of a protein-bound fluorophore to the membrane surface in the range between 0 and 20 nm. The main effect of increasing these distances is a shift of the curves to the left. The plots show that these distances can be determined to a resolution of 1 nm or better with a fluorescence detection system of adequate signal/noise.
FIGURE 3.
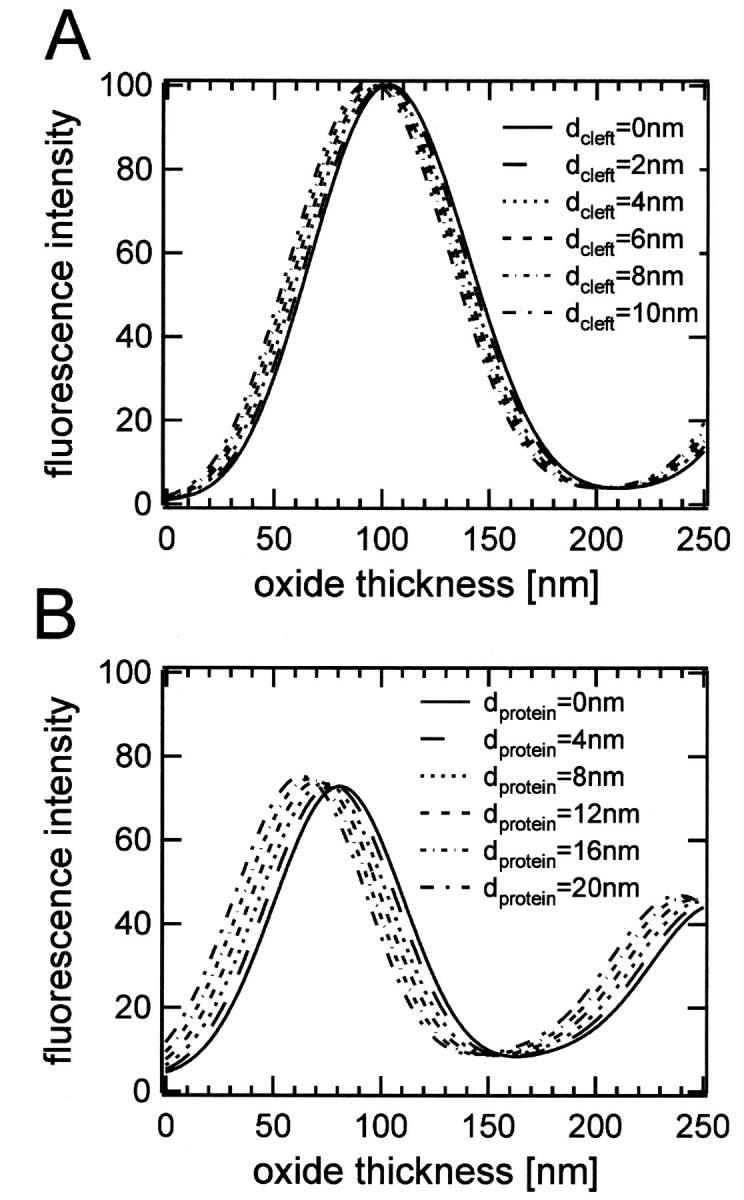
Theoretical FLIC curves as a function of oxide thickness demonstrating the effect of (A) increasing the cleft distance between the silicon dioxide and the membrane, and (B) the distance of the protein fluorophore from the membrane surface.
To evaluate the experimental data, the measured fluorescence intensities Fexp, averaged over the pixels of each silicon oxide terrace, were fitted to
 |
(4) |
using an algorithm developed by Braun and Fromherz (1997). The scaling factor a takes into account the efficiency of the optical detection system, and b is a constant accounting for all background fluorescence and stray light. The individual terraces of known oxide thickness were identified and assigned by their contrast in reflected red light. The three free fit parameters in fits of the experimental data to Eq. 4 are a, b, and the unknown distances dcleft for the bilayer system or dprot for the protein system.
Pex and Pem depend on the angles of the incoming and reflected light and therefore on the numerical aperture of the objective. Because the incoming light is not perfectly parallel in our optical setup, the effective N.A. is smaller than the nominal N.A. of 0.95 of the 63× objective. We determined the effective N.A. in the excitation path in preliminary experiments with standard calibration samples. Supported lipid bilayers were formed by vesicle adsorption (Kalb et al, 1992) on 16-oxide FLIC chips (Fig. 4). The intensities from the 16 oxide levels were evaluated by fitting Eq. 4 with four fit parameters. In addition to a, b, and dcleft, the N.A. in the excitation pathway was a free parameter in these experiments. For the width of the cleft we found dcleft = 1.9 ± 1.0 nm, which is in good agreement with previous determinations of this distance (Johnson et al. 1991; Fromherz et al. 1999) and for N.A.ex we found 0.86 ± 0.05. This value was used as a fixed parameter in all subsequent experiments. The N.A. of the emission path is not affected by the illumination geometry and therefore the value specified by the manufacturer N.A.em = 0.95 was used in all calculations.
FIGURE 4.
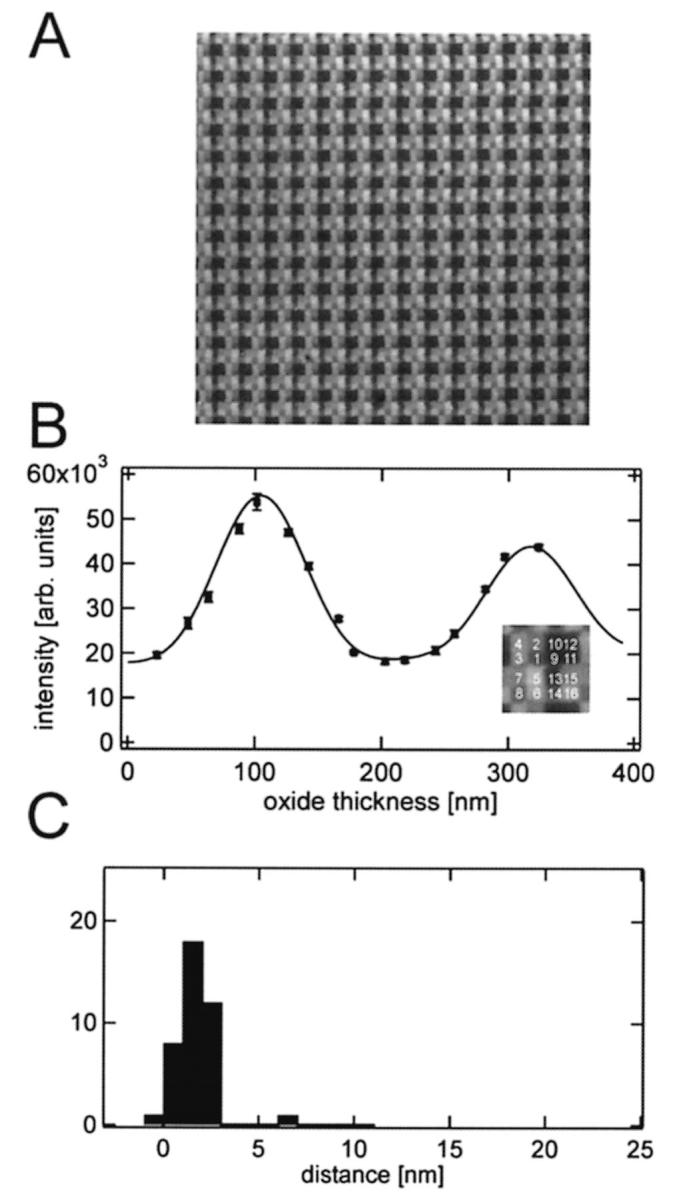
Supported POPC bilayer on a 16-oxide chip. (A) Fluorescence image of a 150 μm × 150 μm area of a polymer-supported membrane on a chip with 16 different oxide steps. Each square has a width of 2.5 μm. The bilayer contains 0.5 mol % diI and was prepared by direct vesicle fusion. (B) Fluorescence intensity versus oxide thickness and the best-fit FLIC curve of the 16 oxide levels are shown in the inset. The best-fit distance is dcleft = 1.9 ± 1.0 nm and the N.A.ex is 0.86 ± 0.05. (C) Cleft distances between silicon dioxide and the membrane obtained from 40 different areas on one chip using N.A.ex = 0.86 as a fixed parameter. The average cleft distance is 1.9 ± 0.8 nm.
RESULTS
Supported lipid bilayers
Fromherz et al. (1999) measured by FLIC microscopy the cleft distance between the bilayer of a giant vesicle that was adsorbed to a polylysine-coated 16-oxide chip and the chip surface to be 1.1 ± 0.2 nm. We wanted to know (1) how large the cleft distance is between planar supported lipid bilayers and a bare silicon oxide surface, (2) whether this distance depends on the method of supported bilayer preparation, and (3) whether the distance depends on the size of the oxide terraces on the chips that were used in this study. To address these points, we prepared supported bilayers on 4- and 16-oxide chips by direct vesicle fusion and by the Langmuir-Blodgett technique combined with vesicle fusion (Kalb et al., 1992). Four-oxide chips were compared to the 16-oxide chips used by Fromherz et al. (1999) because we found that the 16-oxide chips with the smaller terrace sizes were unsuitable for experiments with polymer-supported bilayers, as will be described in the next section.
Bilayers of POPC containing 0.5 mol % diI deposited on 16-oxide chips by direct vesicle fusion are shown in Fig. 4 A. These bilayers were also used for calibration of the N.A. of the microscope objective as described in the preceding section. A uniform coating with a single bilayer was achieved over the entire chip surface. The bilayer follows the contours of the oxide terraces of the chip. The fit of the data from one selected 16-terrace area to Eq. 4 is shown in Fig. 4 B. The distribution of cleft distances measured from 40 16-terrace areas is shown in Fig. 4 C. The average cleft distance was 1.9 ± 0.8 nm.
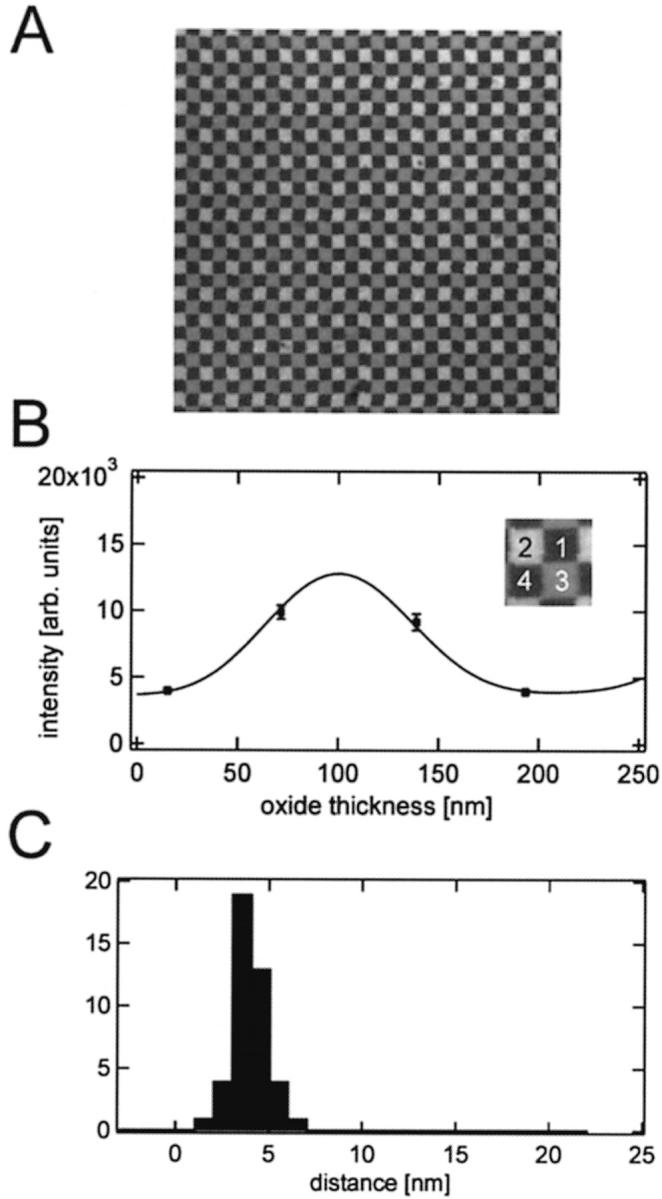
Fig. 5 A shows a supported bilayer of POPC containing 0.5 mol % diI formed by direct vesicle fusion on a four-oxide chip. Each oxide terrace measures 5 × 5 μm2 as opposed to 2.5 × 2.5 μm2 on the 16-oxide chip shown in Fig. 4. A uniform single bilayer was formed over the entire area. A fit of the data from a selected four-terrace area and cleft distance distributions obtained from fits to 44 independent areas are shown in Fig. 5, B and C, respectively. The average cleft distance was 1.7 ± 1.0 nm. Therefore, essentially the same cleft distance was obtained on 16- and 4-oxide chips.
FIGURE 5.
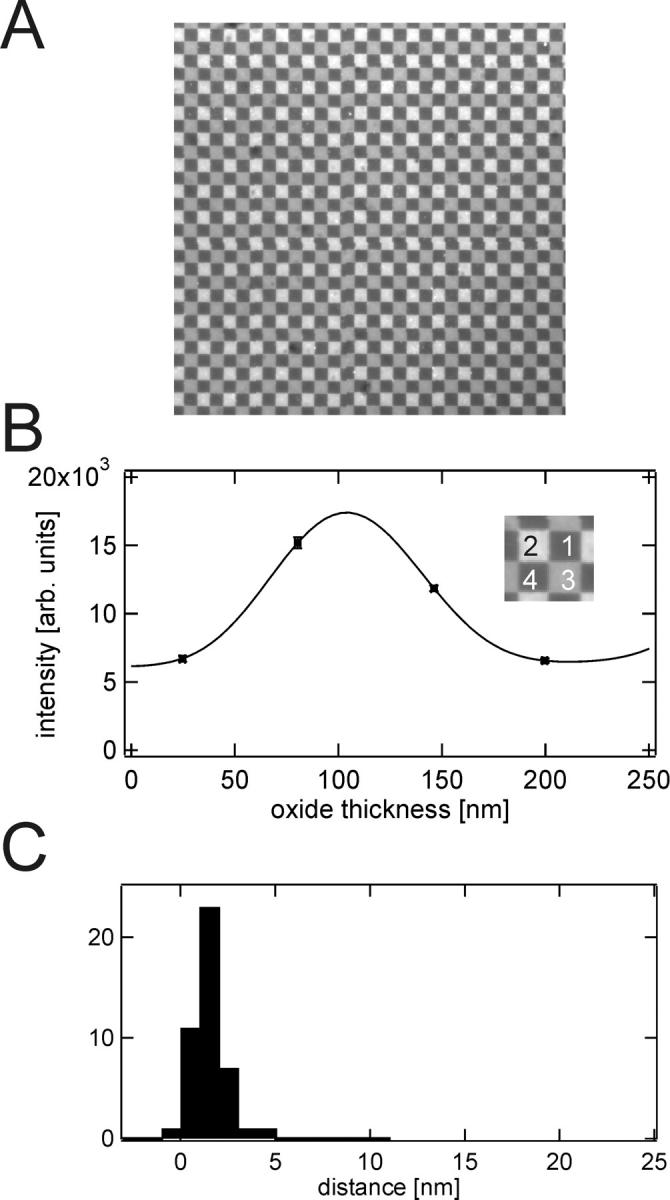
Supported POPC bilayer on a four-oxide chip. (A) Fluorescence image of a 150 μm × 150 μm area of a supported membrane on a chip with four different oxide steps. Each square has a width of 5 μm. The bilayer contains 0.5 mol % diI and was prepared by direct vesicle fusion. (B) Fluorescence intensity versus oxide thickness and the best-fit FLIC curve of the four oxide levels are shown in the inset. The best-fit distance is dcleft = 1.2 ± 1.5 nm. (C) Cleft distances between silicon dioxide and the membrane obtained from 44 different oxide quartets on one chip. The average cleft distance is 1.7 ± 1.0 nm.
Next, we examined whether asymmetric bilayers deposited by a combined Langmuir-Blodgett/vesicle fusion technique were supported at the same distance from the silicon oxide substrate as those prepared by direct vesicle fusion. To this end, a monolayer of DOPC was first deposited onto four-oxide FLIC chips by Langmuir-Blodgett transfer at 32 mN/m. Lipid vesicles consisting of POPC and 0.5 mol % diI were then fused to the monolayer to form the second leaflet of the supported bilayer (Kalb et al., 1992). We again observed uniform single lipid bilayers on these surfaces, very similar to that shown in Fig. 5 A. The average cleft distance determined from 40 independent measurements was 1.4 ± 0.8 nm (data not shown). Taken together, these experiments show that the cleft distance between supported planar lipid bilayers and bare silicon oxide surfaces is 1–2 nm, independent of the choice of the silicon chip and independent of the method of bilayer preparation (Table 1).
TABLE 1.
Summary of distances measured by FLIC microscopy
| System | Method of preparation | Oxide steps | Results | Distance (nm) |
|---|---|---|---|---|
| Supported bilayer | Vesicle fusion | 16 | Oxide-membrane | 1.9 ± 0.8 |
| Supported bilayer | Vesicle fusion | 4 | Oxide-membrane | 1.7 ± 1.0 |
| Supported bilayer | L-B/vesicle fusion* | 4 | Oxide-membrane | 1.4 ± 0.8 |
| Polymer-supported bilayer | L-B/vesicle fusion | 16 | Oxide-membrane | 0.9 ± 1.0 |
| Polymer-supported bilayer | L-B/vesicle fusion | 4 | Oxide-membrane | 3.9 ± 0.9 |
| GFP-VAMP bound to t-SNARE | L-B/vesicle fusion | 4 | Membrane-GFP | 16.5 ± 2.8 |
L-B, Langmuir-Blodgett.
Polymer-supported lipid bilayers
Tethered polymer-supported bilayers consisting of 97 mol % DOPC and 3 mol % of the polymer lipid DPS in the substrate-exposed monolayer and POPC in the distal monolayer were prepared on 4- and 16-oxide FLIC chips, and on silicon chips with homogenous oxide. Such bilayers had been previously prepared and characterized on quartz microscope slides (Wagner and Tamm 2000; 2001). To measure the lateral diffusion of the constituent lipids by FRAP, we used chips with homogenous oxide to avoid inhomogeneous photobleaching. In these experiments, 0.5 mol % NBDegg-PC was included in the distal monolayer. The average lateral diffusion coefficient was 0.73 ± 0.09 × 10⁻⁸ cm2/s and the mobile fraction was 78 ± 3%. These values are similar to those previously determined with bilayers of the same composition, but supported on quartz slides (Wagner and Tamm, 2000).
We first attempted to measure by FLIC microscopy the cleft distance between polymer-supported bilayers and the silicon oxide surface on 16-oxide chips. Uniformly diI-labeled (or NBD-eggPE-labeled) polymer-supported bilayers were readily prepared on these surfaces. Although no visible defects were apparent in these bilayers, the average distance obtained from 45 independent fits was only 0.9 ± 1.0 nm (data not shown). This short distance indicates that the polymer may have collapsed on these highly patterned chips, perhaps by the action of excessive surface tension forces at the oxide steps that occur on these chips with high spatial frequency. To avoid this problem, we manufactured four-oxide silicon chips that had larger terraces and fewer steps between oxide levels. Tethered polymer-supported bilayers were formed by fusion of POPC vesicles with 0.5 mol % diI on a polymer-supported monolayer consisting of 97 mol % DOPC and 3 mol % DPS. Fig. 6 A shows a fluorescent image of such a preparation. The oxide steps were identified from a reflected light image of the same area of observation. The fluorescence intensity data of individual terraces were averaged and individual data quartets were fitted to Eq. 4 (Fig. 6 B). Resulting cleft distances between the silicon oxide surface and the membrane obtained from fits of 41 independent data quartets are shown in the histogram of Fig. 6 C. The average cleft distance was 3.9 ± 0.9 nm. This distance is significantly larger than the cleft distance in supported bilayers without the polymer. Therefore, the polymer does lift the bilayer from the surface as was suspected earlier (Wagner and Tamm, 2000), but measured here for the first time. The measured distance is in fact in the range that would be expected for grafted polyethylene glycols of molecular weight 3400 in random coil (mushroom) conformations (4.8 nm; Wagner and Tamm, 2000).
FIGURE 6.
Tethered polymer-supported bilayer on a four-oxide chip. (A) Fluorescence image of a 150 μm × 150 μm area of a tethered polymer-supported membrane on a chip with four different oxide steps. Each square has a width of 5 μm. (B) Fluorescence intensity versus oxide thickness and the best-fit FLIC curve of the four oxide levels are shown in the inset. The best-fit distance is dcleft = 3.3 ± 2.0 nm. (C) Cleft distances between silicon dioxide and the membrane obtained from 45 different oxide quartets on one chip. The average cleft distance is 3.9 ± 0.9 nm.
GFP-VAMP bound to t-SNAREs in polymer-supported lipid bilayers
Alexa488-labeled t-SNAREs were used to verify the reconstitution of t-SNAREs into polymer-supported bilayers. Tethered polymer-supported monolayers were prepared as described above on homogenous silicon oxide chips. POPC vesicles containing reconstituted Alexa488-t-SNAREs at a protein/lipid ratio of 1:400 were allowed to fuse with the supported monolayer. Uniformly fluorescent bilayers were obtained. Lateral diffusion of these integral membrane proteins in the polymer-supported bilayers was measured by FRAP. The lateral diffusion coefficient of the t-SNAREs averaged from 12 independent FRAP experiments was 0.9 ± 0.1 × 10⁻⁸ cm2/s and the mobile fraction was 64 ± 5%. These values are in good agreement with those previously obtained for t-SNAREs that were reconstituted in polymer-supported bilayers on quartz slides (Wagner and Tamm, 2001).
VAMP is a v-SNARE that forms a tight four-helix bundle complex with the t-SNARE syntaxin 1A/SNAP25 (Sutton et al., 1998). Like syntaxin1A, VAMP is an integral membrane protein with a single helical transmembrane domain at its C-terminus. To demonstrate the specific binding of a protein ligand to t-SNARE receptors in polymer-supported bilayers, we used a soluble form of VAMP with a deleted C-terminal transmembrane domain, but with a GFP fused to its N-terminus. Soluble GFP-VAMP was bound to unlabeled t-SNAREs in polymer-supported bilayers on four-oxide chips as previously demonstrated on quartz slides (Wagner and Tamm, 2001). GFP-VAMP was allowed to bind for 1 h before nonspecifically bound protein was washed away. Fig. 7 A shows a fluorescent image of such a preparation. The fluorescence intensity was much lower than in diI-labeled bilayers and a small amount of aggregated proteins could be seen as bright spots. These aggregates were sufficiently sparse on the otherwise uniformly fluorescent silicon oxide terraces so that they could be deselected when averaging pixels in individual fluorescent squares. The fluorescence data was fitted to Eq. 4 using the optical model of Fig. 2 B, right panel, and a cleft distance of 3.9 nm as a fixed parameter. This is the same distance that we measured in the polymer-supported bilayers of identical lipid composition and using identical bilayer preparation methods (see preceding section). Apart from the optical scaling factor and a constant for background fluorescence, the only free fit parameter in these fits was the distance between the protein fluorophore and the membrane surface. The best-fit curve from a single four-oxide area is shown in Fig. 7 B. The distance between GFP and the membrane surface was 16.4 ± 2.9 nm in this example. The distances obtained in the same manner from fitting 59 independent oxide quartets are displayed in the histogram of Fig. 7 C. The average GFP-membrane distance was 16.5 nm ± 2.8 nm. In control experiments, soluble GFP-VAMP was added to polymer-supported bilayers without t-SNAREs. After flushing the cell with buffer, essentially no fluorescence could be observed and, hence, no protein remained nonspecifically bound to the bilayer.
FIGURE 7.
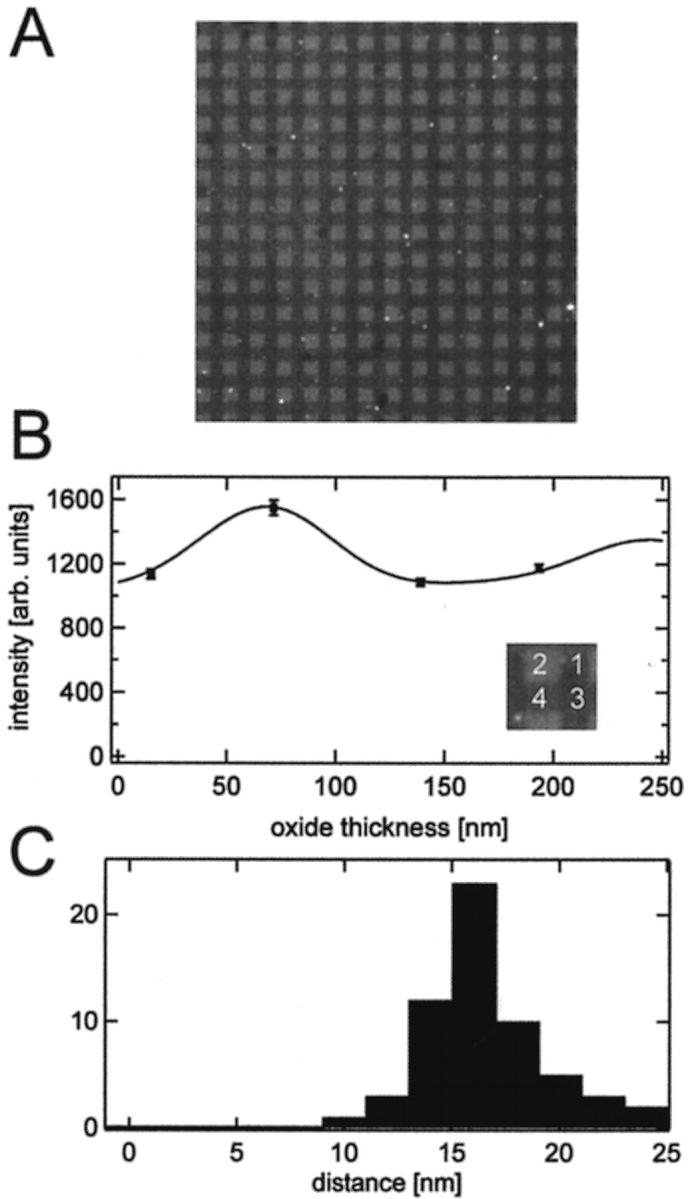
GFP-VAMP bound to t-SNAREs in a polymer-supported bilayer on a four-oxide chip. (A) Fluorescence image of a 150 μm × 150 μm area of a tethered polymer-supported membrane with reconstituted t-SNAREs and bound soluble GFP-VAMP proteins on a chip with four different oxide steps. Each square has a width of 5 μm. (B) Fluorescence intensity versus oxide thickness and the best-fit FLIC curve of the four oxide levels are shown in the inset. The best-fit distance between protein and the membrane surface is dprot = 16.4 ± 2.9 nm. (C) Distances between GFP and the membrane surface obtained from 59 different oxide quartets on one chip. The average distance is 16.5 ± 2.8 nm.
DISCUSSION
An important parameter to control in the design of supported bilayers is the distance of the bilayer from the surface of the substrate. There are not many techniques available that yield accurate measurements of bilayer-substrate distances in aqueous solutions. Because supported phospholipid bilayers are only defined in aqueous environments, an analytical tool for measuring these distances under water is essential. This requirement becomes even more stringent for measurements of distances in supported membranes with reconstituted proteins, i.e., supported membranes that are designed to mimic natural biomembranes. Therefore, we have explored in this study whether distances of fluorophores that are placed in different positions of the membrane can be accurately and reproducibly measured by FLIC microscopy, which is a relatively new method in the arsenal of light microscopic techniques (Lambacher and Fromherz, 1996).
In a first set of experiments, we verified that the FLIC microscopy technique reproduces the same cleft distances that were previously known to exist between conventional supported bilayers and hydrophilic quartz, glass, or silicon oxide supports. In these experiments, we also tested whether the method of supported bilayer preparation or the size of the oxide terraces that are used on FLIC chips have any impact on the observed distances. We found that supported phosphatidylcholine bilayers are separated by a 1.4–1.9 nm water-filled gap from the silicon dioxide surface of oxidized silicon chips, irrespective of whether the bilayers were prepared by direct fusion of large unilamellar vesicles to bare chip surfaces or by a combined Langmuir-Blodgett/vesicle-fusion technique (Kalb et al., 1992) and irrespective of whether chips with 5 × 5 μm2 terraces (four oxide steps) or 2.5 × 2.5 μm2 terraces (16 oxide steps) were used (Table 1). The distance of 1.4–1.9 nm found here is slightly smaller than the 3 ± 1 nm estimated from neutron reflectivity measurements of supported dimyristoyl-phosphatidylcholine bilayers on quartz (Johnson et al., 1991) and slightly larger than the 1.1 ± 0.2 nm measured by FLIC microscopy between a giant POPC vesicle containing 1 mol % of the negatively charged lipid dioleoyl-phosphatidyl-methylester and a polylysine-coated FLIC chip surface (Fromherz et al., 1999). The distance determined by neutron reflectivity may have been overestimated slightly in the multiparameter fitting procedure that was used to fit those experimental data. The giant vesicle may have been more attracted by electrostatic forces to the polylysine-coated substrate than our uncharged planar supported bilayers may be attracted to the uncoated silicon dioxide surface. Therefore, we believe that ∼1.7 nm is a good measure of the actual distance of supported phosphatidylcholine bilayers from oxidized silicon and quartz-like surfaces.
Many integral membrane proteins protrude from the membrane surface more than 1.7 nm. In addition, the surface of many substrates that are commonly used to prepare supported bilayers may not be totally flat, but rather rough. Therefore, integral membrane proteins often tend to stick to the surface of the substrate when reconstituted into supported bilayers. This unwanted behavior is relatively easily detected by measuring the lateral diffusion (mobile fractions and diffusion coefficients) of membrane proteins in supported membranes by FRAP. To overcome these problems, several investigators have begun to lift supported bilayers from the substrate by inserting a hydrophilic polymer cushion between the substrate and the membrane. For example, our approach was to construct tethered polymer-supported bilayers by covalent linkage of some of the phospholipids to the substrate with a 3400-Da polyethylene glycol chain (Wagner and Tamm, 2000). Although the lateral mobility of several membrane proteins was increased in this system, the actual thickness of the hydrated polymer layer between the substrate and membrane was not known. The 3.9 ± 0.9 nm measured here by FLIC microscopy provide to our knowledge the first such measurement for a polymer-supported bilayer system that has proved to be effective to mobilize integral membrane proteins. Wong et al. (1999) measured the thicknesses of polyethyleneimine layers between quartz and supported bilayers by neutron reflectivity. These authors found thicknesses ranging from 4 to 17 nm, depending on the sample preparation method. Unfortunately, no micrographs or diffusion measurements showing the integrity of these bilayers have been provided. Therefore, it is not clear which of their preparation methods result in continuous bilayers and to what extent their systems are comparable to ours.
Our measured thickness of ∼3.9 nm for the polyethylene glycol layer is only a little smaller than what would be theoretically expected if polyethylene glycol behaved as an ideal random coil when sandwiched between the substrate and membrane. The expected Flory distance from the de Gennes theory of a grafted random polymer of 77 units of 3.5 Å each would be 4.8 nm (de Gennes, 1987; Wagner and Tamm, 2000). Apparently, the polymer layer is only slightly (if at all) compressed from the ideal random coil behavior by the bilayer it suspends. The well-behaved polymer cushion explains the observation of the relatively free lateral diffusion of several integral membrane proteins including t-SNAREs. The t-SNAREs exhibited a mobile fraction of 64 ± 5% on oxidized silicon chips (this work) compared to 57 ± 7% on quartz slides (Wagner and Tamm, 2001). The lateral diffusion coefficients were 0.7 ± 0.1 and 0.9 ± 0.1 × 10⁻⁸ cm2/s on the two substrates, respectively. These are normal diffusion coefficients for unrestricted diffusion of membrane proteins in lipid bilayers.
It is interesting that our repeated attempts to prepare polyethylene glycol-supported bilayers on 16-oxide chips failed in the sense that we always measured very short substrate-bilayer distances in these systems. The average distance was found to be only 0.9 ± 1.0 nm, which is even smaller than the distance without the polymer (Table 1). It appears that the polymer layer is collapsed on these substrates with small terraces, which measure only 2.5 × 2.5 μm2. Capillary forces at the edges of these small terraces may overcome polymer hydration forces that appear to dominate on the larger (5 × 5 μm2) terraces. Edge capillary forces may tend to pull the membranes down toward the substrate whereas polymer hydration forces will suspend the bilayers far above the silicon oxide surface. Apparently, the balance between these two (and perhaps other) forces is quite delicate and depends critically on the size of the terraces used in FLIC microscopy.
FLIC microscopy has the potential to become a powerful method to measure distances of membrane-bound proteins, i.e., fluorophores on membrane-bound proteins, from the membrane surface. To test this possibility, we reconstituted in a first application t-SNAREs into polymer-supported bilayers and bound soluble GFP-VAMP to the reconstituted t-SNAREs. The distance between the GFP and the membrane was found to be 16.5 ± 2.8 nm in this system. One reason for the larger standard deviation in this experiment are the heights of the oxide terraces. They lie in regions where the slope of the fluorescence curve is high for diI in lipid membranes but low for GFP further away from the silicon-silicon oxide interface. Choosing 30–40 nm lower oxide terraces would optimize the results for proteins like the GFP-SNARE complex (see Fig. 3 B). Another reason for the larger standard deviation could be the flexibility of the protein complex as a whole and/or segmental flexibility because the GFP is probably not rigidly linked to the N-terminus of VAMP. There may also be a small systematic error associated with the GFP distance measurement because the orientations of the transition dipole moments of GFP are not known (see Materials and Methods). The crystal structure of the SNARE complex (comprising t-SNARE and VAMP) reveals an ∼12 nm long rod-shaped structure (Sutton et al., 1998). The structure of GFP resembles a cylinder with a diameter of ∼3 nm and a length of ∼4 nm (Yang et al. 1996). The chromophore of GFP is located in the center of its structure. Therefore, the fully extended length from the C-termini of the SNARE complex to the chromophore of the SNARE-linked GFP is expected to be ∼14 nm. Comparing this number to our experimental number for the distance of the chromophore from the membrane surface (16.5 ± 2.8 nm), we conclude that the SNARE complex projects from the membrane surface perpendicularly. Of course, this orientation has so far only been measured with a SNARE complex with the transmembrane domain of VAMP deleted and in the absence of a second membrane. It will be interesting to see whether the transmembrane domain of VAMP, a second membrane into which VAMP may be reconstituted, and other factors that are thought to be important in SNARE-mediated membrane fusion affect the orientation of the SNARE complex relative to the membranes.
Acknowledgments
We thank Dr. P. Fromherz (Max-Planck-Institute for Biochemistry, Martinsried, Germany) for allowing us to manufacture FLIC chips in his laboratory and for providing the FLIC fitting software, and Drs. J. Rothman and T. Melia (Memorial Sloan-Kettering Cancer Center, New York) for the generous gift of the SNARE proteins used in this study. We also thank Drs. D. Braun and A. Lambacher for helpful discussions on the FLIC theory.
This work was supported by National Institutes of Health (AI30557). V.K. was supported by a postdoctoral fellowship from the Deutsche Forschungsgemeinschaft.
Abbreviations used: DiI, 1,1-dioctadecyl-3,3,3,3-tetramethylindocarbocyanineperchlorate; DMPE, 1,2-dimyristoyl-sn-glycero-3-phosphoethanolamine; DOPC, 1,2-dioleoyl-sn-glycero-3-phosphocholine DPS -DMPE-PEG-triethoxysilane; FLIC, fluorescence interference-contrast; FRAP, fluorescence recovery after photobleaching; GFP, green fluorescent protein; HEPES, N-[2-hydroxyethyl]piperazine-N′-[2-ethanesulfonic acid]); NBD-eggPE -N-(7-nitrobenz-2-oxa-1,3-diazol-4-yl)-egg phosphoethanolamine; β-OG, β-octylglucoside; PEG, poly(ethylene glycol); POPC, 1-palmitoyl-2-oleoyl-sn-glycero-3-phosphocholine; RB, reconstitution buffer (25 mM HEPES/KOH, 100 mM KCl, pH 7.4); SNAP, soluble NSF (N-ethylmaleimide-sensitive factor)-attachment protein; SNAP-25, synaptosome-associated protein of 25 kDa; SNARE, SNAP receptor; t-SNARE, target SNARE; v-SNARE, vesicle SNARE; VAMP, vesicle-associated membrane protein.
References
- Axelrod, D. 1979. Carbocyanine dye orientation in red cell membrane studied by microscopic fluorescence polarization. Biophys. J. 26:557–573. [DOI] [PMC free article] [PubMed] [Google Scholar]
- Boxer, S. G. 2000. Molecular transport and organization in supported lipid membranes. Curr. Opin. Chem. Biol. 4:704–709. [DOI] [PubMed] [Google Scholar]
- Braun, D., and P. Fromherz. 1997. Fluorescence interference-contrast microscopy of cell adhesion on oxidized silicon. Appl. Phys. A. 65:341–348. [Google Scholar]
- Braun, D., and P. Fromherz. 1998. Fluorescence interferometry of neuronal cell adhesion on microstructured silicon. Phys. Rev. Let. 81:5241–5244. [Google Scholar]
- de Gennes, P. G. 1987. Polymers at an interface: a simplified view. Adv. Colloid Interface Sci. 27:189–209. [Google Scholar]
- Fromherz, P., V. Kiessling, K. Kottig, and G. Zeck. 1999. Membrane transistor with giant lipid vesicle touching a silicon chip. Appl. Phys. A. 69:571–576. [Google Scholar]
- Gingell, D., and L. Todd. 1979. Interference reflection microscopy. A quantitative theory for image interpretation and its application to cell-substratum separation measurement. Biophys. J. 26:507–526. [DOI] [PMC free article] [PubMed] [Google Scholar]
- Hinterdorfer, P., G. Baber, and L. K. Tamm. 1994. Reconstitution of membrane fusion sites. A total internal reflection fluorescence microscopy study of influenza hemagglutinin-mediated membrane fusion. J. Biol. Chem. 269:20360–20368. [PubMed] [Google Scholar]
- Jellison, G. E., and F. A. Modine. 1982. Optical constants for silicon at 300 and 10 K determined from 1.64 to 4.73 eV by ellipsometry. J. Appl. Phys. 53:3745–3753. [Google Scholar]
- Johnson, S. J., T. M. Bayerl, D. C. McDermott, G. W. Adam, A. R. Rennie, R. K. Thomas, and E. Sackman. 1991. Structure of an adsorbed dimyristoylphosphatidylcholine bilayer measured with specular reflection of neutrons. Biophys. J. 59:289–294. [DOI] [PMC free article] [PubMed] [Google Scholar]
- Kalb, E., S. Frey, and L. K. Tamm. 1992. Formation of supported planar bilayers by fusion of vesicles to supported phospholipid monolayers. Biochim. Biophys. Acta. 1103:307–316. [DOI] [PubMed] [Google Scholar]
- Lambacher, A., and P. Fromherz. 1996. Fluorescence interference-contrast microscopy on oxidized silicon using a monomolecular dye layer. Appl. Phys. A. 63:207–216. [Google Scholar]
- Lambacher, A., and P. Fromherz. 2001. Orientation of hemicyanine dye in lipid membrane measured by fluorescence interferometry on a silicon chip. J. Phys. Chem. B. 105:343–346. [Google Scholar]
- Lambacher, A., and P. Fromherz. 2002. Luminescence of dye molecules on oxidized silicon and fluorescence interference contrast microscopy of biomembranes. J. Opt. Soc. Am. B. 19:1435–1453. [Google Scholar]
- Landolt, H., and R. Börnstein. 1962. Numerical Data and Functional Relationships in Science and Technology. 6th ed, Vol. 2. Springer, Berlin.
- Naumann, C., C. Dietrich, A. Behrisch, T. Bayerl, M. Schleicher, D. Bucknall, and E. Sackmann. 1996. Hisactophilin-mediated binding of actin to lipid lamellae: A neutron reflectivity study of protein membrane coupling. Biophys. J. 71:811–823. [DOI] [PMC free article] [PubMed] [Google Scholar]
- Parlati, F., T. Weber, J. A. McNew, B. Westermann, T. H. Söllner, and J. E. Rothmann. 1999. Rapid and efficient fusion of phospholipid vesicles by the α-helical core of a SNARE complex in the absence of an N-terminal regulatory domain. Proc. Natl. Acad. Sci. USA. 96:12565–12570. [DOI] [PMC free article] [PubMed] [Google Scholar]
- Sackmann, E., and M. Tanaka. 2000. Supported membranes on soft polymer cushions: fabrication, characterization and applications. Trends Biotechnol. 18:58–64. [DOI] [PubMed] [Google Scholar]
- Sutton, R. B., D. Fasshauer, R. Jahn, and A. T. Brunger. 1998. Crystal structure of a SNARE complex involved in synaptic exocytosis at 2.4 Angstroem resolution. Nature. 395:347–353. [DOI] [PubMed] [Google Scholar]
- Tamm, L. K., and H. M. McConnell. 1985. Supported phospholipid bilayers. Biophys. J. 47:105–113. [DOI] [PMC free article] [PubMed] [Google Scholar]
- Tamm, L. K. 1988. Lateral diffusion and fluorescence microscope studies on a monoclonal antibody specifically bound to supported phospholipid bilayers. Biochemistry. 27:1450–1457. [DOI] [PubMed] [Google Scholar]
- Tamm, L. K. 1993. Total internal reflectance fluorescence microscopy. In Optical Microscopy: Emerging Methods and Applications. Academic Press, San Diego, CA. 295–337.
- Wagner, M. L., and L. K. Tamm. 2000. Tethered polymer-supported planar lipid bilayers for reconstitution of integral membrane proteins: silane-polyethyleneglycol-lipid as a cushion and covalent linker. Biophys. J. 79:1400–1414. [DOI] [PMC free article] [PubMed] [Google Scholar]
- Wagner, M. L., and L. K. Tamm. 2001. Reconstituted syntaxin1A/SNAP25 interacts with negatively charged lipids as measured by lateral diffusion in planar supported bilayers. Biophys. J. 81:266–275. [DOI] [PMC free article] [PubMed] [Google Scholar]
- Wong, J. Y., J. Majewski, M. Steitz, C. K. Park, J. N. Israelachvili, and G. S. Smith. 1999. Polymer-cushioned bilayers. I. Structural study of various preparation methods using neutron reflectometery. Biophys. J. 77:1445–1457. [DOI] [PMC free article] [PubMed] [Google Scholar]
- Yang, F., L. G. Moss, and G. N. Phillips. 1996. The molecular structure of green-fluorescent protein. Nature Biotech. 14:1246–1251. [DOI] [PubMed] [Google Scholar]