

Abstract
Sequence-dependent configuration changes and condensation of double-stranded poly(dG-dC)·(dG-dC) (GC-DNA) and ds poly(dA-dT)·(dA-dT) (AT-DNA) were observed by atomic force microscopy in the presence of Ni(II). Less condensing agent was required to generate configuration changes in GC-DNA as compared to AT-DNA. In the presence of Ni(II) cations, GC-DNA adopted a Z-type conformation and underwent a stepwise condensation, starting with partial intramolecular folding, followed by intermolecular condensation of two to several molecules and ending with the formation of toroids, rods, and jumbles. GC-DNA condensates were unusual in that the most highly condensed regions were surrounded by loops of ds GC-DNA. In contrast, AT-DNA retained its B-type conformation and displayed only minor condensation even at high Ni(II) concentrations. The Ni(II)-dependent differences in condensation between GC-DNA and AT-DNA are predicted by an extension of the electrostatic zipper motif proposed by Kornyshev and Leikin, in which we account for shorter than Debye screening length surface separations between the DNA molecules and for the Ni(II)-induced conformation change of GC-DNA to Z-DNA.
INTRODUCTION
DNA condensation has been studied for almost 30 years (Evdokimov et al., 1972). DNA condenses when packed into bacteria, eukaryotic nuclei, and viruses. DNA condensation and decondensation are involved in gene expression, chromosomal changes during the cell cycle, and in the delivery of genes in gene therapy.
DNA molecules have been observed to condense into many different forms. Toroids and rods (Arscott et al., 1990; Golan et al., 1999; Laemmli, 1975), flowerlike structures (Fang and Hoh 1998; Inman, 1967), and globular structures (Blessing et al., 1998) are a few of the condensed DNA structures commonly observed. Both single and multiple strands may be involved in each aggregate. We present here a new DNA condensate, which appears as a toroidal or rodlike condensate surrounded by loops of double-stranded (ds) DNA.
The geometry of the environment also affects how DNA condenses, as discussed in a recent review (Hansma, 2001). Protamine condenses DNA more tightly when condensation occurs on the sample surface than when condensation occurs in solution (Allen et al., 1997). The same conclusion appears to be valid for DNA condensed by silanes, by comparing images of condensates produced on the sample surface (Fang and Hoh, 1998) versus in solution (Fang and Hoh, 1999). “Surface biology” (Kindt et al., 2002)—the understanding of biology at surfaces—may well become a vital new research direction in the new century.
DNA condensation is somewhat of a theoretical puzzle (Gelbart et al., 2000), inasmuch as Poisson-Boltzmann theory predicts that negatively charged DNA molecules should repel each other regardless of the charge on the neutralizing counterion. The observation that DNA does indeed condense has inspired new approaches such as the ionic-crystal model and the charge-fluctuation model. For a review, see Ha and Liu, 2000. The question has also been raised whether there are one or many different pathways for DNA condensation (Fang and Hoh, 1998).
The synthetic dsDNA molecules poly (dG-dC)·(dG-dC) and poly (dA-dT)·(dA-dT) are useful for studying DNA condensation in terms of the interactions between guanine and cytosine compared to those between adenine and thymine. These dsDNA molecules are used here in our investigations of sequence-dependent DNA condensation. The poly (dG-dC)·(dG-dC) molecule also has a direct biological correlation to GC-dominated telomeres, the end caps of chromosomes.
MATERIALS AND METHODS
Materials
Poly (dG-dC)·(dC-dG) (GC-DNA) and poly (dA-dT)·(dT-dA) (AT-DNA) were obtained from Pharmacia (Piscataway, NJ). These are ∼800 bp strands of synthetic dsDNA. NiCl2-DNA solutions were prepared with final concentrations of 10 mM Hepes (pH 7.0), 0.1 mM–6 mM NiCl2, and 2.5 ng/μL of GC-DNA or AT-DNA. These solutions were either used immediately or refrigerated for ∼24 h–2 months before use, as specified in the figure legends.
Sample preparation
The Ni(II)-DNA samples were prepared in two ways. The first was to place 20 μL solution that had been prepared earlier onto freshly cleaved ruby mica. This solution was incubated on the mica at room temperature for 2 min before being thoroughly rinsed with 2–4 mL MilliQ-purified water. The DNA was strongly attached to the mica substrate, and lighter rinsing with only 1–1.5 mL MilliQ water was observed to have little effect on the final sample. These samples were imaged both in air and a 10-mM Hepes (pH 7.0) buffer. The DNA was also imaged in the nickel solution directly by placing a 30-μL drop of NiCl2-DNA solution on a cantilever and imaging.
Noncondensed (control) samples of DNA on mica, contained 10 mM Hepes (pH 7.0), 2.5 mM MgCl2, and 2.5 ng/μL GC-DNA or AT-DNA. A 1-μL drop of 1 mM NiCl2 was placed on freshly cleaved mica for 2 min, then rinsed with purified water (Bezanilla et al., 1994). A 20-μL drop of the magnesium-DNA solution was then deposited on this prepared mica for 2 min before being thoroughly rinsed. DNA affixed in this manner was also strongly bonded to the substrate.
Other details of sample preparation are in the figure legends.
AFM imaging
A commercial AFM (Nanoscope III, Digital Instruments, Santa Barbara, CA) was used to image both dry and aqueous samples. The probes used for dry imaging were 125-μm-long silicon cantilevers. The probes used for imaging in solution were 100-μm-long silicon-nitride V-shaped cantilevers with oxide-sharpened tips. Images were recorded and analyzed using Nanoscope Version 4 software; additional analysis was performed with NIH Image. Nanoscope bearing analysis was used to estimate the number of strands of dsDNA in the DNA-bundle cross sections.
RESULTS
GC-DNA in Ni(II) condensed into three categories of structures: toroids, rods, and jumbles. These structures consistently displayed free ends and loops of dsDNA emanating from the ends and sides of each structure.
There was a striking difference in the necessary conditions for condensation of GC-DNA versus AT-DNA. GC-DNA formed distinct condensed structures in NiCl2 concentrations as low as 0.5 mM (Fig. 1 A). Conversely, AT-DNA required ∼6 mM NiCl2 before even small condensed structures were formed over the same period of time (Fig. 1 B).
FIGURE 1.
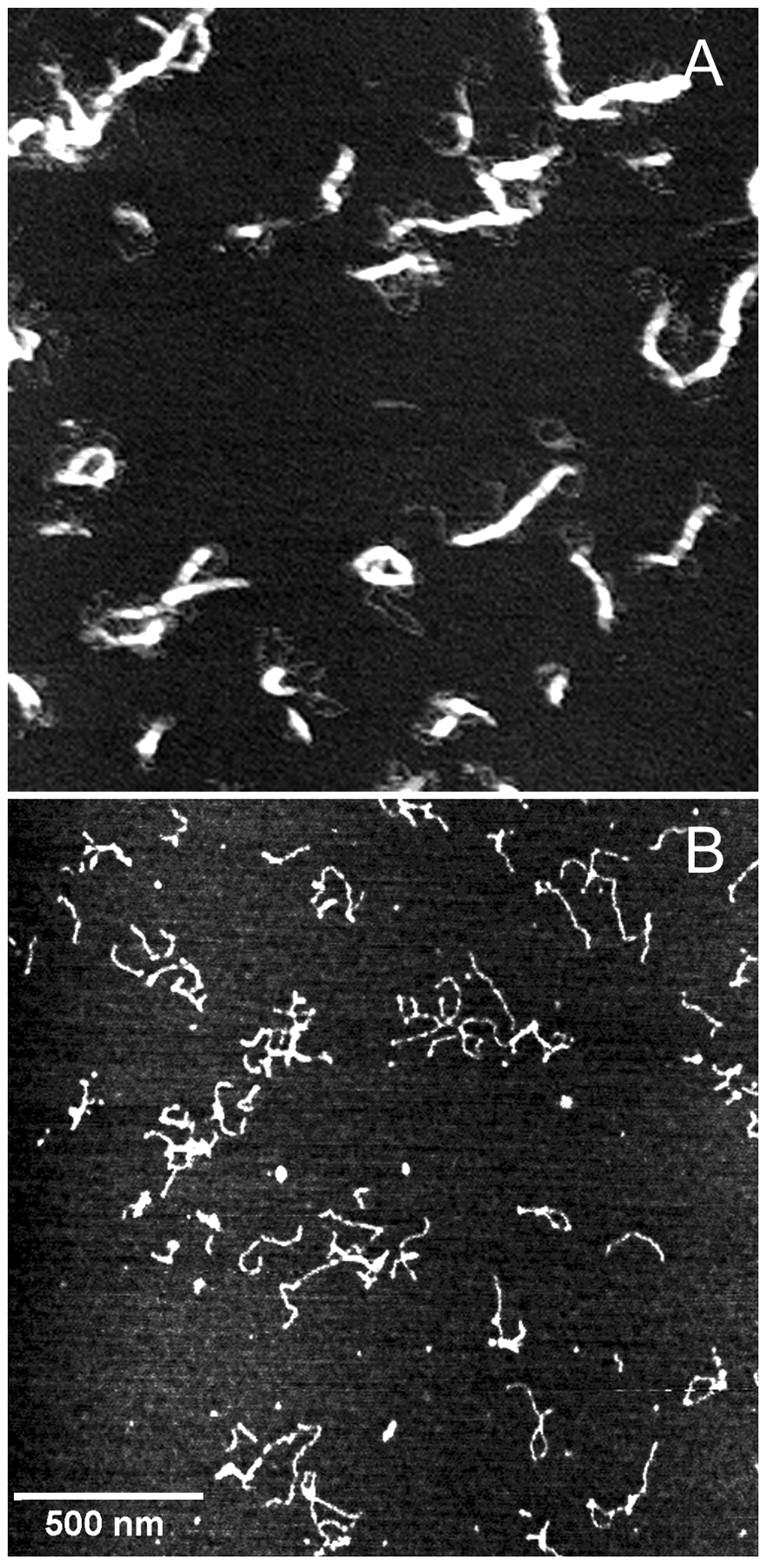
DNA condensed in Ni(II) for 3–5 min. (A) GC-DNA, 2.5 ng/μl, condensed in 0.5 mM NiCl2. (B) AT-DNA, 2.5 ng/μl, condensed in 6 mM NiCl2. Structures in (A) are composed of many strands of DNA, whereas structures in (B) contain only a few strands. The scale bar applies to both images.
Time course of GC-DNA condensation
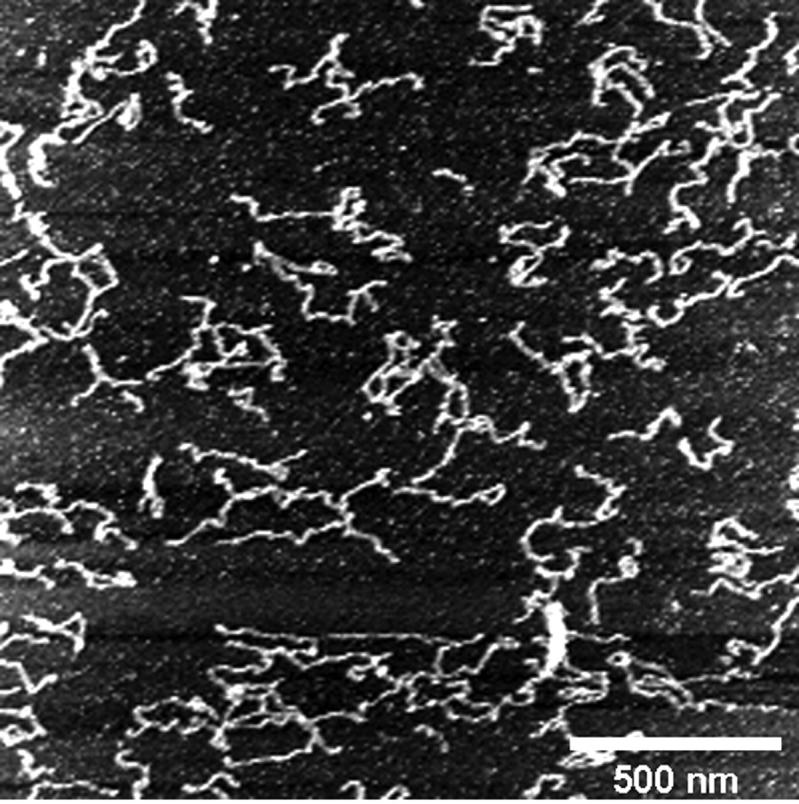
In the absence of Ni(II), linear GC-DNA molecules are observed (Fig. 2). A series of Ni(II)-containing samples was prepared that displayed GC-DNA condensation at varying lengths of time. The GC-DNA condensed in a stepwise fashion (Fig. 3).
FIGURE 2.

Uncondensed GC-DNA in Hepes buffer (pH 7.0) on mica, without Ni(II). Sample was prepared by placing 10 μl DNA solution on cleaved mica for 2 min, then gently rinsing with ∼2 ml ultrapure water.
FIGURE 3.
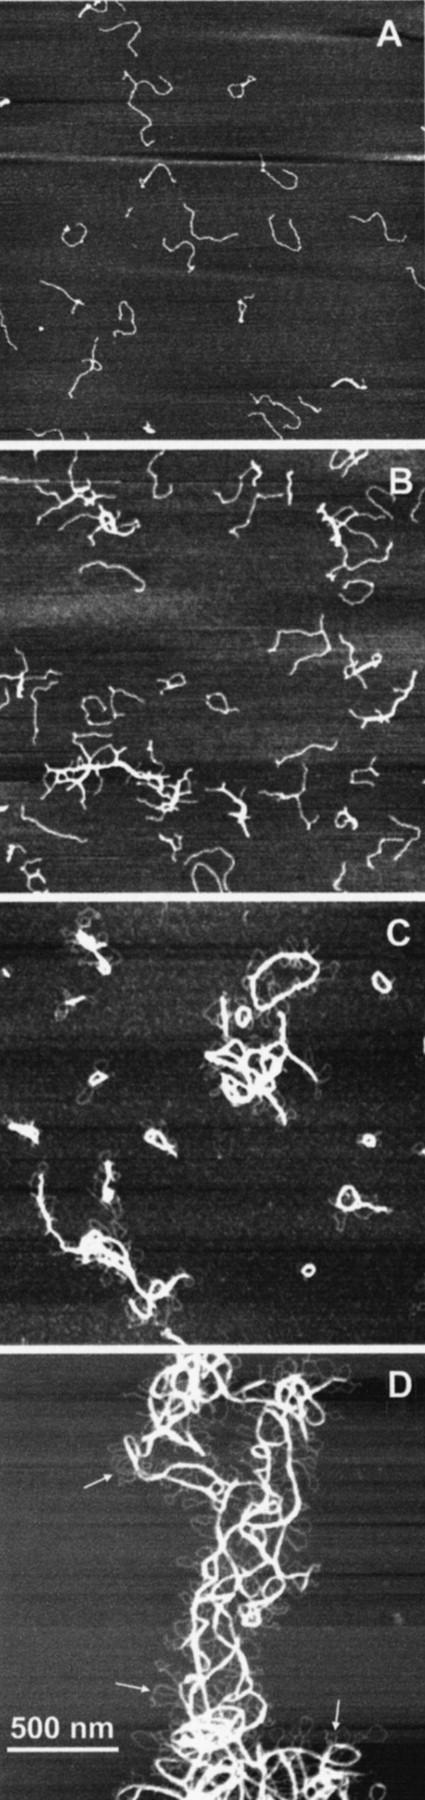
Time-dependence of GC-DNA condensation. Four representative fields of view for 2.5 ng/μl GC-DNA allowed to condense in the presence of 1 mM NiCl2 for various lengths of time. (A) Early conformational changes in DNA that was exposed to NiCl2 for only 5–20 s. Most condensed structures are single molecules with folds or knots. The next image (B) is a typical example of DNA condensed between 30 s and 1 min. Several multimolecular structures are present, including toroid and rod prototypes. (C) An image after the GC has condensed between 3 and 7 min. Large, thick bundles of highly structured DNA are abundant. Additionally, small loops of DNA extend from nearly every aggregate. (D) The effects of two months of condensation. The structures seen in (C) have now joined to form superstructures spanning multiple microns. Note that the small loops previously mentioned are still prolific. Images are all 2 μm × 2 μm. The images have been adjusted to emphasize contrast, therefore the height scales for each box are unrelated.
Within 20 s, significant configurational changes occurred (Fig. 3 A). Sometimes the ends of single GC-DNA molecules folded in on themselves, creating tennis racquet shapes (Fig. 4, A and B). Some GC-DNA molecules formed double racquets with loops at both ends (Fig. 4 C). Also, several of the GC-DNA molecules had pronounced knots along their length (Fig. 4, D–F). A few GC-DNA molecules displayed a parallel joining into duplexes, already within the first 20 s (Fig. 4, G–I).
FIGURE 4.

Three distinct structures seen in the first 20 s of GC-DNA condensation in 1 mM NiCl2 are shown in this array of AFM images: tennis racquet-shaped (A–C), knotted (D–F), and duplexes (G–I). The height scales of individual boxes are unrelated. The scale bar applies to all images.
At times longer than 20 s, but shorter than several minutes, larger complexes of GC-DNA formed (Figs. 3 B and 5). The first signs of toroids can be seen here, though most are imperfectly formed.
FIGURE 5.

A three-dimensional surface plot of the AFM of a small GC-DNA condensate. The highest point is 3.2 nm above the surface. This is a relatively small condensed structure involving ∼7 strands of DNA. GC-DNA in Hepes buffer was combined with NiCl2 30 s before being deposited on freshly cleaved mica. The final concentration of the solution before depositing was 2.5 ng/μl GC-DNA, 10 mM Hepes (pH 7.0), and 1 mM NiCl2.
These complexes then tighten and combine to form larger, more defined complexes. Between 3 and 7 min (Figs. 3 C and 6), rods and toroids dominate, and almost all of the DNA is incorporated into condensed complexes. Most of the rods and toroids have individual dsDNA strands streaming out. Many of these streamers loop back to rejoin with the main bundle of DNA (Fig. 6, arrows). Multiple rods often become entangled or cross themselves. The loops and free ends of DNA are still prominent.
FIGURE 6.

A clear view of several free loops (arrows) streaming off the edges of this condensed GC-DNA structure. This image is from an aqueous AFM scan of 2.5 ng/μl GC-DNA in 2 mM NiCl2 after ∼5 min.
Between two weeks and two months, the GC-DNA condensates become gradually more extended, up to a size of 3 μm or more (Fig. 3 D). These structures may have been even larger in solution, but sample preparation necessitates a small amount of mixing, which is known to break large strands of DNA. These later condensates resemble jumbles rather than rods or toroids. The most condensed regions, however, are no wider than the most condensed regions seen after only a few minutes in Ni(II). Interestingly, the dsDNA loops are still present, but no free ends are observed. In addition to the free loops of dsDNA, there are loops that are joined in a loose network adjacent to the condensed region (Fig. 3 D, arrows).
Dependence of GC-condensation on Ni(II) concentration
In addition to the time series, several samples were prepared with concentrations of Ni(II) varying between 0.1 mM and 6.0 mM. For concentrations from 0.1 to 3.0 mM Ni(II), both rods and toroids formed. The sizes of structures increased perceptibly with the concentration. Free loops of DNA were also observed, as in Fig. 6 (arrows).
At a nickel concentration of 6.0 mM, the GC-DNA formed structures very similar to the large conglomerates seen after two months' incubation (Fig. 3 D). Multiple rods and toroids combined to form structures spanning ∼3μm. Here, too, free loops of dsDNA were seen.
GC-DNA condensates in aqueous solution
Attempts were made to observe the process of Ni(II)-induced DNA condensation in fluid in real time. Unfortunately, once the DNA adhered to the mica, all condensation stopped. Because DNA adheres to mica in the first minutes before imaging begins, the first images showed only condensed and uncondensed DNA structures firmly attached to the mica (Fig. 7). No differences were observed between DNA imaged dry and in aqueous solution. From this we conclude that drying did not induce artifacts.
FIGURE 7.
Attempts to image DNA in the process of condensing were prevented by the strong adhesion of the DNA to the mica substrate in the presence of nickel. This AFM scan shows the results of one such attempt. A drop of GC-DNA in Hepes buffer was deposited on nickel-treated mica and imaged in aqueous conditions. Nickel-treated mica holds the DNA in place to make imaging possible. NiCl2 was then added such that a 2.5 ng/μl GC-DNA, 1 mM NiCl2, and 10 mM Hepes (pH 7.0) solution was obtained. This image was taken immediately after the addition of Ni(II) to the solution, but appears nearly identical to the images taken before Ni(II) was added (not shown).
Dimensions of GC-DNA loops and condensates
For each set of experimental conditions, the free loops of dsDNA have the same range of sizes. Loop widths (Fig. 8, double arrow) were 31 ± 13 nm for GC-DNA condensates imaged in air or fluid after a few min in 1–3 mM Ni(II) (Fig. 8). The distance loops extended from the dense condensate is 1.6 ± 0.6 times longer than their widths; this can be seen qualitatively.
FIGURE 8.

Histogram of the widths of loops in 2.5 ng/μl GC-DNA condensed for several minutes in 1–3 mM NiCl2. Widths of loops were measured parallel to the condensed bundle, between the widest points of the loops (insert, double arrow).
Phase images show that the dsDNA loops project from the top surface of the rods, toroids, and other condensates, as well as from the sides (data not shown). On each side of the condensates, the dsDNA loops were spaced at a density of 15 ± 8 loops per linear micron.
The outer radii of toroids were typically 55.9 ± 18.9 nm. At this size, they fit inside a bacteriophage capsid and obey constraints of DNA stiffness (Bloomfield, 1991).
Volumes of single GC-DNA molecules as in Fig. 2 are ∼800 nm3. Volumes of early structures, such as the 30 s structure in Fig. 5, were variable and were estimated at 6200 ± 2400 nm3, suggesting that the early structures contain 5–10 GC-DNA molecules.
Volumes of toroids as in Fig. 3 C are 28,000 ± 13,000 nm3, which is 20–50 times larger than the volumes of single GC-DNA molecules. This suggests that individual toroids typically contain 25–50 GC-DNA molecules.
The width of the dense bundles as in Fig. 3, C and D, is 22 ± 6 nm, and the maximum heights are ∼4–8 nm. A similar range of widths and heights was seen for the dense regions of condensates at all condensation times, from 30 s to 2 months.
How many parallel molecules of GC-DNA will produce bundles with the observed widths and heights? Estimates indicate that ∼6–8 parallel molecules of GC-DNA form the thinner regions of bundles (e.g., bundle attached to loop at lower arrow in Fig. 3 D), and 15–25 parallel molecules of GC-DNA form the thicker regions of bundles (e.g., bundle attached to loop at upper arrow in Fig. 3 D).
Dependence of AT-DNA condensation on Ni(II) concentration
AT-DNA in concentrations of Ni(II) between 1 mM and 3 mM displayed no condensation. Only when the Ni(II) concentration was raised to 6 mM were small condensates formed (Fig. 1 B). These condensates were similar to those of GC-DNA seen before 60 s of condensation in only 1 mM Ni(II), as in Fig. 3, A and B. The AT-DNA formed tennis racquet shapes, knots, and structures involving the parallel joining of two or three AT strands.
Z-DNA
Z-DNA forms from repeating purine-pyrimidine sequences. Z-DNA forms left-handed helixes and is named for the zigzag conformation of its sugar-phosphate backbone. Of the sequences investigated here, AT-DNA does not form Z-DNA, but GC-DNA can form Z-DNA in high salt concentrations, such as 0.7 M MgCl2 (Saenger, 1984). GC-DNA also forms Z-DNA in the mM concentrations of NiCl2 used here, as shown in Fig. 9 by the measurements of circular dichroism (CD) and absorbance or optical density (OD).
FIGURE 9.

Circular dichroism (CD) and optical density (OD) spectra of GC-DNA (left) and AT-DNA (right) in 10 mM HEPES (pH 7.0), 23°C plus the indicated concentrations of NiCl2. DNA concentrations were 50 μg/mL. Buffer CD and OD spectra were subtracted. (This data was kindly provided by S. Leikin).
M-DNA
In solutions containing 1 mM Ni(II), Co(II), or Zn(II) at pH 8.5, dsDNA appears to function as a molecular wire and has therefore been named M-DNA (Aich et al., 1999). Fluorescence quenching experiments provide the evidence that M-DNA is a molecular wire capable of conducting electrons along its length. M-DNA with a terminal fluoroscein fluorophor fluoresces, but when an acceptor (rhodamine) fluorophor is attached to the other end, there is no fluorescein fluorescence. This quenching of the fluorescein fluorescence was determined not to be due to fluorescence resonance energy transfer because of the large distance between the terminal fluorescein and rhodamine fluorophors (Aich et al., 1999).
Given the potential importance of M-DNA as a molecular wire and the similar preferences of Ni(II), Co(II), and Zn(II) for both M-DNA formation (Aich et al., 1999) and DNA-mica binding (Hansma and Laney, 1996), we investigated the effect of Ni(II) at pH 8.5 on GC-DNA structure. In our hands, GC-DNA did not bind well to mica at pH 8.5. The structures that did bind were smaller, thicker and more highly branched as compared with the GC-DNA condensates at pH 7 in Fig. 3 B.
DISCUSSION
Striking differences were observed in the extent of condensation of AT-DNA and GC-DNA. This work follows earlier observations that GC-DNA tends to condense (Thomas and Bloomfield, 1985; van de Sande et al., 1982), as well as a recent observation that GC and AT sequences differ in their extent of dehydration (Kankia, 2000).
With GC-DNA, we observed three stages in the Ni(II)-mediated condensation. The first is an intramolecular condensation into “tennis racquets” and other looped or knotted structures (Fig. 4). The diagrams in Fig. 10 A show this process qualitatively, as the initial intrastrand contact produces a loop, which then “zips” into a “tennis racquet” to minimize free energy. The persistence length of GC-DNA determines the minimum size of the loop. Tennis racquet shapes such as those in Fig. 4, A–B, were also observed in a Brownian dynamics simulation as the first stable intermediate for polymer condensation in a poor solvent (Schnurr et al., 2000).
FIGURE 10.

Possible pathways for the creation of loops in GC-DNA complexes. (A) Different speculative stages in the formation of a looped GC-DNA molecule also known as a “tennis racquet”. After the initial attractive contact is realized (left), parts of the molecule adjacent to the contact region will attract each other and induce further collapse (center), followed by the sliding of the “zipped” parts along each other (right) to minimize the free energy (B and C). The loops observed on the condensed structures can be obtained (B) by the complexation between the condensed structures and the “tennis racquets” or (C) by the formation of unavoidable loops when GC-DNA molecules interact with the condensed structures.
The second stage is the intermolecular condensation of two to several GC-DNA molecules. These small condensates are branched, as in Fig. 5, and typically have a highly condensed core surrounded by less condensed DNA. Early formations of rods and toroids are observed at this point.
The third stage is an intermolecular condensation into structures containing many GC-DNA molecules. These structures can be classified into three main types: toroids with loops around the edges, rods with loops around the edges, and jumbles with loops around the edges of the more highly condensed regions of the jumbles. The more highly condensed regions of rods, toroids, and jumbles (Fig. 3, C and D) are named bundles. Loops on bundles are predicted to form by the attachment of a stable “tennis racquet” (Fig. 10 B) or by a looping of a GC-DNA molecule during attachment to the bundle (Fig. 10 C). The DNA loops and the individual GC-DNA molecules are both dsDNA.
The bundles are all similar in their degree of condensation, as measured by the diameters of the bundles. Even the early multimolecular GC-DNA condensates in Fig. 3 C show bundles similar in size to the bundles of two-month condensates in Fig. 3 D. Something must be preventing the bundles in these GC-DNA condensates from growing larger. In fact, some of the stable loops, especially those diagrammed in Fig. 10 C, may result from a limit to the stable bundle size, as follows: a bundle with a GC-DNA loop may be more stable than a bundle enlarged by the amount of GC-DNA in the loop.
One factor affecting the size of DNA condensates is the Donnan equilibrium, in which small mobile cations such as Ni(II) are attracted to large polyvalent DNA anions (Hansen et al., 2001). For condensed DNA molecules separated by 7–10 Å, the phosphate concentration in water is ∼2 M. This means that the Ni(II) concentration at electroneutrality will be ∼1 M. Even if 90–95% of the Ni(II) is bound to DNA through Manning condensation (Manning, 1978) and specific interactions, this still leaves 50–100 mM free Ni(II) in the vicinity of the condensed DNA, as compared with ∼1 mM Ni(II) in the bulk solution. This osmotic gradient causes Ni(II) to move toward the bulk solution, creating an electrical potential in which there is a net negative charge between the condensed DNA and the bulk solution. Donnan equilibrium may affect the maximum bundle size in DNA condensates, but it should not cause the sequence-dependence of DNA condensation, whose theory is presented later in this discussion.
AT-DNA condensed weakly even at Ni(II) concentrations almost 10-fold higher than those needed for the condensation of GC-DNA. These structures were small and branched, similar to GC-DNA in the first 20–60 s of condensation. AT-DNA was never observed to form highly ordered structures such as toroids and rods. Additionally, AT-DNA condensates never showed loops of dsDNA around the edges like those of GC-DNA in Fig. 6 (arrows).
Ionic effects
We have not exhaustively investigated the ionic dependence of this sequence-dependent DNA condensation. Our preliminary results with Zn(II) and Co(II) are similar to those with Ni(II). Zn(II) and Co(II) also gave similar results to Ni(II) in another analysis of DNA by AFM—all three of these divalent transition-metal cations promoted DNA binding to mica under aqueous fluid, although Mn(II) promoted only weak binding, and no binding was observed with Ca(II), Mg(II), Cd(II), or Hg(II) (Hansma and Laney, 1996). These results were related to the ionic radii and to the high enthalpies of hydration for Ni(II), Co(II), and Zn(II). The viral DNA used in these experiments contained all four DNA bases in a varied sequence, and no condensation was observed.
There is a large literature about the effects of metal ions on DNA. Transition metal ions bind strongly to base ring N's and phosphate O's, whereas Group IIA cations tend to bind sugar OH's and phosphate O's; Group IA cations bind all three substituents—base ring N's, phosphate O's, and sugar OH's—though more weakly (Duguid et al., 1993, 1995; Saenger, 1984).
All of the above mentioned metal cations can induce a structural transition of GC-DNA from a B-form to a Z-form DNA. Group IA cations (Na+, K+, Rb+, Cs+, Li+) drive the transition at high salt concentration 2.3–5 M (Soumpasis et al., 1987), whereas Group IIA cations (Ca2+, Mg2+) induce it at 0.1–0.7 M (Behe and Felsenfeld, 1981). In contrast, transition metal ions (Mn2+, Co2+, Ni2+, and Zn2+) drive the transition at millimolar (even submillimolar) concentrations (Schoenknecht and Diebler, 1993; van de Sande et al., 1982).
A necessary condition in order for DNA condensation to occur (DNA is one of the most highly charged polymers) is that the cations compensate more than 89% of the phosphate charge (Bloomfield, 1996). Group IA cations only compensate 76% of the backbone charge through Manning condensation (Manning, 1978) and are unable to condense DNA. Although divalent cations compensate 88% of the phosphate charge through the same mechanism, Group IIA cations are also unable to condense DNA despite a high affinity for phosphates (Bloomfield, 1996; Duguid et al., 1995). This is different for transition metal ions that have a low affinity for phosphates and are able to condense GC-rich DNA (Knoll et al., 1988; Rau and Parsegian, 1992).
Other sequence-dependent DNA condensations
An intrinsically curved DNA from kinetoplasts (kDNA) has phased A-tracts that bend the DNA molecules into small loops with diameters of ∼20 nm. (Griffith et al., 1986; Hansma et al., 1994). A theory of toroid formation was tested by inserting these curved kDNA segments into a DNA molecule. DNA molecules with intrinsically curved kDNA segments initially formed much smaller toroids than DNA molecules without kDNA segments (Shen et al., 2000).
When GC-DNA sequences were inserted into plasmids, there was increased condensation in the presence of cobalt hexamine (Ma et al., 1995). This is consistent with our observations.
Telomeres, the end caps of chromosomes, have a high GC content. When telomeric DNA sequences were inserted into DNA plasmids, there was decreased condensation in the presence of cobalt hexamine (Schnell et al., 1998). This is in contrast to our observations.
As telomeres become shorter, there is a tendency for end-to-end chromosome fusion (Blackburn, 2000; Lundblad, 2000). Our results suggest that the high GC content of telomeres might suppress end-to-end chromosome fusion by forming stable condensed structures at the telomeres, or ends of chromosomes. Perhaps these condensed structures seen with GC-DNA but not AT-DNA serve to block end-to-end chromosome fusion by inhibiting DNA basepairing between the ends of chromosomes.
Theory for sequence-dependent condensation
As our experiments show, GC-DNA adopts a Z-type conformation and is easily condensed into a rich variety of aggregates by submillimolar concentrations of Ni(II) cations. In contrast, AT-DNA retains its B-type conformation and displays only minor condensation even at high Ni(II) concentrations (10 times higher than that used to condense GC-DNA). Such unusual differences in condensation seem puzzling at first sight, because from a macroscopic point of view, both DNA molecules possess almost identical linear charge density and intrinsic bending rigidity. It is true, however, that the microscopic patterns of the phosphate charge distributions, as well as the location and strength of the Ni(II) binding sites along the DNA molecule, are quite different in Z-form GC-DNA when compared to B-form AT-DNA. Given that the dominant interaction is electrostatic in nature, this suggests that the microscopic details of the DNA surface charge distributions must play a crucial role in condensation.
When DNA molecules are immersed in electrolyte solution, their interaction is screened by the free ions. The electrostatic field produced by each DNA molecule can be separated into two parts: (1), the field created by the mean surface charge density as if it were a homogeneously charged cylinder; and (2), the field components due to the nonuniform distribution of charges. At large separation, the electrostatic field components (2) due to the nonuniform distribution of charges on DNA are washed out (both due to screening and to their short decay length), and DNA molecules interact as if they were homogeneously charged cylinders. It is only at short separations that such electrostatic field components (2) can have a significant contribution to the interaction. As was mentioned above, the origins of these electrostatic field components are found in the charge patterns of the fixed phosphate groups and of the adsorbed Ni(II) cations.
The phosphates are the most important fixed charges along the DNA backbone. These monovalent, negatively charged groups form two helical patterns separated by the minor and the major grooves (sugars are on the minor groove side of the basepair). The charge distribution of the phosphates can be characterized by the following structural parameters: the helical pitch (H), the number of basepairs per helical turn (N), the phosphate displacement from the helical axis (b), and the width of the minor groove (w). Instead of w, one can alternatively use the azimuthal halfwidth of the minor groove ( ), defined as one half of the angle under which the minor groove is seen from the center of the helix, in a section plane normal to the DNA axis.
The other important surface charge distribution on DNA is that of the Manning adsorbed (Manning, 1978) divalent Ni(II) cations. These ions can form different charge patterns on the surface of GC- and AT-DNA, depending whether there are additional specific interactions with the DNA backbone or the DNA bases.
Indeed, as mentioned in the Discussion, the interaction of divalent transition metal ions (such as Ni(II), Mn(II), Zn(II), etc.) with AT-DNA bases is nonspecific and predominantly electrostatic (Abrescia et al., 1999; Van Steenwinkel et al., 1981; Zimmer et al., 1974). This interaction leaves the backbone in its original B-DNA conformation (Fig. 9, AT-DNA), and the ions bind preferentially in the narrower minor groove to take advantage of its deeper potential well (Pullman et al., 1982; Rouzina and Bloomfield 1998; Van Steenwinkel et al., 1981). In AT-DNA, Ni(II) does not bind to the purine N7 atom (Abrescia et al., 1999).
In contrast, in GC-DNA, Ni(II) binds strongly and specifically to the N7 atom of guanine in the major groove (Abrescia et al., 1999; Van Steenwinkel et al., 1981; Zimmer et al., 1974) and induces a conformational change of the backbone from B- to Z-DNA, where the N7 atom of guanine is more accessible (Gueron et al., 2000; Schoenknecht and Diebler, 1993). This conformational change takes place at submillimolar concentrations of Ni(II) cations (Schoenknecht and Diebler, 1993), as confirmed by the CD and OD measurements in Fig. 9, GC-DNA.
In addition, as previously mentioned, transition metal ions seem to have no special affinity for binding to the phosphate chains alone, unlike the alkali-earth metal ions Ca(II) and Mg(II), which are not able to condense DNA.
Such marked differences in the location and strength of the Ni(II) binding to GC- and AT-DNA suggest that an ionic crystal model (Arenzon et al., 1999; Gronbech-Jensen et al., 1997; Shklovskii, 1999) rather than a charge fluctuation model (Barrat and Joanny, 1996; Ha and Liu, 1997; Oosawa, 1971) would be more appropriate for describing the DNA-DNA interaction. In fact, a detailed ionic crystal model for the interaction between two parallel B-DNA molecules was proposed by Kornyshev and Leikin (Kornyshev and Leikin, 1999) to explain the counterion specificity of DNA condensation, namely: divalent alkali-earth metal ions (like Ca(II) and Mg(II)) have a high affinity for phosphates but do not induce DNA condensation, whereas transition metal ions (like Ni(II), Cd (II), Zn(II), Mn(II), etc.) easily precipitate GC-rich DNA. Their model (also known as the electrostatic zipper motif) reveals the importance of the surface charge patterns in the energetics of DNA aggregation (Kornyshev and Leikin, 1997; Kornyshev and Leikin, 1998a,b). Assuming that condensed ions form well-defined helical distributions of charges along the centers of the minor and major grooves, and on the phosphate chains (with relative occupancies f1, f2, and f3 respectively; f1 + f2 + f3 = 1), and treating the free ions in the Debye-Huckel-Bjerrum approximation, they compute the interaction energy between two parallel B-DNA molecules by varying: the occupancies f1, f2, and f3; the interaxial separation R; the axial shift Δz; and the fraction of adsorbed counterions θ.
Their results show that at zero axial shift (Δz = 0) and at θ ≈ 0.9 (characteristic when chemisorption is present), the molecules attract each other if most of the condensed counterions are localized in the center of the major groove (with few or no counterions condensed on the phosphates) and repel otherwise. Although it is true that a short-range attraction can always be obtained by optimally adjusting the axial shift (Δz) to minimize the interaction energy even in the case when most counterions are localized in the minor groove (and the molecules repel at zero axial shift), this does not necessarily mean that in such a case macroscopic aggregation will occur (Kornyshev and Leikin, 1999). To form stable macroscopic aggregates, the axial shift would have to be optimized for all neighbor pairs, and this is not always possible. Therefore, the presence of attraction at zero axial shift is a firm indicative of macroscopic aggregation.
In this paper we follow the same arguments as in (Kornyshev and Leikin, 1999) with one important distinction: due to the low ionic strength (large Debye screening length λD) regime of our experiments, we need to probe shorter than λD surface separations between DNA molecules to evaluate the overall character of the interaction. However, this is the region where the approximation for the n = 0 mode of the interaction energy uint(R) in Eq. 12 (Kornyshev and Leikin, 1999) breaks down.
Indeed, as we mentioned before, the electrostatic field produced by each DNA molecule in solution can be separated into two parts: (1), the field created by the mean surface charge density as if the molecules were homogeneously charged cylinders (n = 0 mode); and (2), the field components due to the helical surface charge pattern (n ≠ 0 modes). Whereas the decay length λ0 of the n = 0 mode is λ0 = λD (strongly dependent on the ionic strength), the decay lengths λn of the n ≠ 0 components are given by  at low ionic strength (large λD). Similarly, the interaction energy between parallel DNA molecules uint(R) in Eq. 12 (Kornyshev and Leikin, 1999) can be separated into the n = 0 mode U0(R) (describing the interaction between uniformly charged cylinders immersed in electrolyte solution) and the n ≠ 0 modes Un(R) due to the charge patterns. The expression for each mode n of the interaction energy will be accurate as long as the DNA-DNA surface separation is greater than λn.
Because we want to determine the character of the interaction between DNA molecules, we need to probe surface separations of order 10 Å or shorter. Such separations are smaller than λ0 (in our experiments λD ≈ 30 Å) and therefore we can not use the expression U0(R) for the n = 0 mode of the interaction energy. Nevertheless, the modes with n ≠ 0 have λn < 10 Å and their corresponding expressions Un(R) for the interaction energies are still accurate.
To deal with the n = 0 mode of the interaction, we want to remind the reader that this mode represents the interaction between two parallel, uniformly charged cylinders of dielectric constant ɛ2 (where ɛ2 ≈ 2 for most biological helices) immersed in an electrolyte of dielectric constant ɛ1 (where ɛ1 ≈ 78 is the dielectric constant of water). Because the cylinders have a high linear charge density, their interaction will be screened even at very short separations, due to the free ions present in solution. Therefore the force per unit length (F0) between the cylinders will always be smaller than in the case when no free ions are present (at the same dielectric contrast). However, this latter case can be solved through the method of images in the form of an infinite series in which each term is an infinite series. This expression has an upper bound  given by:
 |
(1) |
where C = 1181.5 × 10−9 N/persistence length; H, R, and b are the numerical values (in Angstroms) of the respective parameters; and the persistence length was taken to be 500 Å. The upper bound  of the force per unit length between uniformly charged cylinders in the absence of electrolyte (Eq. 1) will then also act as an upper bound for the case when electrolyte is present.
At the same time, the n ≠ 0 modes of the force are still accurately given by  where again Un(R) is the mode n of the interaction energy uint(R) in Eq. 12 (Kornyshev and Leikin, 1999).
The total force per unit length between parallel DNA molecules can then simply be computed as
 |
(2) |
where for DNA helices, only the modes with  contribute significantly. Although we overestimate the repulsive force of the n = 0 mode, if an attraction is present at short separation, it should also be present in the exact solution.
This approach is slightly different compared to the one used in Kornyshev and Leikin (1999) in that we estimate the force between DNA molecules instead of their interaction energy. This stems from the insurmountable task of calculating U0(R) analytically for DNA surface separations shorter than λD. The overestimating procedure does not provide a common reference point with the n ≠ 0 modes Un(R).
AT-DNA
As we pointed out before, AT-DNA remains in its B-type conformation and Ni(II) cations bind preferentially in the minor groove with no special affinity for the phosphates. The preference for binding in the minor groove is a characteristic of small multivalent cations (size determined by their hydration shell), which are able to fit sterically in the minor groove and to take advantage of the deeper potential well as compared to the major groove (Pullman et al., 1982; Rouzina and Bloomfield, 1998). After binding in the minor groove, such cations will induce some amount of groove closure by basepair inclination and winding (Rouzina and Bloomfield, 1998). Given that there is no significant specific interaction with the DNA backbone, we expect the fraction of condensed counterions (θ) to be close to the pure Manning condensation value (Manning, 1978), which for DNA and divalent counterions is θM ≈ 0.88.
Fig. 11, curves a and a', show the force per unit length F(R) for AT-DNA as calculated using Eq. 2 in its regime of validity (i.e., surface separations larger than  ) at zero axial shift (Δz = 0) and at optimally adjusted (to maximize attraction) axial shift (optimal Δz), respectively. Here we chose θ = 0.9, f1 = 0.7, f2 = 0.3, and f3 = 0, and used the same B-DNA parameters as in Kornyshev and Leikin (1999), namely b = 9 Å, H = 34 Å, and the azimuthal halfwidth of the minor groove
  (or alternatively w = 11.7 Å). The plots show that the molecules always repel at zero axial shift although a strong short-range attraction (of order 0.3 nN/persistence length) is present at optimal axial shift. We should point out that at zero axial shift (Δz = 0), the contribution from the n ≠ 0 modes of the force Fn(R) is repulsive. Because the interaction between uniformly charged cylinders in electrolyte solution is always repulsive in the Debye-Huckel-Bjerrum approximation, we conclude that the true interaction will always be repulsive at Δz = 0. On the other hand, a short-range attraction at optimal axial shift, as depicted in Fig. 11, curve a', was also obtained in Kornyshev and Leikin (1999) for the same values of f1, f2, and θ (see Fig. 2, curve 1 in that paper). Despite the fact that their calculations are done at much higher ionic strength (smaller Debye screening length λD ≈ 7 Å), the short-range attractive force deduced from their interaction energy plot is of order 0.25 nN/persistence length, similar to our result.
FIGURE 11.

Force per unit length between parallel DNA molecules, at low ionic strength (λD = 30 Å) as predicted by Eq. 2; (top) at zero axial shift (Δz = 0), (bottom) the axial shift (Δz) is optimally adjusted to maximize attraction. Curves a and a' correspond to AT-DNA (in B-type conformation) at θ = 0.9, f1 = 0.7, f2 = 0.3, and f3 = 0, whereas curves b and b' correspond to GC-DNA (in Z-type conformation) at θ = 0.95, f1 = 0.3, f2 = 0.7, and f3 = 0. Attraction at zero axial shift (as in curve b) is indicative of macroscopic aggregation.
Although we do not know the true values of θ, f1, and f2, our simulations (which overestimate the repulsive n = 0 mode) indicate that the features of Fig. 11, curves a and a', are qualitatively the same for any other values 0.88 ≤ θ ≤ 1.0 and any f1 > f2, (with f3 = 0). This suggests that the molecules will always repel at zero axial shift (Δz = 0). Moreover, at optimal axial shift, there will always be a short-range attraction (which increases with θ) although at larger separations the molecules repel. The value of the optimal axial shift Δz ≈ 8.5 Å (which maximizes the attraction) remains almost constant with the interaxial separation R. The interaction is attractive only within a narrow interval Δz = 8.5 ± 2 Å and repulsive otherwise.
An increase in f3 (the fraction of counterions condensed on the phosphate chains) will always diminish a possible attraction inasmuch as it acts against the charge separation along the DNA molecule (the feature that controls the strength of the ionic-crystal type of interaction). Given that the molecules always repel at zero axial shift whereas there is some attraction when the shift is optimally adjusted, we conclude that the interaction between parallel AT-DNA molecules in the presence of Ni(II) cations will most likely not lead to macroscopic aggregation (which requires special symmetry of lateral packing to maintain an optimal axial shift between all neighbor pairs). Nevertheless, small condensates of a few optimally aligned chains are possible. This is in good agreement with our experimental results of Fig. 1 B.
GC-DNA
In the case of GC-DNA, Ni(II) cations induce a conformational change of the DNA backbone from B- to Z-DNA, as was previously mentioned. There are two structures known for the Z-DNA conformation: ZI and ZII. Although the CD measurements for GC-DNA in Fig. 9 cannot distinguish between the two, it is generally accepted that ZI represents the average structure of the Z-DNA conformation whereas ZII is indicative of some degree of flexibility in the backbone (Ho and Mooers, 1997). Henceforth we will refer to the ZI structure as Z-DNA.
To describe the interaction between two parallel Z-DNA molecules, we adapted the model of Kornyshev and Leikin (1999) to account for the different characteristics of Z-DNA. What is peculiar to Z-DNA, besides the helix being left-handed, is that the positions of the phosphates are not equivalent. The displacement b of the phosphates from the DNA axis alternates between two distinct values 6.27 and 7.31 Å, whereas the width of the minor groove w alternates between 7.7 and 13.7 Å (Pullman et al., 1982). This is what creates the zigzag pattern of the phosphate chains on the surface of Z-DNA. Nevertheless, every other phosphate on each of the phosphate chains still lies on a helical path and therefore we can use the same arguments as in Kornyshev and Leikin (1999), now applied to four helical charge patterns instead of two. Each zigzag-shaped phosphate chain can be thought of as two nearby (3 Å apart) helical charge distributions (one with b = 6.27 Å, the other with b = 7.31 Å), each carrying half the linear charge density of the phosphate chain. The separation across the minor groove between the helical paths having b = 6.27 Å is w = 7.7 Å whereas that between the paths having b = 7.31 Å is w = 13.7 Å. In what follows we will approximate the parameter b by its average value b = 6.8 Å for all helical paths. This will allow us to obtain a closed form analytical expression for Un(R) similar to Eq. 12 in Kornyshev and Leikin (1999), although for all purposes, the results are identical to the case when one allows for different values of b.
Making use of the additional Z-DNA parameters H = 45 Å and N = 12 (Pullman et al., 1982) we can estimate the average azimuthal halfwidth of the minor groove to be  (the average is computed over the azimuthal halfwidth angles corresponding to the two distinct values of w). We define the variation
  as one half of the azimuthal angle under which the two nearby helical paths that form each phosphate chain are seen from the DNA axis (here
  ).
).
The interaction energy between two parallel DNA molecules, which takes into account the four distinct helical charge patterns on each molecule, is then given by a modified version of Eq. 12 in Kornyshev and Leikin (1999) in which “ ” is replaced by “
 ”. Although the original form of Eq. 12 in Kornyshev and Leikin (1999) was written for the interaction between right-handed helical charge patterns, it is equally valid for left-handed ones.
Because Ni(II) cations bind strongly and specifically to the N7 atom of guanine, we expect the fraction of condensed counterions (θ) to be well above the pure Manning condensation value θM = 0.88. As before, we employ Eq. 2 to compute the force per unit length between two parallel GC-DNA molecules.
Fig. 11, curves b and b', shows the force per unit length F(R) as computed using Eq. 2 (in its regime of validity, i.e., surface separations larger than  ) for Δz = 0 and for optimal Δz, respectively. Here we chose θM = 0.95, f1 = 0.3, f2 = 0.7, and f3 = 0. The plots show a strong short-range attraction between the DNA molecules in both cases. The value of the optimal axial shift decreases from about Δz = 4.5 Å to zero in the interval 21 Å ≤ R ≤ 22.6 Å and remains equal to zero for R ≥ 22.6 Å. The interaction is attractive within a wide interval ±10 Å around Δz = 0.
Our simulations indicate that at Δz = 0, depending on the separation R, the attraction is three to four times stronger than that obtained in Kornyshev and Leikin (1999) for B-DNA molecules at much higher ionic strength (λD ≈ 7 Å), θ = 0.9, and identical values of f1, f2 and f3. This is mainly due to the fact that in Z-DNA, the minor groove is narrower and the pitch larger as compared to B-DNA, which results in a better charge separation and therefore a stronger interaction between the Z-DNA molecules as compared to the B-DNA molecules.
Again, although we do not know the true values of θ, f1 and f2, our simulations (which overestimate the repulsive n = 0 mode) show that there is always a short-range attraction both at zero and at optimally adjusted axial shift for any 0.88 ≤ θ ≤ 1.0 and any f2 > f1 (at f3 = 0). As pointed out before, an increase in f3 will always diminish this attraction. The fact that the molecules attract at zero axial shift is indicative of macroscopic aggregation and is in good agreement with our experimental results, as in Fig. 1 A.
The omnipresent loops in the GC-DNA condensates can also be explained by the electrostatic zipper model. One possibility is that the loops observed on the condensed structures (rods and toroids) at later stages of condensation (Fig. 3, C and D, and Fig. 6) are obtained as the result of the complexation between these structures and the tennis racquet-shaped DNA molecules. The tennis racquet conformations are observed in the early stages of GC-DNA condensation (Fig. 4, A–C). “Tennis racquets” start to form when different parts of the same GC-DNA molecule come in close contact and attract each other as was described earlier (Fig. 10 A, left). Once the initial contact is realized, parts of the molecule adjacent to the contact region will also attract each other, giving rise to further collapse into a “tennis racquet” (Fig. 10 A, center); this is similar to closing a zipper on either side of the initial contact region. Then, the “zipped” parts of the molecule will slide along each other to lower the electrostatic energy (by increasing the length of the contact region), until a balance is reached with the increase in the elastic energy and the loss of entropy. The resulting tennis racquet-shaped molecule can later complex with the condensed structures (rods and toroids), forming loops on their surfaces (Fig. 10 B).
A second possibility is that loops are formed when different regions of the same GC-DNA molecule come in contact with a condensed GC-DNA structure (Fig. 10 C). The complexation between the GC-DNA molecule and the GC-DNA structure will continue on both sides of the contact points (again similar to fastening a zipper) unless it is hindered elastically (by the formation of unavoidable loops) or entropically.
Because the strength of the electrostatic attraction between parallel GC-DNA molecules is of the order 0.18 nN/persistence length, this suggests that entropic effects will only play a role in the initial contact of the strands, until they “zip” along a certain critical length. The features of the condensed structures observed at later times are therefore, most likely, a result of the electrostatic interaction alone. This would explain why at later stages of condensation there are no loose ends of GC-DNA emanating from the ordered structures.
In conclusion, an interesting picture emerges for the sequence specificity of the DNA condensation by the divalent transition metal ion, Ni(II). When mixed with AT-DNA solutions, Ni(II) binds nonspecifically and mostly electrostatically in the minor groove of AT-DNA. This leaves the molecules in their original B-DNA conformation and results, at most, in a weak condensation for AT-DNA. On the other hand, when mixed with GC-DNA solutions, Ni(II) binds strongly and specifically to the N7 atom of guanine in the major groove and induces a conformation change of the backbone from B- to Z-DNA. Our extension of the electrostatic zipper model to account for smaller than λD surface separations between the DNA strands and for the characteristics of the Z-type conformation of GC-DNA shows that neighbor GC-DNA molecules always attract at zero axial shift, which is indicative of macroscopic aggregation. In contrast, AT-DNA strands always repel at zero axial shift although there is a short-range attraction if the axial shift is optimally adjusted. This is indicative of small condensates of a few AT-DNA strands having their axial shifts optimally adjusted (in general, it is not indicative of macroscopic aggregation unless special symmetries of lateral packing are respected). These predictions are in good agreement with our experimental results, which show that GC-DNA is easily condensed into a rich variety of aggregates by submillimolar concentrations of Ni(II) cations whereas AT-DNA only shows a minor condensation even at high Ni(II) concentrations.
Although the electrostatic zipper model does not specifically account for hydration forces and steric interactions, it nevertheless seems to capture essential aspects of the condensation, revealing the major role of the charge distribution patterns in the electrostatic interaction.
Acknowledgments
We are grateful to Sergey Leikin for providing us with the CD and OD spectra and for valuable discussions. We also thank the reviewers for many useful suggestions, Roxana Golan and Marilyn Garza for assisting in AFM analyses, and Fyl Pincus, Claus Jeppesen, and Deborah Fygenson for helpful discussions.
H.G.H. and J.S. acknowledge support from National Science Foundation Molecular and Cellular Biosciences. E.M.M. acknowledges support from the Materials Research Lab Program of the National Science Foundation under awards DMR99-72246 and DMR00-80034.
References
- Abrescia, N. G. A., L. Malinina, L. G. Fernandez, T. Huynh-Dinh, S. Neidle, and J. A. Subirana. 1999. Structure of the oligonucleotide d(CGTATATACG) as a site-specific complex with nickel ions. Nucleic Acids Res. 27:1593–1599. [DOI] [PMC free article] [PubMed] [Google Scholar]
- Aich, P., S. L. Labiuk, L. W. Tari, L. J. T. Delbaere, W. J. Roesler, K. J. Falk, R. P. Steer, and J. S. Lee. 1999. M-DNA: A complex between divalent metal ions and DNA which behaves as a molecular wire. J. Mol. Biol. 294:477–485. [DOI] [PubMed] [Google Scholar]
- Allen, M. J., E. M. Bradbury, and R. Balhorn. 1997. AFM analysis of DNA-protamine complexes bound to mica. Nucleic Acids Res. 25:2221–2226. [DOI] [PMC free article] [PubMed] [Google Scholar]
- Arenzon, J. J., J. F. Stilck, and Y. Levin. 1999. Simple model for attraction between like-charged polyions. European Physical Journal B. 12:79–82. [Google Scholar]
- Arscott, P. G., A. Z. Li, and V. A. Bloomfield. 1990. Condensation of DNA by trivalent cations. 1. Effects of DNA length and topology on the size and shape of condensed particles. Biopolymers. 30:619–630. [DOI] [PubMed] [Google Scholar]
- Barrat, J. L., and J. F. Joanny. 1996. Theory of polyelectrolyte solutions. Adv. Chem. Phys. 94:1–66. [Google Scholar]
- Behe, M., and G. Felsenfeld. 1981. Effects of methylation on a synthetic polynucleotide: the B-Z transition in poly(dG-m5dC). poly(dG-m5dC). Proc. Natl. Acad. Sci. USA. 78:1619–1623. [DOI] [PMC free article] [PubMed] [Google Scholar]
- Bezanilla, M., B. Drake, E. Nudler, M. Kashlev, P. K. Hansma, and H. G. Hansma. 1994. Motion and enzymatic degradation of DNA in the atomic force microscope. Biophys. J. 67:2454–2459. [DOI] [PMC free article] [PubMed] [Google Scholar]
- Blackburn, E. H. 2000. Telomere states and cell fates. Nature. 408:53–56. [DOI] [PubMed] [Google Scholar]
- Blessing, T., J. S. Remy, and J. P. Behr. 1998. Monomolecular collapse of plasmid DNA into stable virus-like particles. Proc. Natl. Acad. Sci. USA. 95:1427–1431. [DOI] [PMC free article] [PubMed] [Google Scholar]
- Bloomfield, V. A. 1991. Condensation of DNA by multivalent cations: considerations on mechanism. Biopolymers. 31:1471–1481. [DOI] [PubMed] [Google Scholar]
- Bloomfield, V. A. 1996. DNA condensation. Curr. Opin. Struct. Biol. 6:334–341. [DOI] [PubMed] [Google Scholar]
- Duguid, J., V. A. Bloomfield, J. Benevides, and G. J. Thomas, Jr. 1993. Raman spectroscopy of DNA-metal complexes. I. Interactions and conformational effects of the divalent cations: Mg, Ca, Sr, Ba, Mn, Co, Ni, Cu, Pd, and Cd. Biophys. J. 65:1916–1928. [DOI] [PMC free article] [PubMed] [Google Scholar]
- Duguid, J. G., V. A. Bloomfield, J. M. Benevides, and G. J. Thomas, Jr. 1995. Raman spectroscopy of DNA-metal complexes. II. The thermal denaturation of DNA in the presence of Sr/sup 2+/, Ba/sup 2+/, Mg/sup 2+/, Ca/sup 2+/, Mn/sup 2+/, Co/sup 2+/, Ni/sup 2+/, and Cd/sup 2+. Biophys. J. 69:2623–2641. [DOI] [PMC free article] [PubMed] [Google Scholar]
- Evdokimov, Y. M., A. L. Platonov, A. S. Tikhonenko, and Y. M. Varshavsky. 1972. A compact form of double-stranded DNA in solution. FEBS Lett. 23:180–184. [DOI] [PubMed] [Google Scholar]
- Fang, Y., and J. H. Hoh. 1998. Early intermediates in spermidine-induced DNA condensation on the surface of mica. J. Am. Chem. Soc. 120:8903–8909. [Google Scholar]
- Fang, Y., and J. H. Hoh. 1999. Cationic silanes stabilize intermediates in DNA condensation. FEBS Lett. 459:173–176. [DOI] [PubMed] [Google Scholar]
- Gelbart, W. M., R. F. Bruinsma, P. A. Pincus, and V. A. Parsegian. 2000. DNA-inspired electrostatics. PhysToday. 53:38–44. [Google Scholar]
- Golan, R., L. I. Pietrasanta, W. Hsieh, and H. G. Hansma. 1999. DNA toroids: stages in condensation. Biochemistry. 38:14069–14076. [DOI] [PubMed] [Google Scholar]
- Griffith, J., M. Bleyman, C. A. Rauch, P. A. Kitchin, and P. T. Englund. 1986. visualization of the bent helix in kinetoplast DNA by electron microscopy. Cell. 46:717–724. [DOI] [PubMed] [Google Scholar]
- Gronbech-Jensen, N., R. J. Mashl, R. F. Bruinsma, and W. M. Gelbart. 1997. Counterion-induced attraction between rigid polyelectrolytes. Phys. Rev. Lett. 78:2477–2480. [Google Scholar]
- Gueron, M., J. P. Demaret, and M. Filoche. 2000. A unified theory of the B-Z transition of DNA in high and low concentrations of multivalent ions. Biophys. J. 78:1070–1083. [DOI] [PMC free article] [PubMed] [Google Scholar]
- Ha, B. Y., and A. J. Liu. 1997. Counterion-mediated attraction between two like-charged rods. Phys. Rev. Lett. 79:1289–1292. [Google Scholar]
- Ha, B. Y., and A. J. Liu, 2001. Physical questions posed by DNA condensation. In Physical Chemistry of Polyelectrolytes. T. Radeva, editor. Marcel Dekker, New York. 163–180.
- Hansen, P. L., R. Podgornik, and V. A. Parsegian. 2001. Osmotic properties of DNA: Critical evaluation of counterion condensation theory. Physical Review E. 64:021907. [DOI] [PubMed] [Google Scholar]
- Hansma, H. G. 2001. Surface biology of DNA by atomic force microscopy. Annu. Rev. Phys. Chem. 52:71–92. [DOI] [PubMed] [Google Scholar]
- Hansma, H. G., K. A. Browne, M. Bezanilla, and T. C. Bruice. 1994. Bending and straightening of DNA induced by the same ligand: characterization with the atomic force microscope. Biochemistry. 33:8436–8441. [DOI] [PubMed] [Google Scholar]
- Hansma, H. G., and D. E. Laney. 1996. DNA binding to mica correlates with cationic radius: assay by atomic force microscopy. Biophys. J. 70:1933–1939. [DOI] [PMC free article] [PubMed] [Google Scholar]
- Ho, P. S., and B. H. M. Mooers. 1997. Z-DNA crystallography. Biopolymers. 44:65–90. [DOI] [PubMed] [Google Scholar]
- Inman, R. B. 1967. Some factors affecting electron microscopic length of deoxyribonucleic acid. J. Mol. Biol. 25:209–216. [DOI] [PubMed] [Google Scholar]
- Kankia, B. I. 2000. Hydration effects of Ni(2+) binding to synthetic polynucleotides with regularly alternating purine-pyrimidine sequences. Nucleic Acids Res. 28:911–916. [DOI] [PMC free article] [PubMed] [Google Scholar]
- Kindt, J. H., J. C. Sitko, L. I. Pietrasanta, E. Oroudjev, N. Becker, M. B. Viani, and H. G. Hansma. 2002. Methods for biological probe microscopy in aqueous fluids. In Atomic Force Microscopy in Cell Biology. B. P. Jena and H. Hoerber, editors. Academic Press, San Diego. 213–230. [DOI] [PubMed]
- Knoll, D., M. Fried, and V. Bloomfield. 1988. Heat-induced DNA aggregation in the presence of divalent metal salts. In DNA and Its Drug Complexes. R, Sarma and M. Sarma, editors. Adenine Press, New York. 123–145.
- Kornyshev, A. A., and S. Leikin. 1997. Theory of interaction between helical molecules. J. Chem. Phys. 107:3656–3674. [Google Scholar]
- Kornyshev, A. A., and S. Leikin. 1998a. Electrostatic interaction between helical macromolecules in dense aggregates: an impetus for DNA poly- and meso-morphism. Proc. Natl. Acad. Sci. USA. 95:13579–13584. [DOI] [PMC free article] [PubMed] [Google Scholar]
- Kornyshev, A. A., and S. Leikin. 1998b. Symmetry laws for interaction between helical macromolecules. Biophys. J. 75:2513–2519. [DOI] [PMC free article] [PubMed] [Google Scholar]
- Kornyshev, A. A., and S. Leikin. 1999. Electrostatic zipper motif for DNA aggregation. Phys. Rev. Lett. 82:4138–4141. [Google Scholar]
- Laemmli, U. K. 1975. Characterization of DNA condensates induced by poly(ethylene oxide) and polylysine. Proc. Natl. Acad. Sci. USA. 72:4288–4292. [DOI] [PMC free article] [PubMed] [Google Scholar]
- Lundblad, V. 2000. Telomeres: a tale of ends. Nature. 403:149,151. [DOI] [PubMed] [Google Scholar]
- Ma, C., L. Sun, and V. A. Bloomfield. 1995. Condensation of plasmids enhanced by Z-DNA conformation of d(CG)n inserts. Biochemistry. 34:3521–3528. [DOI] [PubMed] [Google Scholar]
- Manning, G. S. 1978. Molecular theory of polyelectrolyte solutions with applications to electrostatic properties of polynucleotides. Q. Rev. Biophys. 11:179–246. [DOI] [PubMed] [Google Scholar]
- Oosawa, F. 1971. Polyelectrolytes. Marcel Dekker, New York.
- Pullman, B., R. Lavery, and A. Pullman. 1982. Two aspects of DNA polymorphism and microheterogeneity: molecular electrostatic potential and steric accessibility. Eur. J. Biochem. 124:229–238. [DOI] [PubMed] [Google Scholar]
- Rau, D., and V. Parsegian. 1992. Direct measurement of temperature-dependent solvation forces between DNA double helices. Biophys. J. 61:260–271. [DOI] [PMC free article] [PubMed] [Google Scholar]
- Rouzina, I., and V. A. Bloomfield. 1998. DNA bending by small, mobile multivalent cations. Biophys. J. 74:3152–3164. [DOI] [PMC free article] [PubMed] [Google Scholar]
- Saenger, W. 1984. Principles of Nucleic Acid Structure. Springer-Verlag, New York.
- Schnell, J. R., J. Berman, and V. A. Bloomfield. 1998. Insertion of telomere repeat sequence decreases plasmid DNA condensation by cobalt (III) hexaammine. Biophys. J. 74:1484–1491. [DOI] [PMC free article] [PubMed] [Google Scholar]
- Schnurr, B., F. C. MacKintosh, and D. R. M. Williams. 2000. Dynamical intermediates in the collapse of semiflexible polymers in poor solvents. Europhysics Lett. 51:279–285. [Google Scholar]
- Schoenknecht, T., and H. Diebler. 1993. Spectrophotometric and kinetic studies of the binding of Ni2+, Co2+, and Mg2+ to poly(Dg-Dc).poly(Dg-Dc). Determination of the stoichiometry of the Ni2+-induced B → Z transition. J. Inorg. Biochem. 50:283–298. [DOI] [PubMed] [Google Scholar]
- Shen, M. R., K. H. Downing, R. Balhorn, and N. V. Hud. 2000. Nucleation of DNA condensation by static loops: formation of DNA toroids with reduced dimensions. J. Am. Chem. Soc. 122:4833–4834. [Google Scholar]
- Shklovskii, B. I. 1999. Wigner crystal model of counterion induced bundle formation of rodlike polyelectrolytes. Phys. Rev. Lett. 82:3268–3271. [Google Scholar]
- Soumpasis, D., M. Robert-Nicoud, and T. Jovin. 1987. B-Z DNA conformational transition in 1:1 electrolytes: dependence upon counterion size. FEBS Lett. 213:341–344. [DOI] [PubMed] [Google Scholar]
- Thomas, T. J., and V. A. Bloomfield. 1985. Toroidal condensation of Z DNA and identification of an intermediate in the B to Z transition of poly(dG-m5dC) X poly(dG-m5dC). Biochemistry. 24:713–719. [DOI] [PubMed] [Google Scholar]
- van de Sande, J. H., L. P. McIntosh, and T. M. Jovin. 1982. Mn2+ and other transition metals at low concentration induce the right-to-left helical transformation of poly[d(G-C)]. Embo J. 1:777–782. [DOI] [PMC free article] [PubMed] [Google Scholar]
- Van Steenwinkel, R., F. Campagnari, and M. Merlini. 1981. Interaction of Mn2+ with DNA as studied by proton-relaxation enhancement of solvent water. Biopolymers. 20:915–923. [DOI] [PubMed] [Google Scholar]
- Zimmer, C., G. Luck, and H. Triebel. 1974. Conformation and reactivity of DNA. IV. Base binding ability of transition metal ions to native DNA and effect on helix conformation with special reference to DNA-Zn(II) complex. Biopolymers. 13:425–453. [DOI] [PubMed] [Google Scholar]