Abstract
We describe a microchannel device which utilizes a novel approach to obtain area and volume measurements on many individual red blood cells. Red cells are aspirated into the microchannels much as a single red blood cell is aspirated into a micropipette. Inasmuch as there are thousands of identical microchannels with defined geometry, data for many individual red cells can be rapidly acquired, and the fundamental heterogeneity of cell membrane biophysics can be analyzed. Fluorescent labels can be used to quantify red cell surface and cytosolic features of interest simultaneously with the measurement of area and volume for a given cell. Experiments that demonstrate and evaluate the microchannel measuring capabilities are presented and potential improvements and extensions are discussed.
INTRODUCTION
One μL of human blood contains over 5,000,000 red blood cells (RBC), which vary considerably in membrane area and cytosolic volume. When RBC first emerge from the bone marrow, it is likely they are already unequal in size, owing to the several cell divisions needed to complete the transition from bone marrow stem cell to reticulocyte, the youngest of the circulating RBCs. The initial heterogeneity in RBC size is further amplified as a result of the many nonuniform losses in membrane area occurring throughout their 120-day lifespan (Waugh et al., 1992). This reduction in membrane is associated with various forms of vesicle shedding and Heinz body excision (Dumaswala and Greenwalt, 1984; Adachi, 1977). Loss of surface area is followed by compensatory loss of volume, attributed primarily to the action of Gardos channels (Johnson and Tang, 1992). The morphological heterogeneity is further compounded by the continual process of RBC turnover. Each day ∼0.9% of the standing RBC population is recognized as senescent and removed by macrophages in the spleen. An equivalent number of reticulocytes are released daily from the bone marrow.
The histograms of the full distributions of RBC area and volume no doubt contain useful information that is unavailable when studying the average values for an entire cohort. High-resolution measurements on a large number of individual red cell areas and volumes could shed light on the dynamics of erythropoiesis and red cell senescence as well as provide new information relevant for the diagnosis and treatment of assorted infectious or neoplastic disorders. Such individual RBC area and volume measurements would also be useful for tracking a patient's RBC population during the bone marrow suppression associated with radiation or chemotherapy.
Currently, the average red cell volume (mean corpuscular volume, or MCV) and the spread in red cell volumes (RBC volume distribution width) are routinely measured in clinical care and provide useful information about general health and hematological status (Hillman and Finch, 1996). However, these average values include no information regarding RBC surface area and do not fully describe the size heterogeneity of a given red cell population.
New techniques are needed to provide rapid, accurate single cell measurements of area and volume on a statistically significant number of RBCs. There is as yet no single method that can quantify these parameters simultaneously on many individual cells. The Coulter counter is a widely used device for measuring RBC volume. It can process a large number of cells in a short time and provides useful mean values such as MCV and RBC distribution width. However, this class of instruments derives the volume of a cell from electrical properties and such measurements can be significantly skewed by various RBC disorders (Strauchen et al., 1981). Moreover, the Coulter counter does not measure RBC area. Mohandas used flow-cytometric light scattering on isovolumetrically sphered RBC to obtain individual RBC volume measurements (Mohandas et al., 1986). This method also gives measurements for red cell hemoglobin concentration, but does not provide measurements of membrane area and appears impractical for use as a standard procedure. In the research lab, the technique of choice is micropipette aspiration (Rand and Burton, 1964; Evans, 1989), which gives individual measurements of both volume and surface area with good accuracy. However, this methodology is labor-intensive and time-consuming and therefore unsuitable for routinely making measurements on large numbers of red cells.
Here, we describe a microchannel device which utilizes a novel approach to obtain area and volume measurements on many individual red blood cells. The Human Erythrocyte Microchannel Analyzer (HEMA) uses nanofabrication technology to manufacture arrays of numerous identical microchannels in a transparent silicone elastomer (Brody et al., 1995; Sutton et al., 1997; Effenhauser et al., 1997; Voldman et al., 1999). Red cells are aspirated into the microchannels much as a single RBC is aspirated into a micropipette. Since there are thousands of identical microchannels with defined geometry, data for many individual red cells can be rapidly acquired. One can also use fluorescent labels to quantify red cell surface and cytosolic features of interest simultaneously with the measurement of area and volume for a given cell.
We have developed a HEMA prototype to measure red cell surface area and volume simultaneously on many cells. Once the cells are aspirated into the HEMA, we are able to acquire and process images of more than 500 cells in 5 min, thereby providing reliable estimates of red cell area and volume distributions, in addition to mean values (such as MCV), in a very short time. Since the HEMA measures area and volume independently on each cell, it also gives valid distributions on functions of the two parameters, e.g., the area-to-volume ratio. The HEMA is relatively easy to manufacture and use, and requires blood samples of less than 5 μL. Our prototype has already demonstrated its utility and dependability as a laboratory tool.
MATERIALS AND METHODS
Description of the HEMA
The inverse pattern of the HEMA design was etched on a silicon wafer by reactive ion plasma etching. The silicon wafer then serves as a master for casting many microchannel arrays in silicone elastomer. This procedure results in silicone channels that are nearly identical and have defined, regular geometries. After sealing, the array is lubricated and clamped to a flow system to draw red cells into the channels. Since the silicone cast of the array is transparent, the RBCs are readily visualized and analyzed within the device.
The HEMA pattern consists of a 1-cm × 0.5-cm array of rows of parallel microchannels. At the top of the HEMA, the microchannels are wide enough to readily allow passage of RBC with little deformation. However, in the center of the array, there are many identical wedge-shaped microchannels designed to capture RBCs (Fig. 1). The position of a retained RBC depends on its area-to-volume ratio and its overall size. Cells with a larger area-to-volume ratio are arrested further along in the wedge-shaped channels and larger cells have relatively longer profiles. It is possible to calculate the volume and surface area of each arrested cell simply by measuring its resting position in the channel.
FIGURE 1.
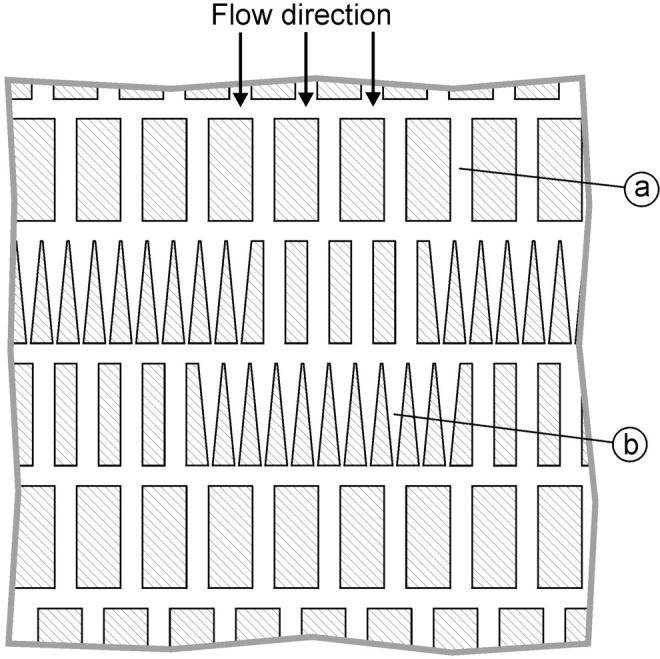
A schematic diagram of the HEMA array. The array consists of 300 rows of ∼300 parallel microchannels (only the middle part of the array is shown). The overall size of the array is 10 mm × 5 mm. Most of the microchannels in the array are 6-μm wide, so the red cells can easily pass through (a). The channels in the middle section have a wedge shape designed to arrest the cells (b). Note that there are wide channels in every row so that flow through the array does not cease even when all wedge-shaped channels fill with cells.
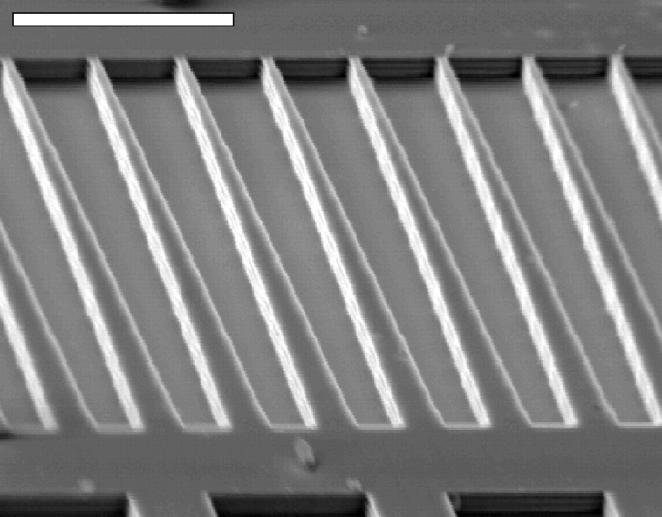
The silicon mold was etched at the National Nanofabrication Facility (Cornell University, Ithaca, NY). The microchannel pattern was designed using CAD software (SYMBAD, Cadence Design Systems, San Jose, CA). The inverse of the microchannel pattern was transferred onto a silicon wafer using electron beam lithography (Leica/Cambridge EBMF 10.5/CS), with spatial resolution of ∼100 nm. The pattern was etched into the wafer by the Bosch etching process, which ensures true vertical excavation with minimal anomalies (Fig. 2). Details for manufacturing the HEMA are fully described in Frank (1999).
FIGURE 2.
Scanning electron micrograph of the negative of the wedge-shaped channels etched in the silicon wafer. Since the resolution of the pattern transfer on the wafer was limited to ∼100 nm, the slope of the wedges is not perfectly smooth but has small steps. The etching process produced vertical but slightly rippled walls. The scale bar indicates 20 μm.
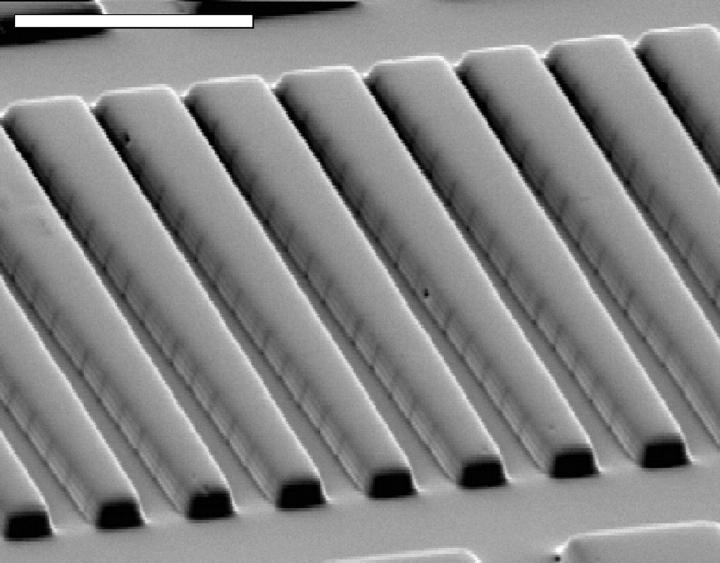
Two-part “Room Temperature Vulcanizing” silicone elastomer (RTV 615 A/B; G.E. Silicones, Waterford, NY) is poured into the etched silicon master (Effenhauser et al., 1997), and then cured at 100°C for 1 h. The hardened elastomer is readily peeled off the silicon. As shown by SEM images (Fig. 3), the etched pattern is faithfully replicated in the elastomer cast. To seal the microchannels with the same material, a standard glass microscope slide is spin-coated with a thin, even layer of elastomer. Before attaching the HEMA array to the elastomer-coated slide, both surfaces are oxidized for 100 s using a plasma cleaner/sterilizer (Harrick Scientific Corporation, Ossining, NY). The oxidation activates silanol (SiOH) groups on the elastomer surfaces so that they seal readily after contact and form a permanent siloxane bond (Si-O-Si) without the need for a compressive force (Duffy et al., 1998). The transmittance of RTV 615 was found to be relatively constant throughout the visible spectrum and we observed no autofluorescence.
FIGURE 3.
Scanning electron micrograph of the wedge-shaped channels cast in silicone elastomer. The silicone cast is a good replica of the silicon master (Fig. 2). The dark vertical lines on the channel walls are most likely the steps in the slope of the wedge shape. The scale bar indicates 20 μm.
Sample acquisition, preparation, and analysis
Blood samples were obtained from healthy volunteers with no history of hematological disorder and of varying ages, gender, and ethnicity. In most cases, the blood (<5 μL) was obtained by finger-stick and immediately diluted in a phosphate buffered saline (PBS) solution with glucose and bovine serum albumin (GASP; 9 mM Na2HPO4, 1.3 mM NaH2PO4, 140 mM NaCl, 5.5 mM glucose, and 1% BSA, pH 7.4, final osmolarity 290 mmol/kg). For some experiments, osmolarity was modulated by adjusting NaCl content, and measured with a Vapro vapor pressure osmometer (Wescor, Logan, UT). When larger amounts of blood were needed, venous blood was drawn into a heparinized syringe, and the cells were washed three times in the GASP buffer. The cells were applied to the HEMA at a hematocrit of ∼0.05% (i.e., 1 μL of whole blood diluted in 1 mL of GASP).
Before sample application, the HEMA microchannels were lubricated by perfusion with a 1% solution of methoxy-poly(ethylene glycol)-silane MW 5000 (PEG-silane, Shearwater Polymers, Huntsville, AL) for 5 min.
Use of A23187 for red cell dehydration
PBS containing 3.6 mM CaC12 was added 1:2 to red cells washed and resuspended in PBS at a hematocrit of 30%, and incubated at 37°C for 3 min. The Ca2+ ionophore A23187 was then added to a final concentration of 5 μM and the RBC suspension was incubated at 37°C for 30 min. Afterwards, the cells were washed with PBS containing 2.5 mM EDTA to chelate Ca2+, and then washed and resuspended in GASP.
Fluorescent labeling
Red cells were resuspended in TEA buffer (50 mM triethanolalamine, 100 mM NaC1, 10 mM glucose, 2 mM MgC1, pH = 7.9) and incubated for 30 min with biotin (EZ-Link Sulfo-NHS-LC-Biotin, Pierce Chemical Company, Rockford, IL). Biotinylated cells were washed and resuspended in ALP buffer (128 mM NaC1, 10 mM Na HEPES, 1 mM CaC12, 0.5 mM MgC12, 10 g/L BSA, pH 7.4) and incubated for 30 min with fluorescein-conjugated streptavidin (Molecular Probes, Eugene, OR). Finally, the cells were washed and resuspended in GASP.
MCV measurement
Mean corpuscular volume (MCV) was determined as the ratio between hematocrit and RBC concentration. Hematocrit was measured with a MicroMB Microcentrifuge (IEC International Equipment Company, Needham Heights, MA) and cell concentration with a Sysmex K-1000 automated cell counter (Sysmex Corporation of America, Long Grove, IL). Both measurements were performed in duplicate.
Counterflow centrifugation
Freshly collected red cells were washed and suspended in GASP buffer. They were then separated into fractions using a JE-5.0 elutriation system (Beckman, Fullerton, CA). By incrementally increasing the speed of the buffer flowing through the elutriator's rotating chamber, several cohorts of cells with increasing MCV were collected. A portion of the smallest cohort was treated with calcium ionophore. The cells were washed and immediately analyzed on the HEMA.
Microsphere calibration
The flow characteristics and dimensions of the HEMA microchannels were analyzed using several sizes of polymer microspheres (Duke Scientific, Palo Alto, CA and BANGS Laboratories, Fishers, IN). All chemicals were purchased from Sigma (St. Louis, MO), except as indicated. All incubations and analyses were done at room temperature (20–24°C), unless otherwise stated.
Experimental setup and protocols
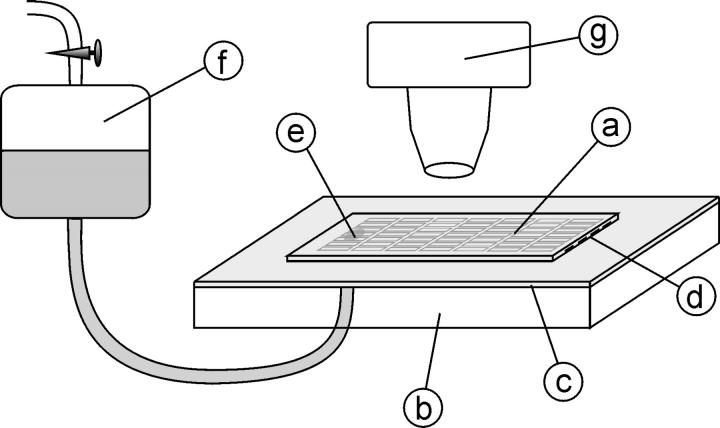
The experimental configuration is shown in Fig. 4. To establish flow through the microchannels, the module is open both at the entrance and at the bottom of the array, where an opening was made by previously drilling a 2-mm hole in the glass slide. In the beginning of each experiment, just after sealing the array, a drop of PEG-silane solution is added at the entrance of the microchannels. Capillary action draws the solution into the microchannels and wets them. The module is then clamped onto a suction diaphragm and attached to the microscope stage. Flow through the array is regulated by connecting the module to a water reservoir linked to a vacuum source. The air pressure in the reservoir (i.e., the aspiration pressure) is measured relative to the atmospheric pressure using a digital pressure gauge with a resolution of 50 Pa. The solution flowing through the microchannels can be replaced at any moment simply by absorbing the solution at the entrance and adding the desired buffer. Before aspirating red cells into the HEMA, the microchannels are perfused for 5 min with PEG-silane and then with GASP buffer for an additional 5 min. The red cell suspension is then placed at the entrance and the flow of buffer draws the cells into the array. The standard aspiration pressure used is 10 kPa. The flow rate at this pressure (∼1 nL/s) fills most of the wedge-shaped microchannels with red cells in ∼3 min.
FIGURE 4.
HEMA experimental setup. The microchannel array embedded in the silicone (a) is sealed facedown to a standard glass microscope slide (b) covered with a thin film of the same silicone elastomer (c). The entrance to the array is cut open (d). The exit section of the array is connected through a hole in the glass slide (e) to a water reservoir (f). The flow through the array is provided by aspiration pressure from a vacuum source coupled to the reservoir. The array module is transparent so that the microchannels can easily be visualized with a standard light microscope (g).
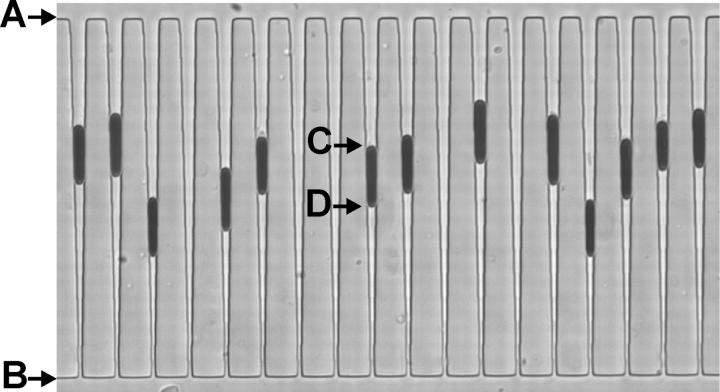
The cells are visualized with a light microscope connected to a PC via a CCD camera equipped with a frame grabber. At a magnification of 40×, ∼18 channels can be seen per field (Fig. 5). The use of a band-pass filter (400–430 nm) allows for the clear distinction between hemoglobin-rich red cells and any minor contamination from other cell types, such as leukocytes, that do not absorb light of this wavelength to such a high degree. HEMA images are analyzed with internally developed image recognition software that automatically identifies the entrance and exit of the tapered microchannels as well as the top and bottom of each arrested cell. Since the size and geometry of the microchannel array is known, and the shape of the arrested cells can be modeled (see below), we can calculate the individual red cell volumes and surface areas by delineating the top and bottom position of each cell.
FIGURE 5.
Red cells arrested in wedge-shaped microchannels as observed during a typical experiment. The arrows indicate the channel entrance (A) and exit (B), and the top (C) and the bottom (D) of a trapped cell. For each cell, the positions C and D are measured relative to A and B. These measurements are used to calculate cell area and volume. The microchannels on the figure are 80 ± 1 μm long and 3.4 ± 0.1 μm deep. The channel width at the entrance is 3.44 ± 0.2 μm and the width at the exit is 0.95 ± 0.2 μm.
RESULTS AND ANALYSIS
Flow analysis
The dimensions of the microchannels (L) are small (on the order of 10 μm) and the flow velocities (v) low enough (on the order of 100 μm/s) that the Reynolds number of buffer flow through the HEMA (Re = ρvL/η, where ρ is the density of water and η is the density of water) under normal conditions is also small (i.e., ∼10−3) so the flow is laminar (Brody et al., 1995). Consequently, an analysis of the relationship between flow through the HEMA and the aspiration pressure can be based on Poiseuille's law, which states that the pressure drop (Δp) along a channel is proportional to the resistance of the channel (R) and the flow rate through that channel (ΦV),
 |
(1) |
The flow and the pressure drop along a certain microchannel in the array can be readily calculated using the analogy between laminar fluid flow and parallel circuits. Thus, the total resistance of the array is the sum of the resistances of all rows in the array and the resistance of a single row is the result of the resistances of all its channels coupled in parallel. Considering the actual dimensions and the design of the HEMA, the resistance of a row with its wedge-shaped microchannels filled with red cells (i.e., when only its shunt microchannels are open) was estimated to be 0.7% of the total array resistance.
To verify this estimate, comparison was made with measurements of the velocity of 2-μm-diameter microspheres moving through a straight microchannel (50 μm long, 6 μm wide and 3.4 μm deep) in the array. As expected, the measured microsphere velocity was linearly proportional to total aspiration pressure. The measured slope of the total aspiration pressure-velocity relationship was 22 (±0.2) μm-s−1−kPa−1 (i.e., the mean velocity through those channels at the normal aspiration pressure 10 kPa was 220 μm-s−1). The ratio between the mean fluid velocity and the pressure drop estimated from Poiseuille's law and the array geometry was 44 (±0.2) μm-s−1−kPa−1. Comparison of the two results shows that the actual resistance of the microchannel array module is higher than estimated, but it is, nevertheless, of the same order of magnitude. The difference can be attributed to lack of knowledge of the actual geometry of the entrance and exit openings of the array in the resistance calculation. Using these results we can conclude that the relative resistance of one wedge-shaped microchannel row is ∼0.35% of the total module resistance. Consequently, if the aspiration pressure for the entire array is 10 kPa, the pressure exerted upon the cells arrested within it is ∼35 Pa.
Characteristics of arrested cells
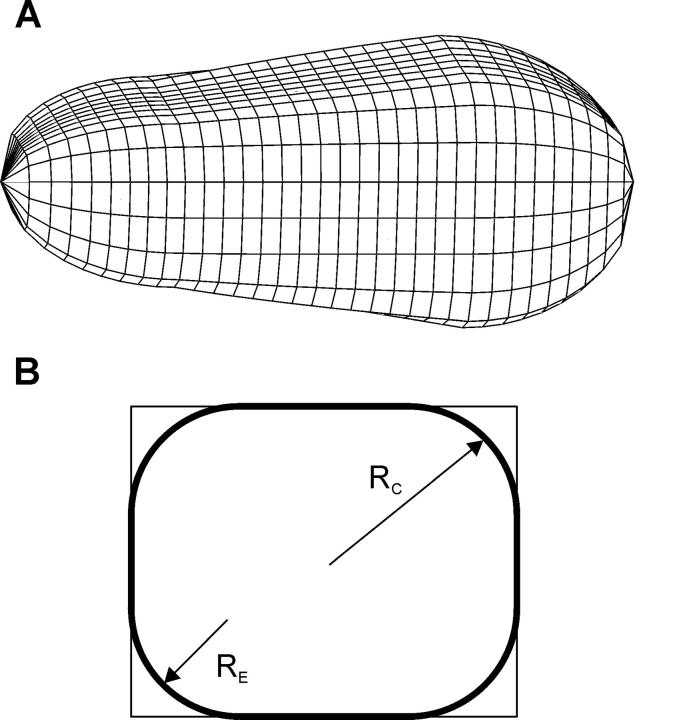
Our observations revealed that the flow of buffer through cell-occupied microchannels did not entirely cease. This indicates that arrested red cells do not perfectly fill the tapered rectangular shape of the channels, i.e., some space remains between the cell membrane and the corners of the channels. To examine the actual shape of an arrested cell, the membrane was labeled with a fluorescent marker before aspiration into the HEMA. The arrested cells were then inspected with a confocal microscope. The X-Y-Z scan of the confocal microscope generated a three-dimensional image of the membrane of arrested red cells. No membrane folds were observed in the membrane of arrested cells (Fig. 6), which reinforces our routine observation of the sudden “unfolding” of RBC as they are squeezed further into the channels before the moment of arrest. However, the resolution of the three-dimensional confocal images of arrested cells was not sufficient to precisely determine their geometry in the channel corners. Therefore the radius of curvature of the rounded edges in the corners (RE) was estimated numerically.
FIGURE 6.
The fluorescently labeled RBC membrane of an arrested cell as viewed with a confocal microscope. A superposition of 24 Z-planes obtained with X-Y-Z scan is shown. The nominal distance between the Z-planes was 0.2 μm. No creases in the membrane are observed.
During our experiments, analogous to micropipetting, we assume that the pressure gradient draws each RBC as far down into its channel as possible. Using a simple model of an arrested RBC (see below), one is able to calculate a unique value of RE (RE*) that maximizes the degree to which a cell can penetrate into a wedge-shaped channel. Generally, the magnitude of RE* is dependent on the area and volume of the cell. Therefore, we generated data for a large number of RBC areas and volumes, and solved for the corresponding values of RE* and RBC resting position (PRBC). Consequently, we observed a strong correlation between RE* and PRBC (r ≈ 0.98) and were able to establish a general relationship between RE* and the cell's position in the wedge without the need for a priori knowledge of its area or volume:
 |
(2) |
where PRBC is expressed as microns between the bottom of the channels and the midpoint of the RBC.
The deduced relationship was reinforced by directly observing the passage and trapping of fluorescent microspheres ( ) through channels containing RBC at various positions. It was calculated that red cells arrested “higher” in the wedge should allow passage of beads of this size through the channel corners, although cells with a smaller RE, i.e., those further down, should not. This is in fact what is directly observed and therefore we believe our estimate of the edge radius is acceptable. Consequently, we are able to calculate the amount of space left in the corners of each cell-occupied channel, and thus the area and volume of the RBC, simply from determining the cell's position in the channel.
We are now able to complete a simple three-dimensional model of the shape of a red cell arrested in a microchannel. The cell is modeled as a rectangular wedge with round edges and quasispherical caps (Fig. 7). The radius of the rounded edge is determined as stated above and treated as constant along the entire length of the cell for simplicity (note that, at the pressures typically used, the gradient in RE can be considered negligible). The caps of the cell were taken as hemispheres that are deformed to fit smoothly onto the rounded wedge. This simple model was used to calculate the surface area and volume of cells arrested in the HEMA. It is emphasized that this computation does not rely on the physical properties of the RBC (such as its shear or bending moduli) inasmuch as it is assumed that a cell's final resting position is determined solely by its area and volume. A finer detailed calculation would necessitate a more complex cap geometry and a nonconstant edge radius RE.
FIGURE 7.
Schematic representation of a three-dimensional model used for computing the area and volume of the arrested cells (A). The cells are considered to be rectangular wedges with rounded edges and caps. A cross-section of the main cell body (B). The round edges have a radius RE. The caps of the cell were taken as quasihemispheres, with an effective radius RC, made to fit smoothly with the membrane of the main body.
This geometrical model was then used to estimate the tension that is produced in the membrane when the cells are being aspirated into and arrested within the tapered microchannels. To calculate this membrane tension, the law of Laplace was utilized (a similar analysis on neutrophils was applied by Needham and Hochmuth, 1992), which relates membrane tension (T) to the pressure drop across the microchannel,
 |
(3) |
whereRT and RB are the radius of curvature of the top and the bottom cell cap, respectively. The radii of the top and bottom caps were approximated as the effective radii of the wedge at the point of attachment of the caps (in Fig. 7, this effective radius is denoted by RC). Since these typical radii are ∼2.1 μm and 2 μm, respectively, and the normal pressure drop in the wedge-shaped microchannels is 35 Pa, the typical membrane tension according to this estimation is on the order of 10−3 N/m.
This estimated membrane tension of arrested cells in the HEMA microchannels is an order of magnitude below the RBC lysis membrane tension, which was measured in micropipette experiments and is on the order of 0.01 N/m (Evans, 1989). As expected, no lysis was observed at the aspiration pressures used in our standard measurements.
Evaluation of HEMA measurements
RBC adhesion to an uncoated silicone rubber surface is substantial. When an untreated silicone elastomer array was used, cells stuck to the walls even when passing through the wide distributive microchannels at the entrance of the array. In contrast, after perfusing the array with PEG-silane solution for 5 min, we completely eliminated sticking in the wide channels. This lubrication is effective because the silane component of PEG-silane binds to the hydroxyl groups on the silicone elastomer surface, leaving only the inert PEG tails exposed (Emoto et al., 1998). To further evaluate red cell adhesion in the microchannels, where the arrested cells are pressed against the channel walls for longer periods of time, two kinds of tests were performed.
In the first test, red cells were arrested in their lubricated microchannels and, after 5 min at standard aspiration pressures, flow through the HEMA was reversed, releasing the red cells from their channels. The number of red cells stuck to the walls after flow reversal was then counted. Even with the optimized procedure for microchannel coating, it was not possible to entirely prevent adhesion. However, less than 5% of the arrested cells remained in their microchannels after flow reversal. As observed also in micropipette experiments (Artmann et al., 1997), many of the red cells released from the silicone microchannels were echinocytic, and reverted back to the normal discocyte morphology within 5 min.
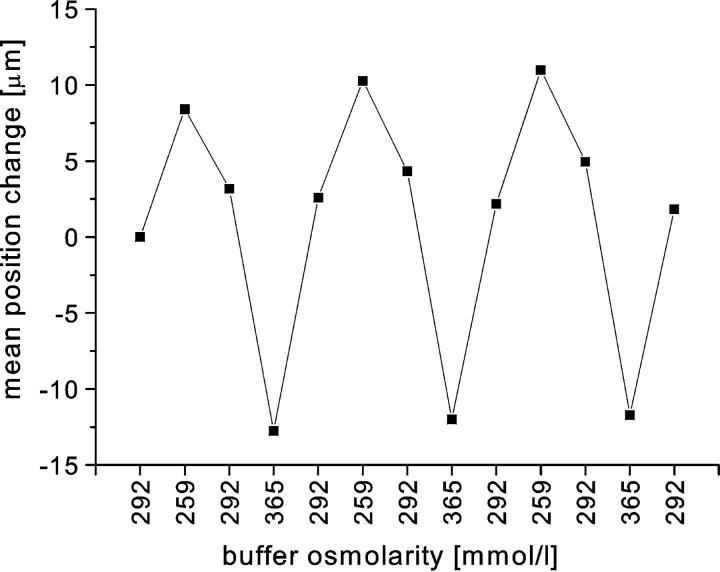
In the second test, the cells were arrested as usual, and then the buffer flowing through the array was cyclically exchanged from hypoosmotic to hyperosmotic and back. In this manner we periodically changed the volumes of red cells arrested in the HEMA. After each alteration of buffer osmolarity, we waited until the cells reached their new equilibrium position and then measured their positions in the channels. Tracking of the individual cells over several cycles for more than 30 min showed that the cells were able to repeatedly accommodate to buffer osmolarity (Fig. 8). When hypoosmotic buffer was introduced, the cells swelled and moved upward toward the entrance of the channels, and with hyperosmotic buffer they shrank and were pushed further down into the wedge. Fig. 8 reveals a slight hysteresis in mean cell position, indicating that there may be a modest amount of friction between the cell surface and the channel walls. Nevertheless, there was no observable adhesion in this experimental format.
FIGURE 8.
The mean change in cell position with changes in osmolarity of the buffer flowing through the array. The experiment was carried out as follows. Once the cells were arrested in the microchannels, the osmolarity of the perfusing buffer was periodically changed. Buffers of three different osmolarities were used (292, 259, and 365 mmol/kg). When a buffer of lower osmolarity was introduced the cells swelled and moved upward, and the opposite was true of shifts to higher osmolarity. The positions were measured after equilibrium was attained. The mean difference in position was calculated for 40 cells. The mean cell position correctly follows the changes in buffer osmolarity.
Accuracy and reproducibility of HEMA measurements
There may be at least two sources of minor systematic error in the current HEMA measurements. First, there is the error arising from the measurements of the dimensions of the wedge-shaped microchannels. Primarily this is due to the difficulty in measuring the depth of the channels once they are sealed to the coated glass slide. Nevertheless, by aspirating microspheres of several sizes, we were able to estimate the channel depth (≈3.4 μm) with ∼3% error. The second potential source of error is the simplified model of arrested RBC geometry, where the corner roundness parameter (RE from Fig. 7) and the shape of the cell caps are not known exactly. Changing the cell model used can affect the computed area and volume measurements by a few percent.
On the other hand, the random error in the HEMA measurements is quite small. That is because the cell positions are measured relative to the channel length and thus have a relatively small error arising from the limitations of optical resolution (∼2%). Also, the uniformity of sizes of the wedge-shaped channels formed in silicone elastomer was found to be excellent. The uniformity of the channel width was first studied by trapping microspheres of known diameter in the wedge-shaped microchannels. We found that nearly all trapped microspheres of a given size aligned at the same position in the wedge-shaped channels. For example, when microspheres of 3 μm diameter were arrested (n = 181), their mean measured resting position was at 66 μm from the channel end with an SD of 0.6 μm, i.e., less than 1%.
The uniformity of the channel depth along the length of the microchannels was estimated by measuring the absorbance of 415 ± 10 nm light in an array filled with a hemoglobin solution. Although there were small differences observed between different types of channels in our arrays, we found no significant variation in depth along the length of the wedge-shaped channels. This method assumed uniformity of dimensions between the channels, which was confirmed by measuring the area of a single red cell made to sequentially enter several (n = 9) wedge-shaped channels by repeatedly alternating the direction of flow through the array. The consistency of the area measurements on an individual RBC was repeatedly within the resolution of the HEMA. These results indicate that the dimensions of each channel can justifiably be considered uniform.
Thus, although current HEMA measurements could still contain a slight systematic error, they nevertheless have a small random error. Therefore, as long as the same protocol is used in any given experimental series, the results are comparable and reproducible. To demonstrate this, several different tests were performed.
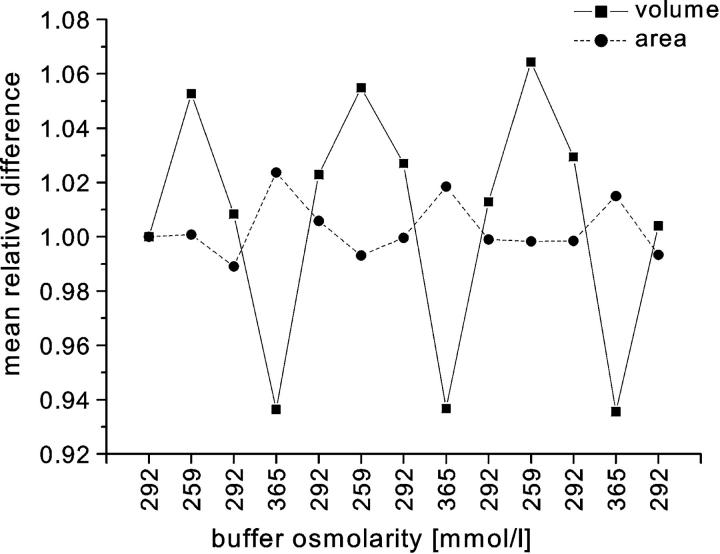
To test whether the HEMA actually measures the surface area and volume independently, the changes of surface area and volume of the cells as they were exposed to buffers of various osmolarities were calculated. The cell volumes are expected to change with osmolarity, but the areas should remain the same. Fig. 9 shows the results obtained from the same experiment as presented in Fig. 8. For every cell, we determined the change of area and volume relative to the values obtained with isotonic buffer in the beginning of the experiment. The mean change was measured for 40 different cells. As expected, the calculated cell volume follows the changes in osmolarity whereas the calculated area remains approximately the same. The nonrandom changes in area observed in Fig. 9 are less than 2% and most likely reflect the systematic errors of the HEMA measurements.
FIGURE 9.
The mean relative change of cell volume and area from the same experiment as presented in Fig. 8. The relative changes were calculated with respect to the values measured at the beginning of the experiment. As expected, the calculated volumes follow the change of osmolarity whereas the changes in the calculated areas are much smaller. The small nonrandom changes in the area may reflect the systematic errors of the HEMA.
To examine the reproducibility of the HEMA measurements, samples from the same solution of blood were measured for several consecutive trials, each time with a fresh HEMA module. In each trial, ∼500 cells were measured. The first three moments (the mean, SD, and skewness) of area and volume distributions were calculated, as well as the area-to-volume ratio, the correlation coefficient, and the linear regression parameters k and A0. The magnitudes of mean area and volume are in the range of those reported in previous studies (see Table 3 in Fung et al., 1981). Reproducibility of the HEMA measurements can be evaluated from their variation within one sample. The results of the average values and coefficients of variation obtained over several trials on samples from three different donors are presented in Table 1. Within each sequence, the coefficient of variation for the mean values of both volume and surface area is less than 2.5%, which is in good agreement with the theoretical value for 500 cells (i.e., 500−1/2 ≈ 4%). As expected, the coefficients of variation increase for the higher moments of the distributions. Consequently, the statistics on 500 cells cannot give reliable estimates of the skewness of the measured distributions, in which case a population of several thousand cells would be required.
TABLE 1.
The reproducibility of the HEMA measurements
| Area
|
Volume
|
Area/Volume
|
Regression parameters
|
||||||||
|---|---|---|---|---|---|---|---|---|---|---|---|
| mean [μm2] | SD [μm2] | skewness | mean [fL] | SD [fL] | skewness | mean [μm2/fL] | SD [μm2/fL] | skewness | k [μm2/fL] | A0 [μm2] | |
| Average (n = 6) | 136 | 12.4 | 0.21 | 97.7 | 10.8 | 0.21 | 1.39 | 0.05 | 1.12 | 1.11 | 27.6 |
| CV | 0.82% | 5.1% | 56% | 1.8% | 5.5% | 53% | 1.04% | 8.2% | 17% | 3.5% | 11.5% |
| Average (n = 5) | 151 | 14.1 | 0.04 | 103 | 11.2 | 0.14 | 1.47 | 0.06 | 1.14 | 1.18 | 29.1 |
| CV | 2.2% | 4.0% | 313% | 1.8% | 1.7% | 72% | 0.93% | 5.1% | 21% | 2.9% | 8.3% |
| Average (n = 5) | 138 | 13.0 | 0.10 | 98.6 | 11.0 | 0.14 | 1.41 | 0.05 | 1.17 | 1.13 | 27.2 |
| CV | 0.96% | 3.9% | 103% | 1.6% | 5.4% | 71% | 0.86% | 4.6% | 17% | 1.50% | 4.6% |
SD represents the standard deviation for a given measurement distribution.
CV indicates the coefficient of variation for each parameter over n trials.
To evaluate the accuracy of the HEMA, its measurements of MCV were compared to those using a standard method (see Materials and Methods) on the same subjects. Fig. 10 shows the wide distribution of MCVs studied and the close agreement of the HEMA measurements with those of the standard method over the entire range. The relationship between MCV values of the two methods was found to not be significantly different from unity (p = 0.14 via paired t-test). The slight bias of ∼1% in the HEMA measurement may represent a combination of small systematic errors in one or both of the methods. Nevertheless, it is expected that the vast majority of all HEMA measurements would agree with those of the standard method to within a few percent (i.e., the 95% confidence interval is approximately between −3% and +5%).
FIGURE 10.
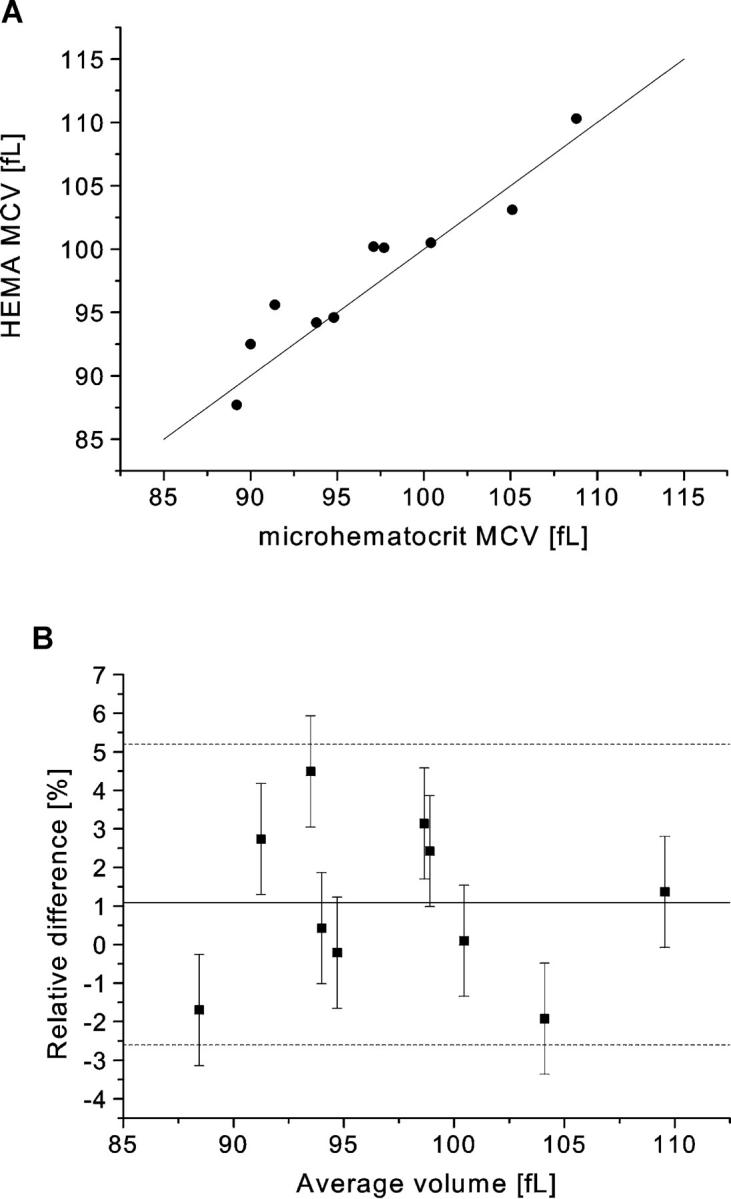
The relationship between MCV measured with the HEMA and with the standard method. The two sets of values are plotted against each other with the line of unity (A), and as their percent difference vs. their average value (B). In the second panel, the solid line represents the mean error (ē ≈ + 1.1%, with 95% confidence limits at −0.4% and +2.6%) and the dashed lines define the 95% confidence interval for the distribution of data. The error bars represent the combined measurement error of the difference of the two methods (≈(0.652 + 1.282)1/2 ≈ 1.44%), where the random error in the standard method (0.65%) was determined from multiple measurements made on the 10 blood samples and the random HEMA error (1.28%) was determined from the data associated with Table 1.
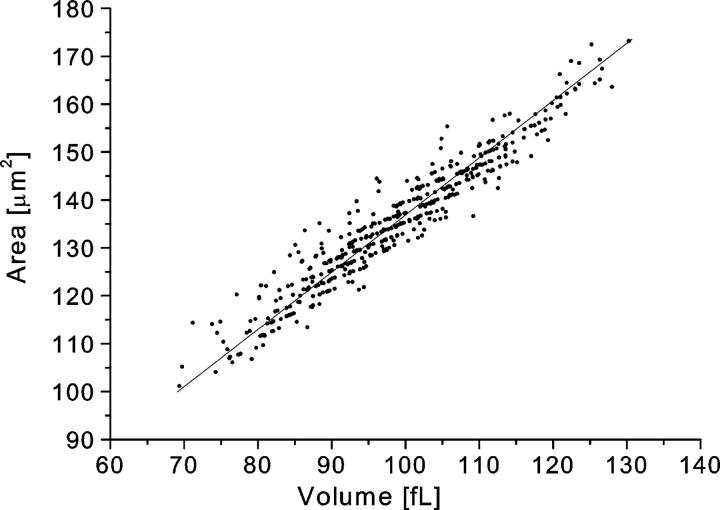
Since the HEMA measures volume and area independently, it is useful for analyzing the relationship between the two. In general, we found a strong linear correlation between area and volume with typical correlation coefficients of ∼0.95. Invariantly, regression analysis to a linear relation, A = k × V + A0, yielded a positive intersection, and consequently the value of the slope was smaller than the mean cell area-to-volume ratio. The linear relationship may be enforced in vivo by the constraints of passage through the microcirculation (Waugh and Sarelius, 1996) coupled with the fact that the ratio of volume to area is directly related to an RBC's critical diameter, i.e., the diameter of the smallest capillary through which it can pass without lysis (Kowluru et al., 1989). A typical relation between area and volume is shown in Fig. 11. Note that quantization of cell position in a channel into multiples of pixel size leads to a finite number of RBC area and volume combinations. The resulting “ordering” of the area-volume scatterplot is apparent in the figure.
FIGURE 11.
The relation between cell volume and surface area in a typical measurement. The solid line represents the regression line fitted to the relation A = k × V + A0. The measured values in this case are: k = 1.1 μm2/fL (the mean area-to-volume ratio was 1.37 μm2/fL), A0 = 26.8 μm2, and the correlation coefficient between area and volume was 0.96.
Finally, we tested the ability of the HEMA to discern subpopulations of cells within one sample. To obtain a mixture of different subpopulations, we used counterflow centrifugation to prepare fractions of different cell sizes. To further amplify the difference among the subpopulations we treated the smallest fraction with the ionophore A23187 and Ca2+ rich buffer. The ionophore is known to increase the permeability of the membrane to Ca2+ ions (Reed and Lardy, 1972), consequently activating the movement of cytosolic K+ ions out of the red cells via Gardos channels. This results in cellular dehydration as the departing KCl osmotically obligates water (Johnson and Tang, 1992). The measured areas and volumes of different fractions are presented in Table 2. It is apparent that the ionophore A23187 not only decreases red cell volume but also decreases red cell surface area. This second effect can most likely be attributed to vesicle production, which can result from the activation of scramblase by Ca2+ ions (Bucki et al., 1998).
TABLE 2.
Results obtained for different fractions of the separation with counterflow centrifugation and ionophore A23187 dehydration
| Area
|
Volume
|
Area/Volume
|
Regression Parameters
|
|||||
|---|---|---|---|---|---|---|---|---|
| mean [μm2] | SD [μm2] | mean [fL] | SD [fL] | mean [μm2/fL] | SD [μm2/fL] | k [μm2/fL] | A0 [μm2] | |
| Control | 134 | 12.4 | 95 | 10.4 | 1.43 | 0.05 | 1.15 | 25.6 |
| Large fraction | 137 | 11.8 | 98 | 9.7 | 1.40 | 0.04 | 1.18 | 21.5 |
| Small fraction | 125 | 11.3 | 84 | 8.7 | 1.49 | 0.06 | 1.22 | 22.4 |
| A23187-treated Small fraction | 120 | 10.3 | 70 | 6.0 | 1.71 | 0.10 | 1.34 | 26.1 |
SD represents the standard deviation for a given measurement distribution.
The cell fraction with the largest area and volumes obtained from counterflow centrifugation and the dehydrated smallest fraction were finally mixed in a 1:1 ratio and the mixture was loaded into the HEMA. The results for the HEMA measurements on the red cell mixture are presented in Fig. 12. In the histograms of area and volume distribution, each subpopulation clearly stands out as a separate peak. The difference is even more striking on the area-volume scatter plot, where the two subpopulations are revealed as two distinct islands. This test shows that the HEMA can readily discriminate between subpopulations, within a given sample, that differ in area and volume. Moreover, the data of the mixed sample is seen to faithfully consist of the two individual distributions alone (i.e., the solid lines of Fig. 12). This indicates that individual RBC measurements are unaffected by the overall heterogeneity of the blood sample being studied.
FIGURE 12.
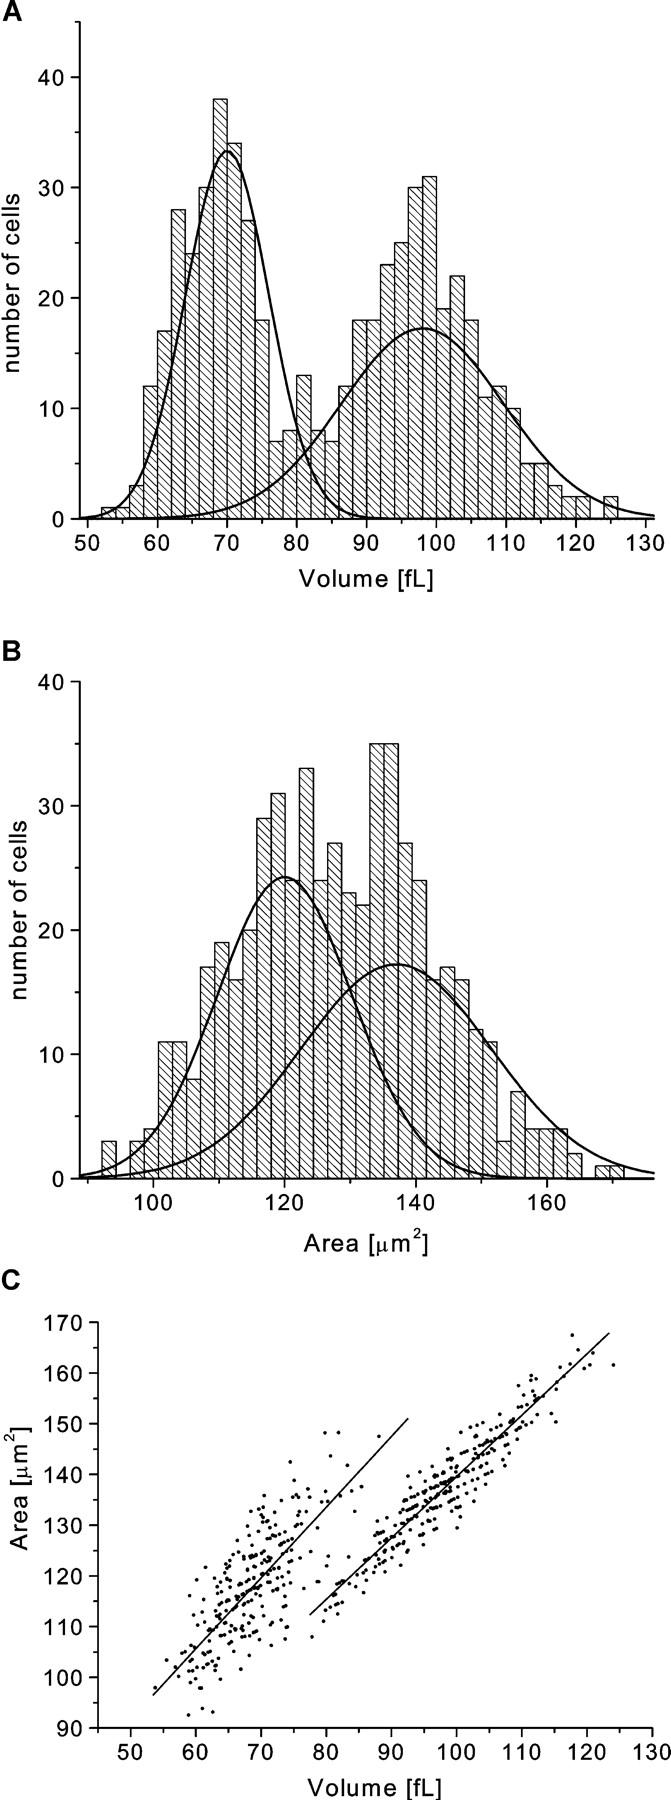
The histograms of the distributions of area (a) and volume (b) and the correlation between the two (c) for a sample with two different subpopulations of red cells mixed at a 1:1 ratio. The two subpopulations are the small cell size fraction and the large cell size fraction obtained via counterflow centrifugation. The small fraction was additionally dehydrated with ionophore A23187 and calcium buffer. The solid lines represent curves fitted to the data obtained from the measurements performed on each of the subpopulations alone (see Table 2).
CONCLUSIONS
In this paper we described the synthesis and operational features of the HEMA. We demonstrated the efficacy of this apparatus for rapidly measuring the area and volume of more than 500 red cells.
Silicone elastomer microchannel arrays were shown to be well suited for controlled measurements on RBC. The flow through the microchannels was laminar and easily regulated by varying aspiration pressure, with typical flow rates through the array of ∼1 nL/s (or mean flow speeds ∼200 μm/s).
Although the silicone elastomer is not completely rigid, the microchannels, when probed with microbeads and by evaluating a series of channels with the same red cell, demonstrate a level of uniformity that substantiates the utility of the HEMA as a reliable measuring device. This conclusion is reinforced by the accuracy and reproducibility of the HEMA measurements (Fig. 10 and Table 1). In addition, the HEMA data allowed for the clear discrimination between two subpopulations of different cell size that were mixed together in one blood sample (Fig. 12). Thus, the HEMA has been shown to reliably provide accurate measurements of red cell volume and surface area.
With the use of a motorized stage, the prototype HEMA can analyze ∼500 cells in 5 min. This provides an acceptable amount of data for estimating the mean and SD of measured parameters in a very short time. Nevertheless, there is no technical limit to designing arrays of several thousand identical microchannels and rapidly analyzing a much larger number of red cells. Such a design would give even more reliable statistics and could be used to accurately determine the third moment of the measured distributions, the skewness, which characterizes the degree of asymmetry of a distribution around its mean. The higher moments of the area distribution would be particularly important, inasmuch as it conceivably is directly related to the distribution of red cell age. Therefore, the technology presented is capable of providing useful information in the evaluation of erythropoiesis, which can be affected by chemotherapy, radiation, genetic and acquired hematological disorders, and the use of erythropoietin-like molecules to enhance athletic performance.
Lubrication with PEG-silane was found to be extremely important in reducing the adhesion of red cells to the silicone elastomer microchannel walls. While cells adhered strongly to the untreated silicone, coating the surface of microchannels significantly diminished adhesion, even for long periods of time (Fig. 8). The cell-friendly environment and the ability to exchange the buffer flowing through the array greatly extend the possible uses of the HEMA. For example, once cells are arrested in the wedge-shaped microchannels, one can analyze their dynamic adaptation to chemical changes in the perfusing buffer. Specifically, we were able to observe reversible volume changes in arrested cells as we exchanged the osmolarity of the buffer (Fig. 9).
While the HEMA was used here solely for area and volume measurements, it would be possible to include simultaneous measurements of many other parameters. For example, there are existing techniques for the optical measurement of cell hemoglobin content (Coletta et al., 1988), and a large assortment of fluorescent labels with which to investigate other membrane and cytosolic constituents that may be of interest. Thus, one could obtain informative data for the purpose of correlating various red cell parameters with area and volume measurements. This extension of the HEMA's capability is currently being explored.
In summary, the Human Erythrocyte Microchannel Analyzer has been shown to be a useful technique for the analysis of red blood cell size heterogeneity. Its ability to provide distributions of, and correlations between, various cellular parameters enables a level of insight well beyond that afforded by simply studying average values. Before the emergence of microfabrication technology, obtaining statistically significant data on several parameters of individual cells would have required arduous techniques taking many hours. The development of the HEMA has demonstrated the power of employing this technology in a biological context to increase efficiency without sacrificing accuracy. Further existing advantages of the HEMA are simplicity of use, low cost of production of silicone elastomer modules, and the requirement of an extremely small blood sample. Therefore, we believe that the HEMA has substantial potential as both a basic research tool as well as a clinical diagnostic instrument. In addition, with different microchannel designs, the general method may have many applications beyond the specific example presented in this article.
Acknowledgments
This work was performed in part at the Cornell Nanofabrication Facility (a member of the National Nanofabrication Users Network), which is supported by the National Science Foundation under Grant ECS-9731293, its users, Cornell University, and Industrial Affiliates. All other research and development was carried out at the Visual and Circulatory Biophysics Laboratory at Boston University, supported by Office of Naval Research grant N00014-98-1-0451. In addition, S.C.G. is supported by a fellowship from the Whitaker Foundation.
References
- Adachi, H. 1977. Pathological study on experimental Heinz body anemia: intracellular changes of phagocytized red cells in macrophages of the spleen and liver. Acta Pathol. Jpn. 27:657–675. [DOI] [PubMed] [Google Scholar]
- Artmann, G. M., K.-L. P. Sung, T. Horn, D. Whittemore, G. Norwich, and S. Chien. 1997. Micropipette aspiration of human erythrocytes induces echinocytes via membrane phospholipid translocation. Biophys. J. 72:1434–1441. [DOI] [PMC free article] [PubMed] [Google Scholar]
- Brody, J. P., Y. Han, R. H. Austin, and M. Bitensky. 1995. Deformation and flow of red blood cells in a synthetic lattice: evidence for an active cytoskeleton. Biophys. J. 68:2224–2232. [DOI] [PMC free article] [PubMed] [Google Scholar]
- Bucki, R., C. Bachelot-Loza, A. Zachowski, F. Giraud, and J.-C. Sulpice. 1998. Calcium induces phospholipid redistribution and microvesicle release in human erythrocyte membranes by independent pathways. Biochemistry. 37:15383–15391. [DOI] [PubMed] [Google Scholar]
- Coletta, M., A. I. Alayash, M. T. Wilson, P. A. Benedetti, V. Evangelista, and M. Brunori. 1988. Single cell microspectroscopy reveals that erythrocytes containing hemoglobin S retain a ‘memory’ of previous sickling cycles. FEBS Lett. 236:127–131. [DOI] [PubMed] [Google Scholar]
- Duffy, D. C., J. C. McDonald, O. J. A. Schueller, and G. M. Whitesides. 1998. Rapid prototyping of microfluidic systems in poly(dimethylsiloxane). Anal. Chem. 70:4974–4984. [DOI] [PubMed] [Google Scholar]
- Dumaswala, U. J., and T. J. Greenwalt. 1984. Human erythrocytes shed exocytic vesicles in vivo. Transfusion. 6:490–492. [DOI] [PubMed] [Google Scholar]
- Effenhauser, C. S., G. J. M. Bruin, A. Paulus, and M. Ehrat. 1997. Integrated capillary electrophoresis on flexible silicone microdevices: analysis of DNA restriction fragments and detection of single DNA molecules on microchips. Anal. Chem. 69:3451–3457. [DOI] [PubMed] [Google Scholar]
- Emoto, K., J. M. Van Alstine, and J. M. Harris. 1998. Stability of poly(ethylene glycol) graft coatings. Langmuir. 14:2722–2729. [Google Scholar]
- Evans, E. A. 1989. Structure and deformation properties of red blood cells: concepts and quantitative methods. Methods Enzymol. 173:3–35. [DOI] [PubMed] [Google Scholar]
- Frank, M. G. 1999. The Human Erythrocyte Microchannel Analyzer, a novel diagnostic device. Masters thesis. Boston University, Boston, Massachusetts.
- Fung, Y. C., W. C. O. Tsang, and P. Patitucci. 1981. High resolution data on the geometry of red blood cells. Biorheology. 18:369–385. [DOI] [PubMed] [Google Scholar]
- Hillman, R. S., and C. A. Finch. 1996. Red Cell Manual. F.A. Davis Company, Philadelphia, Pennsylvania.
- Johnson, R. M., and K. Tang. 1992. Induction of a Ca2+-activated K+ channel in human erythrocytes by mechanical stress. Biochim. Biophys. Acta. 1107:314–318. [DOI] [PubMed] [Google Scholar]
- Kowluru, R., M. W. Bitensky, A. Kowluru, M. Dembo, P. A. Keaton, and T. Buican. 1989. Reversible sodium pump defect and swelling in the diabetic rat erythrocyte: effects on filterability and implications for microangiopathy. Proc. Natl. Acad. Sci. USA. 86:3327–3331. [DOI] [PMC free article] [PubMed] [Google Scholar]
- Mohandas, N., Y. R. Kim, D. H. Tycko, J. Orlik, J. Wyatt, and W. Groner. 1986. Accurate and independent measurement of volume and hemoglobin concentration of individual red cells by laser light scattering. Blood. 68:506–513. [PubMed] [Google Scholar]
- Needham, D., and R. M. Hochmuth. 1992. A sensitive measure of surface stress in the resting neutrophil. Biophys. J. 61:1664–1670. [DOI] [PMC free article] [PubMed] [Google Scholar]
- Rand, R. P., and A. C. Burton. 1964. Mechanical properties of the red cell membrane. I. Membrane stiffness and intracellular pressure. Biophys. J. 4:115–135. [DOI] [PMC free article] [PubMed] [Google Scholar]
- Reed, P. W., and H. A. Lardy. 1972. A23187: A divalent cation ionophore. J. Biol. Chem. 247:6970–6977. [PubMed] [Google Scholar]
- Strauchen, J. A., W. Alston, J. Anderson, Z. Gustafson, and L. F. Fajardo. 1981. Inaccuracy in automated measurement of hematocrit and corpuscular indices in the presence of severe hyperglycemia. Blood. 57:1065–1067. [PubMed] [Google Scholar]
- Sutton, N., M. C. Tracey, I. D. Johnston, R. S. Greenaway, and M. W. Rampling. 1997. A novel instrument for studying the flow behaviour of erythrocytes through microchannels simulating human blood capillaries. Microvasc. Res. 53:272–281. [DOI] [PubMed] [Google Scholar]
- Voldman, J., M. L. Gray, and M. A. Schmidt. 1999. Microfabrication in biology and medicine. Annu. Rev. Biomed. Eng. 1:401–425. [DOI] [PubMed] [Google Scholar]
- Waugh, R. E., N. Mohandas, C. W. Jackson, T. J. Mueller, T. Suzuki, and G. L. Dale. 1992. Rheologic properties of senescent erythrocytes: loss of surface area and volume with red blood cell age. Blood. 79:1351–1358. [PubMed] [Google Scholar]
- Waugh, R. E., and I. H. Sarelius. 1996. Effects of lost surface area on red blood cells and red blood cell survival in mice. Am. J. Physiol. 271:C1847–C1852. [DOI] [PubMed] [Google Scholar]


