

Abstract
Our mathematical model of the rat ventricular myocyte (Pandit et al., 2001) was utilized to explore the ionic mechanism(s) that underlie the altered electrophysiological characteristics associated with the short-term model of streptozotocin-induced, type-I diabetes. The simulations show that the observed reductions in the Ca2+-independent transient outward K+ current (It) and the steady-state outward K+ current (Iss), along with slowed inactivation of the L-type Ca2+ current (ICaL), can result in the prolongation of the action potential duration, a well-known experimental finding. In addition, the model demonstrates that the slowed reactivation kinetics of It in diabetic myocytes can account for the more pronounced rate-dependent action potential duration prolongation in diabetes, and that a decrease in the electrogenic Na+-K+ pump current (INaK) results in a small depolarization in the resting membrane potential (Vrest). This depolarization reduces the availability of the Na+ channels (INa), thereby resulting in a slower upstroke (dV/dtmax) of the diabetic action potential. Additional simulations suggest that a reduction in the magnitude of ICaL, in combination with impaired sarcoplasmic reticulum uptake can lead to a decreased sarcoplasmic reticulum Ca2+ load. These factors contribute to characteristic abnormal [Ca2+]i homeostasis (reduced peak systolic value and rate of decay) in myocytes from diabetic animals. In combination, these simulation results provide novel information and integrative insights concerning plausible ionic mechanisms for the observed changes in cardiac repolarization and excitation-contraction coupling in rat ventricular myocytes in the setting of streptozotocin-induced, type-I diabetes.
INTRODUCTION
Cardiovascular complications arising from diabetes mellitus are a leading cause of morbidity and mortality (Dillmann, 1989; Standl and Schnell, 2000). In addition to an increased incidence of coronary artery disease, the electrophysiological and the mechanical properties of the myocardium are significantly impaired (Dillmann, 1989; Mahgoub and Abd-elfattah, 1998). The rat constitutes a widely utilized experimental model used to study the effects of diabetes on the heart. In an acute model of type-I (insulin deficient) diabetes, rats are injected with streptozotocin (STZ) (100 mg/kg of body wt.), and then sacrificed 4–6 days after treatment (Shimoni et al., 1994; 1995). Rat ventricular myocytes from this short-term diabetic model exhibit a prolongation of the action potential duration (APD) (Shimoni et al., 1994; 1995), along with altered intracellular Ca2+ homeostasis, depicted by a small reduction in the peak systolic value, and a slower decay of the intracellular Ca2+ transient ([Ca2+]i) (Ren and Davidoff, 1997). The marked delay in the final repolarization of the action potential may be responsible for the observed lengthening of the QT interval in diabetic patients (Robillon et al., 1999), and this can contribute to the enhanced incidence of cardiac arrhythmias (Ewing et al., 1991). It is therefore important to understand the ionic mechanism(s) that underlie the altered repolarization and the excitation-contraction (E-C) coupling associated with the short-term, type-I, model of diabetes, and to gain quantitative insights into the relationship between these variables.
Experimental studies have shown that injecting STZ results in a reduction in the densities of both the Ca2+-independent transient outward K+ current (It), and the steady-state outward K+ current (Iss) (Shimoni et al., 1994; 1995). The subsequent decrease in the net repolarizing current is responsible for the prolongation of the APD (Shimoni et al., 1994; 1995). In contrast, the subcellular mechanisms responsible for the abnormal [Ca2+]i behavior in the short-term diabetic model are not understood, although it is believed that dysfunction associated with the uptake of Ca2+ into the sarcoplasmic reticulum (SR) is responsible (Ren and Davidoff, 1997). Recently it was reported that freshly isolated normal adult rat ventricular myocytes maintained under cell culture conditions with hypoinsulinemia and hyperglycemia developed a phenotype (prolonged APD, slower [Ca2+]i decay), somewhat similar to the one that has been described for myocytes isolated from the in vivo, short-term diabetic model (Davidoff and Ren, 1997; Ren et al., 1997). Hyperglycemic culture conditions are known to activate protein kinase C (PKC). More specifically, the ɛ isoform of PKC (ɛPKC) is activated and translocated to the sarcolemma (Malhotra et al., 2001). ɛPKC is the major PKC isoform in the adult rat ventricle (Bogoyevitch et al., 1993; Rybin and Steinberg, 1994). Activation of ɛPKC not only modulates It and Iss (Shimoni, 1999), as is observed in the in vivo diabetic model (Shimoni et al., 1994; 1995), but has also been shown to downregulate the densities of the L-type Ca2+ current (ICaL) (Hu et al., 2000), and the Na+-K+ pump current (INaK) (Buhagiar et al., 2001). Results from the available experimental studies therefore suggest that multiple interdependent ionic mechanisms (It, Iss, ICaL, INaK, and SR uptake) can mediate the electrophysiological alterations associated with this acute, type-I model of diabetes.
One approach for obtaining novel, semiquantitative insights into the complex, nonlinear interactions between different ionic mechanisms in cardiac electrophysiology is to utilize mathematical models that are based closely on experimental findings. In this way the cardiac action potential can be reconstructed, based on detailed biophysical formulations of the underlying ionic currents, pumps, and exchangers (Rudy, 2000; Winslow et al., 2000; Noble, 2002). Recently, we have developed a comprehensive mathematical model for the cardiac action potential of adult rat ventricular myocytes (Pandit et al., 2001). The equations in this model were based on biophysically derived descriptors of experimentally recorded ionic currents, pumps, and the Na+-Ca2+ exchanger (INaCa) in myocytes isolated from the adult rat ventricle. The descriptions for the Ca2+ homeostasis mechanisms (dynamics and buffering) in the rat model were adapted (with minimal modifications) from a recent publication of Ca2+ handling in the canine midmyocardial cell (Winslow et al., 1999).
The main goal of the present study was to develop a mathematical representation of the diabetic phenotype by incorporating changes in the ionic mechanisms that are suggested by experimental data to underlie the altered electrophysiological characteristics in the short-term, type-I model of STZ-induced diabetes. The model is able to qualitatively simulate the prolongation of the APD in accordance with experimental results (Fig. 1). Moreover, it provides novel insights into the ionic basis for this change in the action potential profile during diabetic conditions, and illustrates the complex, nonlinear relationship between the APD and both intracellular Ca2+ homeostasis, and E-C coupling.
FIGURE 1.

(A) Action potential waveforms for model generated control (solid line) and diabetic (dashed line) action potentials. (B) Experimentally recorded control (solid line) and diabetic (dashed line) action potentials at 1 Hz and 22°C (Shimoni et al., 1994).
METHODS
Mathematical model of the rat right ventricular myocyte
A mathematical model of the adult rat right ventricular (RV) cell was employed in all simulations because myocytes isolated from the RV have been utilized in most available experimental studies (Shimoni et al., 1994). This model was derived from a recently published left ventricular (LV) epicardial cell model (Pandit et al., 2001) by making modifications to the following ionic currents:
INa
The density of INa was increased by 33%. This was based on recent experimental findings, which reported a variation in the density of INa in the rat ventricle, with higher expression in RV myocytes, compared with those from the LV epicardial ones (Ashamalla et al., 2001).
It
The density of It was increased by 25%, based on reported larger values of It in rat RV myocytes than LV epicardium (Casis et al., 1998).
ICaL, Iss
The densities of both ICaL and Iss were increased by 10%, so that the influx of Ca2+ ions via ICaL (QCaL), and the APD90 value during a simulated RV action potential were comparable to corresponding experimental measurements in rat RV myocytes (Kaprielian et al., 1999; MacDonell et al., 1998) (See the Results section for a comparison of simulated and experimental values in normal RV myocytes).
A model of the rat right ventricular cell in the setting of type-I diabetes
The following modifications were made in the computational model of the normal rat RV myocyte to represent the short-term, type-I diabetic myocyte.
It
The density of It was decreased by 32%. The formulation of It also consists of fast and slow inactivation variables, with the relative contribution of the slow variable to overall inactivation being ≈11% in the normal myocyte. This was increased to ≈31% in the diabetic myocyte. Both of these changes are based on experimental observations that the density of It is reduced, and its reactivation kinetics is slower in diabetic ventricular myocytes (Shimoni et al., 1994; 1995). The simulated current-voltage (I-V) relationship of It is shown in Fig. 2 A, along with corresponding experimental data, which was recorded in control and diabetic RV myocytes respectively (Shimoni et al., 1994).
FIGURE 2.
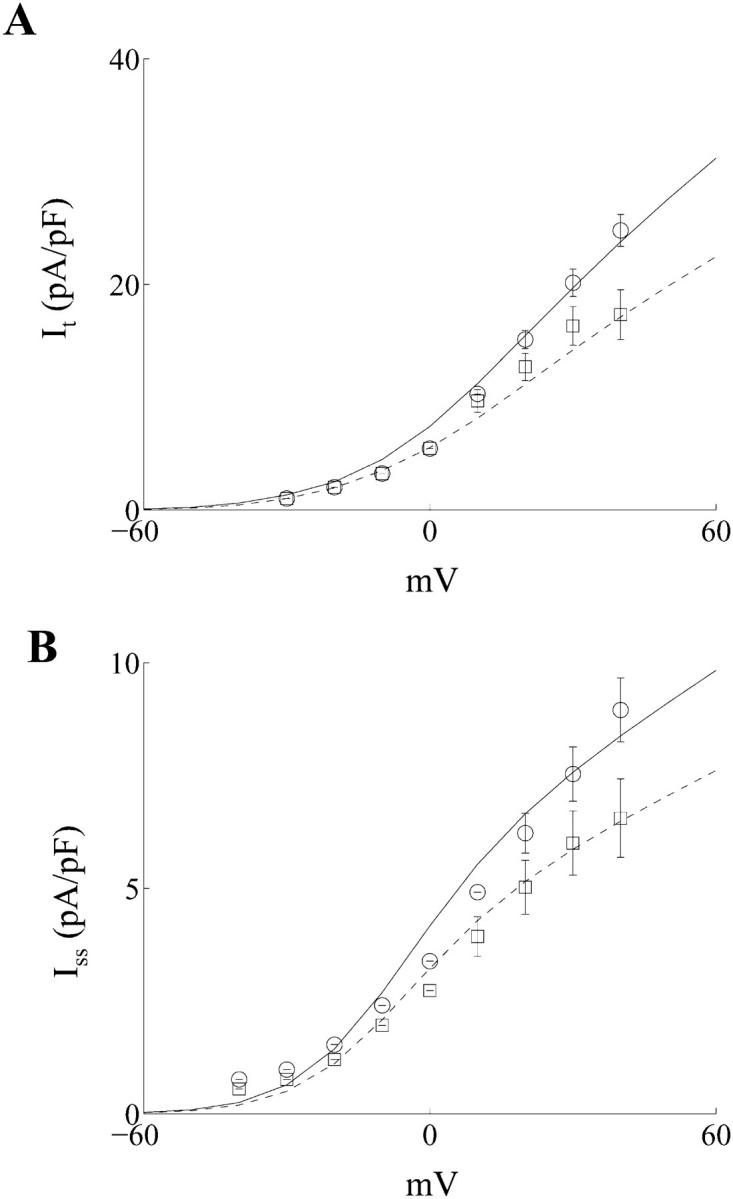
(A) Simulated current-voltage (I-V) relationship for the Ca2+-independent transient outward K+ current It in control (○, solid line) and diabetic (□, dashed line) myocytes, which were isolated from the adult rat right ventricle (○, □ represent experimental data from Shimoni et al., 1994). (B) Simulated current-voltage (I-V) relationship for the steady-state outward K+ current Iss in control (○, solid line) and diabetic (□, dashed line) myocytes, which were isolated from the adult rat right ventricle (○, □ represent experimental data from Shimoni et al., 1994).
Iss
The density of Iss was decreased by 23%. Fig. 2 B illustrates the simulated I-V characteristics for Iss in normal and diabetic rat RV myocytes, along with experimental data (Shimoni et al., 1994).
ICaL
The density of ICaL was reduced by 24%. This was based on recent experimental findings that the activation of ɛPKC in adult rat ventricular myocytes reduces ICaL density by 27.9 ± 2.2% (Hu et al., 2000). It has also been shown recently that the fast inactivation time constant of ICaL is slowed (by ≈40%) in the chronic model of diabetes (Chattou et al., 1999). The fast inactivation time constant of ICal in our model was therefore reduced by 10%, to represent the acute diabetic conditions.
INaK
It is well-known that the Na+-K+-ATPase activity is decreased in STZ-induced diabetic rats (Kato et al., 1999). This was incorporated in the diabetic model by reducing the maximum density of INaK by 37%. This was based on the reported effects of ɛPKC on INaK density measured in rabbit ventricular myocytes (Buhagiar et al., 2001).
The changes in ICaL and INaK were incorporated based on the observation that ɛPKC is activated and then translocated to the sarcolemmal membrane in cultured rat ventricular myocytes maintained under high extracellular glucose concentrations of 25.0 mM (Malhotra et al., 2001). This glucose level is similar to the plasma glucose concentrations recorded in the short-term, type-I, in vivo model of diabetes in rat, viz. 26.3 ± 2.15 mM (Shimoni et al., 1994).
IBCa, IBNa
The steady or background Ca2+ current (IBCa) was reduced by 50% in the diabetic myocyte. This was done to maintain almost identical values of diastolic [Ca2+]i during both control and diabetic simulations, in accordance with experimental findings (Ren and Davidoff, 1997). The peak magnitude of IBCa during resting conditions in the control myocyte is very small (≈5 pA). Therefore the 50% reduction in IBCa will not affect the action potential duration significantly in diabetes. Nevertheless, to compensate for a reduction of IBCa, the Na+ background current (IBNa) conductance was increased by 25% in the diabetic myocyte, so that the total background current (IB) in the range of membrane potentials near rest in both control and diabetic simulations was almost identical.
SR Ca2+-ATPase
Although defects in the SR mechanisms have been well-studied in the chronic model of diabetes (Netticadan et al., 2001), very little quantitative information is available regarding these alterations in the acute model of diabetes (Ren and Davidoff, 1997). A recent study has shown that the SERCA2a protein density is decreased by ≈60% in a chronic model of diabetes (Netticadan et al., 2001). Similarly, it is known that the affinity of Ca2+ ions to the SR pump is also reduced in chronic diabetes (Zhong et al., 2001). Based on these observations in the chronic model of diabetes, it has been postulated that defects in the uptake of Ca2+ ions into the SR also underlie the abnormal [Ca2+]i behavior in short-term diabetes (Ren and Davidoff, 1997). The SR Ca2+-ATPase scaling factor (KSR) in the RV computational model was reduced by 45%, and the Ca2+-ATPase forward rate parameter (vmaxf) was reduced by 20%, to represent the overall impairment in the refilling of the SR, and simulate an altered [Ca2+]i similar to the one observed experimentally in short-term diabetes.
Other assumptions
The membrane capacitance (Cm) was assigned the same value (100 pF) in the control and the diabetic cell models, consistent with experimental findings (Shimoni et al., 1994). It has been recently reported that the function of the Na+-Ca2+ exchanger (INaCa) is not altered in rat ventricular myocytes cultured under high glucose conditions (Dutta and Davidoff, 2000). Therefore the parameters for INaCa were similar in the control and diabetic model formulations. All other ionic mechanisms, as well as the parameters describing the SR Ca2+ handling were assumed to be identical in the control and the diabetic models. The extracellular ionic concentrations in both the models were assumed to be constant, and all simulations were carried out at an assumed temperature of 22°C, conditions under which most of the experimental data were recorded.
Computational aspects
The mathematical model was implemented in C, on a SUN Microsystem Sparc Ultra 60 workstation. A Runge-Kutta-Merson numerical integration algorithm, which includes an automatic step-size adjustment that is based on an error estimate, was used for the whole-cell simulations, as in our previous model studies (Demir et al., 1994, 1997, 1999; Pandit et al., 2001). The software package Matlab was also utilized in formulating model equations for the ionic channels. All the results are presented in their steady state, which was defined as the action potential obtained after allowing the model to run for 20 s after a change in the initial conditions. This approach is in accordance with earlier modeling studies examining changes in action potential and [Ca2+]i profiles in pathophysiological conditions such as heart failure (Winslow et al., 1999) and atrial fibrillation (Courtemanche et al., 1999). This ensures rapid rate adaptation of the action potential, but does not take into account the long-term effects in the changes in the intracellular ionic concentrations (Courtemanche et al., 1999). The rat model requires a run time of ∼10 min on the present computing platform to simulate a steady-state action potential.
RESULTS
Action potential waveforms and underlying ionic currents in control and diabetic ventricular myocytes
A stimulus of 0.6 nA was applied for 5 ms, in accordance with experimental protocols (Ward et al., 1997), to generate the simulated control and diabetic action potentials at a frequency of 1.0 Hz and an assumed temperature of 22°C. (Fig. 1 A). The effects of the intracellular Ca2+ buffer EGTA in the recording pipette were included in the model in accordance with an earlier formulation (Winslow et al., 1999), because EGTA is used in majority of the electrophysiological experiments of this kind (Shimoni et al., 1994). A set of experimentally recorded action potentials under control and diabetic conditions (Shimoni et al., 1994) are shown in Fig. 1 B. The simulated control RV action potential closely resembles its experimental counterpart (Fig. 1). The simulated diabetic APD is larger than the corresponding control counterpart (Fig. 1 A) in accordance with experimental results (Fig. 1 B). However, the experimentally recorded diabetic action potential exhibits a larger prolongation (Fig. 1 B) than seen in simulations (Fig. 1 A). A quantitative comparison between the simulated and experimental diabetic action potentials was not attempted mainly because of the reportedly large variations in the duration and the shape of experimentally recorded diabetic action potentials, despite similar isolation procedures and recording conditions (e.g., see Fig. 1, B and C, in Shimoni et al., 1994). In particular, the APD90 value varies considerably in individual diabetic cells over time, and from cell to cell (Shimoni et al., 1998). This could be the result of variations in the magnitudes of the K+ or background currents in diabetes (Shimoni et al., 1998), or due to the enhancement of the intrinsic action potential heterogeneity, in the rat ventricular myocardium (Watanabe et al., 1983; Ward and Giles, 1997). For these reasons, the emphasis in this modeling study was on determining whether the simulated diabetic action potential could qualitatively reproduce the experimentally observed action potential changes resulting from STZ-induced diabetes. A similar approach was successfully employed in our previous simulations, which compared and contrasted epicardial and endocardial action potentials in adult rat left ventricular myocytes (Pandit et al., 2001).
The simulated control and diabetic action potential characteristics are compared in detail in Table 1. Parameters for the simulated control RV action potential (Table 1) are very close to the corresponding experimental measurements from control myocytes, which were −80.15 ± 0.79 mV (Vrest), 205.6 ± 11.8 V/s (dV/dtmax), 40.94 ± 1.26 mV (peak overshoot), 33.27 ± 5.31 ms (APD90) (All measurements from MacDonell et al., 1998); and 62.8 ± 28.3 MΩ (Rin) (Shimoni et al., 1994). Vrest, Rin, and peak overshoot have similar values in the simulated control and diabetic action potentials, whereas the APD50 and APD90 are larger in the diabetic action potential; this is in qualitative agreement with experimental observations (Shimoni et al., 1994). In fact, even the small depolarization in Vrest (by 0.55 mV), and a small increase in Rin (by 0.31 MΩ) in the simulated diabetic action potential agree with the experimental observation that “the passive properties of diabetic cells were not significantly different from those of the normal cells, although there was a tendency toward a slight depolarization of the resting potential and an increase in input resistance” (Shimoni et al., 1994). Our model also exhibits a small reduction in dV/dtmax during the diabetic action potential (decreased by 5.05%), with respect to the control value.
TABLE 1.
Simulated action potential characteristics in control and diabetic myocytes from the rat right ventricle
| Vrest (mV) | Rin (MΩ) | dV/dtmax (V/s) | PO (mV) | APD50 (ms) | APD90 (ms) | |
|---|---|---|---|---|---|---|
| Control | −80.48 | 71.25 | 182.97 | 41.63 | 14.29 | 31.11 |
| Diabetic | −79.93 | 71.56 | 173.73 | 42.10 | 22.50 | 48.86 |
Vrest: resting membrane potential; Rin: input resistance; dV/dtmax: maximum upstroke velocity; PO: peak overshoot; APD50: action potential duration (50% repolarization); APD90: action potential duration (90% repolarization).
Rate-dependent changes of the simulated cardiac action potentials at frequencies of 0.5 Hz and 2.0 Hz, in both control and diabetic cases, are shown in Fig. 3 A and B, respectively. When the stimulation rate was increased from 0.5 Hz to 2.0 Hz, the APD prolongation was more pronounced in the diabetic conditions. This agrees with experimental observations (Shimoni et al., 1994). The time- and voltage-dependent currents that primarily determine the plateau phase of the cardiac action potential in rat ventricular myocytes (It, ICaL, Iss) are shown in Fig. 4. Both It and ICaL have smaller peak amplitudes in the diabetic case, whereas the peak magnitude of Iss is almost unchanged. Overall, there is a net reduction in the outward repolarizing current, leading to a prolongation of the APD. The alteration in the ICaL waveform in diabetes (smaller magnitude, slower deactivation) has important implications for dynamic changes in [Ca2+]i, and is discussed in the next subsection. The Na+-K+ pump and the Na+-Ca2+ exchanger currents (INaK and INaCa, respectively), the inward rectifier K+ current (IK1), and the background current (IB) underlying the simulated control and diabetic action potentials are shown in Fig. 5. INaK is reduced in the diabetic case. Note that IB and IK1 have an altered profile; this difference between the control and diabetic conditions is primarily due to the changed contour of the action potential waveforms (the density of IK1 was identical in the control and the diabetic models, IB is almost similar in control and diabetic cases).
FIGURE 3.

Rate dependence of simulated action potentials. (A) Steady-state effects of applying stimuli on the control action potential at 0.5 Hz (solid line) and 2.0 Hz (dashed line). (B) Steady-state effects of applying stimuli on the diabetic action potentials at 0.5 Hz (solid line) and 2.0 Hz (dashed line).
FIGURE 4.

(A) Simulated action potentials, (B) underlying Ca2+-independent transient outward K+ current (It), and the L-type Ca2+ current (ICaL), and (C) the steady-state outward K+ current (Iss) during the control (solid line) and diabetic (dashed line) conditions.
FIGURE 5.

(A) Simulated action potentials, (B) underlying Na+-K+ pump current (INaK), the Na+-Ca2+ exchanger current (INaCa), and (C) the background current (IB), and the inward rectifier K+ current (IK1) during control (solid line) and diabetic (dashed line) conditions.
[Ca2+]i and associated fluxes in control and diabetic cells
The simulated [Ca2+]i waveforms corresponding to the control and diabetic action potentials are shown in Fig. 6. The diastolic and the peak systolic values of [Ca2+]i during the simulated control RV action potential (73.34 nM and 330.83 nM) were comparable to corresponding experimental measurements in control RV myocytes, viz. 78.4 ± 22.6 nM and 401 ± 115.0 nM respectively (Kaprielian et al., 1999). The peak systolic value of the simulated [Ca2+]i is reduced by ≈5% in the diabetic case (Table 2), although the diastolic values were similar (≈73 nM). This reduction in the peak systolic [Ca2+]i is in accordance with experimental observations, where the mean peak Ca2+ ratio (measurements made using Fura-2) in the diabetic cells was reduced by ≈10.0% (Ren and Davidoff, 1997). The simulated Ca2+ transient declines more slowly in the diabetic case, as demonstrated in experimental observations (Ren and Davidoff, 1997). The alterations in the ICaL waveform result in a higher influx of Ca2+ ions (QCaL) during the diabetic action potential, compared to the control one (exact values were 15.63 pC and 12.24 pC respectively). QCaL value for the RV myocyte in the control case is in close agreement with the experimental measurement, 12.4 ± 1.7 pC (Kaprielian et al., 1999). The net influx of Ca2+ions (via ICaL and IBca) during an action potential in both the control and diabetic cases is balanced by the Ca2+ extrusion via INaCa during a cardiac cycle (Table 2). This is in accordance with experimental findings regarding the balance of Ca2+ ion transfer across the sarcolemma during a cardiac cycle (Bouchard et al., 1995; Clark et al., 1996). The Ca2+ content in the junctional SR (JSR) just before the application of a stimulus to elicit a simulated action potential in the control RV myocyte was 60.24 μM; this is similar to the recently reported physiological values of SR Ca2+ content in rat ventricular myocytes, which were 64.0 ± 6.0 μM (Trafford et al., 2001) and 56 ± 7.2 μM (Sah et al., 2001). The JSR Ca2+ content was reduced by 26.38% during the diabetic action potential (the absolute value was 44.35 μM). However, the depletion of the JSR during both control and diabetes actions potentials was comparable; JSR was depleted by ≈36% and ≈39% during control and diabetic action potentials respectively.
FIGURE 6.

(A) Simulated action potentials, (B) underlying junctional sarcoplasmic reticulum Ca2+ load ([Ca2+]JSR), and (C) the underlying intracellular Ca2+ transient ([Ca2+]i) during control (solid line) and diabetic (dashed line) conditions.
TABLE 2.
Simulated sarcolemmal and intracellular calcium fluxes in control and diabetic myocytes from the rat right ventricle
| QCaL (pC) | QBCa (pC) | QNaCa (pC) | [Ca2+]i,rest (nM) | [Ca2+]i,peak (nM) | SRrest (μM) | |
|---|---|---|---|---|---|---|
| Control | 12.24 | 4.66 | 16.07 | 73.34 | 330.83 | 60.24 |
| Diabetic | 15.63 | 2.3 | 16.96 | 73.13 | 316.14 | 44.35 |
QCaL: Calcium influx via ICaL during the action potential; QBCa: Calcium influx via IB,Ca during the action potential; QNaCa: Calcium efflux via INaCa during the action potential; [Ca2+]i,rest: Diastolic value of [Ca2+]i [Ca2+]i,peak: Peak systolic value of the Ca2+ transient during the action potential; SRrest: JSR Ca2+ content during diastole.
DISCUSSION
The main motivation for the development of this model was to gain further quantitative insights concerning the ionic basis of the impaired excitation, repolarization, and E-C coupling processes in myocytes isolated from the ventricle of adult rats exhibiting STZ-induced type-I diabetes. To achieve this, we first derived and validated an approach for simulating the electrophysiological responses and E-C coupling for the normal or control rat RV myocyte. This formulation was then modified to mimic the electrophysiological changes reported for the type-I model of diabetes. The majority of these changes were based on semiquantitative data obtained from patch clamp experiments in STZ-induced diabetic myocytes, or observations in cultured myocytes maintained under hyperglycemic conditions. These were complemented with assumptions based on measurements made in chronic diabetic conditions (when data in acute diabetic conditions was unavailable). The resulting simulations were able to mathematically reconstruct a variety of the electrophysiological changes, which are consistent features of diabetic myocytes. These include: an increased APD, more pronounced rate-dependent APD prolongation, slower dV/dtmax, abnormal [Ca2+]i homeostasis, as well as the small changes in the properties of the quiescent cells (Vrest, Rin). Our computations illustrate how the diabetic phenotype can result from concomitant changes and complex nonlinear interactions between a number of ion-channel currents (It, Iss, ICaL, IB, INa), and currents due to the antiporter/pump (INaCa, INaK), and SR mechanisms (SR uptake and load).
Action potential duration and inotropy in diabetes
Initial investigations into the ionic basis of the delayed repolarization in myocytes isolated from the short-term, type-I diabetic model in rats showed that the densities of It and Iss were reduced (Shimoni et al., 1994; 1995). Recent investigations employing molecular biology techniques have shown that the mRNA levels as well as the protein densities of the K+ channel α-subunits Kv4.2, Kv4.3, and Kv2.1 are downregulated in this acute model of STZ-induced diabetes in rats (Qin et al., 2001). Kv4.2/Kv4.3 α-subunits are thought to encode for It (Fiset et al., 1997, Oudit et al., 2001); whereas the Kv2.1 α-subunit along with other α-subunits such as Kv1.5 and Kv3.1/Kv3.2 is thought to underlie the TEA-sensitive K+ current Iss in rat ventricular myocytes (Nerbonne, 2001; Schultz et al., 2001).
In contrast, the role of changes in ICaL in the diabetic phenotype remains poorly defined. Earlier experiments in chronic diabetes reported no significant changes in ICaL density (Jourdon and Feuvray, 1993); however, more recent studies have suggested that the density of ICaL is downregulated (Wang et al., 1995; Chattou et al., 1999), and its fast inactivation time constant is slowed (Chattou et al., 1999). When the diabetic action potential in our model was simulated assuming no changes in ICaL properties (not shown), the APD was increased, but the model failed to simulate the reported abnormal changes in [Ca2+]i, despite an impaired SR uptake. In fact, under these conditions/assumptions, the peak systolic value of [Ca2+]i was enhanced. Further computational analyses showed that this change in [Ca2+]i was caused by the increase in APD, which was so large (due to no reduction in the inward current ICaL), that it led to a substantial enhancement of the influx of Ca2+ ions via ICaL (increase by ≈100%), when compared to the control case. This behavior is consistent with earlier experimental results (Bouchard et al., 1995; Clark et al., 1996), as well as recent model simulations (Pandit et al., 2001), which demonstrated the mechanistic linkage between an increased APD and increased influx of Ca2+ ions. The increased influx was the basis of a larger trigger for calcium induced calcium release (CICR), and subsequently increased the efficiency of SR release (Pandit et al., 2001; Sah et al., 2001), thereby compensating for the impaired SR uptake. The end result was a higher peak systolic value for [Ca2+]i.
However, when the diabetic action potential was simulated by incorporating a reduced density and slower inactivation kinetics of ICaL as well as an impaired SR uptake, the model was able to simultaneously simulate an increased APD and a small decrease in [Ca2+]i amplitude. For example, a reduction in ICaL density by 24% resulted in a relatively smaller increase in the influx of Ca2+ ions during the diabetic action potential (increase by ≈28%). This smaller trigger for CICR, along with an impaired SR uptake, resulted in the peak systolic value for [Ca2+]i being somewhat smaller during the diabetic action potential (Table 2), which is in accordance with experimental results (Ren and Davidoff, 1997). A reduction in ICaL (an inward current) will also tend to reduce the APD. However, because this reduction was also accompanied by simultaneous reductions in It and Iss, along with the slower inactivation of ICaL, the net result was an overall reduction in the outward repolarizing current, thereby prolonging the APD.
Our simulations thus support the hypothesis that changes in the properties of ICaL are essential in explaining the diabetic phenotype (increased APD, reduced [Ca2+]i), and draw attention to the intricate nonlinear interaction between It, Iss, ICaL, and SR uptake, which brings about this change.
Rate dependence, excitation, and quiescent properties of ventricular myocytes in type-I diabetes
The recovery from inactivation of It in rat model formulations is biphasic in nature, consisting of fast and slow components (Pandit et al., 2001). This is in accordance with experimental observations (Shimoni et al., 1995). The contribution of the slow component to overall inactivation is ≈11% in the control case, and is enhanced to ≈31% in the diabetic case. By incorporating the experimentally described slowed recovery in It (Shimoni et al., 1994), the model is able to simulate the enhanced prolongation of APD when stimulus frequency was increased from 0.5 Hz to 2.0 Hz under diabetic conditions, compared with the control one (Fig. 3). Interestingly, the fast and slow inactivation variables in the model formulation for It have been deemed to represent the contributions of Kv4.2/Kv4.3 and Kv1.4 to It respectively (Pandit et al., 2001). The greater contribution of the slower inactivation variable in the diabetic model is in accordance with very recent experimental observations demonstrating that the density of Kv1.4 is substantially enhanced in diabetic conditions (Nishiyama et al., 2001).
Our model also predicts a small decrease (≈5%) in the upstroke of the diabetic action potential, which has been experimentally observed (Pacher et al., 1999). Our simulations show that the underlying cause for this decrease is the reduction in the availability of the Na+ channels, due to the small depolarization of Vrest. Specifically, the steady-state, half-inactivation voltage of INa is −76.1 mV; therefore even a small depolarization (0.5–1.0 mV) in Vrest can change the Na+ channel availability. Indeed, experimental evidence shows that there is a decrease in the maximum rate of depolarization in STZ-induced diabetic rats, which increases progressively with development of the disease (Pacher et al., 1999). The lack of any significant change in the peak overshoot of the diabetic action potential, when compared to the control one can be explained by a reduction in INa, in combination with a simultaneous reduction in It. Again, this finding is in accordance with experimental findings, where no significant differences were found in peak overshoot values during chronic diabetes (Casis et al., 2000).
From our quantitative analysis, we note that a small depolarization in Vrest (and the subsequent change in Rin) can be attributed primarily to a downregulation of the electrogenic pump current, INaK. Thus, the model is able to replicate the tendency toward depolarization in diabetic myocytes (Shimoni et al., 1994). Interestingly, Vrest is also reported to differ significantly in myocytes maintained under hyperglycemic conditions (Ren et al., 1997). Vrest was −77.0±1.0 mV under high glucose conditions, compared to −81.0±1.0 mV in normal conditions (Ren et al., 1997).
Reported effects of PKC can be integrated into this model
Several investigators have provided strong evidence that the subcellular changes in the diabetic heart may be partially due to alterations in the protein kinase C (PKC) activity, and/or PKC-mediated signal transduction mechanisms. In particular, the translocation of ɛPKC from cystolic to particulate fractions has been described in diabetic myocytes (Koya and King, 1998; Liu et al., 1999). The functional activation of ɛPKC has been observed in the in vivo, STZ-induced model of diabetes (Malhotra et al., 1997), as well as in myocytes maintained under hyperglycemic conditions (Malhotra et al., 2001). Accordingly, our simulations have incorporated the experimentally observed effects of ɛPKC on ICaL (Hu et al., 2000) and INaK (Buhagiar et al., 2001), because the alterations in these currents have not been measured in myocytes isolated from the short-term, in vivo, diabetic model. These changes were necessary in our overall explanation for the abnormal Ca2+ homeostasis and changes in Vrest observed in the diabetic myocyte experimentally (Shimoni et al., 1994).
The activation of ɛPKC in hyperglycemic conditions also increases the phosphorylation of troponin I (Malhotra et al., 2001), and cardiac specific over-expression of ɛPKC is known to increase the myofilament sensitivity to Ca2+ ions (Takeishi et al., 2000). Additionally, it has been shown that PKC activation slows inactivation of INa, which affects the APD90 value in rat ventricular myocytes (Ward and Giles, 1997). However it is unclear at the present time whether this mechanism contributes to an APD prolongation in diabetes. Accordingly, these and other reported effects of PKC isoform-specific activation have not been included in the present model formulations. However, they suggest that the contribution of additional ionic mechanisms/biophysical processes to the diabetic phenotype cannot be ruled out.
Limitations
These results and insights from rat ventricular myocytes under diabetic conditions should be extrapolated with caution when attempting to relate them to similar human studies, because the ventricular action potential and the underlying ionic currents are very different in humans and rats. A second limitation of the present study is that the SR Ca2+ dynamics have been adapted from a canine common pool model (Winslow et al., 1999). The Ca2+ dynamics in rat are now known to be different from their canine counterparts (Bers, 2001). Future modifications that incorporate and validate the model for the specific properties in rat, as well as formulations for a more sophisticated local control model of the Ca2+ dynamics will be essential to simulate [Ca2+]i homeostasis and mechanisms such as graded SR release (Greenstein and Winslow, 2001). A third limitation is that the present model does not account for the changes in the intracellular Na+ concentration ([Na+]i), which might occur during prolonged periods of pacing (the present simulation results are illustrated after a train of 20 pulses). Experimental studies have reported both an increase in [Na+]i (Warley, 1991), and a decrease in [Na+]i (Katoh et al., 1995) during diabetes; thus this important issue remains controversial. Our model also does not incorporate a formulation for the Na+-H+ exchanger, which is an important mediator of Na+ ion influx in rat ventricular myocytes (Despa et al., 2002), and is depressed during diabetes (Pierce et al., 1990). In summary, both experimental ambiguities and modeling limitations prevent the present study from accounting for the changes in [Na+]i during long-term pacing. Finally, we note that the changes in ICaL and SR activity in the diabetic model are based on observations in cultured myocytes and chronic diabetic conditions respectively, because corresponding data from the short-term, STZ-induced model of diabetes in rat are not available. Further experiments are therefore necessary to obtain quantitative data regarding the changes in the intracellular Ca2+ dynamics under well-defined type-I diabetic conditions. Thereafter, this aspect of the present modeling effort can and should be improved and updated.
SUMMARY
The results of this model development provide novel insights into the plausible ionic mechanisms that can account for the changes in the action potential profile and the abnormal excitation-contraction coupling in rat ventricular myocytes induced with type-I diabetes. APD prolongation is due to a reduction of the K+ currents It and Iss, along with slowed inactivation of ICaL. The abnormal Ca2+ homeostasis (smaller peak, reduced rate of decay) can be attributed to a decreased SR load, which results from a combination of a downregulation in ICaL and an impaired SR uptake. The small depolarization of the resting membrane potential (Vrest) is due to a decrease in the Na+-K+ pump current. The change in Vrest reduces the availability of the Na+ channels, causing a slower upstroke of the action potential (dV/dtmax). These interacting factors are summarized in Fig. 7, which in diagram form present the interdependent biophysical mechanisms for the observed electrophysiological changes, and in that way, highlight potential targets for reversing the diabetic cellular phenotype by means of gene therapy approaches (Trost et al., 2002). A future interesting extension of this study could involve exploring the action potential variations in the rat left ventricle during diabetes and predicting the subsequent changes in T-wave shape, and could be based on a recent modeling study (Gima and Rudy, 2002).
FIGURE 7.
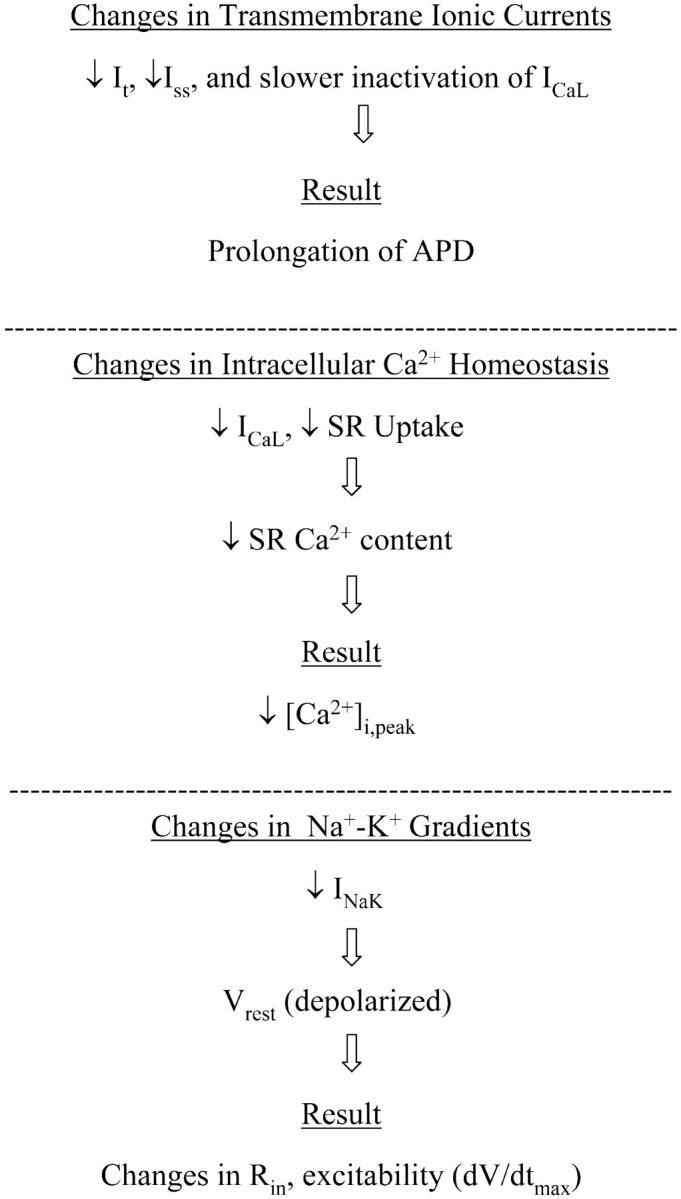
Diagram summarizing the electrophysiological alterations and their underlying causes as revealed by this mathematical model in the setting of short-term, type-I (insulin dependent), STZ-induced diabetes in rat ventricular myocytes.
Acknowledgments
The authors gratefully acknowledge useful discussions with Dr. Polly Hofmann (University of Tennessee, Memphis, TN, USA), and Chris Oehmen (Joint Graduate Program in Biomedical Engineering, the University of Memphis, and the University of Tennessee Health Science Center, Memphis, TN, USA).
The authors acknowledge the support provided by the Whitaker Foundation (to S.S. Demir), the Herff Foundation (to S.V. Pandit), Alberta Heritage Foundation for Medical Research, Canadian Institutes of Health Research, Heart and Stroke Foundation of Canada, and National Institutes of Health (to W.R. Giles).
References
- Ashamalla, S. M., D. Navarro, and C. A. Ward. 2001. Gradient of sodium current across the left ventricular wall of adult rat hearts. J. Physiol. 536:439–443. [DOI] [PMC free article] [PubMed] [Google Scholar]
- Bers, D. M. 2001. Excitation-Contraction Coupling and Cardiac Contractile Force. Kluwer Academic Publications.
- Bogoyevitch, M. A., P. J. Parker, and P. H. Sugden. 1993. Characterization of protein kinase C isotype expression in adult rat heart. Protein kinase C-ɛ is a major isotype present, and it is activated by phorbol esters, epinephrine, and endothelin. Circ. Res. 72:757–767. [DOI] [PubMed] [Google Scholar]
- Bouchard, R. A., R. B. Clark, and W. R. Giles. 1995. Effects of action potential duration on excitation-contraction coupling in rat ventricular myocytes. Action potential voltage-clamp measurements. Circ. Res. 76:790–801. [DOI] [PubMed] [Google Scholar]
- Buhagiar, K. A., P. S. Hansen, N. L. Bewick, and H. H. Rasmussen. 2001. Protein kinase C ɛ contributes to regulation of the sarcolemmal Na+-K+ pump. Am. J. Physiol. Cell Physiol. 281:C1059–C1063. [DOI] [PubMed] [Google Scholar]
- Casis, O., M. Iriarte, M. Gallego, and J. A. Sanchez-Chapula. 1998. Differences in regional distribution of K+ current densities in rat ventricle. Life Sci. 63:391–400. [DOI] [PubMed] [Google Scholar]
- Casis, O., M. Gallego, M. Iriarte, and J. A. Sanchez-Chapula. 2000. Effects of diabetic cardiomyopathy on regional electrophysiologic characteristics of rat ventricle. Diabetologia. 43:101–109. [DOI] [PubMed] [Google Scholar]
- Chattou, S., J. Diacono, and D. Feuvray. 1999. Decrease in sodium-calcium exchange and calcium currents in diabetic rat ventricular myocytes. Acta Physiol. Scand. 166:137–144. [DOI] [PubMed] [Google Scholar]
- Clark, R. B., R. A. Bouchard, and W. R. Giles. 1996. Action potential duration modulates calcium influx, Na+-Ca2+ exchange, and intracellular calcium release in rat ventricular myocytes. Ann. N. Y. Acad. Sci. 779:417–428. [DOI] [PubMed] [Google Scholar]
- Courtemanche, M., R. J. Ramirez, and S. Nattel. 1999. Ionic targets for drug therapy and atrial fibrillation-induced electrical remodeling: insights from a mathematical model. Cardiovasc. Res. 42:477–489. [DOI] [PubMed] [Google Scholar]
- Davidoff, A. J., and J. Ren. 1997. Low insulin and high glucose induce abnormal relaxation in cultured adult rat ventricular myocytes. Am. J. Physiol. 272:H159–H167. [DOI] [PubMed] [Google Scholar]
- Demir, S. S., J. W. Clark, C. R. Murphey, and W. R. Giles. 1994. A mathematical model of a rabbit sinoatrial node cell. Am. J. Physiol. 266:C832–C852. [DOI] [PubMed] [Google Scholar]
- Demir, S. S., R. J. Butera, A. A. DeFranceschi, J. W. Clark, and J. H. Byrne. 1997. Phase sensitivity and entrainment in a modeled bursting neuron. Biophys. J. 72:579–594. [DOI] [PMC free article] [PubMed] [Google Scholar]
- Demir, S. S., J. W. Clark, and W. R. Giles. 1999. Parasympathetic modulation of sinoatrial node pacemaker activity in rabbit heart: a unifying model. Am. J. Physiol. 276:H2221–H2244. [DOI] [PubMed] [Google Scholar]
- Despa, S., M. A. Islam, S. M. Pogwizd, and D. M. Bers. 2002. Intracellular [Na+]i and Na+ pump rate in rat and rabbit ventricular myocytes. J. Physiol. 539:133–143. [DOI] [PMC free article] [PubMed] [Google Scholar]
- Dillmann, W. H. 1989. Diabetes and thyroid-hormone-induced changes in cardiac function and their molecular basis. Annu. Rev. Med. 40:373–394. [DOI] [PubMed] [Google Scholar]
- Dutta, K., and A. J. Davidoff. 2000. Na+/Ca2+ exchange is intact in high [glucose]-induced cardiomyopathy. Biophys. J. 78:373a (Abstr.)10620301 [Google Scholar]
- Ewing, D. J., O. Boland, J. M. Neilson, C. G. Cho, and B. F. Clarke. 1991. Autonomic neuropathy, QT interval lengthening, and unexpected deaths in male diabetic patients. Diabetologia. 34:182–185. [DOI] [PubMed] [Google Scholar]
- Fiset, C., R. B. Clark, Y. Shimoni, and W. R. Giles. 1997. Shal-type channels contribute to the Ca2+-independent transient outward K+ current in rat ventricle. J. Physiol. 500:51–64. [DOI] [PMC free article] [PubMed] [Google Scholar]
- Gima, K., and Y. Rudy. 2002. Ionic current basis of electrocardiographic waveforms: a model study. Circ. Res. 90:889–896. [DOI] [PMC free article] [PubMed] [Google Scholar]
- Greenstein, J. L., and R. L. Winslow. 2001. Integration of a stochastic model of local calcium control with a simulation of the cardiac ventricular action potential. Biophys. J. 80:593a (Abstract.). [Google Scholar]
- Hu, K., D. Mochly-Rosen, and M. Boutjdir. 2000. Evidence for functional role of ɛPKC isozyme in the regulation of cardiac Ca2+ channels. Am. J. Physiol. Heart Circ. Physiol. 279:H2658–H2664. [DOI] [PubMed] [Google Scholar]
- Jourdon, P., and D. Feuvray. 1993. Calcium and potassium currents in ventricular myocytes isolated from diabetic rats. J. Physiol. 470:411–429. [DOI] [PMC free article] [PubMed] [Google Scholar]
- Kaprielian, R., A. D. Wickenden, Z. Kassiri, T. G. Parker, P. P. Liu, and P. H. Backx. 1999. Relationship between K+ channel down-regulation and [Ca2+]i in rat ventricular myocytes following myocardial infarction. J. Physiol. 517:229–245. [DOI] [PMC free article] [PubMed] [Google Scholar]
- Kato, K., D. C. Chapman, H. Rupp, A. Lukas, and N. S. Dhalla. 1999. Alterations of heart function and Na+-K+-ATPase activity by etomoxir in diabetic rats. J. Appl. Physiol. 86:812–818. [DOI] [PubMed] [Google Scholar]
- Katoh, H., N. Noda, H. Hayashi, H. Satoh, H. Terada, R. Ohno, and N. Yamazaki. 1995. Intracellular sodium concentration in diabetic rat ventricular myocytes. Jpn. Heart J. 36:647–656. [DOI] [PubMed] [Google Scholar]
- Koya, D., and G. L. King. 1998. Protein kinase C activation and the development of diabetic complications. Diabetes. 47:859–866 (Review.). [DOI] [PubMed] [Google Scholar]
- Liu, X., J. Wang, N. Takeda, L. Binaglia, V. Panagia, and N. S. Dhalla. 1999. Changes in cardiac protein kinase C activities and isozymes in streptozotocin-induced diabetes. Am. J. Physiol. 277:E798–E804. [DOI] [PubMed] [Google Scholar]
- MacDonell, K. L., D. L. Severson, and W. R. Giles. 1998. Depression of excitability by sphingosine 1-phosphate in rat ventricular myocytes. Am. J. Physiol. 275:H2291–H2299. [DOI] [PubMed] [Google Scholar]
- Mahgoub, M. A., and A. S. Abd-Elfattah. 1998. Diabetes mellitus and cardiac function. Mol. Cell. Biochem. 180:59–64. [PubMed] [Google Scholar]
- Malhotra, A., D. Reich, A. Nakouzi, V. Sanghi, D. L. Geenen, and P. M. Buttrick. 1997. Experimental diabetes is associated with functional activation of protein kinase C epsilon and phosphorylation of troponin I in the heart, which are prevented by angiotensin II receptor blockade. Circ. Res. 81:1027–1033. [DOI] [PubMed] [Google Scholar]
- Malhotra, A., B. P. Kang, S. Cheung, D. Opawumi, and L. G. Meggs. 2001. Angiotensin II promotes glucose-induced activation of cardiac protein kinase C isozymes and phosphorylation of troponin I. Diabetes. 50:1918–1926. [DOI] [PubMed] [Google Scholar]
- Nerbonne, J. M. 2001. Molecular analysis of voltage-gated K+ channel diversity and functioning in the mammalian heart. In Handbook of Physiology: The Cardiovascular System. E. Page, H. A. Fozzard, and R. J. Solaro, editors. Oxford University Press, Oxford 568–594.
- Netticadan, T., R. M. Temsah, A. Kent, V. Elimban, and N. S. Dhalla. 2001. Depressed levels of Ca2+-cycling proteins may underlie sarcoplasmic reticulum dysfunction in the diabetic heart. Diabetes. 50:2133–2138. [DOI] [PubMed] [Google Scholar]
- Nishiyama, A., D. N. Ishii, P. H. Backx, B. E. Pulford, B. R. Birks, and M. M. Tamkun. 2001. Altered K+ channel gene expression in diabetic rat ventricle: isoform switching between Kv4.2 and Kv1.4. Am. J. Physiol. Heart Circ. Physiol. 281:H1800–H1807. [DOI] [PubMed] [Google Scholar]
- Noble, D. 2002. Modeling the heart–from genes to cells to the whole organ. Science. 295:1678–1682. [DOI] [PubMed] [Google Scholar]
- Oudit, G. Y., Z. Kassiri, R. Sah, R. J. Ramirez, C. Zobel, and P. H. Backx. 2001. The molecular physiology of the cardiac transient outward potassium current Ito in normal and diseased myocardium. J. Mol. Cell. Cardiol. 33:851–872. [DOI] [PubMed] [Google Scholar]
- Pacher, P., Z. Ungvari, P. P. Nanasi, and V. Kecskemeti. 1999. Electrophysiological changes in rat ventricular and atrial myocardium at different stages of experimental diabetes. Acta Physiol. Scand. 166:7–13. [DOI] [PubMed] [Google Scholar]
- Pandit, S. V., R. B. Clark, W. R. Giles, and S. S. Demir. 2001. A mathematical model of action potential heterogeneity in adult rat left ventricular myocytes. Biophys. J. 81:3029–3051. [DOI] [PMC free article] [PubMed] [Google Scholar]
- Pierce, G. N., B. Ramjiawan, N. S. Dhalla, and R. Ferrari. 1990. Na+-H+ exchange in cardiac sarcolemmal vesicles isolated from diabetic rats. Am. J. Physiol. 258:H255–H261. [DOI] [PubMed] [Google Scholar]
- Qin, D., B. Huang, L. Deng, H. El-Adawi, K. Ganguly, J. R. Sowers, and N. El-Sherif. 2001. Downregulation of K+ channel genes expression in type I diabetic cardiomyopathy. Biochem. Biophys. Res. Commun. 283:549–553. [DOI] [PubMed] [Google Scholar]
- Ren, J., and A. J. Davidoff. 1997. Diabetes rapidly induces contractile dysfunctions in isolated ventricular myocytes. Am. J. Physiol. 272:H148–H158. [DOI] [PubMed] [Google Scholar]
- Ren, J., G. A. Gintant, R. E. Miller, and A. J. Davidoff. 1997. High extracellular glucose impairs cardiac E-C coupling in a glycosylation-dependent manner. Am. J. Physiol. 273:H2876–H2883. [DOI] [PubMed] [Google Scholar]
- Robillon, J. F., J. L. Sadoul, S. Benmerabet, L. Joly-Lemoine, A. Fredenrich, and B. Canivet. 1999. Assessment of cardiac arrhythmic risk in diabetic patients using QT dispersion abnormalities. Diabetes Metab. 25:419–423. [PubMed] [Google Scholar]
- Rudy, Y. 2000. From genome to physiome: integrative models of cardiac excitation. Ann. Biomed. Eng. 28:945–950. [DOI] [PubMed] [Google Scholar]
- Rybin, V. O., and S. F. Steinberg. 1994. Protein kinase C isoform expression and regulation in the developing rat heart. Circ. Res. 74:299–309. [DOI] [PubMed] [Google Scholar]
- Sah, R., R. J. Ramirez, R. Kaprielian, and P. H. Backx. 2001. Alterations in action potential profile enhance excitation-contraction coupling in rat cardiac myocytes. J. Physiol. 533:201–214. [DOI] [PMC free article] [PubMed] [Google Scholar]
- Schultz, J. H., T. Volk, and E. Ehmke. 2001. Heterogeneity of Kv2.1 mRNA expression and delayed rectifier current in single isolated myocytes from rat left ventricle. Circ. Res. 88:483–490. [DOI] [PubMed] [Google Scholar]
- Shimoni, Y., L. Firek, D. Severson, and W. R. Giles. 1994. Short-term diabetes alters K+ currents in rat ventricular myocytes. Circ. Res. 74:620–628. [DOI] [PubMed] [Google Scholar]
- Shimoni, Y., D. Severson, and W. R. Giles. 1995. Thyroid status and diabetes modulate regional differences in potassium currents in rat ventricle. J. Physiol. 488:673–688. [DOI] [PMC free article] [PubMed] [Google Scholar]
- Shimoni, Y., P. E. Light, and R. J. French. 1998. Altered ATP sensitivity of ATP-dependent K+ channels in diabetic rat hearts. Am. J. Physiol. 275:E568–E576. [DOI] [PubMed] [Google Scholar]
- Shimoni, Y. 1999. Protein kinase C regulation of K+ currents in rat ventricular myocytes and its modification by hormonal status. J. Physiol. 520:439–449. [DOI] [PMC free article] [PubMed] [Google Scholar]
- Standl, E., and O. Schnell. 2000. A new look at the heart in diabetes mellitus: from ailing to failing. Diabetologia. 43:1455–1469. [DOI] [PubMed] [Google Scholar]
- Takeishi, Y., P. Ping, R. Bolli, D. L. Kirkpatrick, B. D. Hoit, and R. A. Walsh. 2000. Transgenic overexpression of constitutively active protein kinase C ɛ causes concentric cardiac hypertrophy. Circ. Res. 86:1218–1223. [DOI] [PubMed] [Google Scholar]
- Trafford, A. W., M. E. Diaz, and D. A. Eisner. 2001. Coordinated control of cell Ca2+ loading and triggered release from the sarcoplasmic reticulum underlies the rapid inotropic response to increased L-type Ca2+ current. Circ. Res. 88:195–201. [DOI] [PubMed] [Google Scholar]
- Trost, S. U., D. D. Belke, W. F. Bluhm, M. Meyer, E. Swanson, and W. H. Dillmann. 2002. Overexpression of the sarcoplasmic reticulum Ca2+-ATPase improves myocardial contractility in diabetic cardiomyopathy. Diabetes. 51:1166–1171. [DOI] [PubMed] [Google Scholar]
- Wang, D. W., T. Kiyosue, S. Shigematsu, and M. Arita. 1995. Abnormalities of K+ and Ca2+ currents in ventricular myocytes from rats with chronic diabetes. Am. J. Physiol. 269:H1288–H1296. [DOI] [PubMed] [Google Scholar]
- Ward, C. A., and W. R. Giles. 1997. Ionic mechanism of the effects of hydrogen peroxide in rat ventricular myocytes. J. Physiol. 500:631–642. [DOI] [PMC free article] [PubMed] [Google Scholar]
- Ward, C. A., Z. Ma, S. S. Lee, and W. R. Giles. 1997. Potassium currents in atrial and ventricular myocytes from a rat model of cirrhosis. Am. J. Physiol. 273:G537–G544. [DOI] [PubMed] [Google Scholar]
- Warley, A. 1991. Changes in sodium concentration in cardiac myocytes from diabetic rats. Scanning Microsc. 5:239–244. [PubMed] [Google Scholar]
- Watanabe, T., L. M. Delbridge, J. O. Bustamante, and T. F. McDonald. 1983. Heterogeneity of the action potential in isolated rat ventricular myocytes and tissue. Circ. Res. 52:280–290. [DOI] [PubMed] [Google Scholar]
- Winslow, R. L., J. Rice, S. Jafri, E. Marban, and B. O'Rourke. 1999. Mechanisms of altered excitation-contraction coupling in canine tachycardia-induced heart failure, II: model studies. Circ. Res. 84:571–586. [DOI] [PubMed] [Google Scholar]
- Winslow, R. L., D. F. Scollan, A. Holmes, C. K. Yung, J. Zhang, and M. S. Jafri. 2000. Electrophysiological modeling of cardiac ventricular function: from cell to organ. Annu. Rev. Biomed. Eng. 2:119–155. [DOI] [PMC free article] [PubMed] [Google Scholar]
- Zhong, Y., S. Ahmed, I. L. Grupp, and M. A. Matlib. 2001. Altered SR protein expression associated with contractile dysfunction in diabetic rat hearts. Am. J. Physiol. Heart Circ. Physiol. 281:H1137–H1147. [DOI] [PubMed] [Google Scholar]