

Abstract
The myosin motor protein generates force in muscle by hydrolyzing Adenosine 5′-triphosphate (ATP) while interacting transiently with actin. Structural evidence suggests the myosin globular head (subfragment 1 or S1) is articulated with semi-rigid catalytic and lever-arm domains joined by a flexible converter domain. According to the prevailing hypothesis for energy transduction, ATP binding and hydrolysis in the catalytic domain drives the relative movement of the lever arm. Actin binding and reversal of the lever-arm movement (power stroke) applies force to actin. These domains interface at the reactive lysine, Lys84, where trinitrophenylation (TNP-Lys84-S1) was observed in this work to block actin activation of myosin ATPase and in vitro sliding of actin over myosin. TNP-Lys84-S1's properties and interactions with actin were examined to determine how trinitrophenylation causes these effects. Weak and strong actin binding, the rate of mantADP release from actomyosin, and actomyosin dissociation by ATP were equivalent in TNP-Lys84-S1 and native S1. Molecular dynamics calculations indicate that lever-arm movement inhibition during ATP hydrolysis and the power stroke is caused by steric clashes between TNP and the converter or lever-arm domains. Together these findings suggest that TNP uncouples actin activation of myosin ATPase and the power stroke from other steps in the contraction cycle by inhibiting the converter and lever-arm domain movements.
INTRODUCTION
Contraction of skeletal muscle is based on the interaction of the myosin head (S1) with actin, and is powered by the coupled hydrolysis of Adenosine 5′-triphosphate (ATP). According to the recent consensus, force generation and the dynamic movements of S1 are best described by the rotating cross-bridge model. This model is based on the results of crystallography, electron microscopy, and solution studies on actin and on the various transient forms of S1 existing during the ATP hydrolysis. The cross-bridge cycle is described by the following simplified scheme (Bagshaw and Trentham, 1974).
M and A are myosin and actin, respectively, and M, M* · ATP, M** · ADP · Pi, and M∧ · ADP, with and without actin, represent conformational states of the actin-myosin-nucleotide complexes with distinct structures. Crystal structures of S1 revealed that there are three main functional domains in the myosin head: the catalytic, the converter, and the lever arm (Fisher et al., 1995; Dominguez et al., 1998; Houdusse et al., 1999). The catalytic domain is responsible for the binding and hydrolysis of ATP and for the binding of actin, the converter domain (for the energy transduction), and the lever arm (for the transport of the load). The catalytic domain is attached to actin in a fixed position during the power stroke of the cross-bridge cycle, whereas the conformation of the converter region changes significantly causing the swinging of the rigid lever arm (Geeves and Holmes, 1999). The actin-myosin-nucleotide transients in Scheme 1 are less well-characterized because their structure is surmised by fitting S1 onto an F-actin model. It is unclear, for example, how the conformation of S1 is affected by its binding to actin, whether the power stroke is directly coupled to the release of phosphate from A·M**·ADP·Pi, to the isomerization of A·M**·ADP·Pi, to the dissociation of Adenosine 5′-diphosphate (ADP) from A·M∧·ADP, or all of the above (Geeves and Holmes, 1999). These questions may be addressed by studying the effect on the power stroke of mutated or chemically modified strategically located residues in S1.
SCHEME 1.

A residue that is appropriate for that task is the reactive lysine, Lys84, in the chicken skeletal myosin structure. Lys84 is located at the N-terminal segment of the myosin head (Mornet et al., 1980; Hozumi and Muhlrad, 1981), on an interface of the catalytic and lever-arm domains (Fig. 1), not too close to the active site (Fisher et al., 1995). The rate of its trinitrophenylation with trinitrobenzene sulfonate (TNBS), resulting in the formation of TNP-Lys84-S1, is three orders of magnitudes faster than that of other lysines on S1 (Muhlrad and Takashi, 1981). This reaction is strongly inhibited by nucleotides (Tonomura et al., 1963). Trinitrophenylation of Lys84 causes an increase in Mg2+- and a decrease in K+-EDTA-ATPase activity of S1 (Kitagawa et al., 1961; Fabian and Muhlrad, 1968) and renders the M* · ATP state the predominant intermediate of the ATPase cycle (Muhlrad, 1983). Nucleotide dependent trinitrophenyl (TNP) circular dichroism (CD) and absorption spectra coupled with model calculations indicated the nucleotide induced conformational changes taking place in skeletal S1 (Ajtai et al., 1999). These data suggested that the bulky TNP group interferes with the normal trajectory of the lever arm during the M* · ATP → M** · ADP · Pi transition, causing both the acceleration of Mg2+-ATPase and the inhibition of K+-EDTA-ATPase of myosin. Much less is known about the effect of Lys84 trinitrophenylation on the myosin-actin interaction. It was reported that the actin activation of TNP-Lys84-myosin is inhibited (Fabian and Muhlrad, 1968), and it was surmised from CD and model calculations that the TNP group attached to Lys84 clashes with the lever arm during the A · M** · ADP · Pi → A · M∧ · ADP+Pi transition. The latter was predicted to inhibit the power stroke (Burghardt et al., 2001a).
FIGURE 1.

The skeletal myosin backbone crystal structure. Atoms corresponding to the DCD undergoing deformation during the simulation of myosin dynamics in contraction are shown in black. The Trp510 side chain is in the DCD. Other important side chains, Arg723 and Lys84 modified by TNP, are shown in red.
In this work we show that actin does not activate the TNP-Lys84-S1 ATPase activity and TNP-Lys84-HMM does not power the sliding of actin filaments over myosin. To understand the basis for the loss of these activities we studied the effect of trinitrophenylation on the kinetics and dynamical structure of the Scheme 1 transients. We find that trinitrophenylation of Lys84 inhibits the power stroke probably by the collision of the bulky TNP group with the lever arm during the A · M** · ADP · Pi → A · M+ADP+Pi transition. However, power stroke inhibition does not affect the other aspects of the Scheme 1 cycle suggesting that trinitrophenylation uncouples actin activation of Pi release and the power stroke from other steps in the cross-bridge cycle.
MATERIALS AND METHODS
Myosin sequence numbering is from chicken pectoralis muscle (Maita et al., 1991).
Chemicals
2,4,6-Trinitrobenzene sulfonate (TNBS), ATP, ADP, chymotrypsin, DTT, HEPES, phenylmethane sulfonyl fluoride (PMSF), Tris-HCl were purchased from Sigma (St. Louis, MO). Mant-ADP and rhodamine-phalloidin were purchased from Molecular Probes (Eugene, OR). All other chemicals were of reagent grade.
Proteins
Myosin and actin were prepared from rabbit back and leg muscles by the methods of Tonomura et al. (1966) and Spudich and Watt (1971), respectively. S1 and heavy meromyosin (HMM) were obtained by digestion of myosin filaments with chymotrypsin following the procedures of Weeds and Taylor (1975) and Margossian and Lowey (1982), respectively. Protein concentrations were estimated from their absorption by using an A1% at 280 nm of 7.5 cm−1 and 6.5 cm−1 for S1 and HMM, respectively, and an A1% at 290 nm of 6.3 cm−1 for actin. Whenever appropriate, light scattering corrections were applied. Molecular masses were assumed to be 115, 350, and 42.3 kDa for S1, HMM, and actin monomers, respectively.
Chemical modifications
S1 was trinitrophenylated as described earlier (Ajtai et al., 1999) by addition of two- to fourfold molar excess TNBS to 60–80 μM S1 in 30 mM NaCl and 50 mM TrisHCl buffer, pH 8.0. After incubation at 25°C for 10 min, the reaction was terminated by addition of 2 mM DTT. The excess TNBS was removed by dialysis against 100 vol of 25 mM MOPS buffer, pH 7.0 at 4°C, overnight. The number of TNP groups introduced was determined from absorbance (ɛ345 nm = 14,500 M−1cm−1) according to Okuyama and Satake (1960). Generally 1–1.3 mol TNP/mol S1 was introduced into the protein by this procedure. Of the bound TNP groups, ∼75% is attached to Lys84, where the use of TrisHCl buffer pH 8 significantly improved selectivity for Lys84 over other amino groups in S1 and HMM (Muhlrad and Takashi, 1981). For protein concentration calculation in TNP-Lys84-S1 the absorbance at 280 nm was corrected using: Corrected A280 nm = A280 nm − 0.362(A345 nm).
HMM was trinitrophenylated by the following method. HMM (1.5–2.0 μM) prepared for the in vitro motility assay (Miller et al., 1996) was dialyzed against 0.5 M KCl, 2 mM MgCl2, 1 mM K2EGTA, and 25 mM TrisHCl, pH 8.0 at 4°C overnight. After the dialysis the HMM was incubated with 8- to 10-fold molar excess of TNBS at 22°C for 10 min. The reaction was terminated by 2 mM DTT and excess reagents removed by dialysis overnight against 20 vol of 0.1 mM K2EGTA and 5 mM HEPES, pH 7.0 at 4°C. TNP-HMM contained 1–1.3 mol TNP/mol myosin head. Control HMM used for the in vitro motility assay was prepared in the same way, but without addition of TNBS.
Kinetics of S1 modification
The time course of trinitrophenylation of Lys84 at 25°C was followed spectrophotometrically, essentially as described earlier (Ajtai et al., 1999). TNBS (final concentration 100 μM) was added to 10 μM S1 in the presence or absence of 0.2 mM ADP and/or 20 μM F-actin in 1 mM MgCl2, 10 mM KCl, and 30 mM TrisHCl, pH 8.0. The number of TNP groups introduced was calculated from the recorded absorbance change at 345 nm. In the fast component, rapid trinitrophenylation of Lys84 and slow trinitrophenylation of other S1 lysines takes place, whereas in the slow component only trinitrophenylation of the other S1 lysines occurs (Muhlrad and Takashi, 1981). Under the conditions of our measurements, trinitrophenylation of Lys84 is essentially finished during the first 10–15 min of the reaction. Initial velocity of the modification of the slowly reacting lysines, v2, was calculated from the reaction rate at 20 min after addition of TNBS by accounting for changes in TNBS and unmodified lysine concentrations during the first 20 min of the reaction. Initial velocity of trinitrophenylation of Lys84 (v1) was obtained by subtracting v2 from the initial velocity of the overall process (v). Because the modification of Lys84 is a pseudo first-order reaction under conditions of our experiment (10-fold molar excess of TNBS over S1), first-order rate constants could be calculated from v1.
Actin-activated ATPase activity of S1
Actin-activated S1 ATPase activity (micromoles of phosphate per micromole of S1 per second) was calculated from inorganic phosphate produced as a function of time assayed by the Malachite green method (Kodama et al., 1986). Reaction times (at 25°C) were chosen so that no more than 15% of the ATP was hydrolyzed. The assay contained 0.2 μM S1 and 2.5–80 μM F-actin in 2 mM MgCl2, 25 mM HEPES buffer, pH 7.0 and 2 mM ATP. The ATPase data were fitted to the Michaelis-Menten equation to obtain KM and Vmax.
Cosedimentation assays
Assays of the weak binding of 0.8 μM S1 to 5–30 μM F-actin were carried out at 20°C in 2 mM MgCl2, 4 mM ATP, and 25 mM HEPES buffer, pH 7.0. After incubating the proteins for 10 min, ATP was added immediately before the centrifugation. The samples were centrifuged at 20°C in the TL 100.2 rotor of a small Beckman preparative ultracentrifuge at 22,5000 g for 20 min. Strong binding of 0.8 μM S1 to 1–5 μM F-actin (with equimolar concentration of phalloidin added to stabilize the actin filaments) was performed in 2 mM MgCl2, 2 mM ADP, 25 mM HEPES buffer, at pH 7.0, and 100 mM NaCl to reduce the strong binding of S1 to F-actin. Under these conditions S1 remained in the supernatant in the absence of actin. Supernatants of each sample were analyzed by SDS-PAGE. The Coomassie Blue stained gel bands were quantified by a Bio Imaging System densitometer to determine the percent of S1 bound to actin. The binding values were fitted to binding curves to yield the dissociation constants.
Circular dichroism
CD spectra were recorded between 300 and 500 nm in a JASCO J720 spectropolarimeter following the procedure described previously (Burghardt et al., 2001b). The measurements were carried out in a 20-mm thermostated cell at 20°C. TNP-Lys84-S1 (4 μM) and G-actin (8 μM) were mixed in a buffer of 0.2 mM DTT, 0.1 mM PMSF, and 5 mM HEPES, pH 8.0. The samples were preincubated for 5 min at 20°C before the measurement to complete the actin polymerization. The effect of ADP was tested after the addition of 0.5 mM MgCl2 and 0.5 mM ADP. The spectrum of unlabeled actoS1 was also recorded in this buffer. The CD data for each wavelength were expressed as molar ellipticity, [Θ(λ)], where,
 |
(1) |
θ(λ) the ellipticity in millidegrees, l the optical path length in cm, and C the molar concentration of TNP.
Fluorescence measurements
The binding of mantADP to S1 and TNP-Lys84-S1 was assayed by titration of S1 with mantADP in a Spex Fluorolog spectrofluorometer (Spex Industries, Edison, NJ) at 22°C. The maximum of the fluorescence excitation spectrum of unbound mantADP is at 362 nm. Because the excitation at 290 nm of free mantADP is near zero we used this wavelength for excitation to get maximal difference between the fluorescence of S1-bound and free nucleotide. Emission wavelength was set at 440 nm. The fluorescence of free mantADP, which was present in the solution, was subtracted from the titration data.
Stopped flow measurements
Measurements at 25°C were carried out with an Applied Photophysics SX.18MV (Leatherhead, UK) stopped flow. For the fluorescence measurements in the presence of mantADP, excitation and emission wavelength were set at 290 and 440 nm, respectively. For light scattering measurements both monochromators were set at 380 nm. All measurements were carried out in 25 mM KCl, 2 mM MgCl2, and 25 mM MOPS buffer at pH 7.4. Data were fitted with a nonlinear least-square procedure to either a single or double exponential expression, from which the rate constants were calculated.
In vitro actin motility assay
The assay was performed at 25°C as described previously (Miller et al., 1996). HMM and TNP-Lys84-HMM were adsorbed to the nitrocellulose-coated cover slips. ATP-desensitized HMM and TNP-Lys84-HMM were removed from the stock solution by pelleting HMM and TNP-Lys84-HMM in the presence of actin and ATP. Assay solution was composed of 25 mM MOPS, pH 7.4, 25 mM KCl, 2.0 mM MgCl2, 2 mM EGTA, 1.0 mM ATP, and the glucose-oxidase-catalase system (to slow photobleaching of rhodamine fluorescence). Methylcellulose (0.4%) was present in all solutions. Actin filaments were labeled by rhodamine phalloidin as described by Miller et al. (1996). Sliding speeds of actin filaments were determined using the Expertvision System (Motion Analysis, Santa Rosa, CA).
Molecular modeling of energy transduction
A new methodology described in the Appendix introduces molecular dynamics to the study of myosin conformation during the contraction cycle. The new procedures model dynamical processes on the ∼100 ms time scale, as appropriate for myosin enzyme kinetics, far surpassing the 10–100 ns time scale limiting conventional molecular dynamics procedures.
RESULTS
Effect of actin on the kinetics of trinitrophenylation of Lys84
S1 alone and in the presence of actin and ADP was trinitrophenylated with TNBS. Actin alone was also trinitrophenylated as a control. The reaction was followed by monitoring the increase in absorbance at 345 nm as a function of reaction time (Fig. 2) and the rate constants for Lys84 labeling were calculated from the optical density traces (Table 1) as detailed in Materials and Methods. The rapid reaction phase absent in the trinitrophenylation of actin reveals that it does not have a fast reacting lysyl residue under the experimental conditions. By comparing the optical density trace obtained for actoS1 with that from the sum of actin and S1 traces (Actin + S1 in Fig. 2) it is clear that both phases of the reaction are inhibited in the actoS1 complex. The inhibition of the rapid phase (Table 1) is caused mainly by the reduced rate of Lys84 modification. The inhibition of the slower phase may be due to the reduced accessibility of lysines on both S1 and actin caused by a mutual steric hindrance. The actin inhibition of Lys84 modification was probably not caused by steric hindrance because this residue is located at the catalytic/lever-arm domain interface, far from the actin-binding site (Fig. 1).
FIGURE 2.

Effect of F-actin on the trinitrophenylation of S1. Actin + S1 is the sum of S1 and actin plots; ActoS1 is the plot of the mixture of the two proteins. Conditions for trinitrophenylation and calculations are given in Materials and Methods.
TABLE 1.
Pseudo first-order rate constants fortrinitrophenylation of Lys84 in the presence and absence of F-actin and ADP
| Addition to S1 | Rate constant ± SE × 103 (s−1)* | Inhibition (%) |
|---|---|---|
| None | 6.03 ± 0.101 | 0 |
| F-actin (20 μM) | 4.30 ± 0.095 | 28.7 |
| ADP (1 mM) | 2.91 ± 0.211 | 51.7 |
| F-actin (20 μM) + ADP (1 mM) | 2.37 ± 0.058 | 60.7 |
Mean ± SE of five independent experiments.
Experimental conditions and calculations are given in Materials and Methods.
The effect of actin and ADP on the trinitrophenylation on Lys84 can be evaluated from the rate constants in Table 1. Both actin and, to a greater extent, ADP (Ajtai et al., 1999; Muhlrad and Fabian, 1970) inhibited the rate of the reaction. ADP inhibited also the modification of Lys84 in the presence of actin. The effect of actin on the rate of trinitrophenylation of Lys84 indicates that the conformation of this site changes upon formation of the strongly bound actoS1 complexes in the presence and absence of ADP.
Effect of F-actin on the CD spectrum of TNP-Lys84-S1
Fig. 3 shows the CD spectra of TNP-Lys84-S1 in the presence and absence of F-actin and ADP in the range of 300–500 nm. As a control, the trace for the unmodified S1 with F-actin is also presented. F-actin binding to TNP-Lys84-S1 produced a small effect on TNP ellipticity that could be due to a small fraction of actin free TNP-Lys84-S1. F-actin binding to the TNP-Lys84-S1 · ADP complex induced only a slight change in the TNP signal, whereas ADP binding to TNP-Lys84-S1 in the absence of actin produces a large change in the TNP CD. Both results indicate that F-actin is unable to alter the conformation of the Lys84 site in TNP-Lys84-S1. In contrast, F-actin and ADP both strongly inhibit modification of Lys84 in native S1. These results show that TNP modification of Lys84 impedes the effect of F-actin on S1 structure.
FIGURE 3.

Effect of F-actin and MgADP on the CD spectrum of TNPLys84-S1: CD spectra were recorded at 20°C in a 2-cm cell. The spectral data are presented as molar ellipticity (deg × cm2 × decimol−1). For conditions see Materials and Methods. Symbols: actoS1 (—); TNP-Lys84-S1 (▴); TNP-Lys84-S1 + ADP (○); actoTNP-Lys84-S1 (▵); actoTNP-Lys84-S1 + ADP (□).
Actin activation of the MgATPase of TNP-Lys84-S1
Actin-activated myosin MgATPase activities were fitted to the Michaelis-Menten equation to obtain Vmax (Table 2). Actin essentially did not activate the ATPase activity of TNP-Lys84-S1; the twofold increase in Vmax (to 0.52 s−1) was probably due to a small fraction of unmodified S1. Thus, the KM value for this ATPase reaction is not considered meaningful and is not reported. The MgATPase activity of TNP-Lys84-HMM was also not activated by actin. The basic MgATPase activity of TNP-Lys84-S1, 0.275 s−1, was much higher than that of unmodified S1, 0.05 s−1 (Table 2), in accordance with the earlier findings (Muhlrad and Takashi, 1981; Ajtai et al., 1999).
TABLE 2.
Parameters of S1 and TNP-Lys84-S1 interactions with F-actin and nucleotides
| S1* | TNP-Lys84-S1* | |
|---|---|---|
| Vmax (s−1) of actin activated MgATPase | 21.15 ± 0.62 | 0.52 ± 0.04 |
| Basic MgATPase (s−1) | 0.05 ± 0.008 | 0.275 ± 0.022 |
| Sliding speed (μm/s) | 5.15 ± 0.69 | 0.15 ± 0.12 |
| Rate of mantADP dissociation from actoS1 (s−1) | 447 ± 5.3 | 499 ± 7.0 |
| Rate of mantADP dissociation from S1 (s−1) | 0.98 ± 0.173 (fast) | 1.01 ± 0.124 (fast) |
| 0.13 ± 0.027 (slow) | 0.22 ± 0.005 (slow) | |
| Rate of dissociation of actoS1 by ATP (106 × M−1 s−1) | 2.39 ± 0.034 | 1.85 ± 0.029 |
| ADP binding to actoS1, Kd (μM) | 351 ± 24.9 | 391 ± 24.4 |
| ADP binding to S1, Kd (μM) | 1.60 ± 0.33 | 1.51 ± 0.23 |
| Strong S1 binding to F-actin, Kd (μM) | 1.16 ± 0.17 | 0.52 ± 0.09 |
| Weak S1 binding to F-actin, Kd (μM) | 20.2 ± 2.5 | 32.4 ± 5.7 |
Mean ± SD of three to six independent measurements.
Experimental conditions and calculations are given in the text and Materials and Methods.
Effect of modification of Lys84 on the sliding of actin filaments in the in vitro motility assay
TNP-Lys84-HMM does not power the sliding of actin filaments in the in vitro motility assay (Table 2), as expected from the lack of actin activation of its ATPase activity. Moreover, when TNP-Lys84-HMM was applied to the assay together with unmodified HMM, the modified HMM inhibited the actin filament sliding (data not shown). We also examined actin motility as a function of the fractional concentration of TNP-Lys84-HMM (Fig. 4). This approach, originally developed by Cuda et al. (1997), distinguishes slowly cycling from noncycling myosins. Slowly cycling or noncycling myosin load actin in the strongly or weakly bound state, respectively, producing distinguishable changes in sliding speed versus myosin fractional concentration. The data shown in Fig. 4 for TNP-Lys84-S1 is similar to that obtained for a mixture of actively cycling skeletal muscle and noncycling platelet myosin (see Fig. 10 in Cuda et al. (1997)) suggesting that TNP-Lys84-S1 mimics a noncycling myosin.
FIGURE 4.

Effect of TNP-Lys84-HMM on the sliding speed of actin filaments. Unmodified HMM and TNP-Lys84-HMM were mixed, keeping the total concentration constant at 300 μg/ml, and absorbed to nitrocellulose-coated cover slips. Motility assay was performed as described in Materials and Methods. The mean speed of filaments was plotted against the fraction of TNP-Lys84-HMM. The bars indicate standard deviations. Between 100 and 200 actin filaments were analyzed for each sample.
Effect of S1 trinitrophenylation on cross-bridge cycle kinetics influencing motility
We examined the rates of ADP dissociation from A · M∧ · ADP (k5 in Scheme 1) and of the subsequent dissociation of A · M by ATP (K1 and k2 in Scheme 1). Changes in the rates of these steps in the cross-bridge cycle could influence the motility of the actomyosin motor (Woodward et al., 1991). ADP dissociation from actoS1 can be determined by measuring the limiting rate of ATP-induced dissociation of S1 from actin at high ATP concentrations with light scattering (Woodward et al., 1991). We employed mantADP instead of ADP in these observations because the rate of ADP dissociation from actoS1 is too fast (>900 s−1 at 4°C) for reliable comparison (Woodward et al., 1991). Stopped flow measurements in which 5 mM ATP was mixed with 5 μM actoS1 or actoTNP-Lys84-S1 in the presence of 100 μM mantADP (i.e., enough to saturate both actoS1 and actoTNP-Lys84-S1, data not shown) yield actoS1 and actoTNP-Lys84-S1 dissociation rates of 447 ± 5.3 s−1 and 499 ± 7.0 s−1, respectively (Table 2). Higher ATP concentration does not affect the observed rate implying the rate is limited by mantADP dissociation. The rate of mantADP dissociation from actoS1 is not changed meaningfully upon modification of Lys84. The rate of mantADP dissociation from S1 · mantADP was measured by ATP chase. The biexponential dissociation was not influenced significantly by trinitrophenylation of Lys84 (Table 2). Our results show that actin accelerates mantADP dissociation from both the native and modified S1 · mantADP by ∼500-fold.
The ATP-induced dissociation of actoS1 and actoTNP-Lys84-S1 is described in Scheme 1 with K1, the equilibrium constant for A · M binding ATP and, k2, the rate constant for actin dissociation from the complex. ATP-induced dissociation is rate limited by isomerization of the ternary A · M · ATP complex suggesting the rate constant for ATP-induced dissociation is (Furch et al., 1998),
 |
(2) |
For 
 indicating a linear relationship between kobs and [ATP]. ATP-induced dissociation was measured at 20°C by monitoring the decrease in light scattering, after mixing ATP with the complex by stopped flow (data not shown). The light scattering changes were fitted to a single exponential expression to yield the observed rate constant that showed a linear dependence on ATP concentration between 10 and 50 μM ATP, irrespective of S1 modification. From kobs and Eq. 2 the apparent second-order binding constants K1k2 are 2.39 ± 0.034 and 1.85 ± 0.029 × 10⁶ M−1 s−1 (Table 2) for actoS1 and actoTNP-Lys84-S1, respectively. This shows that trinitrophenylation of S1 does not perturb significantly actoS1 dissociation by ATP and the coupling between the ATP and actin sites on S1.
Binding of ADP to actoS1 and actoTNP-Lys84-S1
The affinity of ADP to actoS1 can be assessed by monitoring the ADP inhibition of actoS1 dissociation by ATP, which takes place according to Scheme 2.
SCHEME 2.

The binding of ATP to actoS1 is diffusion limited and is omitted from Scheme 2. The reverse rate of the last step (ATP dissociation) is negligible. Thus, the rate of actoS1 dissociation can be described by Eq. 3 according to Woodward et al. (1991).
 |
(3) |
where Kd is the dissociation constant of ADP from actoS1. We monitored stopped flow light scattering changes upon actoS1 dissociation after rapid mixing of 4 μM actoS1 or actoTNP-Lys84-S1 in the presence of 0–1 mM ADP with 50 μM ATP (data not shown). The data was fitted with a single exponential to obtain the first-order rate constant, kobs. The observed rate constants showed hyperbolic dependence on ADP concentration and were fitted using Eq. 3 to yield Kd (Table 2). The results show that the affinity of ADP for actoTNP-Lys84-S1 is not significantly different from that of actoS1.
We measured also the binding of mantADP to S1 and TNP-Lys84-S1 by fluorescence titration taking advantage of the significant energy transfer from S1 tryptophans to the S1 bound mantADP (see Materials and Methods). The data (not shown) were fitted to a hyperbola from which the dissociation constants for ADP binding were calculated. Almost identical binding constants were obtained for S1 and TNP-Lys84-S1, respectively (Table 2). These results show that the affinity of mantADP to both modified and native S1 is more than two orders of magnitude higher than that to actoS1 and actoTNP-Lys84-S1.
Binding of S1 and TNP-Lys84-S1 to F-actin
The strong (in the presence of ADP) and weak binding (in the presence of ATP) of native and trinitrophenylated S1 to F-actin were measured in cosedimentation assays, as described in Materials and Methods. Trinitrophenylation of S1 increased the strong binding to actin; the Kd values for S1 and TNP-Lys84-S1 were 1.16 ± 0.17 and 0.52 ± 0.09 μM, respectively (Table 2). On the other hand, weak binding of S1 to actin was somewhat reduced after the modification; the Kd values for S1 and TNP-Lys84-S1 were 20 ± 2.5 and 32.4 ± 5.7 μM, respectively. These mild perturbations do not explain the loss of actin activation of the S1 ATPase activity and the inability of TNP-Lys84-HMM to move actin filaments.
Evidence of the TNP-Lys84/lever-arm collision
Molecular modeling using the protocol described in the Appendix provides the logarithm of the total configuration energy of S1 (▪) or TNP-Lys84-S1 (□), and, the side-chain configuration energy of Lys84 in native S1 (▴) or TNP-Lys84 in TNP-Lys84-S1 (▵) for one M → M** transition simulation (Fig. 5). In the native S1 the transition was completed in ∼13 ms whereas in TNP-Lys84-S1 the transition finished in ∼22 ms. Total configuration energy for native S1 increases gradually over the course of its trajectory and makes a steep increase near the final skeletal M** configuration. The skeletal M** configuration energy has not been optimized by allowing bond angles and lengths to relax subject to the smooth muscle M** structural constraints. Until this optimization is carried out, the last few milliseconds of the trajectory remains uncertain. This anomaly has no impact on the results or conclusions discussed here. Total configuration energy for TNP-Lys84-S1 is like that for the native protein except that the trajectory is spread out over a longer time. Collisions of Lys84 or TNP-Lys84 with other residues in the protein are indicated when their configuration energy makes a sharp increase. Collisions with Gln757 occurring at or near the end of the trajectory where configuration energy is anomalously large might be unreliable.
FIGURE 5.

The logarithm of the total configuration energy of S1 (▪) or TNP-Lys84-S1 (□), and the side-chain configuration energy of Lys84 in native S1 (▴) or TNP-Lys84 in TNP-Lys84-S1 (▵) for one M → M** transition simulation. Collisions of Lys84 or TNP-Lys84 with other residues in the protein are indicated when their configuration energy makes a sharp increase. Residues indicated in bold italic are for TNP-Lys84-S1. Collisions with Gln757 occurring at the end of the trajectory where configuration energy is anomalously large might be unreliable.
Fig. 6 shows the closing of the active site back door (top) and the swinging of the lever arm (bottom) during the M → M** transition for S1 (▪) or TNP-Lys84-S1 (□). The distance between Cβ's in the back-door residues Arg245 and Glu468 is the length versus time plotted in the top figure. The change in the projection of the S1 C-terminus onto the actin filament is the lever-arm displacement plotted in the bottom figure. These trajectories are the average of 10 M → M** transition simulations. Converter or lever-arm domain collisions with the TNP in TNP-Lys84-S1 inhibit progress in these critical trajectories such that the average TNP-Lys84-S1 trajectories shown do not reach the final values in the M** conformation within 40 ms.
FIGURE 6.

The closing of the active site back door (top) and lever-arm displacement (bottom) during the M → M** transition for S1 (▪) or TNP-Lys84-S1 (□). The distance between Cβ's in the back-door residues Arg245 and Glu468 is the length versus time plotted in the top figure. The change in the projection of the S1 C-terminus onto the actin filament is the lever-arm displacement plotted in the bottom figure. These trajectories are the average of 10 M → M** transition simulations.
The closing of the back door appears to be essential for hydrolysis to proceed (Geeves and Holmes, 1999) such that the 1/e relaxation time for its closure is a measure of the ATP hydrolysis rate. Our simulation suggests ∼4 and ∼20 ms average relaxation times for ATP hydrolysis in the native S1 and TNP-Lys84-S1, respectively. For saturating ATP concentrations, (Scheme 1) ATP hydrolysis (M+ATP ↔ M* · ATP ↔ M** · ADP · Pi) at pH 8 and room temperature has ∼8 and ∼17 ms relaxation times for the unmodified (Trentham et al., 1976) and TNP-Lys84-S1 (Bagshaw and Trentham, 1974; Miyanishi et al., 1979), respectively. This agreement is adequate considering it follows from the rough assumptions made for estimating how long the protein searches for its path at each elementary step (see Appendix).
Movement of the lever arm in the M → M** transition has two apparent phases, an initial passage to an extended conformation displacing the lever arm C-terminus when projected on the actin filament in the positive direction by ∼30 Å, followed by a second passage to the compact M** conformation displacing the C-terminus in the opposite direction through a distance of ∼150 Å.
DISCUSSION
Lys84 trinitrophenylation in myosin S1 or HMM was observed to cause a dramatic change in myosin functionality such that actin activation of myosin ATPase is lost as is the ability of HMM to power actin filament sliding in the motility assay. Contrasting with this are other findings indicating the actomyosin affinity, and catalytic steps involved in ATP hydrolysis and ADP release are unchanged by trinitrophenylation. It appears that TNP-Lys84 can simultaneously inhibit actin-accelerated Pi release and the movement of the lever arm essential for motility while otherwise allowing the normal ATPase cycle. Careful investigation of Lys84 trinitrophenylation effects on multiple facets of the contraction cycle provides the mechanism of TNP action and elucidates structural aspects of the native energy transduction mechanism.
The actin activation of S1 ATPase is completely lost in TNP-Lys84-S1 even at saturating actin concentrations. Thus, actin cannot induce the back door at the nucleotide-binding site of TNP-Lys84-S1 to open and accelerate Pi release. TNP-Lys84-HMM does not power the sliding of actin filaments in the motility assay. Trinitrophenylation caused little change in actoS1 weak or strong binding affinities ruling out their perturbation as a possible cause for loss of myosin motility. The weak load produced by TNP-Lys84-HMM in the motility assay indicates that it is weakly bound to actin during most of the cross-bridge cycle and similar to a noncycling myosin by the analysis of Cuda et al. (1997).
The dissociation rates of mantADP from S1 · mantADP and actoS1 · mantADP, and of actoS1 by ATP, were virtually unchanged by trinitrophenylation suggesting that motor function inhibition is not related to these steps. According to the measured rates (Table 2), actin accelerates ∼500-fold ADP release from the modified and unmodified S1. Also the labeling almost did not influence the binding equilibrium of ADP and mantADP with actoS1 and S1 (Table 2). These results indicate that Lys84 trinitrophenylation does not affect the opening by actin of the “main entrance” of the nucleotide cleft, where ADP leaves.
Perturbation of the Lys84 site by actin is suggested by the slower rates of TNP modification both in the presence and absence of ADP (Table 1). As Lys84 is located at the catalytic/lever-arm domain interface, the conformational changes in the vicinity of this residue may be caused by lever-arm movements, which are essential for the power stoke (Ajtai et al., 1999). Moreover, in accordance with the observed loss of the power stroke indicating impaired lever-arm movement, CD from TNP-Lys84 is not affected by actin binding in the presence or absence of MgADP (Fig. 3).
S1 and TNP-Lys84-S1 molecular dynamics simulating hydrolysis and force production clarifies the structural basis for the observed effects of Lys84 trinitrophenylation. A biased random walk in the Ramachandran angles making up a significant part of the converter domain peptide, the deformable converter domain (DCD) peptide spanning residues Ile464-Ile523 and Arg696-Lys716, simulates the myosin dynamics accompanying ATP hydrolysis. Native S1 simulated dynamics reproduces the observed ATP hydrolysis kinetics when the hydrolysis rate is equated with the rate for closing the back door for Pi release. Lever-arm domain movement accompanying ATP hydrolysis follows a two-step trajectory in which myosin first assumes an extended conformation followed by the compact conformation expected for M**. The extended S1 conformation resembles the scallop myosin crystal structure with bound MgADP (Houdusse et al., 1999; Houdusse et al., 2000) and we tentatively identify it with the M* intermediate between M and M** in Scheme 1 (Fig. 6). Our transduction model located this intermediate in the overall transition suggesting the constraints from DCD interactions with the intact catalytic and lever-arm domains define a transition pathway similar to that suggested by the S1 crystal structures of the M, M*, and M** intermediates. Other work has suggested that the M* conformation is nearly identical to M** (Dominguez et al., 1998) or that it maintains the bent conformation assumed in M** (Maruta et al., 1999). If true, the extended conformation must represent a different intermediate.
TNP-Lys84-S1 simulated dynamics during ATP hydrolysis reproduced the characteristic loss of the phosphate burst observed for this system. The hydrolysis rate reduction is from the energetic collision of the TNP moiety with residues in the converter and lever-arm domains inhibiting back-door closure. Associating the power stroke with the reversal of the structural changes accompanying hydrolysis, the energetic collision of the TNP moiety with residues in the converter and lever-arm domains inhibits lever-arm movement and the weak-to-strong actin binding transition necessary for motility. The latter effect, like the data in Fig. 4, suggests the TNP-Lys84-S1 is noncycling. As the principal effects of Lys84 trinitrophenylation on the cross-bridge cycle are perturbation of lever-arm movements and inhibition of actin's acceleration of Pi release, it seems that back-door opening and closing is coupled to lever-arm movement.
In summary, trinitrophenylation of Lys84 in S1 eliminates actin-activated ATPase and the power stroke from the enzymatic cycle of actoTNP-Lys84-S1. These effects are not associated with perturbation of either the weak or strong actin binding to TNP-Lys84-S1, with the release of ADP from the active site, or with the dissociation of actomyosin by ATP. Molecular dynamics simulation of lever-arm movement in S1 and TNP-Lys84-S1 indicates the principal structural effect of Lys84 trinitrophenylation on the cross-bridge cycle is perturbation of the lever-arm movement due to collision of TNP with the converter and lever-arm domains. Our findings suggest TNP at Lys84 uncouples ATP hydrolysis from lever-arm movement during the cross-bridge cycle.
Acknowledgments
This work was supported by Israel Science Foundation (grant 230/99 to A. M.) and by National Institutes of Health (grant AR39288 to T. P. B. and grant AR22031 to E. R.).
APPENDIX: THE MOLECULAR MODELING OF ENERGY TRANSDUCTION
The hydrolysis step structures
The M → M** transition is the combination of the isomerization (k6) and the hydrolysis (k7) steps in Scheme 1 and its reversal is associated with the power stroke. We investigate the M → M** transition in Scheme 1 using skeletal S1 atomic coordinates to address the feasibility of a TNP/lever-arm collision during hydrolysis and force generation. This choice bypasses M*, but we elected to combine the two steps into one for our purpose here. The M → M** transition has endpoints for which there are atomic resolution structures, however, only M has a skeletal crystal structure (Rayment et al., 1993). The M** structure was solved for smooth muscle S1 (Dominguez et al., 1998). Skeletal and smooth muscle structures are very similar with ∼50% sequence identity facilitating their detailed comparison. We modify the skeletal M to approximate a skeletal M** by merging skeletal with smooth muscle structures using the energy transduction model described next.
Approximating a skeletal M** structure based on the smooth M** crystal structure
Aligned skeletal M and smooth M** structures reveal the notion that during ATP hydrolysis the catalytic and lever-arm domains remain intact whereas conformation change occurs in the joining converter domain (Dominguez et al., 1998). Geeves and Holmes listed Ramachandran angles from 47 converter domain residues largely responsible for the different conformations in skeletal M and smooth M** (Geeves and Holmes, 1999). These residues and 31 more to include Glu468 from the back door of the active site through which inorganic phosphate escapes after hydrolysis (Yount, 1997) define a deformable converter domain (DCD) peptide spanning residues Ile464-Ile523 and Arg696-Lys716. After replacing the skeletal M Ramachandran angles with those from smooth M** in the 78 residues of the DCD, skeletal coordinates in these residues were compared with the corresponding smooth M** coordinates and overlap maximized by iterative refinement of the skeletal Ramachandran angles. We paid no attention to side chains and did not attempt to minimize configuration energy by allowing relaxation in bond angles and lengths. The skeletal M** structure presented here is an approximation to the true skeletal M** structure that will be refined in the future. Fig. 7 overlays smooth M** (red) and the approximate skeletal M** (blue) structures. Their aligned catalytic domains are shown looking down the switch-2 helix (AA 475-509) with the lever arm in the foreground. F-actin binds on the right side with vertical filament axis. The structures appear similar and their principal inertial frames, a measure of their mass distribution in space, are indistinguishable.
FIGURE 7.
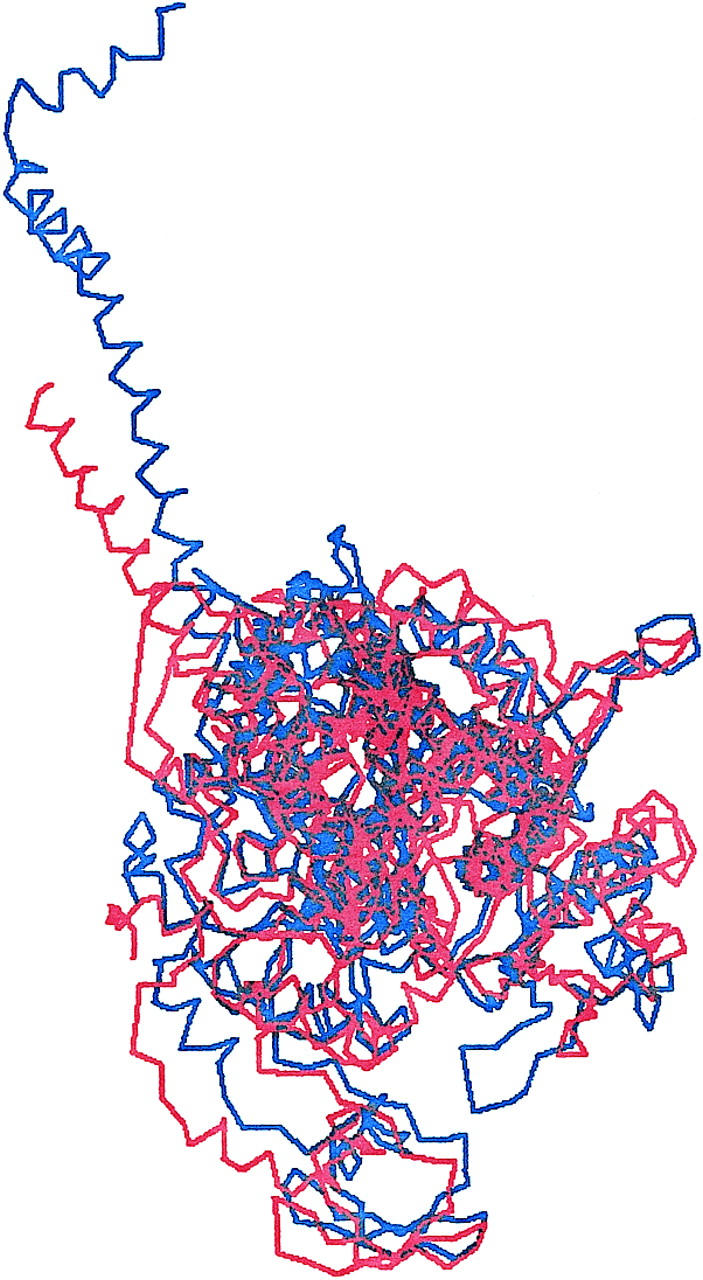
Overlaid are smooth M** (red) and the approximate skeletal M** (blue) structures. Aligned catalytic domains are shown looking down the switch-2 helix (AA 475-509) with the lever arm in the foreground. F-actin binds on the right side with vertical filament axis.
The dynamical model
Brant, Miller, and Flory (Brant et al., 1967) computed the classical configuration energy of polyalanine. Atom positions within the peptide bond, the Cβ atoms, and the protons were fixed at nominal values whereas Ramachandran angles (φ, ψ) were adjustable parameters. Included atomic interactions were between nonbonded atoms with Coulomb and van der Waals potentials. A Ramachandran angle torsion potential restricts their free rotary movement. The configuration energy predicts the stability of the α-helix and β-sheet secondary structures. The remarkable similarity between the stable configuration energy regions in (φ, ψ) computed with this simple model, and the Ramachandran plots from real proteins (Smith and Rayment, 1996) suggest that these interactions govern Scheme 1 transitions involving significant secondary structure change. This simple approach minimizes the number of free parameters in the system making computations connecting the state transitions in Scheme 1 tractable. S1 remodeling during the M → M** transition is represented as elementary step transitions in the Ramachandran angles taking place in a sequence. We begin the dynamics calculation with skeletal M because it is a solved skeletal structure and has a minimal configuration energy.
Configuration energy, EC, is the sum of torsion, Coulomb, and van der Waals contributions given by,
 |
(4) |
where sums in j and k are over nonbonded atoms whose separation distance depends on the peptide Ramachandran angles, qj is the charge on atom j, rj,k is the distance between atoms j and k, and ɛ is the dielectric constant of the medium. Formulae for Aj,k and Bj,k are from the Slater-Kirkwood equations (Pitzer, 1959) with constants from Brant et al. (1967). Coulomb and van der Waals interactions were ignored for rj,k > 14 Å. Torsion potential ETor = (Vω/2)(1 + cos[3(ω−2π/3)] for ω representing either of the Ramachandran angles and barrier height Vω = 1 kcal/mol.
The algorithm representing S1 dynamics is a biased random walk in the Ramachandran (φ, ψ) angles of the DCD. In a program cycle a particular Ramachandran angle, for instance φi, undergoes step translation φi → φi + δi and configuration energy of the new structure is computed. The probability for choosing φi, p(φi), is proportional to the minimum number of steps between φi's present and final values. This procedure ensures p governs step order and that angles further from their final values are chosen more frequently. Step size, δ, is chosen randomly.
One step translation through ∼5° takes ∼10 ns in S1 based loosely on polarization anisotropy amplitude and relaxation during contraction (Burghardt and Ajtai, 1985). The full lever-arm swing takes ∼10 ms (Trentham et al., 1976) suggesting there are ∼106 attempted steps/swing. For a minimal step size of 2–3° there are ∼2000 correct steps/swing (correct steps head toward the goal of the final conformation, incorrect steps head away from the goal) suggesting each step samples an average of ∼500 possibilities before committing to a path. The number of average sampled possibilities would be less if some of the steps are incorrect. The algorithm samples up to 500 elementary transitions until it finds one that lowers or maintains the configuration energy. Conformations that increase energy are accepted if their Boltzmann factor is larger than a randomly chosen number between zero and one. If either direction of a step transition is equally likely then the random walk is unbiased. The unbiased walk did not noticeably converge to the final structure within 107 steps convincing us that the protein machinery must actively direct the steps. The algorithm directs steps by biasing the random walk. Step direction takes the present to the final structure with the fewest steps except in the following circumstances. (1) When the absolute difference between the present and final angle undergoing transition is >120° and the true path could reasonably require reversal of the assigned step direction, and (2) when completion of a step following the sampling of elementary transitions requires a configuration energy increase beyond a certain empirically determined increment. Circumstance (1) was met for particular angles. They made unbiased walks until they converged to <120° of their final value. Circumstance (2) caused another sampling of elementary transitions but where steps direction is unbiased. The occasional insertion of the unbiased walks relaxed potential energy built up in the structure. If no suitable path could be found the allowed configuration energy limit was increased and the process started again.
References
- Ajtai, K., Y. M. Peyser, S. Park, T. P. Burghardt, and A. Muhlrad. 1999. Trinitrophenylated reactive lysine residue in myosin detects lever arm movement during the consecutive steps of ATP hydrolysis. Biochemistry. 38:6428–6440. [DOI] [PubMed] [Google Scholar]
- Bagshaw, C. R., and D. R. Trentham. 1974. The characterization of myosin-product complexes and product-release steps during the magnesium ion-dependent adenosine triphosphate reaction. Biochem. J. 141:331–349. [DOI] [PMC free article] [PubMed] [Google Scholar]
- Brant, D. A., W. G. Miller, and P. J. Flory. 1967. Conformational energy estimates for statistically coiling polypeptide chains. J. Mol. Biol. 23:47–65. [Google Scholar]
- Burghardt, T. P., and K. Ajtai. 1985. Fraction of myosin cross-bridges bound to actin in active muscle fibers: estimation by fluorescence anisotropy measurements. Proc. Natl. Acad. Sci. USA. 82:8478–8482. [DOI] [PMC free article] [PubMed] [Google Scholar]
- Burghardt, T. P., A. R. Cruz-Walker, S. Park, and K. Ajtai. 2001a. Conformation of myosin interdomain interactions during contraction: deductions from muscle fibers using polarized fluorescence. Biochemistry. 40:4821–4833. [DOI] [PubMed] [Google Scholar]
- Burghardt, T. P., S. Park, and K. Ajtai. 2001b. Conformation of myosin interdomain interactions during contraction: deductions from proteins in solution. Biochemistry. 40:4834–4843. [DOI] [PubMed] [Google Scholar]
- Cuda, G., E. Pate, R. Cooke, and J. R. Sellers. 1997. In vitro actin filament sliding velocities produced by mixtures of different types of myosin. Biophys. J. 72:1767–1779. [DOI] [PMC free article] [PubMed] [Google Scholar]
- Dominguez, R., Y. Freyzon, K. M. Trybus, and C. Cohen. 1998. Crystal structure of a vertebrate smooth muscle myosin motor domain and its complex with the essential light chain: visualization of the pre-power stroke state. Cell. 94:559–571. [DOI] [PubMed] [Google Scholar]
- Fabian, F., and A. Muhlrad. 1968. Effect of trinitrophenylation on myosin ATPase. Biochim. Biophys. Acta. 162:596–603. [DOI] [PubMed] [Google Scholar]
- Fisher, A. J., C. A. Smith, J. B. Thoden, R. Smith, K. Sutoh, H. M. Holden, and I. Rayment. 1995. X-ray structures of the myosin motor domain of Dictyostelium discoideum complexed with MgADP.BeFx and MgADP-AlF4. Biochemistry. 34:8960–8972. [DOI] [PubMed] [Google Scholar]
- Furch, M., M. A. Geeves, and D. J. Manstein. 1998. Modulation of actin affinity and actomyosin adenosine triphosphatase by charge changes in the myosin motor domain. Biochemistry. 37:6317–6326. [DOI] [PubMed] [Google Scholar]
- Geeves, M. A., and K. C. Holmes. 1999. Structural mechanism of muscle contraction. Annu. Rev. Biochem. 68:687–728. [DOI] [PubMed] [Google Scholar]
- Houdusse, A., V. N. Kalabokis, D. Himmel, A. G. Szent-Gyorgyi, and C. Cohen. 1999. Atomic structure of scallop myosin subfragment S1 complexed with MgADP: a novel conformation of the myosin head. Cell. 97:459–470. [DOI] [PubMed] [Google Scholar]
- Houdusse, A., A. G. Szent-Gyorgyi, and C. Cohen. 2000. Three conformational states of scallop myosin S1. Proc. Natl. Acad. Sci. USA. 97:11238–11243. [DOI] [PMC free article] [PubMed] [Google Scholar]
- Hozumi, T., and A. Muhlrad. 1981. Reactive lysyl of myosin subfragment 1: location on the 27K fragment and labeling properties. Biochemistry. 20:2945–2950. [DOI] [PubMed] [Google Scholar]
- Kitagawa, S., J. Yoshimura, and Y. Tonomura. 1961. On the active site of myosin A-adenosine triphosphatase. II. Properties of the trinitrophenyl enzyme and the enzyme free from divalent cations. J. Biol. Chem. 236:902–906. [PubMed] [Google Scholar]
- Kodama, T., K. Fukui, and K. Kometani. 1986. The initial phosphate burst in ATP hydrolysis by myosin and subfragment-1 as studied by a modified malachite green for determination of inorganic phosphate. J. Biochem. 99:1465–1472. [DOI] [PubMed] [Google Scholar]
- Maita, T., E. Yajima, S. Nagata, T. Miyanishi, S. Nakayama, and G. Matsuda. 1991. The primary structure of skeletal muscle myosin heavy chain: IV. Sequence of the rod, and the complete 1,938-residue sequence of the heavy chain. J. Biochem. 110:75–87. [DOI] [PubMed] [Google Scholar]
- Margossian, S. S., and S. Lowey. 1982. Preparation of myosin and its subfragments from rabbit skeletal muscle. Methods Enzymol. 85:55–72. [DOI] [PubMed] [Google Scholar]
- Maruta, S., Y. Uyehara, K. Homma, Y. Sugimoto, and K. Wakabayashi. 1999. Formation of the myosin.ADP.gallium fluoride complex and its solution structure by small-angle synchrotron X-ray scattering. J. Biochem. 125:177–185. [DOI] [PubMed] [Google Scholar]
- Miller, C. J., W. W. Wong, E. Bobkova, P. A. Rubinstein, and E. Reisler. 1996. Mutational analysis of the role of the N terminus of actin in actomyosin interactions. Comparison with other mutant actins and implications for the cross-bridge cycle. Biochemistry. 35:16557–16565. [DOI] [PubMed] [Google Scholar]
- Miyanishi, T., A. Inoue, and Y. Tonomura. 1979. Differential modification of specific lysine residues in the two kinds of subfragments-1 of myosin with 2,4,6-trinitrobenzenesulfonate. J. Biochem. 85:747–753. [PubMed] [Google Scholar]
- Mornet, D., P. Pantel, R. Bertrand, E. Audemard, and R. Kassab. 1980. Localization of the reactive trinitrophenylated lysyl residue of myosin ATPase site in the NH2-terminal (27 K domain) of S1 heavy chain. FEBS Lett. 117:183–188. [DOI] [PubMed] [Google Scholar]
- Muhlrad, A. 1983. Mechanism of adenosinetriphosphatase activity of trinitrophenylated myosin subfragment 1. Biochemistry. 22:3653–3660. [DOI] [PubMed] [Google Scholar]
- Muhlrad, A., and F. Fabian. 1970. Effects of substrate and substrate analogues on the trinitrophenylation of myosin. Biochim. Biophys. Acta. 216:422–427. [DOI] [PubMed] [Google Scholar]
- Muhlrad, A., and R. Takashi. 1981. Ionization of reactive lysyl residue of myosin subfragment 1. Biochemistry. 20:6749–6754. [DOI] [PubMed] [Google Scholar]
- Okuyama, T., and K. Satake. 1960. On the preparation and properties of 2,4,6-trinitrophenyl-amino acids and -peptides. J. Biochem. 47:454–462. [Google Scholar]
- Pitzer, K. S. 1959. Inter- and intramolecular forces and molecular polarizability. In Advances in Chemical Physics. I. Prigogine, editor. Interscience, New York. 59–83.
- Rayment, I., W. R. Rypniewski, K. Schmidt-Base, R. Smith, D. R. Tomchick, M. M. Benning, D. A. Winkelmann, G. Wesenberg, and H. M. Holden. 1993. Three-dimensional structure of myosin subfragment-1: a molecular motor. Science. 261:50–58. [DOI] [PubMed] [Google Scholar]
- Smith, C. A., and I. Rayment. 1996. X-ray structure of the magnesium(II)-ADP-vanadate complex of the dictyostelium discoideum myosin motor domain to 1.9 Å resolution. Biochemistry. 35:5404–5417. [DOI] [PubMed] [Google Scholar]
- Spudich, J. A., and S. Watt. 1971. The regulation of rabbit skeletal muscle contraction. I. Biochemical studies of the interaction of the tropomyosin-troponin complex with actin and the proteolytic fragments of myosin. J. Biol. Chem. 246:4866–4871. [PubMed] [Google Scholar]
- Tonomura, Y., P. Appel, and M. Morales. 1966. On the molecular weight of myosin II. Biochemistry. 5:515–521. [DOI] [PubMed] [Google Scholar]
- Tonomura, Y., J. Yoshimura, and T. Onishi. 1963. On the active site of myosin A-adenosine triphosphatase. IV. Properties of binding of trinitrobenzenesulfonate and p-chloromercuribenzoate to myosin A. Biochim. Biophys. Acta. 78:698–700. [DOI] [PubMed] [Google Scholar]
- Trentham, D. R., J. F. Eccleston, and C. R. Bagshaw. 1976. Kinetic analysis of ATPase mechanisms. Q. Rev. Biophys. 9:217–281. [DOI] [PubMed] [Google Scholar]
- Weeds, A. G., and R. S. Taylor. 1975. Separation of subfragment-1 isoenzymes from rabbit skeletal muscle myosin. Nature. 257:54–56. [DOI] [PubMed] [Google Scholar]
- Woodward, S. K. A., J. F. Eccleston, and M. A. Geeves. 1991. Kinetics of the interaction of 2′(3′)-O-(N-methylanthraniloyl)-ATP with myosin subfragment 1 and actomyosin subfragment 1: characterization of two acto · S1 · ADP complexes. Biochemistry. 30:422–430. [DOI] [PubMed] [Google Scholar]
- Yount, R. G. 1997. Myosin as a motor and a back door enzyme. FASEB J. 11:A855 (Abstr.). [Google Scholar]