Abstract
Absorption changes in the photocycle of the recently described retinal protein, proteorhodopsin, are analyzed. The transient spectra at pH 9.5, where it acts as a light-driven proton pump, reveal the existence of three spectrally different intermediates, K, M, and N, named in analogy with the photointermediates of bacteriorhodopsin. Model analysis based on time-dependent absorption kinetic signals at four wavelengths suggested the existence of two more spectrally silent intermediates and lead to a sequential reaction scheme with five intermediates, K, M1, M2, N, and PR′, before decay to the initial state PR. An L-like intermediate was not observed, probably for kinetic reasons. By measuring the light-generated electric signal of an oriented sample, the electrogenicity of each intermediate could be determined. The electrogenicities of the first three intermediates (K, M1, and M2) have small negative value, but the last three components, corresponding to the N and PR′ intermediates and PR, are positive and two-orders-of-magnitude larger. These states give the major contributions to the proton translocation across the membrane. The energetic scheme of the photocycle was calculated from the temperature-dependence of the absorption kinetic signals.
INTRODUCTION
Recently, large numbers of new retinal proteins were discovered in both prokaryotic and eukaryotic organisms. They could be classified in two clearly distinct families: type 1, the archaeal-type rhodopsins, and type 2, the photosensitive receptor proteins (Spudich et al., 2000). Proteorhodopsin (PR), a type 1 protein, was discovered in the uncultivated marine bacterioplankton (Beja et al., 2000; Beja et al., 2001). The early studies had shown that the chromophore is all-trans retinal. Photoisomerization to 13-cis initiates a photocycle, and a proton is transported across the cell membrane from the cytoplasm to the extracellular space. The deduced structure of the seven transmembrane helices, the extensive sequence similarities, and the same function, had all suggested that the photocycle should resemble that of bacteriorhodopsin (BR). Indeed, the spectra of the two intermediates identified were similar to the M and O intermediates in BR (Beja et al., 2001).
Based on the alignment of the PR and BR sequences, the putative proton acceptor and donor to the Schiff base were identified. From spectroscopy in the visible and FTIR it was confirmed that Asp-97 in PR is the proton acceptor, equivalent to that of Asp-85 in BR, whereas Glu-108 in PR corresponds to Asp-96 in BR, the proton donor to the Schiff base (Dioumaev et al., 2002). Although global analyses of the absorption kinetic signals predicted seven intermediates in the PR photocycle, only intermediates K, M, N, and O could be identified (Beja et al., 2001; Dioumaev et al., 2002).
To understand the details of the photocycle, and therefore the process of ion translocation through cell membranes, we measured absorption and electric signal kinetics. Similar techniques were used in the study of the proton-transporting photocycle of bacteriorhodopsin (Gergely et al., 1997; Ludmann et al., 1998a,b), the chloride ion-transporting photocycle of salinarum halorhodopsin (Váró et al., 1995c), and pharaonis halorhodopsin (Váró et al., 1995a,b; Ludmann et al., 2000).
MATERIALS AND METHODS
Wild-type PR was expressed in Escherichia coli (strain UT5600), as described before (Beja et al., 2000; Dioumaev et al., 2002). The cells were broken by either sonication or using an Aminco French press at 12 MPa. The membranes were purified by centrifugation in distilled water and on a sucrose gradient, resulting in a strongly light-scattering membrane preparation.
For transient spectroscopy and absorption kinetic measurements, acrylamide gel samples were prepared according to a procedure described elsewhere (Mowery et al., 1979). Electric signal measurements were carried out on oriented gel samples (Dér et al., 1985). During sample preparation, no buffer or salt was used, to avoid the aggregation of the membranes. Prior the measurements the gel samples were soaked overnight in the bathing solution containing 100 mM NaCl and 50 mM 3-[Cyclohexylamino]-2-hydroxy-1-propanesulfonic acid (CAPSO) at pH 9.5.
In the measuring setup a 250-W halogen lamp provided the measuring light through a heat filter. Laser excitation was with a frequency-doubled Nd-YAG laser (Surelite I0, Continuum, Santa Clara, CA), of 1.5–2 mJ/cm2 energy density at 532 nm. Transient spectroscopic measurements were performed with an optical multichannel analyzer described earlier (Zimányi et al., 1989). From the measured difference spectra the absolute spectra of the intermediates were calculated (Gergely et al., 1997). Absorption kinetic signals were recorded at four wavelengths with a transient recorder card (NI-DAQ PCI-5102, National Instruments, Austin, TX) with 16 MB memory. The signals were fitted with RATE and EYRING programs as described (Kulcsár et al., 2000). Electric signals were measured on the earlier described setup (Gergely et al., 1993). The time resolution of the system was ∼100 ns. The electrogenicity of intermediates were calculated in MATLAB version 4.2, as before (Ludmann et al., 1998b).
RESULTS AND DISCUSSION
It was shown earlier that PR contains mostly all-trans retinal and there is no noticeable light adaptation; i.e., it is a rather homogeneous and stable sample (Dioumaev et al., 2002). The measurements were carried out at pH 9.5, which is more than two pH units above the pKa of Asp 97, the proton acceptor in PR (Dioumaev et al., 2002).
The spectrum of the photocycle intermediates
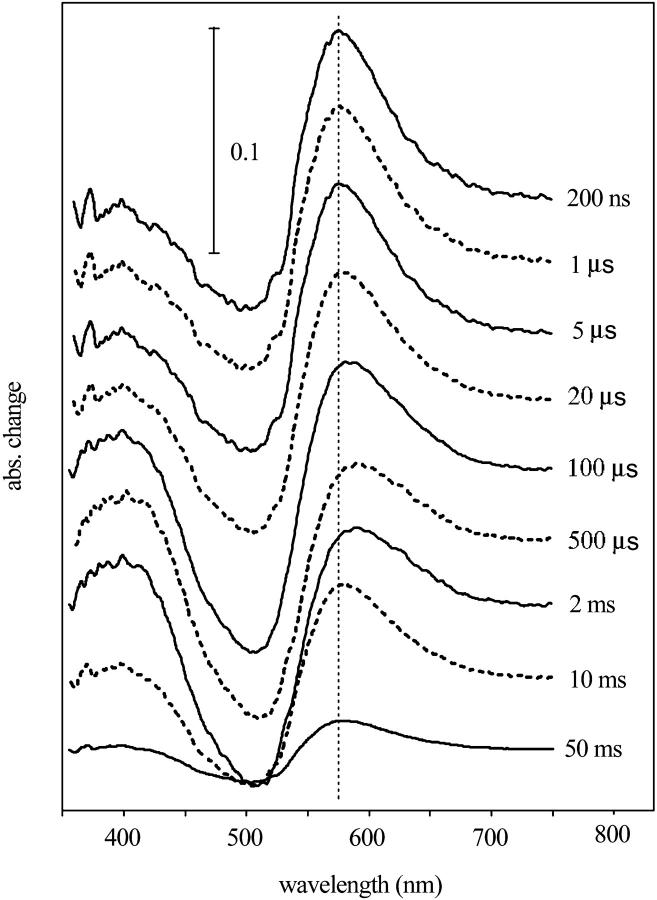
Eighteen difference spectra were measured in the time interval between 200 ns and 50 ms at logarithmically evenly spaced time points. Each spectrum was the average of 100 measurements. At the beginning, and after every six spectra, a control spectrum with 100 ms delay was measured. The gradual photodestruction of the sample, estimated from these control spectra, amounted to ∼20% at the end of the measurement. By multiplying each spectrum with its bleaching factor, it was possible to eliminate this artifact. The difference spectra were noise-filtered by SVD analysis (Golub and Kahan, 1992; Gergely et al., 1997). Based on the weight factor of the components and the autocorrelation of the basis spectra and their time-dependent amplitudes, the first two basis spectra were considered to be different from noise. The first two spectra had autocorrelation products of 0.914 and 0.891 (the third had only 0.0068), and weight factors of 2.42 and 0.63 (the third had 0.12). This indicated that a minimum of two spectrally distinguishable intermediates exist during the photocycle, but the fact that the basis spectra had complex shapes, and the corresponding amplitudes had complex time-dependencies, suggested the existence of more than two intermediate spectra. Noise-filtered difference spectra were reconstructed from the two basis spectra and amplitude factors (Fig. 1).
FIGURE 1.
SVD-filtered difference spectra of proteorhodopsin, measured at the indicated time delays after the laser excitation. Measuring conditions were 100 mM NaCl, 50 mM CAPSO, pH 9.5, and 20°C.
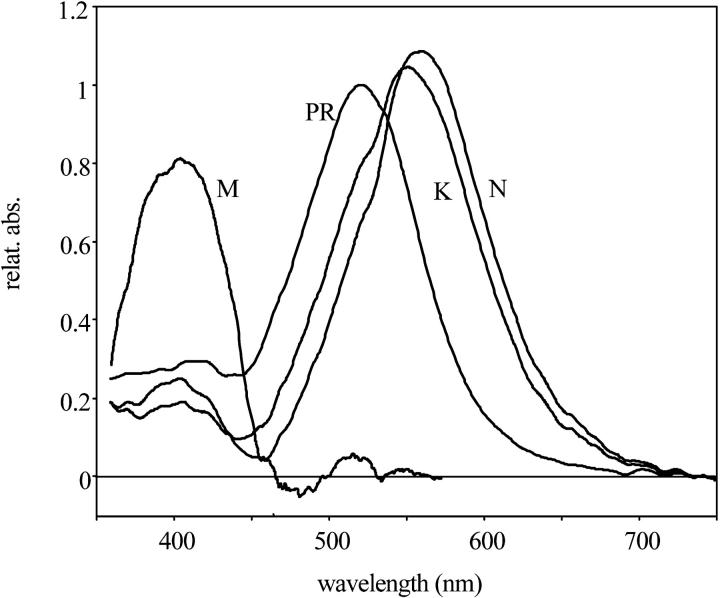
A model-independent search for the spectra of intermediates was performed with the method described earlier (Gergely et al., 1997). The PR ground state spectrum, used in the calculations, was corrected by subtracting scattered light (see Fig. 2). Possible errors introduced by the subtraction will not affect the model fitting, as only the difference spectra of the intermediates were used in the calculation. With only two spectrally different intermediates we were not able to get spectra with a single maximum, as expected for retinal proteins. Spectra with acceptable shapes (Zimányi and Lanyi, 1993) could be produced only when the search was for three intermediates. We named the intermediates similarly to the intermediates of bacteriorhodopsin, based on their time succession and the positions of the absorption maxima (Fig. 2). From the spectral calculations we estimated that the laser flash excited ∼24% of the PR. With increasing laser intensity the size of the signal increased linearly to over 30% excitation, assuring that the measurements were carried out within the linear part of the light intensity dependence. As the spectra seem to contain somewhat more absorption at the red edge than expected, we explored the possibility of introducing a fourth spectral component. These efforts were unsuccessful, as in this case one of the calculated spectra always had more than one absorption maximum, and when fitted to models the time-dependent concentration changes during the photocycle were no longer smooth. This suggested that the data is better described by only three spectrally independent intermediates. The spectrum of K (λmax = 555 nm) and N (λmax = 560 nm) were both red-shifted to almost the same wavelength, but they were well separated in time. The wavelength maximum of the M, corresponding to the unprotonated Schiff base, was at 405 nm, almost at the position of the similar intermediate in bacteriorhodopsin photocycle (λmax = 410 nm; Gergely et al., 1997). In spite of its red-shifted maximum, the third intermediate was named N because the FTIR study (Dioumaev et al., 2002) had showed that it contains 13-cis retinal as the N intermediate of BR.
FIGURE 2.
The spectra of intermediates of the proteorhodopsin photocycle, calculated from the difference spectra shown in Fig. 2.
Photocycle model
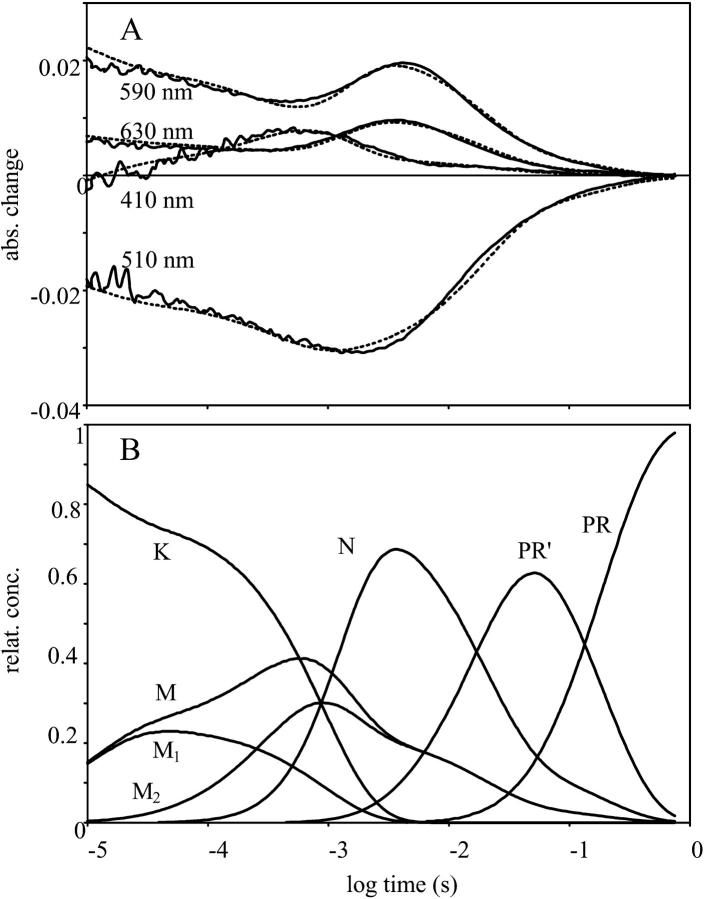
The multiexponential rise of the 410-nm absorption kinetic trace, and the complex decay of all the absorption kinetic signals (Fig. 3 A, continuous lines), suggested that the model should contain more than three intermediates. Different models were fitted with the RATE program (Ludmann et al., 1998a), where the relative extinction coefficients of the intermediates at the measured wavelengths were taken from the calculated spectra (Fig. 2). The best fit was reached by introducing two M states, and a PR-like spectrally silent intermediate, PR′, i.e., with five kinetic intermediates. The option of two N intermediates, instead of two M states with a spectrally silent transition, lead to a much worse fit. Although global analyses of the absorption kinetic signals had indicated the existence of seven components (Dioumaev et al., 2002) the introduction of additional intermediates did not significantly improve the fit. It is interesting to note that, in the case of the photocycle of BR, a similar phenomenon was observed: although the global fit of the absorption kinetic signals predicted seven intermediates, only six could be identified (Váró and Lanyi, 1991; Ludmann et al., 1998a). It is possible that in the case of PR a better data set would reveal the existence of more intermediates, with much lower occupancies than K, M, and N. If the decay of K to L and L to M1 transitions had such rate constants that L could not accumulate, the absence of L would be for kinetic reasons only. Indeed, under different conditions than reported here (not shown), there was evidence for the intermediate L, without great differences of the spectra of the unexcited protein and the intermediates K, M, and N.
FIGURE 3.
Time-dependent absorption signals measured at four wavelengths on proteorhodopsin (A, continuous lines), the fit with the model described in the text (A, broken lines), and the time-dependent concentrations in the fitted photocycle model (B). Measuring conditions were the same as in Fig. 1.
Using the method developed earlier (Ludmann et al., 1998a) a variety of sequential and parallel photocycle models were then fitted. The requirement for accepting the model was to respond properly to all measuring conditions and to fit the measured electric signal. The linearity of the Eyring plots (ln k versus 1/T) proved to be the most stringent criterion. The only model that fulfilled all the criteria contain the sequential reactions
 |
The M1 to M2 transition and the decay of PR′ are unidirectional, and all the other transitions are reversible, resulting in a complex mixture of intermediates at each time point (Fig. 3 B). The fit of the model to the absorption kinetic traces is shown on Fig. 3 A (dashed lines). The slow decay of intermediate K and the early appearance of the N result in a rather low M concentration. The multiphasic rise and decay of the absorption signal measured at 410 nm suggested the existence of more M intermediates, similar to that observed in the case of BR (Váró and Lanyi, 1991; Ludmann et al., 1998a). The transition between two kinetically separated, “spectrally silent” successive M intermediates, containing deprotonated Schiff-base, could have the same role as in the case of BR—the switch of the ion accessibility from one side of the membrane to the other. The introduction of intermediate PR′(O) was made also on a kinetic basis, as described earlier for halorhodopsin (Váró et al., 1995a), to improve the fit of the multiexponential final decay in the photocycle. In the visible region this intermediate is indistinguishable from PR but the FTIR study showed great similarity to the O intermediate of BR, containing all-trans retinal (Dioumaev et al., 2002). The rate constants of the fitted model to the absorption kinetics measured at 20°C are presented in Table 1.
TABLE 1.
The time constants of the transitions and the electrogenicities of the photocycle intermediates of the proteorhodopsin, measured at 20°C
| Intermediate or transition | Forward reaction | Back-reaction | Relative electrogenicity |
|---|---|---|---|
| K | −0.0017 | ||
| K to M1 | 43 ms | 14 ms | |
| M1 | −0.0085 | ||
| M1 to M2 | 222 ms | – | |
| M2 | −0.0073 | ||
| M2 to N | 0.53 ms | 1.9 ms | |
| N | 0.24 | ||
| N to PR′ | 18.8 ms | 119 ms | |
| PR′(O) | 0.7 | ||
| PR′ to PR | 153 ms | – | |
| PR | 1 |
Charge motions in PR
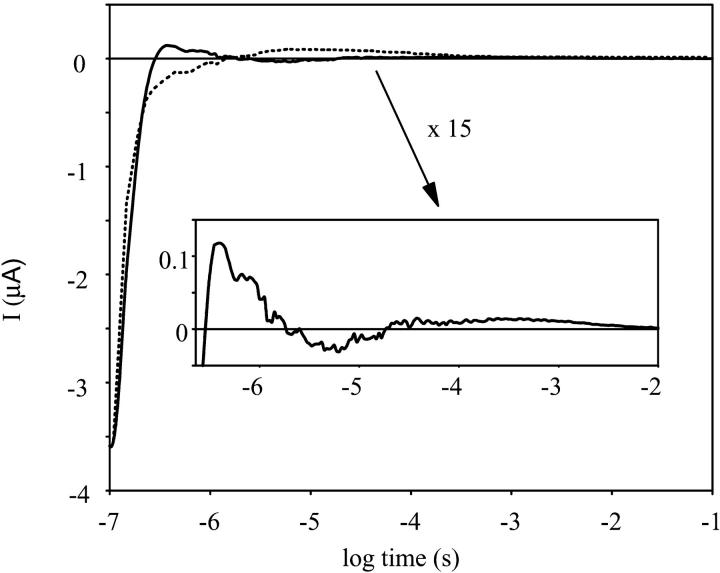
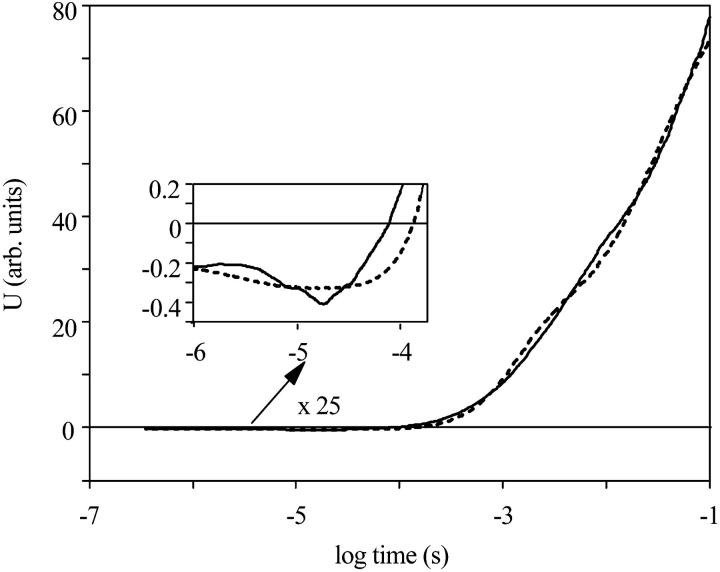
With oriented samples encased in gels, and the method described before (Gergely et al., 1993; Ludmann et al., 1998b), charge motions can be determined inside the protein. As there is no information about the shape and permanent dipole moment of the PR containing membrane fragments, their orientation could not be correlated to that of BR containing purple membranes. The external electric field, applied during the polymerization of the gel sample, produced good orientation of the membranes because a well-defined electric signal could be measured (Fig. 4). Control experiments proved that it is the protein that generates the measured signals. The orientation of the signal was chosen in such a way that the very slow component of the signal, which should correspond to the charge transfer across the membrane, was positive as in the case of BR (Figs. 4 and 5). The measured current signal has a very fast negative component, followed by a multicomponent positive signal in the submicrosecond time interval, undetectable in the absorption kinetic signal due to laser artifact. An increase in the negative amplitude of the voltage signal (Fig. 5) coincides with the K to M1 transition.
FIGURE 4.
The electric current signal measured on an oriented sample. Measuring conditions were the same as in Fig. 1. The dashed line is the electrical signal from a bacteriorhodopsin sample under similar conditions.
FIGURE 5.
The voltage signal calculated from the current shown in Fig. 4 (continuous line) and its fit with the calculated electrogenicities of the intermediates (dashed line).
The integral of the measured current signal, which is proportional to the voltage generated in the membrane by charge motions inside the protein (Fig. 5), can be described as the sum of the concentrations of intermediates multiplied by their electrogenicities. The electrogenicity of the intermediate is defined as the change of the dipole moment in the direction perpendicular to the membrane (Ludmann et al., 1998b). The electrogenicity is the sum of all charge displacements, originating both from the transported ion and any amino acid side chain motions, inside the protein during the lifetime of that intermediate. This type of electric signal measurement is insensitive to charge motion in the electrolyte outside the membrane, because of shielding by the existing free charges. From the time-dependent concentration of the intermediates (Fig. 3 B) the electrogenicity of each intermediate could be calculated. Repeated measurements established that the voltage signal was reliable up to 100 ms. If the total charge motion at the end of the photocycle is considered to be 1, corresponding to the transport of one proton across the membrane, the relative electrogenicity of each intermediate can be determined (Table 1). Progressive motion of the proton across the membrane will generate consecutive electrogenicities with increasing positive values.
Comparing the calculated electrogenicities to those of BR (Ludmann et al., 1998b), it is evident that in both cases the early intermediates have small and negative electrogenicities. In the case of PR, they are K, M1, and M2, whereas in the case of BR, they are K and L. The small electrogenicities of the early intermediates characterize charge shifts at and around the retinal. The two-orders-of-magnitude larger electrogenicities of last components (N, PR′, and PR) must correspond to charge shifts mainly from proton motion. In the photocycle of bacteriorhodopsin, the last intermediates of the photocycle (N, O, and BR) have the largest electrogenicities (Ludmann et al., 1998b), corresponding to those of N, PR′(O), and PR.
Energetic scheme of the photocycle
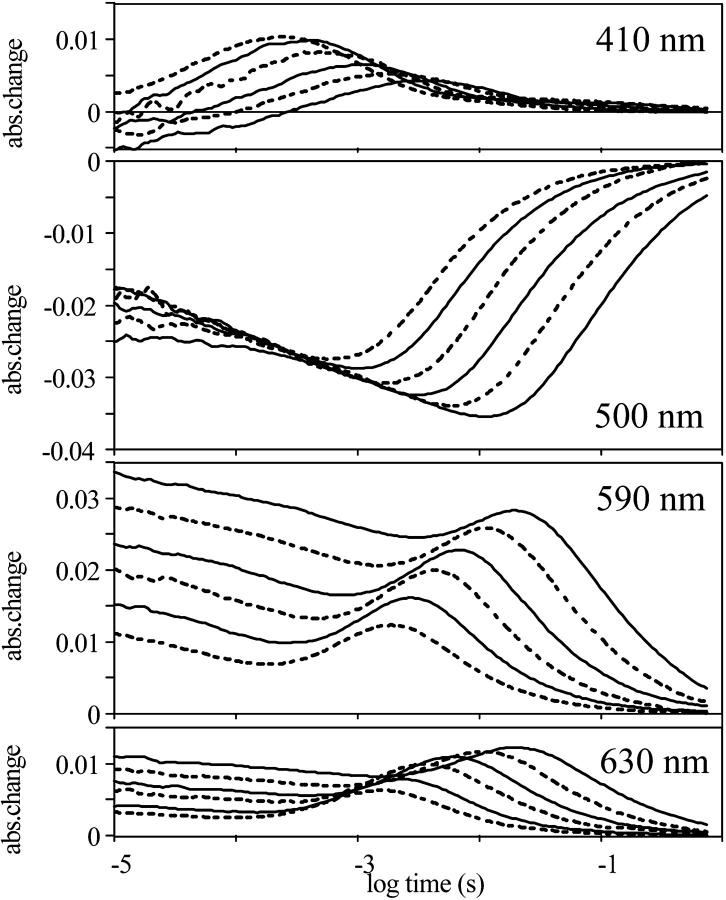
When the temperature of the sample was decreased from 30°C to 5°C the photocycle became slower by more than an order of magnitude (Fig. 6). The equilibria between the intermediates shifted, resulting in the depletion of the M intermediates and increased concentrations of K and N during the photocycle (Fig. 6).
FIGURE 6.
Absorption kinetic signals measured at different temperatures on proteorhodopsin. From right to left, the temperatures are 5, 10, 15, 20, 25, and 30°C. The other measuring conditions were the same as in Fig. 1.
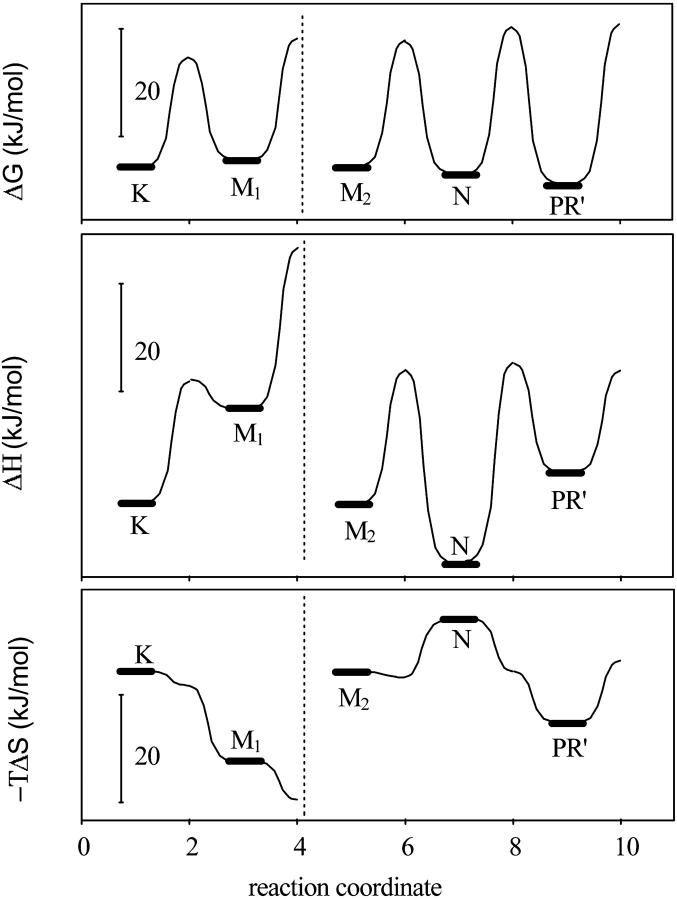
The Eyring plots of the rate constants (ln k versus 1/T) calculated from the model containing sequential reversible reactions were linear within an error of less then 2% (not shown). In the case of the models containing branches or parallel reaction paths, the deviation from the linearity of the Eyring plots for several rate constants exceeded 20%, the reason that these models were discarded. The thermodynamic parameters calculated from these plots produced energetic schemes for the photocycle (Fig. 7). The M1 to M2 was unidirectional, which leaves the energy level of M2 undetermined. This is indicated by the broken line (Fig. 7) and the level of M2 is arbitrarily put to the same value as that of K. The free energy levels of the K and M1 or that of M2, N, and PR′ have almost the same value, resulting in a nearly level equilibrium between these intermediates. Inasmuch as there is no information about the middle of the photocycle, the K to M1 and the N to PR′ transitions are entropy-driven. Intermediate N is in a rather deep enthalpy well, and that is the reason its accumulation increases with decreasing temperature (Fig. 6).
FIGURE 7.
Free energy, enthalpy, and entropic energy diagrams of the proteorhodopsin photocycle.
The study of the PR photocycle revealed the existence of three spectrally and five kinetically distinguishable intermediates, which showed striking similarities to those of BR. Based on the electric signal measurement the electrogenicity of the intermediates were calculated. The electrogenicities of the late intermediates were large. The temperature-dependence of the time-resolved absorption kinetic signals allowed the calculation of the energetic diagram of the photocycle.
Acknowledgments
We are grateful to J.L. Spudich for the cloned proteorhodopsin.
The National Institutes of Health (Grant GM29498) and National Science Research Fund of Hungary (Grant OTKA T034788) supported this work.
Leonid S. Brown's present address is Dept. of Physics, University of Guelph, ON N1G 2W1, Canada.
References
- Beja, O., L. Aravind, E. V. Koonin, T. Suzuki, A. Hadd, L. P. Nguyen, S. B. Jovanovich, C. M. Gates, R. A. Feldman, J. L. Spudich, E. N. Spudich, and E. F. DeLong. 2000. Bacterial rhodopsin: evidence for a new type of phototrophy in the sea. Science. 289:1902–1906. [DOI] [PubMed] [Google Scholar]
- Beja, O., E. N. Spudich, J. L. Spudich, M. Leclerc, and E. F. DeLong. 2001. Proteorhodopsin phototrophy in the ocean. Nature. 411:786–789. [DOI] [PubMed] [Google Scholar]
- Dér, A., P. Hargittai, and J. Simon. 1985. Time-resolved photoelectric and absorption signals from oriented purple membranes immobilized in gel. J. Biochem. Biophys. Methods. 10:295–300. [DOI] [PubMed] [Google Scholar]
- Dioumaev, A. K., L. S. Brown, J. Shih, E. N. Spudich, J. L. Spudich, and J. K. Lanyi. 2002. Proton transfers in the photochemical reaction cycle of proteorhodopsin. Biochemistry. 41:5348–5358. [DOI] [PubMed] [Google Scholar]
- Gergely, C., C. Ganea, G. I. Groma, and G. Váró. 1993. Study of the photocycle and charge motions of the bacteriorhodopsin mutant D96N. Biophys. J. 65:2478–2483. [DOI] [PMC free article] [PubMed] [Google Scholar]
- Gergely, C., L. Zimányi, and G. Váró. 1997. Bacteriorhodopsin intermediate spectra determined over a wide pH range. J. Phys. Chem. B. 101:9390–9395. [Google Scholar]
- Golub, G., and W. Kahan. 1992. Calculating the singular values and pseudo-inverse of a matrix. SIAM J. Num. Anal. 2:205–224. [Google Scholar]
- Kulcsár, A., G. I. Groma, J. K. Lanyi, and G. Váró. 2000. Characterization of the proton transporting photocycle of pharaonis halorhodopsin. Biophys. J. 79:2705–2713. [DOI] [PMC free article] [PubMed] [Google Scholar]
- Ludmann, K., C. Gergely, A. Dér, and G. Váró. 1998b. Electric signals during the bacteriorhodopsin photocycle, determined over a wide pH range. Biophys. J. 75:3120–3126. [DOI] [PMC free article] [PubMed] [Google Scholar]
- Ludmann, K., C. Gergely, and G. Váró. 1998a. Kinetic and thermodynamic study of the bacteriorhodopsin photocycle over a wide pH range. Biophys. J. 75:3110–3119. [DOI] [PMC free article] [PubMed] [Google Scholar]
- Ludmann, K., G. Ibron, J. K. Lanyi, and G. Váró. 2000. Charge motions during the photocycle of pharaonis halorhodopsin. Biophys. J. 78:959–966. [DOI] [PMC free article] [PubMed] [Google Scholar]
- Mowery, P. C., R. H. Lozier, Q. Chae, Y. W. Tseng, M. Taylor, and W. Stoeckenius. 1979. Effect of acid pH on the absorption spectra and photoreactions of bacteriorhodopsin. Biochemistry. 18:4100–4107. [DOI] [PubMed] [Google Scholar]
- Spudich, J. L., C. S. Yang, K. H. Jung, and E. N. Spudich. 2000. Retinylidene proteins: structures and functions from archea to humans. Annu. Rev. Cell Dev. Biol. 16:365–392. [DOI] [PubMed] [Google Scholar]
- Váró, G., and J. K. Lanyi. 1991. Thermodynamics and energy coupling in the bacteriorhodopsin photocycle. Biochemistry. 30:5016–5022. [DOI] [PubMed] [Google Scholar]
- Váró, G., R. Needleman, and J. K. Lanyi. 1995a. Light-driven chloride ion transport by Halorhodopsin from Natronobacterium pharaonis. 2. Chloride release and uptake, protein conformation change, and thermodynamics. Biochemistry. 34:14500–14507. [DOI] [PubMed] [Google Scholar]
- Váró, G., L. S. Brown, N. Sasaki, H. Kandori, A. Maeda, R. Needleman, and J. K. Lanyi. 1995b. Light-driven chloride ion transport by halorhodopsin from Natronobacterium pharaonis. 1. The photochemical cycle. Biochemistry. 34:14490–14499. [DOI] [PubMed] [Google Scholar]
- Váró, G., L. Zimányi, X. Fan, L. Sun, R. Needleman, and J. K. Lanyi. 1995c. Photocycle of halorhodopsin from Halobacterium salinarium. Biophys. J. 68:2062–2072. [DOI] [PMC free article] [PubMed] [Google Scholar]
- Zimányi, L., L. Keszthelyi, and J. K. Lanyi. 1989. Transient spectroscopy of bacterial rhodopsins with optical multichannel analyser. 1. Comparison of the photocycles of bacteriorhodopsin and halorhodopsin. Biochemistry. 28:5165–5172. [DOI] [PubMed] [Google Scholar]
- Zimányi, L., and J. K. Lanyi. 1993. Deriving the intermediate spectra and photocycle kinetics from time-resolved difference spectra of bacteriorhodopsin. Biophys. J. 64:240–251. [DOI] [PMC free article] [PubMed] [Google Scholar]


