

Abstract
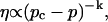
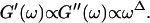
We have studied the structural and viscoelastic properties of assembling networks of the extracellular matrix protein type-I collagen by means of phase contrast microscopy and rotating disk rheometry. The initial stage of the assembly is a nucleation process of collagen monomers associating to randomly distributed branched clusters with extensions of several microns. Eventually a sol-gel transition takes place, which is due to the interconnection of these clusters. We analyzed this transition in terms of percolation theory. The viscoelastic parameters (storage modulus G′ and loss modulus G″) were measured as a function of time for five different frequencies ranging from ω = 0.2 rad/s to 6.9 rad/s. We found that at the gel point both G′ and G″ obey a scaling law 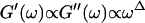 , with the critical exponent Δ = 0.7 and a critical loss angle
 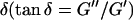 being independent of frequency as predicted by percolation theory. Gelation of collagen thus represents a second order phase transition.
INTRODUCTION
Connective tissues of multicellular organisms are composed of cells surrounded by complex microenvironments termed extracellular matrices (ECMs). The ECM consists of proteins, polysaccharides, hybrid molecules known as proteoglycans, and occasionally minerals, all in a highly hydrated state (see Comper (1996) for reviews). The most abundant protein of the ECM is type-I collagen, a rodlike triple helical protein that undergoes assembly into macromolecular fibrils, which in turn associate to form fibers and fiber bundles (Veis and George, 1994). Fibrillogenesis is both thermodynamically spontaneous and endothermic, being driven by the increase in entropy associated with loss of water from the bound monomers (Parkinson et al., 1995).
As type-I collagen fibers grow in width and length, they are capable of becoming organized into extensive parallel arrays, as in tendons and ligaments, or regular sheets, in which fiber orientation changes abruptly from layer to layer, as in bone, or most dramatically, in the transparent cornea of the eye (Bouligand, 1972; Ham and Cormack, 1987; Hay, 1991; Giraud-Guille, 1996). More typically however, type-I collagen fibers become randomly arranged, constituting an isotropic structural network in the so-called irregular connective tissues (Cleary, 1996; Veis, 1996). Because fibrillar collagens are secreted by fibroblasts and other connective tissue cells, the composition of the matrix is determined by these cells. Once secreted, however, the organization of the ECM is determined by the physical properties of the molecules that form these structures and their mutual interaction.
The self-assembly of type-I collagen has been studied extensively both in vitro (Comper and Veis, 1977a,b; Veis and George, 1994; Brightman et al., 2000) and in situ (Birk et al., 1988). Previous studies have focused on kinetic or structural details but have made little attempt to use concepts from the physics of polymers to analyze the assembly process. This latter is complicated by the fact that spontaneous fibrillogenesis, such as occurs in collagen solutions, is accompanied by a gelation transition. Because this transition may have biological consequences (just as it does in cross-linked actin cytoskeleton) it is important to understand the conditions under which it takes place.
The present work had the goal of clarifying the mechanism of gelation in the process of collagen self-assembly. Are there features of this process specific to the particular biological material or does this gelation transition belong to the same universality class observed in nonbiological systems, and which have been described in terms of percolation theory (Brinker and Scherer, 1990; Sahimi, 1994)?
The understanding of phase reorganization within collagen assemblies has relevance to tissue morphogenesis, including embryonic development and wound healing (Newman and Tomasek, 1996), as well as the engineering of tissue substitutes (Nerem and Seliktar, 2001). In the course of embryonic development the phase separation of extracellular matrix regions with distinct physical properties provides a possible mechanism for the segregation of distinct mesenchymal tissues, as phase separation based on differential adhesion does for epithelioid tissues (Steinberg and Poole, 1982). The reorganization of the intracellular cytoskeletal actin network into gel and sol regions depending on cell function (movement, cytokinesis, etc.) shows that living systems can exploit the phase transitions in polymer networks for functional purposes. It is reasonable to expect that similar correlation can be found between the biological function of collagen (and more generally ECM) assemblies and the gelation transition that takes place within them.
Earlier work has shown that model collagen matrices containing cells or cell-sized polystyrene latex particles undergo phase separation from similar matrices lacking such particles, leading to the phenomenon of matrix-driven translocation (MDT) (Newman et al., 1985; Forgacs and Newman, 1994). Because the presence of particles influences the rate of collagen fibrillogenesis (Newman et al., 1997), we were motivated to characterize this assembly process at high resolution as a basis for further investigation of the physical mechanism of MDT.
To gain more detailed insight into the process of collagen gelation under nonequilibrium conditions, and to explore the time evolution of viscoelastic behavior during self-assembly, we measured the viscoelastic moduli of self-assembling collagen networks by torsional rheometry. To relate the buildup of elastic behavior to the microstructure of the network we followed the nucleation and growth process of collagen assemblies by phase contrast microscopy.
Our measurements confirm and extend the results of earlier studies (Newman et al., 1997) and provide additional detailed information on the gelation transition in assembling type-I collagen. We find that during the initial phase of collagen self assembly, rodlike filaments appear at random sites that grow rapidly into elongated clusters exhibiting fanlike protrusions at both ends. This initial growth phase is reflected in an increasing viscosity. The clusters grow in size by elongation of the single filaments at both ends and by lateral association of new filaments, and eventually interconnect. Although the onset of this state cannot be visualized clearly by phase contrast microscopy, the appearance of elastic behavior clearly demonstrates the steric entanglement and interconnection of the clusters.
By measuring the time evolution of the complex viscoelastic impedance, 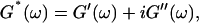 we obtained the frequency dependence of the storage modulus
  and loss modulus
  (or the viscosity
 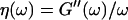 ) as a function of time. This allowed us to analyze collagen assembly in terms of existing theories of gelation, in particular the percolation theory of branched networks by Durand et al. (1987). We also determined the critical loss angle
  at the sol-gel transition point, which characterizes the time evolution of
 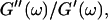 the ratio of the viscosity to the elastic modulus, in a quantitative fashion.
The present work demonstrates the value of rheology as a sensitive tool for evaluating the dynamics of collagen assembly under nonequilibrium conditions, in particular close to the gelation point where microscopic studies cannot provide quantitative characterization of the cross-linking process and where light scattering studies are not applicable because of the large size (several micrometers) of the percolating clusters. Moreover, our results demonstrate that gelation of native type-I collagen is a second order phase transition that can be described by percolation theory.
MATERIALS AND METHODS
Sample preparation
Type-I collagen was extracted from the tails of young adult rats with 3% acetic acid, as described elsewhere (Elsdale and Bard, 1972; Newman et al., 1985). Collagen solutions were prepared in a standard tissue culture medium (Ham's F-12) under conditions previously shown to lead to fibril morphology identical to that in living tissues (Elsdale and Bard, 1972). The acetic acid extract was adjusted to a protein concentration of 3–5 mg/ml and dialyzed for two days against two changes of 1/10 strength Ham's F-12 medium without bicarbonate (Gibco-BRL, Grand Island, NY). Gelation was induced by bringing the solution to full strength Ham's F-12 in the following fashion: to 0.7 ml of dialyzed collagen solution on ice was added in succession, with rapid mixing, 0.1 ml 9.3× Ham's F-12, 0.1-ml distilled water, and 0.1-ml sodium bicarbonate (11.76 mg/ml). This, in turn was rapidly mixed with 1 ml of complete Ham's F-12. The collagen solutions were kept on ice until being transferred to the microrheometer as described below.
Structural studies of collagen gels
Samples for structural studies were prepared as follows: The collagen solution was injected into a sample chamber consisting of two horizontal, parallel cover slips separated by a distance of 2 mm. The chamber was kept at 12°C. Light microscopy images were taken using an Axiovert 100 inverted microscope (Carl Zeiss, Jena, Germany) equipped with an Achrostigmat 20×/0.3 LD Ph1 and a Plan-Neofluar 100×/1.3 Oil Ph3 lens. The specimens were observed in phase contrast mode. All micrographs were recorded with a standard CCD camera (C5403, Hamamatsu Photonics, Hamamatsu City, Japan) and stored on SVHS video tape. For further analysis, images were first digitized using a Macintosh 9500 computer (Apple Computer, Cupertino, CA) equipped with a Scion LG3 frame grabber card (Scion Corporation, Frederick, MD) and subsequently analyzed and processed with the public domain image processing program NIH Image 1.60 (National Institutes of Health, Bethesda, MD). To reduce noise, first the final image was obtained by averaging over 20 consecutive images. Subsequently, a ranking filter (median mode) was applied. Finally, shadowing was used to improve the visibility of details.
Measurement of viscoelastic properties
Details on the rotating disk rheometer have been described by Müller et al. 1991. Briefly, the rheometer consists of a cylindrical cuvette with an inner diameter of 15 mm and a volume of ∼1.5 ml. The base of the cuvette is mounted in an aluminum thermostated holder. A silanized glass disk with a diameter of 8 mm is placed on the surface of the sample. Mounted on top of the disk are a magnet and deflection mirror with dimensions of 0.5 × 0.5 × 1.0 mm and 1.5 × 2.0 mm, respectively. The cuvette is surrounded by two perpendicularly oriented pairs of magnetic coils. One of these pairs provides a static magnetic field to fix the orientation of the disk. The other pair of coils is driven by a sinusoidally varying voltage of frequency ω to apply an oscillatory shear stress to the sample by means of the silanized glass disk. To improve its sensitivity, the rheometer is shielded from external magnetic fields (e.g., magnetic field of the earth) by a cage of high magnetic permeability metal (Vakuumschmelze Hanau, Hanau, Germany). The rotational amplitude of the disk is analyzed as follows: the beam of a He-Ne-laser is deflected by the mirror on top of the glass disk, and its position is detected by a position-sensitive photodiode; the resulting signal is amplified and evaluated by a computer; finally, the viscoelastic moduli are determined from the phase shift angle ϕ between the applied oscillatory torque and the rotational oscillation of the glass disk and the ratio of their amplitudes.
An aliquot of 400 μl was transferred into the measuring chamber. Four minutes after transfer the measurement was started at a fixed frequency ω. A value of  and
and  was measured every 45 s to determine their time evolution,
  and
and  For each studied frequency, a new sample was prepared and the same protocol was applied. In this way it was also possible to determine the frequency-dependent impedance spectra,
  and
and  for consecutive times t. If required, the viscoelastic moduli at intermediate times were obtained by interpolating the measured data points by means of cubic spline functions.
Analysis of data using of percolation theory
Experimental results for the viscoelastic quantities were analyzed using percolation theory (De Gennes, 1988; Stauffer and Aharony, 1992; Sahimi, 1994). This theory stipulates that gelation in a filamentous macromolecular system is due to the gradual interconnection of growing fibers. The state of the network is characterized by the fraction, p, of connections formed between fibers. For sufficiently small p, only isolated clusters exist. However, above a threshold value of the fraction of connections, p = pc, the isolated clusters become interconnected and form a continuous network, which defines the sol-gel transition. Percolation theory predicts power law behavior for the macroscopic physical properties such as the elastic modulus or viscosity in the vicinity of the gelation point.
In particular, the power law for the static elastic modulus, 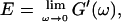 is
is
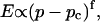 |
(1) |
which is valid ford  The corresponding power law for the zero-shear viscosity,
 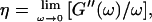 is
is
 |
(2) |
which holds for  The values of the constants f and k are either measured or determined theoretically, in which case they depend on the specific model used to describe gelation (Brinker and Scherer, 1990; Sahimi, 1994).
Gelation, as induced here is a time-dependent phenomenon (see above), as opposed to sol-gel transitions driven by changes in temperature or pH. Its analysis in terms of percolation theory as described above is based on the assumption that the extent of bond formation between fibers, characterized by the parameter p, is linear in time, i.e., p ∼ t. Such an assumption in the case of rapidly gelling collagen is questionable (see below). To avoid the use of this assumption, we resorted to the more general method of Durand et al. (1987), which considers directly the scaling properties of the complex viscoelastic modulus in the vicinity of the percolation transition. (The method of Durand et al. is based on the proposal by De Gennes (1988), according to which the complex modulus is expected to obey the same scaling behavior as the AC conductivity of resistor-capacitor random mixture.) The complex viscoelastic modulus,  can be expressed in the vicinity of the gel point as (Clerc et al., 1990)
 |
(3) |
Equation 3 thus predicts identical scaling laws for  and
and  at the gel point:
 |
(4) |
Furthermore, from Eq. 3 it also follows that at the gel point the critical loss angle  (δ is defined as
 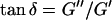 ) is related to the exponent Δ by
 |
(5) |
De Gennes' theory relates D to the critical exponents f and k,  Thus the value of
  does not depend on the frequency, a result also obtained partly by different reasoning (Chambon and Winter, 1987; Martin et al., 1989; Rubinstein et al., 1989).
RESULTS
Structural studies by phase contrast microscopy
The growth of collagen fibers and clusters as well as the structure of these clusters and the resulting network was observed by video microscopy in phase contrast mode. The result is shown in Fig. 1 for collagen solutions with protein concentration c = 1.7 mg/ml. During the first four minutes only a few small fibers and clusters could be observed. Therefore the focal plane of the microscope was varied until an accidentally observed object had its greatest extension in that plane. This object was then followed for an extended period of time by keeping the focal plane constant.
FIGURE 1.
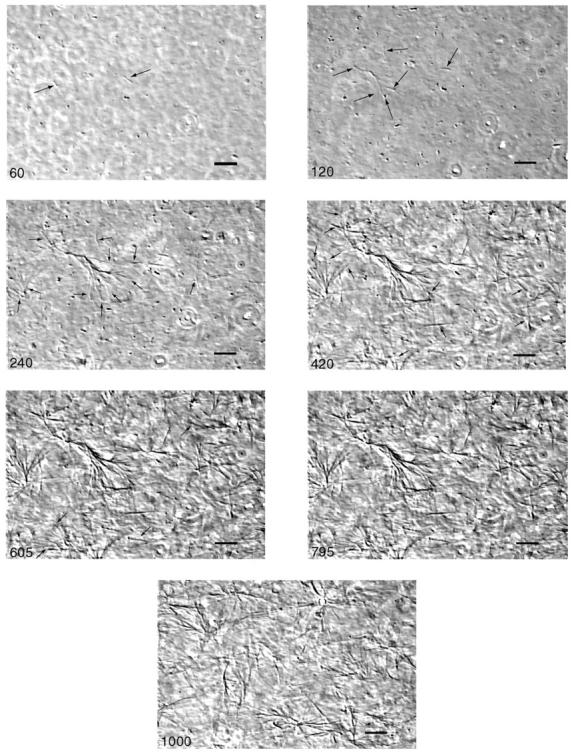
Time series of phase contrast micrographs of a collagen solution (c = 1.7 mg/ml) at T = 12°C. The scale bar at the lower right corresponds to 20 μm. Numbers in the left lower corners denote time in seconds. During the first four minutes the focal plane was slightly varied to maintain an observed small filament in focus, then it was kept constant. A branched structure of the fibers appears after 60 s (indicated by arrows in the second panel, 120 s). Between 120 s and 420 s the original filament on the left of the first panel (60 s) grows and more clusters of filaments appear at various places. The branched bundles of filaments start to intersect at 605 s. After this time the structure of the network does not change rapidly anymore. Thus there is nearly no difference between the images at 605 s and 795 s. The last panel shows the network at another site after 1000 s of polymerization. Note the nearly homogenous distribution of partly interconnected clusters.
Images of samples up to 795 s show clusters emerging de novo at six different times in the same vicinity, whereas the image at 1000 s exhibits the structure of the network at a different site. Although no fibers or clusters could be seen during the first 60 s, by the end of this period the first barely visible fibers appeared. Their contour length was of the order of several micrometers and their diameter was ∼1 μm (see arrows). After another minute (120 s) the left bundlelike structure (indicated by arrows) has grown significantly to a length of ∼50 micrometers. (Note that the focal plane was slightly changed to adjust the focus.) Already at this early stage of self-assembly the organization of collagen into branched structures is evident (see arrows). After 240 s the observed fiber has dramatically grown to a contour length of ∼100 micrometers, and further branching occurred (see arrows). Numerous single fibers and poorly visible clusters appear in the focal plane, indicated by arrows. After 420 s the phase contrast of the first single fibers has enhanced and the newly developed clusters appear more pronounced. Again, additional single fibers can be observed (see arrows). This process continues during the following three minutes (see image at 605 s). The state of the sample at 795 s seems to be only slightly different from that at 605 s. However, by this time a more homogeneous assembly of randomly distributed branched clusters has formed, and the clusters are partly interconnected. This is more clearly demonstrated by the image at 1000 s of polymerization, which shows the structure of the network at a different site.
Rheometry
The viscoelastic parameters G′ and G″ were determined as a function of time, t, as  and
and  for five different frequencies, ω, varying from 0.2 rad/s to 6.9 rad/s (Fig. 2). From these data the time-evolution of the viscoelastic moduli
  and
and  as a function of frequency was obtained, as described in the Materials and Methods section.
FIGURE 2.

Time dependence of the viscoelastic moduli  and
and  (c = 1.7 mg/ml) during gelation at T = 12°C recorded for five different frequencies. The point where
  and
and  intersect is shifted to later times with increasing frequency. For higher frequencies nonvanishing values of
  occur at earlier times than for lower frequencies.
Fig. 2 shows the time-dependence of  and
and  for five different frequencies. The storage modulus
  and loss modulus
  exhibit the same qualitative behavior for all five frequencies. During the first minutes there is a lag phase, in which the sample behaves like a Newtonian liquid, because
  remains approximately zero, whereas
  starts with a finite value, which remains nearly constant for the first seven minutes. This constant value of
  is determined by the Newtonian viscosity of the sample, which is roughly 10-fold higher than that of water. After 7 min,
  starts to increase with time. At around 10 min,
  increases suddenly from a near zero value to a finite value indicating that the collagen solution has become a viscoelastic body. At later times both storage and loss moduli increase further, but this occurs for the storage modulus at a greater rate than for the loss modulus. For all frequencies the curves of
  and
and  intersect shortly after 10 min, with the curves tending to intersect at later times with increasing frequencies. The occurrence of nonvanishing values of
  is shifted to earlier times with increasing frequencies. Interestingly, similar behavior was observed for solutions of gelatin, which is the denatured counterpart of the type-I collagen used here (Djabourov et al., 1988). Note that for all frequencies the values of
  and
and  reached at the end of the measurement are comparable. Fig. 3 shows the viscoelastic impedance spectra,
  and
and  at different times after sample preparation. At 240 s the sample still behaved as a Newtonian liquid, i.e., the loss modulus scales linearly with frequency and there was no detectable value of the storage modulus. Three minutes later, at 420 s, all the values of
  have slightly grown and the slope of the
  vs. ω plot has slightly decreased, whereas
  is still zero. After an additional three minutes (605 s), nonvanishing
  values occur for all frequencies for the first time and the slope (determined by a nonlinear least square fit) of the
  vs. ω plot decreases from 1 to 0.74, indicating that the sample has become viscoelastic. Although for times shorter than 630 s
  holds, the opposite is true at longer times.
FIGURE 3.
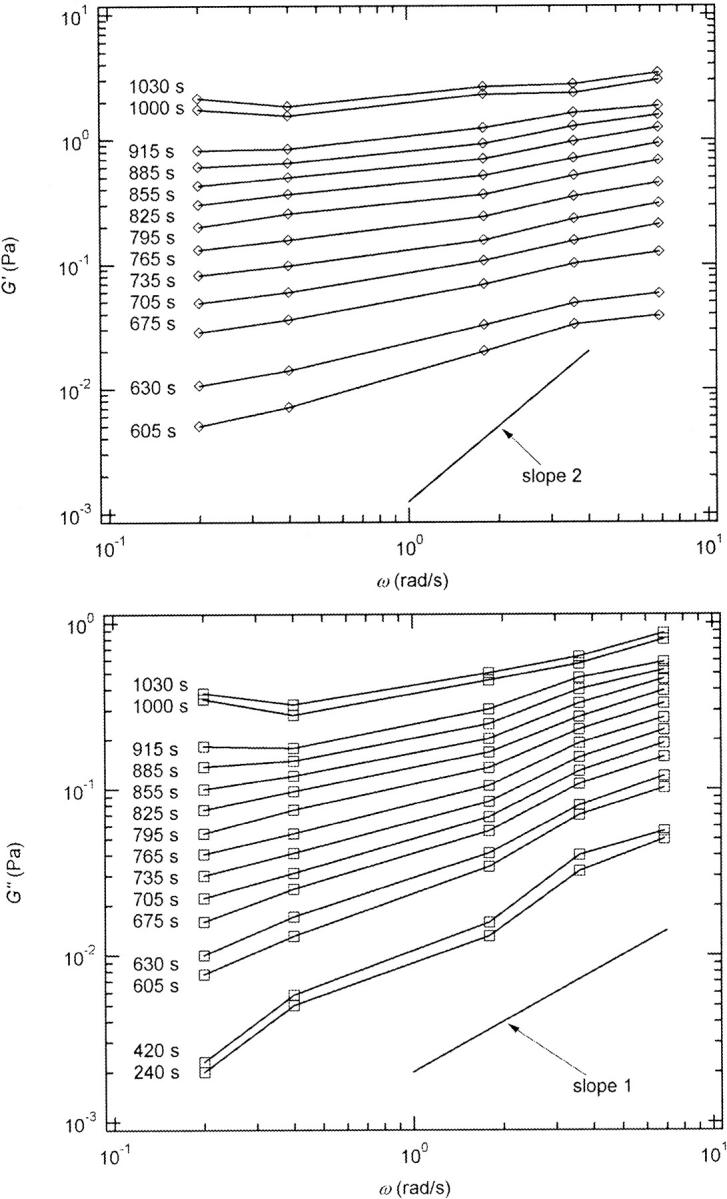
Viscoelastic impedance spectra  and
and  (c = 1.7 mg/ml) at T = 12°C for different times after the start of polymerization. The straight lines at the bottom represent the scaling laws of
  and
and  for the Maxwell model.
The results in Figs. 2 and 3 show the expected behavior of viscoelastic parameters as a function of time or frequency as the sol with purely liquid characteristics gradually transforms into a gel with elastic properties (Brinker and Scherer, 1990).
The effect of temperature on the gelation process is shown in Fig. 4 for one selected frequency, ω = 6.9 rad/s. Both  and
and  are plotted as a function of time for two different temperatures, T = 12°C and T = 10°C. Whereas at T = 12°C the first nonvanishing value of
  occurred at ∼9 min, there was a 5-min delay in this occurrence at T = 10°C. Similar delay was observed at other frequencies and also in the intersection of
  and
and  which occurred at ∼12 min for T = 12°C and at ∼18 min for T = 10°C. This observation confirms the well-known temperature sensitivity of the collagen gelation process (Veis and George, 1994).
FIGURE 4.

Temperature dependence of collagen gelation (c = 1.7 mg/ml). The viscoelastic parameters  and
and  are shown at two different temperatures, T = 10°C and T = 12°C. The small temperature difference of 2°C causes a delay in gelation of ∼5 min, which is half the gelation time at T = 12°C.
Finally, we checked the reproducibility of our data for selected frequencies. Fig. 5 shows the results of measurements performed on five consecutive days with different samples. As indicated by Fig. 5, data sets obtained on the same day typically agree within 20%. Reproducibility is more difficult in the case of G′ because once this quantity is different from zero it increases rapidly, which magnifies small differences in the initial preparations. (Note that each frequency run required the preparation of a new sample as described in Materials and Methods.) The discrepancy between the experimental values obtained for the same frequency increases with increasing time difference between the preparation of the collagen stock-solution and the measurement, despite storage of the collagen at low temperatures, T = 4°C.
FIGURE 5.

Reproducibility of the viscoelastic parameters in dependence on the period of time between sample preparation and measurement for two selected frequencies (c = 1.7 mg/ml). (Upper panel): ω = 3.6 rad/s. (Lower panel): ω = 0.4. rad/s. Open symbols denote G′; closed symbols denote G″. Measurements performed on the same day result in similar values, whereas for different days the discrepancy between the results increases with increasing period of time.
DISCUSSION
We have studied the self-assembly of collagen fibers and the structure of the resulting networks by video phase contrast microscopy. Complementary to this microscopic approach we studied the self-assembly process by measurements of the frequency-dependent viscoelastic moduli of the collagen solutions in the sol and gel states, and during the sol-gel-transition. The probed frequency range, 0.2 rad/s ≤ ω ≤ 6.9 rad/s, corresponds to shear wavelengths varying from ∼2 mm to 300 μm (Landau and Lifshitz, 1978). Thus at higher frequencies the viscoelastic properties are probed on a spatial scale comparable to the diameter of the largest clusters. As a consequence, elastic properties of single clusters are mainly measured at these frequencies, although for smaller frequencies (i.e., larger wavelengths) the viscous flow of a distribution of suspended clusters is measured. Elastic behavior therefore occurs at an earlier time for high frequencies than for low frequencies. Although all rheological experiments were performed after a lag phase of four minutes, the microscopic approach allowed us to observe the gelation process during the initial stage. A closer inspection of the micrographs of Fig. 1 and of the rheological data of Fig. 2 shows that during the first seven minutes gelation is initiated by spontaneous formation of branched fibers. These form nuclei, which grow rapidly into extended but isolated clusters. During this time the sample behaves as a purely viscous liquid with nearly constant viscosity. This follows from the vanishing storage modulus,  and the nearly linear variation of the loss modulus with frequency,
After 10 min, a nonvanishing storage modulus is observed, which is smaller than the loss modulus. Simultaneously, the loss modulus starts to increase, and its frequency dependence follows a scaling law  instead of
  This indicates that at this point the randomly formed branched fibers start to entangle and interconnect, resulting in a finite elastic behavior. Nonetheless, the sample behaves more like a liquid, because the viscous behavior is still dominant
  For comparison, the scaling laws
  and
and  expected for the simplest model of a viscoelastic liquid, the Maxwell model (Fung, 1993), have been included in Fig. 3. Although at early times the scaling law for the loss modulus agrees well with the experimental result, this is clearly not the case for the storage modulus. Instead of a quadratic variation with frequency we find an exponent of 0.69. This discrepancy might be due to the more complex nature of collagen solutions, which may not be well represented by the simple Maxwell model. Both moduli increase continuously with time, but because
  grows significantly faster than
 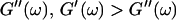 is valid for all times larger than 630 s. This shows that the collagen network becomes more and more entangled and interconnected, and thus more solidlike. Finally, at
  is nearly constant and about 10 times larger than
  Such behavior is characteristic for rubber elasticity (Ferry, 1970) indicating that collagen networks form a fully developed gel. This is confirmed by Fig. 1 (1000 s), which shows several well-developed branched clusters of filaments, which are connected with each other by cablelike fibers.
The micrographs in Fig. 1 show that gelation of collagen is due to the gradual interconnection of branched clusters formed at random sites. The gelation process thus has typical features of a percolation transition (see Materials and Methods).
Analysis of the results shown in Fig. 3 in terms of the percolation model shows that the sol-gel transition occurs at t = 605 s after initiating fibrillogenesis. The left panel in Fig. 6 shows a log-log plot of the frequency-dependence of the viscoelastic moduli,  and
and  at t = 605 s. A least-square fit yields Δ′ = 0.69 for
  and Δ″ = 0.74 for
  (The viscoelastic impedance spectra, as shown in Fig. 3, can be fit to a power law at several values of t, but only at t = 605 s are the exponents for
  and
and  the same.) In addition to Eq. 4, at the gel point the viscoelastic moduli have to also satisfy Eq. 5. The middle panel in Fig. 6 shows a Cole-Cole plot of
  and
and  i. e.,
  vs.
vs.  at t = 605 s. A linear behavior is observed, as indicated by the straight line, and from its slope a critical loss angle
  is derived, which results in Δ = 0.70. At the gel point the loss angle is expected to be independent of frequency. This condition is well-fulfilled; using the data in the right panel of Fig. 6 one obtains a value of
  which agrees well with the previous values of Δ. Similar values of Δ and
  have also been reported for various synthetic polymers (Durand et al., 1987; Sahimi 1994). For collagen, which is, in part, a chemical gel, the predicted values of
  and
and  (Sahimi, 1994) agree well with the measured value of Δ = 0.7.
FIGURE 6.

The viscoelastic parameters in the vicinity of the gel point at t = 605 s. (Left panel): The identical scaling laws of  and
and  with an exponent Δ = 0.7. (Middle panel): Cole-Cole plot of G″ as a function of G′. The slope corresponds to a critical loss angle
  which is equivalent to Δ = 0.7. (Right panel): The value of
  is independent of ω as expected for the gel point.
Different methods have been proposed to determine the gelation point. One of the earliest definitions (Tung and Dynes, 1982) proposed defining the gel point by the condition  which was later used by Djabourov et al. (1988) for gelatin solutions. According to this heuristic approach, the gel point is a function of the frequency applied to the system. The instant of gelation strictly depends on the material and its gelation kinetics, but should not depend on the frequency (except for the nonlinear regime, where breakage of filaments and cross-links can occur). The condition
  leads to Δ = 0.5, which is generally not observed (except for the particular case of an excess of cross-linkers (Winter and Chambon, 1986)). Besides requiring the same scaling exponent Δ for
  and
and  at the gel point, the method of Durand et al. (1987) provides the additional condition
  to identify the gel point in an unambiguous way.
The structural properties of the collagen dispersions close to the gel point are shown in Fig. 1, for t = 605 s. It is somewhat surprising that the structure observed at t = 780 s shows nearly no difference from that found at t = 605 s, despite the fact that  increases by a factor of 100. However, in the vicinity of the sol-gel transition there exist large clusters, which are very close to one another. At this point a relatively low concentration of collagen fibers (which might be difficult to see in the microscope) already suffice to make the system completely interconnected.
It is notable that a temperature decrease of as little as 2°C (from T = 12°C) causes a delay in gelation of ∼5 min, which corresponds to half the gelation time at T = 12°C (Fig. 4). This temperature sensitivity may also affect the reproducibility of the data, as shown in Fig. 5. Although the collagen stock solution was stored at T = 4°C, slow formation of microfibrils, which accumulate in the course of several days, evidently occurs (see also Newman et al. (1997)). This could explain the evident tendency for the values of the viscoelastic moduli to increase with time (i.e., on successive days), whereas measurements performed on the same day agree well.
Some earlier rheometric studies were performed on the collagen-derived material known as gelatin (derived from type-I collagen by irreversibly denaturing its triple helix into coiled single strands; e.g., Djabourov and Papon, 1983; Djabourov et al., 1988), which is distinct from the protein considered here. Gel formation in gelatin is triggered by lowering the temperature, thus it represents a reversible process, results in a physical gel, and is accompanied by the partial reannealing of the triple helices through the local association of three different chains. Despite a partial recovery of the triple helical structure gelatin is not able to undergo any further assembly process such as fibrillogenesis. The resulting network thus cannot be studied by optical microscopy; to make it visible it is necessary to resort to electron microscopy. In the native type-I collagen gels described in this study the collagen triple helices remain intact throughout. The fibrils and macroscopic fibers that assemble from them show the 64 nm banding structure characteristic of collagen assembled in vivo (Elsdale and Bard, 1972) and in general are more similar to their in vivo counterparts than fibers formed from pepsin-solubilized collagens typically used in tissue engineering application (McPherson et al., 1985).
We have demonstrated that similarly to the intracellular networks of protein fibers formed by actin (MacKintosh and Janmey, 1997) and tubulin (Nedelec et al., 1997) collagen assembly under nonequilibrium conditions can be studied with high sensitivity by evaluating the time evolution of the viscoelastic impedance. As with the cytoskeletal networks, rheology thus provides a valuable tool for studying networks composed of micrometer-scale clusters, where light scattering studies fail. Also, similarly to the heterogeneous networks of the cytoskeleton the time evolution of the viscoelastic moduli can be rather well described by the percolation model of gelation (Tempel et al., 1996). Like the so-called micro-gel states seen during the sol-gel transitions of actin (Tempel et al., 1996) the collagen networks described here also exhibit astonishingly large elastic moduli despite the presence of large voids.
Although actin gels are known to be subject to reversible and dynamic reorganization of their physical state by an array of helper proteins such as severing, monomer-sequestering, and cross-linking proteins, analogous phenomena in collagen gels (possibly involving matrix remodeling enzymes (Van den Steen et al., 2001) and the so-called unconventional collagens (Van der Rest et al., 2000)) are less well-understood. However, the heterogeneous structure of the gel may facilitate such rearrangements through, for example, cleavage by collagenase, because only a small fraction of bonds has to be cleaved to achieve a gel-sol transition. Moreover, as suggested by earlier studies (Newman et al., 1985; 1997) and work in progress, the presence of cells or cell-sized particles with appropriate surface characteristics can also induce marked changes in the viscoelastic properties of assembling collagen matrices.
Acknowledgments
We thank M.A. Dichtl, K. Kroy, and R. Merkel for valuable suggestions and stimulating discussions.
This work was supported by the Deutsche Forschungsgemeinschaft (Sa. 246/22-4, a group grant SFB 266), the Fonds der Chemischen Industrie, and grants from the National Science Foundation to G.F. (IBN-97100010) and S.A.N. (IBN-9603838).
References
- Birk, D. E., J. M. Fitch, J. P. Babiarz, and T. F. Linsenmayer. 1988. Collagen type I and type V are present in the same fibril in the avian corneal stroma. J. Cell Biol. 106:999–1008. [DOI] [PMC free article] [PubMed] [Google Scholar]
- Bouligand, Y. 1972. Twisted fibrous arrangements in biological materials and cholesteric mesophases. Tissue Cell. 4:189–217. [DOI] [PubMed] [Google Scholar]
- Brightman, A. O., B. P. Rajwa, J. E. Sturgis, M. E. McCallister, J. P. Robinson, and S. L. Voytik-Harbin. 2000. Time-lapse confocal reflection microscopy of collagen fibrillogenesis and extracellular matrix assembly in vitro. Biopolymers. 54:222–234. [DOI] [PubMed] [Google Scholar]
- Brinker, C. J., and G. W. Scherer. 1990. Sol-Gel Science. Academic Press, New York.
- Chambon, F., and H. H. Winter. 1987. Linear viscoelasticity at the gel point of a crosslinking PDMS with imbalanced stoichiometry. J. Rheol. 31:683–697. [Google Scholar]
- Clerc, J. P., G. Giraud, J. M. Laugier, and J. M. Luck. 1990. The AC electrical conductance of binary systems, percolation clusters, fractals and related models. Advan. Phys. 39:191–309. [Google Scholar]
- Cleary, E. G. 1996. Skin. In Extracellular Matrix. W. D. Comper, editor. Harwood Academic Publishers, Amsterdam. 77–109.
- Comper, W. D. 1996. Extracellular Matrix. (Two volumes). Harwood Academic Publishers, Amsterdam.
- Comper, W. D., and A. Veis. 1977a. Characterization of nuclei in in vitro collagen fibril formation. Biopolymers. 16:2133–2142. [DOI] [PubMed] [Google Scholar]
- Comper, W. D., and A. Veis. 1977b. The mechanism of nucleation for in vitro collagen fibril formation. Biopolymers. 16:2113–2131. [DOI] [PubMed] [Google Scholar]
- De Gennes, P. G. 1988. Scaling Concepts in Polymer Physics. Cornell University Press, Ithaca.
- Djabourov, M., and P. Papon. 1983. Influence of thermal treatment on the structure and stability of gelatin gels. Polymer. 24:537–542. [Google Scholar]
- Djabourov, M., J. Leblon, and P. Papon. 1988. Gelation of aqueous gelatin solutions. II. Rheology of the sol-gel transition. J. Phys. (France). 49:333–343. [Google Scholar]
- Durand, D., M. Delsanti, M. Adam, and J. M. Luck. 1987. Frequency dependence of viscoelastic properties of branched polymers near gelation threshold. Europhys. Lett. 3:297–301. [Google Scholar]
- Elsdale, T., and J. Bard. 1972. Collagen substrata for studies on cell behavior. J. Cell Biol. 54:626–637. [DOI] [PMC free article] [PubMed] [Google Scholar]
- Ferry, J. D. 1970. Viscoelastic properties of polymers. Wiley, New York.
- Forgacs, G., and S. A. Newman. 1994. Phase transitions, interfaces, and morphogenesis in a network of protein fibers. Int. Rev. Cytol. 150:139–148. [DOI] [PubMed] [Google Scholar]
- Fung, Y. C. 1993. Biomechanics. Springer-Verlag, New York.
- Giraud-Guille, M. M. 1996. Twisted liquid crystalline supramolecular arrangements in morphogenesis. Int. Rev. Cytol. 166:59–101. [DOI] [PubMed] [Google Scholar]
- Ham, A. W., and D. H. Cormack. 1987. Ham's Histology. Lippincott, Philadelphia.
- Hay, E. D. 1991. Cell Biology of Extracellular Matrix. Plenum Press, New York.
- Landau, L. D., and E. M. Lifshitz. 1978. Fluid Mechanics. Pergamon Press, New York. p. 89.
- MacKintosh, F. C., and P. A. Janmey. 1997. Actin gels. Current Opinion in Solid State & Materials Science. 2:350–357. [Google Scholar]
- McPherson, J. M., D. G. Wallace, S. J. Sawamura, A. Conti, R. A. Condell, S. Wade, and K. A. Piez. 1985. Collagen fibrillogenesis in vitro: a characterization of fibril quality as a function of assembly conditions. Coll. Relat. Res. 5:119–135. [DOI] [PubMed] [Google Scholar]
- Martin, J. E., D. Adolf, and J. P. Wilcoxon. 1989. Rheology of the incipent gel: theory and data for epoxies. Polym. Prepr. Am. Chem. Soc. Div. Polym. Chem. 30:83–84. [Google Scholar]
- Müller O., H. E. Gaub, M. Barmann, and E. Sackman. 1991. Viscoelastic moduli of sterically and chemically cross-linked actin networks in the dilute to semi-dilute regime: measurements by an oscillating disc rheometer. Macromolecules 24:3110–3120. [Google Scholar]
- Nedelec, F., T. Surrey, A. Maggs, and S. Leibler. 1997. Self-organization of microtubules and motors. Nature. 389:305–308. [DOI] [PubMed] [Google Scholar]
- Nerem, R. M., and D. Seliktar. 2001. Vascular tissue engineering. Annu. Rev. Biomed. Eng. 3:225–243. [DOI] [PubMed] [Google Scholar]
- Newman, S., M. Cloître, C. Allain, G. Forgacs, and D. Beysens. 1997. Viscosity and elasticity during collagen assembly in vitro: relevance to matrix-driven translocation. Biopolymers. 41:337–347. [DOI] [PubMed] [Google Scholar]
- Newman, S. A., and J. J. Tomasek. 1996. Morphogenesis of connective tissues. In Extracellular Matrix. W. D. Comper, editor. Harwood Academic Publishers, Amsterdam. 335–369.
- Newman, S. A., D. A. Frenz, J. J. Tomasek, and D. D. Rabuzzi. 1985. Matrix-driven translocation of cells and nonliving particles. Science. 228:885–889. [DOI] [PubMed] [Google Scholar]
- Parkinson, J., K. E. Kadler, and A. Brass. 1995. Simple physical model of collagen fibrillogenesis based on diffusion limited aggregation. J. Mol. Biol. 247:823–831. [DOI] [PubMed] [Google Scholar]
- Rubinstein, M., R. H. Colby, and J. R. Gillmor. 1989. Dynamic scaling for polymer gelation. Polym. Prepr. Am. Chem. Soc. Div. Polym. Chem. 30:81–82. [Google Scholar]
- Sahimi, M. 1994. Applications of Percolation Theory. Taylor & Francis, London.
- Stauffer, D., and A. Aharony. 1992. Introduction to Percolation Theory. Taylor & Francis, London.
- Steinberg, M. S., and T. J. Poole. 1982. Liquid behavior of embryonic tissues. In Cell Behavior. R. Bellairs, A. Curtis, and G. Dunn, editors. Cambridge University Press, Cambridge. 583–607.
- Tempel, M., G. Isenberg, and E. Sackmann. 1996. Temperature-induced sol-gel transition and microgel formation in alpha-actinin cross-linked networks: a rheological study. Phys. Rev. E. 54:1802–1810. [DOI] [PubMed] [Google Scholar]
- Tung, C. Y. M., and P. J. Dynes. 1982. Relationship between viscoelastic properties and gelation in thermosetting systems. J. Appl. Polyml. Sci. 27:569–574. [Google Scholar]
- Van den Steen, P. E., G. Opdenakker, M. R. Wormald, R. A. Dwek, and P. M. Rudd. 2001. Matrix remodelling enzymes, the protease cascade and glycosylation. Biochim. Biophys. Acta. 1528:61–73. [DOI] [PubMed] [Google Scholar]
- Van Der Rest, M., B. Dublet, and S. Ricard-Blum. 2000. Unconventional Collagens: Types VI, VII, VIII, IX, X, XII, XIV, XVI and XIX. Oxford University Press, Oxford.
- Veis, A. 1996. Dentin. In Extracellular Matrix. W. D. Comper, editor. Harwood Academic Publishers, Amsterdam. 41–76.
- Veis, A., and A. George. 1994. Fundamentals of interstitial collagen self-assembly. In Extracellular Matrix Assembly and Function. P. D. Yurchenco, D. E. Birk, and R. P. Mecham, editors. Academic Press, San Diego. 15–45.
- Winter, H. H., and F. Chambon. 1986. Analysis of linear viscoelasticity of a crosslinking polymer at the gel point. J. Rheol. 30:367–382. [Google Scholar]