Abstract
Respiratory deficient cell lines are being increasingly used to elucidate the role of mitochondria and to understand the pathophysiology of mitochondrial genetic disease. We have investigated the oxygen consumption rates and oxygen concentration in wild-type (WT) and mitochondrial DNA (mtDNA) depleted (ρ0) Molt-4 cells. Wild-type Molt-4 cells have moderate oxygen consumption rates, which were significantly reduced in the ρ0 cells. PCMB (p-chloromercurobenzoate) inhibited the oxygen consumption rates in both WT and ρ0 cells, whereas potassium cyanide decreased the oxygen consumption rates only in WT Molt-4 cells. Menadione sodium bisulfite (MSB) increased the oxygen consumption rates in both cell lines, whereas CCCP (carbonyl cyanide m-chlorophenylhydrazone) stimulated the oxygen consumption rates only in WT Molt-4 cells. Superoxide radical adducts were observed in both WT and ρ0 cells when stimulated with MSB. The formation of this adduct was inhibited by PCMB but not by potassium cyanide. These results suggest that the reactive oxygen species (ROS) induced by MSB were at least in part produced via a mitochondrial independent pathway. An oxygen gradient between the extra- and intracellular compartments was observed in WT Molt-4 cells, which further increased when cells were stimulated by CCCP and MSB. The results are consistent with our earlier findings suggesting that such oxygen gradients may be a general phenomenon found in most or all cell systems under appropriate conditions.
INTRODUCTION
The concentration of intracellular oxygen is a critical component of many physiological (e.g., oxygen is the terminal acceptor in the mitochondrial electron transport chain) and pathological processes (e.g., the generation of excessive reactive oxygen species), but its concentration is difficult to measure (Glockner et al., 1989; James et al., 1998; Swartz, 1994). Consequently, measurements often are made of the extracellular oxygen concentration and it is assumed that the intracellular oxygen concentration is very similar, except perhaps within the mitochondria. It would be desirable, however, to measure the intracellular oxygen concentration directly, and several techniques have been adapted for this purpose, including micro oxygen electrodes, myoglobin cryospectrophotometry, and fluorescence techniques (Chance et al., 1978; Gayeski and Honig, 1983; Rumsey et al., 1988; Takahashi et al., 1998; Tamura et al., 1978; Whalen et al., 1973). We developed electron paramagnetic resonance (EPR) oximetry for this purpose and have reported significant oxygen gradients between extra- and intracellular compartments in various cell lines (Glockner et al., 1989, 1993; James et al., 1995; Hu et al., 1992; Swartz, 1994; Swartz and Clarkson, 1998). However, based on theoretical considerations and conflicting experimental data, the existence of such gradients remains controversial. One of the primary reasons for the discrepancies is the difficulty in obtaining direct measurement of intracellular oxygen concentrations.
The principle of EPR oximetry is based on the broadening effect of molecular oxygen on the EPR spectra of paramagnetic substances via Heisenberg spin exchange (Backer et al., 1977; Froncisz et al., 1985; Lai et al., 1982). Because the effect of oxygen on EPR spectra is due to physical interactions at the molecular level, oxygen is not consumed in the process. This provides an advantage in measuring oxygen concentration as compared to other techniques where oxygen consumption occurs during oxygen measurements.
Simultaneous measurements of extra- and intracellular concentrations of oxygen have the additional important advantage of avoiding the potential for systematic artifacts that can occur when the measurements are done in separate experiments. We developed a method for simultaneous measurement of average extra- and intracellular oxygen concentrations, which also does not require the presence of phagosomes (Glockner et al., 1993) and therefore can be used in any cell line. Lithium phthalocyanine (LiPc) and nitroxides are used extensively as oxygen-sensitive probes in EPR oximetry for in vitro and in vivo oxygen measurements (Glockner et al., 1989, 1993; Grinberg et al., 1998; Hu et al., 1992; James et al., 1995, 1998; Swartz, 1994; Swartz et al., 1995; Swartz and Clarkson, 1998; Swartz and Dunn, 2002). We have used particulate lithium phthalocyanine (LiPc) as the extracellular oxygen probe and (15N-PDT) as the intracellular oxygen probe in the presence of an extracellular broadening agent, Gd-DTPA complex.
A key to the use of EPR oximetry for intracellular oxygen concentration measurements is to carry out calibrations in cells that are not consuming oxygen. In this situation there should be equilibrium between the extra- and intracellular compartments, and therefore an accurate calibration curve for intracellular oxygen concentration can be obtained by measuring the extracellular oxygen concentration. The latter is much simpler to measure because of the larger size of the extracellular compartment. In our previous studies, respiratory inhibitors were used to eliminate oxygen consumption, but such treatments could potentially have altered the intracellular environment, introducing errors in the calibration. An ideal approach would be to use cells that can be altered by other means to eliminate oxygen consumption for the calibrations. We therefore studied mitochondrial DNA (mtDNA) depleted human lymphoblastic leukemia Molt-4 cells (ρ0 Molt-4 cells) where the mitochondrial respiratory chain is nonfunctional. Wild-type (WT) Molt-4 cells can be forced into a viable respiratory deficient (ρ0) state by long-term exposure to low concentrations of ethidium bromide (Desjardins et al., 1986; Hayashi et al., 1991; King and Attardi, 1989). In the presence of pyruvate and uridine, such ρ0 cells survive and proliferate without oxidative phosphorylation or de novo pyrimidine synthesis (Chandel and Schumacker, 1999). ρ0 cells have been useful for clarifying mitochondrial function and mechanisms in various cell lines undergoing oxidative stress and apoptosis (Chandel et al., 1998; Jiang et al., 1999; Marchetti et al., 1996).
In addition to the mitochondrial respiratory chain, the plasma membrane oxidoreductase (PMOR) system also may contribute to the cellular redox state and energy supply. The PMOR is a multienzyme complex that includes NADPH-ferricyanide reductase and NADPH oxidase (Sun et al., 1992; Brightman et al., 1992; Larm, et al., 1994). The progressive loss of mitochondrial respiratory function in cells deprived of mtDNA (ρ0) is compensated by a concomitant and stepwise up-regulation of the PMOR system (Larm et al., 1994). There are very few reports on the relationship between cellular oxygen utilization rates, intracellular oxygen concentration, and reactive oxygen species (ROS) produced by the mitochondrial respiratory chain and PMOR. We therefore explored the use of EPR oximetry to enhance the understanding of the role of the mitochondrial respiratory chain and the PMOR system in the production of ROS and the environmental circumstances under which this might become significant. Using EPR oximetry and spin trapping techniques, the relationship between intracellular oxygen concentration and cellular oxygen consumption rates and reactive oxygen species in WT and ρ0 Molt-4 cells were investigated.
MATERIALS AND METHODS
Reagents
RPMI 1640 and fetal bovine serum were purchased from Gibco Life Technologies (Grand Island, NY). Lithium phthalocyanine (LiPc) was synthesized in our laboratory and 4-oxo-2, 2, 6, 6-tetramethylpiperidine-d16-1-15N-oxyl (15N-PDT) was purchased from Cambridge Isotope Laboratories, Inc. (Andover, MA). The gadolinium complex (Magnevist-GdDTPA) was obtained from Berlex Imaging (Wayne, NJ). All other chemicals were purchased from Sigma Chemical Company (St. Louis, MO) unless otherwise stated.
Cell culture
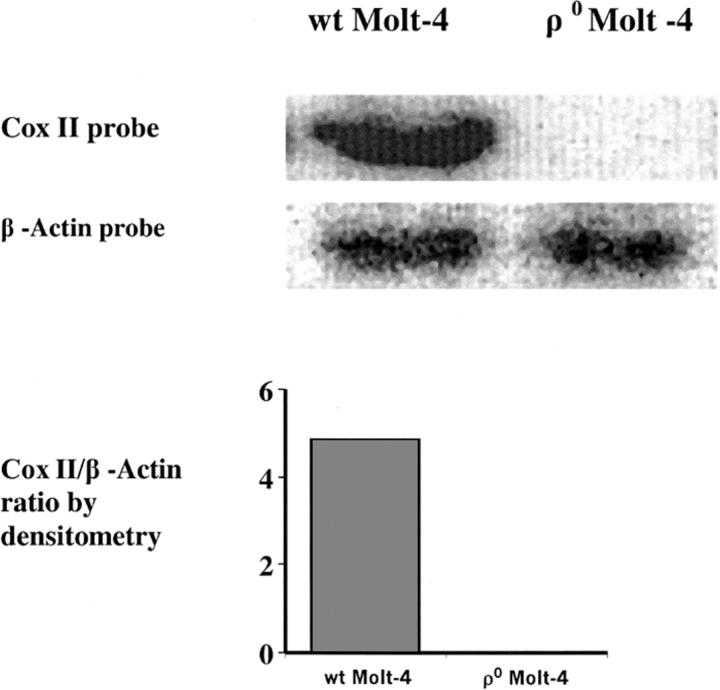
Molt-4 cells were grown at 37°C in a humidified atmosphere of 5% CO2 and 95% air in RPMI 1640 medium supplemented with 10% fetal bovine serum and 2 mM L-glutamine. To develop ρ0 cells, WT Molt-4 cells were treated with 50 ng/ml ethidium bromide in a medium supplemented with pyruvate (100 μg/ml) and uridine (50 μg/ml) for 26 days, (∼14 doubling times for WT Molt-4 cells). The cells were subcloned and the lack of mtDNA in the resultant ρ0 cells was confirmed by southern analysis (Fig. 1) and a quantitative polymerase chain reaction. The bands for each probe were subjected to densitometric analysis, and the ratio of Cox II/β-actin DNA was measured and is shown in Fig. 1 as an indicator of the mitochondrial/nuclear DNA ratio in the WT Molt-4 and ρ0 Molt-4 cells. Furthermore, the phenotype of the ρ0 Molt-4 cells, regarding growth rate, the ratio of cytochrome c oxidase/citrate synthase activity, mitochondrial ultrastructure, and fluorescence staining have been defined and reported (Holmuhamedov et al., 2002). For measurements under similar conditions, WT and ρ0 Molt-4 cells were transferred to a serum-free RPMI 1640 medium before the experiments. The cells' ability to exclude 0.4% trypan blue was determined using a hemocytometer under a light microscope and found to be above 95% before and after all the experiments.
FIGURE 1.
Southern analysis of the WT and the ρ0 Molt-4 cells showing the absence of the mtDNA in the ρ0 Molt-4 cells. The southern blot was quantified using densitometric analysis and the results are shown beneath the gel.
Calibration of measurements of oxygen concentrations
Due to a very low rate of oxygen consumption in ρ0 cells, it is reasonable to assume that equilibrium exists for oxygen between the extra- and intracellular compartments and therefore can be related to the oxygen tension of the perfusing gas. A plot of perfused gas concentration against the line width provided the correlation equation, which was used to convert line widths into oxygen concentrations. To compare these experimental data with our usual approach, we also did calibrations in which the oxygen consumption of WT Molt-4 cells was completely inhibited by the addition of 2 mM KCN and 2 mM PCMB. No significant difference was observed in calibrations obtained with ρ0 cells and p-chloromercurobenzoate (PCMB) treated ρ0 cells. Therefore, the calibration curve was obtained by using the ρ0 cells. This avoided the need to add respiratory inhibitors for calibration.
Measurement of oxygen consumption rates
Each 100 μl sample of cells (2.5 × 10⁶ cells/ml) was mixed with 10% dextran and 0.2 mM 15N-PDT. The cell suspension was drawn into a glass capillary tube, which was then sealed at both ends with Citroseal sealant and placed in the EPR resonator. Oxygen consumption by cells decreased the concentration of oxygen, which was reflected by narrowing of the 15N-PDT line width. Spectra were recorded at 30-s intervals for 10 min, and the changes in line width were transformed to oxygen concentration using the calibration curve. The slope of the decrease in oxygen concentration with time yielded the oxygen consumption or oxygen consumption rate of the cells.
Measurement of oxygen concentrations
200 μl of samples containing 2.5 × 10⁷ cells/ml, 0.2 mM 15N-PDT, 0.25 mg/ml LiPc, 10% dextran, and 50 mM Gd-DTPA complex were prepared (all the concentrations mentioned are the final concentrations in the cell suspension). Dextran was used in all the experiments to retard the settling of the cells so that the sample maintained a homogenous distribution of cells within the sensitive volume of the EPR resonator during the experimental time. The cell suspension was mixed quickly but gently and drawn into a gas permeable Teflon tube with an inside diameter of 0.813 mm and a wall thickness of 0.038 ± 0.014 mm (Zeus Industries, Raritan, NJ). The tube was folded into a W shape and inserted in a quartz tube open at both ends. The presence of a Gd-DTPA complex made the extracellular 15N-PDT signal very broad, so the remaining signal provided a direct measurement of average intracellular oxygen. The EPR signal arising from the Gd-DTPA complex itself was too broad to be observed under the present experimental conditions. Because the unpaired electrons in LiPc are located deep within the crystal and hence physically shielded from the media, the Gd-DTPA complex did not affect the line width of LiPc, and the LiPc remained extracellular due to its size. Therefore, LiPc exclusively reported the average extracellular partial pressure of oxygen (pO2). The EPR signals of LiPc and 15N-PDT did not overlap. Measurements were carried out at various perfused oxygen concentrations and the line widths were calculated by spectral fitting, using the EWVoigt program (Scientific Software, Urbana, IL). The line widths were converted into oxygen concentration by the relationship obtained from the calibration curve.
EPR measurements
All the experiments were carried out at 37°C on a Varian E-109 EPR spectrometer, equipped with a Varian gas flow temperature controller. Typical spectroscopic parameters were: field center, 3362 Gauss; microwave frequency, 9.05 GHz; and nonsaturating microwave power. The modulation amplitude was adjusted to approximately one-third of the line width to avoid line broadening. The oxygen concentration in the perfused gas was verified with an oxygen analyzer (Delta F Corporation, Woburn, MA).
Spin trapping
Spin trapping experiments were performed by exposing the cell suspension containing 2.5 × 10⁷ cells/ml in 10% dextran to 400 μM of menadione sodium bisulfite (MSB) and 50 mM 5,5-dimethyl-1-pyrroline-N-oxide (DMPO). The sample was immediately drawn into a Teflon tube perfused with 21% O2, and the spectra were measured at 1-min intervals. The time between the addition of MSB and the start of the EPR measurements was approximately two minutes. The signal intensity of the lowest field component of the spectra was monitored to measure the relative amounts of free oxygen radicals present at a given time. These data provide only relative comparisons because absolute quantitative comparisons are difficult; the observed intensity reflects a dynamic equilibrium between formation and destruction of the spin adduct, and these rates may be affected by the conditions of the sample. The radical adduct was analyzed by using the Winsim simulation program (National Institutes of Health, Bethesda, MD) to obtain the hyperfine splittings.
Statistic analysis
The data on oxygen consumption rates are expressed as mean ± SE and were analyzed by analysis of variance (ANOVA). A paired double-sided t-test was used to determine the statistical significance of the oxygen gradient within each cell group for each perfused gas concentration. Statistical significance was accepted at P < 0.05. All computations were made using the statistical package S-Plus 6 (Insightful Incorporation, Seattle, WA). To compare the oxygen gradient between groups with maximum statistical efficiency, we applied a multivariate regression model with the dummy variable/intercept corresponding to the cell group (Draper and Smith, 1998). In this statistical analysis it is assumed that the gradient is a function of perfused gas adjusted for each treatment condition and cell line. We introduced three dummy variables/intercepts such that the value is 1 if the gradient belongs to the group and zero otherwise; this gave the following multivariate regression model:
 |
where d2, d3, d4 are the dummy variables and c, a, b1, b2, b3 are regression coefficients estimated by the least square procedure. We used this multivariate model to estimate all parameters simultaneously using all data, and therefore allowed maximum degrees of freedom. Using this model, for the control group the gradient is c + a×gas, for CCCP the model is c + a × gas + b1, etc. Geometrically, the gradient is described as a system of four parallel straight lines with the slope a, and the intercept correspondent to each cell group.
RESULTS
EPR spectra and calibration curve
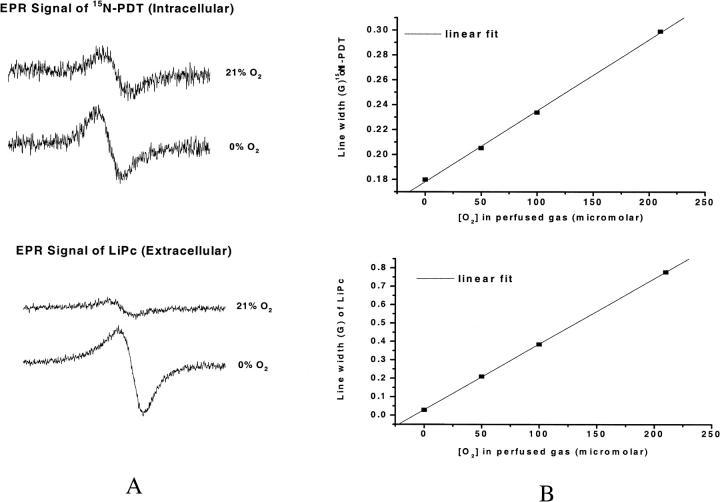
Fig. 2 A shows the low field component of the EPR spectrum of 15N-PDT and a typical EPR spectrum of LiPc crystals, both measured in cell suspensions. Change of the perfused gas from 0% oxygen to 21% (or 210 μM) oxygen led to broadening of the line width as shown in the figure. Fig. 2 B shows typical calibration plots obtained by using these probes in cell suspensions perfused with different concentrations of oxygen. The line width of the probes is a linear function of the perfused oxygen concentration (regression coefficient for the fitting of 15N-PDT and LiPc calibrations are 0.9995 and 0.9999 respectively). The calibration plot obtained from 15N-PDT is used to determine intracellular oxygen concentration, and the calibration plot of LiPc is used to determine extracellular oxygen concentration.
FIGURE 2.
(A) Low field component of the EPR spectrum of 15N-PDT and spectra of LiPc in ρ0 Molt-4 cell suspension perfused with 0% and 21% oxygen. (B) Calibration plots of 15N PDT and LiPc at different concentrations of perfused oxygen.
Cellular oxygen consumption rates
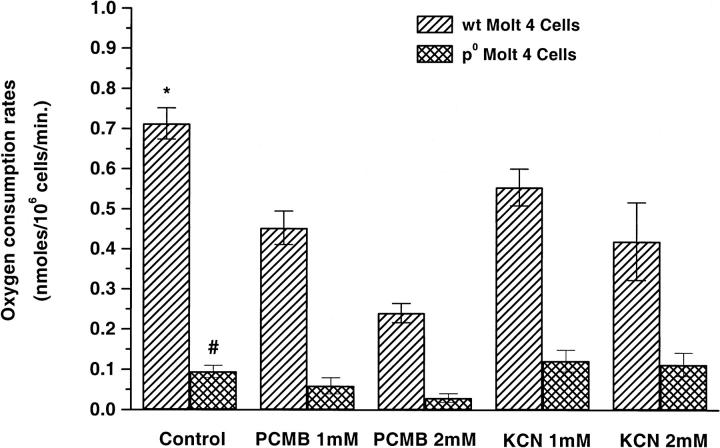
The oxygen consumption rate of ρ0 Molt-4 cells was much lower (∼87%) than that of WT Molt-4 cells (Fig. 3). To understand the effect of mitochondrial metabolic processes and the PMOR system on oxygen consumption rates, we used KCN and PCMB to inhibit the cytochrome c oxidase and NADPH oxidase respectively. KCN and PCMB had a dose-dependent inhibitory effect on oxygen consumption rates in WT Molt-4 cells with maximum inhibition achieved at 2 mM KCN (∼41%) and 2 mM PCMB (∼66%) respectively. Further increases in KCN or PCMB concentration decreased the cell viability significantly, affecting the integrity of the plasma membrane. In ρ0 Molt-4 cells, not unexpectedly, KCN up to 2 mM had no effect, but PCMB at 2 mM concentration almost completely inhibited cellular oxygen consumption.
FIGURE 3.
Oxygen consumption rates (nmol/106cells/min) of WT and ρ0 Molt-4 cells when treated with different concentrations of KCN and PCMB (mean ± SE, n = 6–8). * versus ρ0 Molt-4 cells, p < 0.05; * versus WT KCN and PCMB, p < 0.05; # versus PCMB 2 mM, p < 0.05.
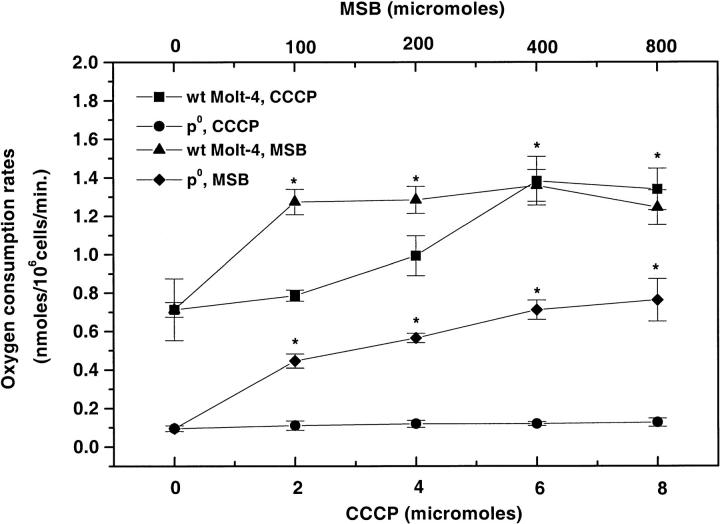
We also investigated the effect of an uncoupler of oxidative phosphorylation (CCCP) on the oxygen consumption rates of both WT and mtDNA inhibited (ρ0) Molt-4 cells (Fig. 4). CCCP increased the cellular oxygen consumption rates in WT Molt-4 cells in a concentration dependent manner with a maximum twofold increase achieved at 6–8 μM CCCP. CCCP did not have a significant effect on oxygen consumption rates of ρ0 cells. A further increase in CCCP concentrations above 8 μM decreased the cell viability and oxygen consumption rates significantly.
FIGURE 4.
Oxygen consumption rates (nmol/106cells/min) in WT and ρ0 Molt-4 cells when stimulated with different concentrations of CCCP and MSB (mean ± SE, n = 6–8). * versus control in each group, p < 0.05.
To further clarify the role of plasma membrane PMOR system in oxygen metabolism, we investigated the effect of menadione, a NADPH oxidase specific stimulator, on oxygen consumption rates of WT and ρ0 Molt-4 cells (Fig. 4). MSB significantly increased the oxygen consumption rates of WT Molt-4 cells, and a maximum of 1.36 nmol/106 cells/min was observed at 400 μM MSB. This was not significantly different from that observed at 100 and 200 μM MSB concentrations. MSB also was found to stimulate the oxygen consumption rates of ρ0 Molt-4 cells, at higher concentrations (200–800 μM) reaching ∼50% of that observed in the WT Molt-4 cells. Further increases in MSB concentration above 800 μM decreased the cell viability and oxygen consumption rates significantly.
In a separate experiment, an oxygen consumption rate of 0.56 nmol/106cells/min was observed when 400 μM MSB was added into the Molt-4 cells pretreated with 2 mM KCN, whereas similar treatment of ρ0 Molt-4 cells pretreated with 2 mM PCMB and WT Molt-4 cells pretreated with 2 mM KCN/PCMB did not increase the oxygen consumption rates.
Average extra- and intracellular oxygen concentration
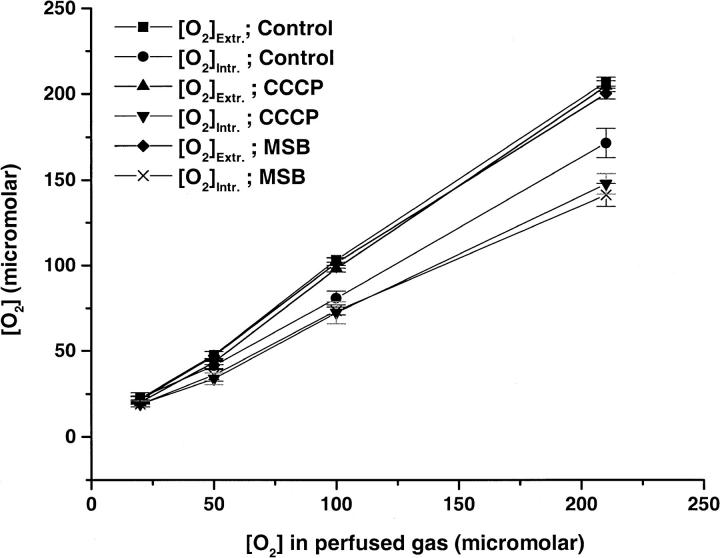
The average extra- and intracellular oxygen concentration observed at different concentrations of perfused gas in WT Molt-4 cells using a calibration obtained with ρ0 Molt-4 cells, is shown in Fig. 5 and the observed gradients are shown in Table 1. No significant change in the extracellular oxygen concentration was observed in control, CCCP, or MSB treated WT Molt-4 cells. However, the intracellular oxygen concentration varied with different treatments of the cells. No significant oxygen gradient was observed in unstimulated WT Molt-4 cells at 20 and 50 μM of perfused oxygen; however, the gradient increased to significant values at 100 and 210 μM of perfused oxygen. When cellular oxygen consumption was stimulated by 8 μM CCCP, there was an increase in the gradient of 21 μM at 210 μM of perfused gas. Measurements carried out with 400 μM MSB stimulation also resulted in an increase in the oxygen gradient (23 μM) at 210 μM of perfused gas. The oxygen consumption rates of ρ0 cells were stimulated by MSB, and therefore we also studied the oxygen concentrations in these cells under MSB stimulation. Stimulation of cellular oxygen consumption by 400 μM MSB resulted in an oxygen gradient of ∼43 μM at 210 μM of perfused gas. The results obtained from the multivariate statistical analysis are shown in Table 2. We obtained coefficient (rate) a = 0.245, which implies that the increase in the perfused gas concentration by 10 μM would lead to a 2.45 μM gradient in each group. These results also indicate that the oxygen gradients observed in CCCP and MSB treated cells were significantly different from control cells (Table 2).
FIGURE 5.
Average extra- and intracellular oxygen concentration (μM) in WT Molt-4 cells, control and under respiratory stimulation by 8 μM CCCP and 400 μM MSB (mean ± SE, n = 7–9).
TABLE 1.
Gradient of oxygen (μmol) between extra- and intracellular compartments of WT Molt-4 and ρ0 Molt-4 cells
| Perfused oxygen (μmol)
|
|||||
|---|---|---|---|---|---|
| Cell line | Sample | 20 | 50 | 100 | 210 |
| WT Molt-4 | Control | 0.18 | 6.09 | 22.32 | 35.73 |
| n = 9 | (0.9554) | (0.0687) | (0.0004) | (0.0085) | |
| 8 μM CCCP | 1.15 | 9.76 | 25.81 | 56.83 | |
| n = 7 | (0.5551) | (0.0165) | (0.007) | (0.0006) | |
| 400 μM MSB | 2.74 | 10.95 | 27.95 | 59.02 | |
| n = 7 | (0.3266) | (0.0085) | (0.0001) | (0.0001) | |
| ρ0 Molt-4 | 400 μM MSB | 2.59 | 8.57 | 27.69 | 42.95 |
| n = 7 | (0.2905) | (0.0291) | (0.0022) | (0.0011) | |
Numbers in parenthesis indicate the p value for the occurrence of a gradient.
TABLE 2.
Intercept and difference in oxygen gradients from control (WT Molt-4 cells) derived from the multivariate regression analysis (a = 0.245)
| Group | Intercept | Difference from control | p-value |
|---|---|---|---|
| WT Molt-4 | c = −7.17 | 0 | |
| CCCP | b1 = 0.14 | 7.31 | 0.049 |
| MSB | b2 = 1.92 | 9.09 | 0.015 |
| ρ0 Molt-4 MSB | b3 = −2.80 | 4.37 | 0.237 |
We also used our previous method of calibration, in which the oxygen consumption rate was inhibited, to measure average extra- and intracellular oxygen concentrations and observed similar results to those obtained using a calibration from ρ0 cells. An oxygen gradient of 23.98 μM and 39.56 μM was observed at 100 and 210 μM of perfused gas in the WT Molt-4 cells. Respiratory stimulation by 8 μM CCCP and 400 μM MSB increased the oxygen gradient to 57.15 μM and 60.77 μM at 210 μM of perfused gas respectively. The oxygen gradients observed at other perfused gas concentrations also were not significantly different from those obtained with calibration using ρ0 cells.
ROS generated by MSB stimulation of WT and ρ0 Molt-4 cells
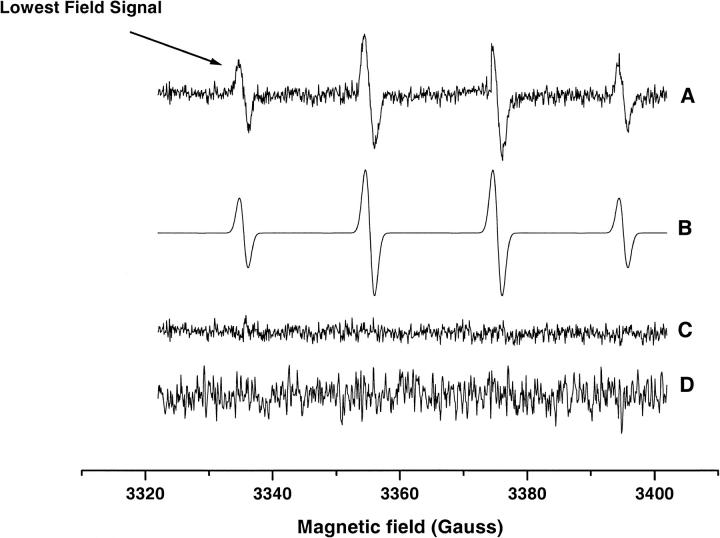
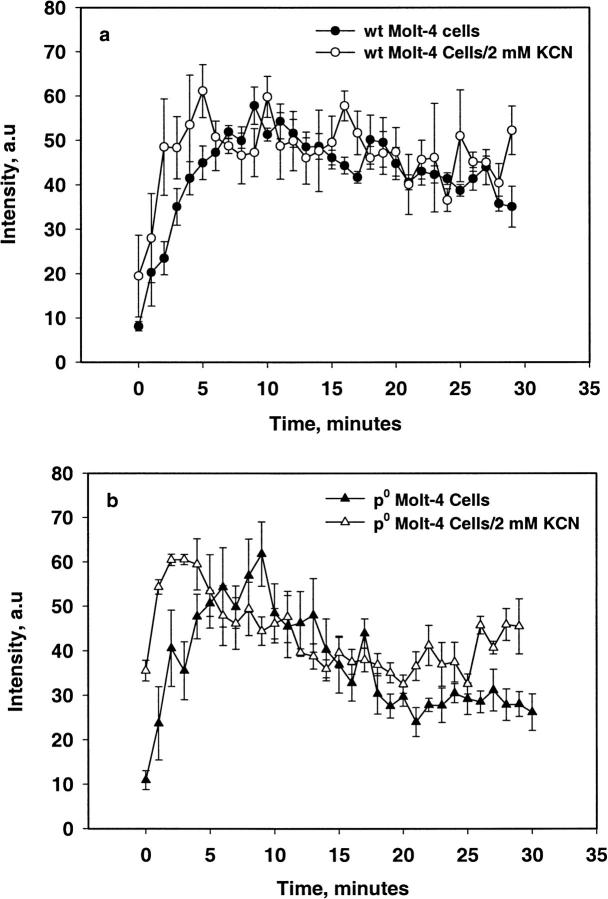
Figs. 6 and 7 show the EPR spectrum and the intensity of the radical adduct observed in WT and ρ0 Molt-4 cells when treated with 400 μM MSB stimulation. Spectral simulation yielded the hyperfine splittings aN = 15.01 and aH = 14.60 G, which agrees well with the hydroxyl-radical adduct of DMPO (Liu et al., 1999). The intensity of this adduct increased with time to a maximum at ∼10 min. Similar results were obtained with WT and ρ0 Molt-4 cells pretreated with 2 mM KCN; however, ρ0 cells pretreated with 2 mM PCMB and Molt-4 cells pretreated with 2 mM KCN/PCMB had no detectable radical adducts. The addition of SOD (2000 U/ml) completely inhibited the radical adduct observed in these systems. The superoxide adduct of DMPO has a short half-life of ∼5 s in solution and is known to decay readily to the hydroxyl adduct (Liu et al., 1999). These results indicate the initial production of the DMPO-OOH adduct, which subsequently decomposed to form the DMPO-OH adduct due to high instability of the former adduct.
FIGURE 6.
(A) The EPR spectrum of the DMPO-OH adduct obtained from cell suspensions of WT and ρ0 Molt-4 cells treated with 400 μM MSB and 50mM DMPO. The lowest field signal was used to measure the change in the adduct intensity over time. (B) Simulation; (C) The residual signal obtained by subtracting the experimental spectrum from the simulated spectrum; (D) The spectrum obtained from ρ0 Molt-4 cells pretreated with 2 mM PCMB or WT Molt-4 cells pretreated with 2 mM KCN/PCMB. The high noise in this spectrum is due to high receiver gain used to record this spectrum.
FIGURE 7.
Change in signal intensity of the DMPO-OH adduct observed in WT and ρ0 Molt-4 cells with 400 μM MSB stimulation with and without KCN (mean ± SE, n = 4).
DISCUSSION
The depletion of mtDNA in cells leads to the absence of vital protein subunits in complex I, III, and IV. The seven subunits ND1, ND2, ND3, ND4, ND4L, ND5, and ND6 of NADH in Complex I, cytochrome b in complex III, and subunits Cytochrome oxidase I, II, and III of complex IV of the electron transport chain. This compromises the mitochondrial electron transport chain such that mitochondrial oxygen utilization is abnormally low. This resulted in oxygen consumption rates in the ρ0 Molt-4 cells that were only ∼13% of WT Molt-4 cells; this value was similar to that reported by Chandel et al. (1998). The residual oxygen consumption in ρ0 Molt-4 cells could be due to the activity of oxidase enzymes. The activity of cytochrome c oxidase in ρ0 Molt-4 cells is virtually undetectable (Holmuhamedov et al., 2002). Therefore, KCN had no effect on residual cellular oxygen consumption in the ρ0 derivative, although it inhibited the oxygen consumption rates in WT Molt-4 cells. In contrast, PCMB decreased the oxygen consumption rates significantly in both cell lines.
Our findings of a lack of stimulation of oxygen consumption of ρ0 cells by CCCP, an uncoupler of oxidative phosphorylation, is consistent with the predicted presence of a dysfunctional mitochondrial electron transport chain. MSB treatment stimulated the oxygen consumption rates in both cell lines and also in KCN pretreated WT Molt-4 cells, but showed no effect on oxygen consumption in PCMB pretreated ρ0 and KCN/PCMB pretreated WT Molt-4 cells. These results suggest a dual mechanism (mitochondrial and nonmitochondrial) of MSB for increasing oxygen utilization in these cell lines. The plasma membrane oxidoreductase (PMOR) system has been proposed to be able to compensate for the loss of mitochondrial respiratory chain activity, reoxidizing cytosolic NADH produced during cellular metabolism at a rate sufficient to support growth (Larm et al., 1994). Our data indicate that PMOR activity of ρ0 Molt-4 cells could be stimulated by quinones such as MSB and also could be inhibited by the inhibitor of peroxidase enzymes, PCMB. These results suggest that treatment of the PMOR system with a stimulator could possibly be beneficial for cells with impaired mitochondrial electron transport chain function.
The average extra- and intracellular oxygen concentration measured in WT Molt-4 cells by using calibrations with ρ0 Molt-4 cells and with respiratory inhibited WT Molt-4 cells yielded similar results. This supports the validity of our earlier approach in which we used respiratory inhibition to obtain the calibration curves. Consistent with our prior observations in other cell lines (Glockner et al., 1989; Hu et al., 1992; James et al., 1998), respiratory stimulation by CCCP and MSB resulted in a substantial increase in the oxygen gradient at 210 μM of perfused gas. These results support our hypothesis that the occurrence of oxygen gradients between the extracellular and intracellular compartments is a phenomenon found in most or all cell systems under appropriate conditions; however, its magnitude may depend on the metabolic requirements for oxygen of the cells.
These results also indicate that the existence of such gradients can depend not only on mitochondrial oxygen consumption but also on nonmitochondrial oxygen-consuming metabolic pathways. Both of these pathways might play an important role in regulating the intracellular oxygen concentration under different conditions. It has been shown previously that the existence of such an oxygen gradient could not be accounted for on the basis of simple diffusion of oxygen into the interior of the oxygen consuming cells (Grinberg et al., 1998). Recent studies have indicated that the membrane lipids may serve as a barrier to the release, diffusion, and availability of oxygen (Buchwald et al., 1999, 2000; Dumas et al., 1999).
MSB is known to induce oxidative stress through the generation of superoxide and also to stimulate cellular oxygen consumption (Frei et al., 1986; Kappus and Sies, 1981; O'Brien, 1991; Powis et al., 1981; Thor et al., 1982). The results of our spin trapping experiments indicate that there can be mitochondrial independent production of superoxide by MSB via the NADPH oxidase present in other organelles, such as the PMOR system. No significant differences in adduct intensity between MSB treated WT and ρ0 Molt- 4 cells were observed. A similar observation was reported for U937 cells lacking mtDNA and its parent cell line (Marchetti et al., 1996). No radical adduct production was observed in PCMB pretreated ρ0 Molt-4 cells and KCN/PCMB pretreated WT Molt-4 cells. In addition, the observation that there was no effect on adduct intensity in cells pretreated with KCN provide additional evidence to support the hypothesis that superoxide production occurs in systems such as the PMOR. These results are consistent with the data obtained for oxygen consumption rates.
In conclusion, the results indicate the feasibility of EPR oximetry for the measurement of oxygen consumption rates and oxygen concentration. No change in the calibration curve obtained with ρ0 Molt-4 cells and respiratory inhibited WT Molt-4 cells confirm the validity of the calibration procedure and provides support to the results obtained in our earlier experiments. The results further define the oxygen consumption (respiratory) phenotype of the ρ0 Molt-4 cells and suggest a dual mechanism of MSB stimulation, which is further supported by the spin trapping experiments. Finally, our results are in agreement with our earlier findings that there can be a significant difference (gradient) between the average extra- and intracellular compartments in dilute cell suspensions.
Acknowledgments
This study was supported by National Institutes of Health (grant RO1 GM 34250) and National Cancer Institute (comprehensive cancer center grant CA 231098), and used the facilities of the EPR Center for Viable Systems, supported by the National Center for Research Resources (NIH grant, P41 RR11602).
References
- Backer, J. M., V. G. Budker, S. I. Eremenko, and Y. N. Molin. 1977. Detection of the kinetics of biochemical reactions with oxygen using exchange broadening in the ESR spectra of nitroxide radicals. Biochim. Biophys. Acta. 460:152–156. [DOI] [PubMed] [Google Scholar]
- Brightman, A. O., J. Wang, R. K. Miu, I. L. Sun, R. Barr, F. L. Crane, and D. J. Morre. 1992. A growth factor- and hormone-stimulated NADH oxidase from rat liver plasma membrane. Biochim. Biophys. Acta. 1105:109–117. [DOI] [PubMed] [Google Scholar]
- Buchwald, H., T. J. O'Dea, H. J. Menchaca, V. N. Michalek, and T. D. Rohde. 1999. Effect of plasma cholesterol on red blood cell oxygen transport. Clin. Hemorheol. Microcirc. 21:255–261.10711751 [Google Scholar]
- Buchwald, H., H. J. Menchaca, V. N. Michalek, T. D. Rohde, D. B. Hunninghake, and T. J. O'Dea. 2000. Plasma cholesterol: an influencing factor in red blood cell oxygen release and cellular oxygen availability. J. Am. Coll. Surg. 191:490–497. [DOI] [PubMed] [Google Scholar]
- Chance, B., C. Barlow, Y. Nakase, H. Takeda, A. Mayevsky, R. Fischetti, N. Graham, and J. Sorge. 1978. Heterogeneity of oxygen delivery in normoxic and hypoxic states: a fluorometer study. Am. J. Physiol. 235:H809–H820. [DOI] [PubMed] [Google Scholar]
- Chandel, N. S., E. Maltepe, E. Goldwasser, C. E. Mathieu, M. C. Simon, and P. T. Schumacker. 1998. Mitochondrial reactive oxygen species trigger hypoxia-induced transcription. Proc. Natl. Acad. Sci. USA. 95:11715–11720. [DOI] [PMC free article] [PubMed] [Google Scholar]
- Chandel, N. S., and P. T. Schumacker. 1999. Cells depleted of mitochondrial DNA (ρ0) yield insight into physiological mechanisms. FEBS Lett. 454:173–176. [DOI] [PubMed] [Google Scholar]
- Desjardins, P., J. M. de Muys, and R. Morais. 1986. An established avian fibroblast cell line without mitochondrial DNA. Somat. Cell Mol. Genet. 12:133–139. [DOI] [PubMed] [Google Scholar]
- Draper, N. R., and H. Smith. 1998. Applied Regression Analysis. Wiley, New York.
- Dumas, D., V. Latger, M. L. Viriot, W. Blondel, and J. F. Stoltz. 1999. Membrane fluidity and oxygen diffusion in cholesterol-enriched endothelial cells. Clin. Hemorheol. Microcirc. 21:255–261. [PubMed] [Google Scholar]
- Frei, B., K. H. Winterhalter, and C. Richter. 1986. Menadione- (2-methyl-1,4-naphthoquinone) dependent enzymatic redox cycling and calcium release by mitochondria. Biochemistry. 25:4438–4443. [DOI] [PubMed] [Google Scholar]
- Froncisz, W., C. S. Lai, and J. S. Hyde. 1985. Spin-label oximetry: kinetic study of cell respiration using a rapid-passage T1-sensitive electron spin resonance display. Proc. Natl. Acad. Sci. USA. 82:411–415. [DOI] [PMC free article] [PubMed] [Google Scholar]
- Gayeski, T. E., and C. R. Honig. 1983. Direct measurement of intracellular O2 gradients; role of convection and myoglobin. Adv. Exp. Med. Biol. 159:613–621. [DOI] [PubMed] [Google Scholar]
- Glockner, J. F., H. M. Swartz, and M. A. Pals. 1989. Oxygen gradients in CHO cells: measurement and characterization by electron spin resonance. J. Cell. Physiol. 140:505–511. [DOI] [PubMed] [Google Scholar]
- Glockner, J. F., S. W. Norby, and H. M. Swartz. 1993. Simultaneous measurement of intracellular and extracellular oxygen concentrations using a nitroxide-liposome system. Magn. Reson. Med. 29:12–18. [DOI] [PubMed] [Google Scholar]
- Grinberg, O. Y., P. E. James, and H. M. Swartz. 1998. Are there significant gradients of pO2 in cells? Adv. Exp. Med. Biol. 454:415–423. [DOI] [PubMed] [Google Scholar]
- Hayashi, J., S. Ohta, A. Kikuchi, M. Takemitsu, Y. Goto, and I. Nonaka. 1991. Introduction of disease-related mitochondrial DNA deletions into HeLa cells lacking mitochondrial DNA results in mitochondrial dysfunction. Proc. Natl. Acad. Sci. USA. 88:10614–10618. [DOI] [PMC free article] [PubMed] [Google Scholar]
- Holmuhamedov, E., L. Lewis, M. Bienengraeber, M. Holmuhamedova, A. Jahangir, and A. Terzic. 2002. Suppression of human tumor cell proliferation through mitochondrial targeting. FASEB J. 16:1010–1016. [DOI] [PubMed] [Google Scholar]
- Hu, H., G. Sosnovsky, and H. M. Swartz. 1992. Simultaneous measurements of the intra- and extra-cellular oxygen concentration in viable cells. Biochim. Biophys. Acta. 1112:161–166. [DOI] [PubMed] [Google Scholar]
- James, P. E., O. Y. Grinberg, G. Michaels, and H. M. Swartz. 1995. Intraphagosomal oxygen in stimulated macrophages. J. Cell. Physiol. 163:241–247. [DOI] [PubMed] [Google Scholar]
- James, P. E., O. Y. Grinberg, and H. M. Swartz. 1998. Superoxide production by phagocytosing macrophages in relation to the intracellular distribution of oxygen. J. Leukoc. Biol. 64:78–84. [DOI] [PubMed] [Google Scholar]
- Jiang, S., J. Cai, D. C. Wallace, and D. P. Jones. 1999. Cytochrome C-mediated apoptosis in cells lacking mitochondrial DNA. Signaling pathway involving release and caspase 3 activation is conserved. J. Biol. Chem. 274:29905–29911. [DOI] [PubMed] [Google Scholar]
- Kappus, H., and H. Sies. 1981. Toxic drug effects associated with oxygen metabolism: redox cycling and lipid peroxidation. Experientia. 37:1233–1241. [DOI] [PubMed] [Google Scholar]
- King, M. P., and G. Attardi. 1989. Human cells lacking mtDNA: repopulation with exogenous mitochondria by complementation. Science. 246:500–503. [DOI] [PubMed] [Google Scholar]
- Lai, C. S., L. E. Hopwood, J. S. Hyde, and S. Lukiewicz. 1982. ESR studies of O2 uptake by Chinese hamster ovary cells during the cell cycle. Proc. Natl. Acad. Sci. USA. 79:1166–1170. [DOI] [PMC free article] [PubMed] [Google Scholar]
- Larm, J. A., F. Vaillant, A. W. Linnane, and A. Lawen. 1994. Up-regulation of the plasma membrane oxidoreductase as a prerequisite for the viability of human namalwa ρ° cells. J. Biol. Chem. 269:30097–30100. [PubMed] [Google Scholar]
- Liu, K. J., M. Miyake, T. Panz, and H. M. Swartz. 1999. Evaluation of DEPMPO as a spin trapping agent in biological systems. Free Rad. Biol. and Med. 26:714–721. [DOI] [PubMed] [Google Scholar]
- Marchetti, P., S. A. Susin, D. Decaudin, S. Gamen, M. Castedo, T. Hirsch, N. Zamzami, J. Naval, A. Senik, and G. Kroemer. 1996. Apoptosis-associated derangement of mitochondrial function in cells lacking mitochondrial DNA. Cancer Res. 56:2033–2038. [PubMed] [Google Scholar]
- O'Brien, P. J. 1991. Molecular mechanisms of quinone cytotoxicity. Chem. Biol. Interact. 80:1–41. [DOI] [PubMed] [Google Scholar]
- Powis, G., B. A. Svingen, and P. Appel. 1981. Quinone-stimulated superoxide formation by subcellular fractions, isolated hepatocytes, and other cells. Mol. Pharmacol. 20:387–394. [PubMed] [Google Scholar]
- Rumsey, W. L., J. M. Vanderkooi, and D. F. Wilson. 1988. Imaging of phosphorescence: a novel method for measuring oxygen distribution in perfused tissue. Science. 241:1649–1651. [DOI] [PubMed] [Google Scholar]
- Sun, I. L., E. E. Sun, F. L. Crane, D. J. Morre, A. Lindgren, and H. Low. 1992. Requirement for coenzyme Q in plasma membrane electron transport. Proc. Natl. Acad. Sci. USA. 89:11126–11130. [DOI] [PMC free article] [PubMed] [Google Scholar]
- Swartz, H. M. 1994. Measurements of intracellular concentrations of oxygen: experimental results and conceptual implications of an observed gradient between intracellular and extracellular concentrations of oxygen. Adv. Exp. Med. Biol. 345:799–806. [DOI] [PubMed] [Google Scholar]
- Swartz, H. M., G. Bacic, B. Friedman, F. Goda, O. Y. Grinberg, P. J. Hoopes, J. Jiang, K. J. Liu, T. Nakashima, J. O'Hara, and T. Walczak. 1995. Measurement of pO2 in vivo, including human subjects by Electron Paramagnetic Resonance. Adv. Exp. Med. Biol. 361:119–128. [DOI] [PubMed] [Google Scholar]
- Swartz, H. M., and R. B. Clarkson. 1998. The measurement of oxygen in vivo using EPR techniques. Phys. Med. Biol. 43:1957–1975. [DOI] [PubMed] [Google Scholar]
- Swartz, H. M., and J. F. Dunn. 2002. Measurements of oxygen in tissues: overview and perspectives on methods to make the measurements in Oxygen Transport to Tissue XXII. J. F. Dunn and H. M. Swartz, editors. Pabst Science Publishers, Lengerich.
- Takahashi, E., K. Sato, H. Endoh, Z. L. Xu, and K. Doi. 1998. Direct observation of radial intracellular PO2 gradients in a single cardiomyocyte of the rat. Am. J. Physiol. 275:H225–H233. [DOI] [PubMed] [Google Scholar]
- Tamura, M., N. Oshino, B. Chance, and I. A. Silver. 1978. Optical measurements of intracellular oxygen concentration of rat heart in vitro. Arch. Biochem. Biophys. 191:18–22. [DOI] [PubMed] [Google Scholar]
- Thor, H., M. T. Smith, P. Hartzell, G. Bellomo, S. A. Jewell, and S. Orrenius. 1982. The metabolism of menadione (2-methyl-1,4-naphthoquinone) by isolated hepatocytes. A study of the implications of oxidative stress in intact cells. J. Biol. Chem. 257:12419–12425. [PubMed] [Google Scholar]
- Whalen, W. J., P. Nair, and R. A. Ganfield. 1973. Measurements of oxygen tension in tissues with a micro oxygen electrode. Microvasc. Res. 5:254–262. [DOI] [PubMed] [Google Scholar]


