

Abstract
The improvements of the force fields and the more accurate treatment of long-range interactions are providing more reliable molecular dynamics simulations of nucleic acids. The abilities of certain nucleic acid force fields to represent the structural and conformational properties of nucleic acids in solution are compared. The force fields are AMBER 4.1, BMS, CHARMM22, and CHARMM27; the comparison of the latter two is the primary focus of this paper. The performance of each force field is evaluated first on its ability to reproduce the B-DNA decamer d(CGATTAATCG)2 in solution with simulations in which the long-range electrostatics were treated by the particle mesh Ewald method; the crystal structure determined by Quintana et al. (1992) is used as the starting point for all simulations. A detailed analysis of the structural and solvation properties shows how well the different force fields can reproduce sequence-specific features. The results are compared with data from experimental and previous theoretical studies.
INTRODUCTION
Nucleic acids can adopt different conformations in solution depending on the base composition (Hunter, 1993) and the environment (for example pH and temperature, Kumar and Maiti, 1994), including the nature of the solvent (Fang et al., 1999), the counterions (Minasov et al., 1999), their concentration (Ali and Ali, 1997), and interactions with proteins (Jones et al., 1999), or small molecules (Reinert, 1999). Even a given sequence of DNA or RNA can exhibit multiple conformations (Kielkopf et al., 2000). In living systems, the conformational flexibility of DNA resides primarily in the polymorphs of the DNA double helix (including right-handed and left-handed double-helical DNA) that occur under various experimental conditions (Gupta et al., 1980). By contrast, double-stranded helical RNA is confined to two very similar polymorphs of the A form (A and A′), and the wide range of single-stranded nonhelical RNA folds introduces the essential structural variability.
Significant progress in the development of empirical force fields and molecular dynamics (MD) simulation methods has lead to a more reliable description of the structure, energetics, and dynamics of nucleic acids (Auffinger and Westhof, 1998; Beveridge and McConnell, 2000; Cheatham and Kollman, 2000; Cheatham and Young, 2000). However, some limitations related to the improper treatment of the equilibrium between the A and B forms of DNA (Feig and Pettitt, 1997, 1998) and the deviations of helicoidal parameters from canonical B values (Cheatham and Kollman, 1996) have been reported. The overstabilization of the A form relative to the B form of DNA (Yang and Pettitt, 1996; MacKerell, 1997; Feig and Pettitt, 1997) with the CHARMM22 force field (MacKerell et al., 1995) has been addressed in a recent reoptimization of the CHARMM22 all-atom nucleic acid force field. The new nucleic acid force field, called CHARMM27, has small but important changes in both the internal and interaction parameters relative to CHARMM22 (Foloppe and MacKerell, 2000) and appears to treat well the equilibrium between the A and B forms of DNA and the influence of the environment, such as the water activity (MacKerell and Banavali, 2000). A revised and improved version of the AMBER4.1 force field has also been presented that shows better agreement with experimental data as a result of the adjustment of internal force field parameters (Cheatham et al., 1999). An alternative nucleic acid force field, which we refer to as the Bristol-Myers Squibb (BMS) force field, has been developed by Langley (Langley, 1998). Both the CHARMM27 and AMBER force field parameters are based on the reproduction of experimental results for nucleic acid oligomers (e.g., condensed phase structural properties of DNA and RNA) and consistency with small molecule results obtained from quantum mechanical calculations and experimental data. The BMS force field was developed, in part, by adaptation of the CHARMM22 (MacKerell et al., 1995), QUANTA and AMBER force fields (Cornell et al. 1995. The backbone angle and dihedral parameters were derived from quantum mechanical calculations with refinements based on a series of MD simulations. All the force fields used condensed-phase MD simulations in the final stage of the parameter optimization. The CHARMM27 force field has also been applied to model compounds to evaluate the contributions from the individual moieties to the overall conformational properties of DNA and RNA (Foloppe and MacKerell, 2000).
Recent simulations of nucleic acids using an explicit solvent representation and an ionic environment have led to high structural stability on the nanosecond time scale (Beveridge and McConnell, 2000). This accuracy was achieved due to improvements of the force fields, as described above, the inclusion of an appropriate number of counterions, and the use of the Ewald method for the long-range electrostatic interactions after 1995 (Cheatham et al., 1995; Lee et al., 1995; York et al., 1995). The implementation of the particle-mesh-Ewald (PME) method (Feller et al., 1996), which is faster than standard Ewald method, allows accurate treatment of long-range electrostatic interactions while preserving a reasonable simulation time. It is becoming a standard in nucleic acid simulations, although some simulations with the CHARMM27 force field suggest that long-range electrostatic interactions can also be treated using cutoffs (Norberg and Nilsson, 1996). In addition to overall stability, force-field-based simulations should also reproduce the sequence-dependent structure variations in DNA, as manifested by the local backbone conformation and basepair geometry at different basepair steps, and the hydration patterns associated with these structural variations. In this paper, we present the results of molecular dynamics simulations that assess the ability of the CHARMM force fields, CHARMM22 (MacKerell et al., 1995) and CHARMM27 (Foloppe and MacKerell, 2000), to address the structure and dynamics of DNA in aqueous solution. For comparison, the performance of two additional force fields, the AMBER4.1 (Cornell et al., 1995) and BMS (Langley, 1998) force fields, is also examined. Our goal is to evaluate the ability of these force fields to address sequence-dependent aspects of the structure of DNA duplexes and DNA hydration. Simulations are carried out for a B-DNA decamer with a central TpA step, d(CGATTAATCG)2 (Quintana et al., 1992). This sequence is of particular interest because its structure, obtained at very high resolution (1.5 Å), shows certain twisting and bending properties. The minor groove is wide at the central TpA step rather than narrow, and the twist angle of the TpA step is small rather than large, contrary to other sequences with a central TTAA tetramer. The presence of a Mg2+ cation bound to DNA at the TpT step probably contributes to this local widening of the minor groove (Fig. 1). These properties appear to confer a greater possibility of deformation that could be exploited for sequence recognition by drugs and by proteins (Quintana et al., 1992; Goodsell et al., 1994).
FIGURE 1.

Secondary structure and numbering of the DNA decamer d(CGATTAATCG)2 (Quintana et al., 1992). The position of the Mg2+ binding site, in the minor groove, is indicated with the distances to O2 and N3 atoms of thymines and adenines, respectively. A dashed line joins the Pi and Pi+3 phosphorus atoms on opposing strands. The corresponding distances are used as measure of the minor groove width.
The DNA structures generated during the simulations are analyzed in terms of global structural parameters, such as the DNA form and the size of the major and minor grooves, and local structural parameters such as sugar pucker, phosphate backbone conformation, and basepair geometry. The relative conformational flexibility arising from the different force fields is determined by the fluctuations of these parameters during the dynamics. The DNA hydration and distribution of counterions is analyzed and compared with high resolution x-ray data (Egli et al., 1998; Tereshko et al., 1999). In the manuscript, (in preparation) on the structural and hydration changes in the transition from A- to B-DNA, it is shown that the DNA decamer, starting from the canonical A-DNA form with the CHARMM27 force field, can undergo a quick transition to the B form (in a simulation time as short as 1.4 ns). This contrasts with the CHARMM22 force field, which overstabilizes the A form. The A to B transition is analyzed to obtain an understanding of the contributing factors. It is shown that the internal motions and hydration of DNA are both involved in the transition.
METHOD
Molecular simulations
Simulations were performed with the CHARMM program (Brooks et al., 1983), in the constant NVT ensemble at 298 K. The leapfrog Verlet (Verlet, 1967) integration scheme was used with a 2-fs time step and SHAKE applied to all covalent bonds involving hydrogens (Ryckaert et al., 1977). Images were generated using the CRYSTAL module (Field and Karplus, 1992) in CHARMM. The different force fields used are all-atom force fields (both polar and nonpolar hydrogen are included) implemented in the CHARMM program. In all the MD simulations, electrostatic interactions are treated with the Ewald method (Ewald, 1921) as implemented in the PME formulation (Darden et al., 1993; Petersen, 1995); the latter was implemented in the CHARMM program by Feller et al. (1996). PME calculations were performed using a real space cutoff of 9 Å with Lennard-Jones interactions truncated at the same distance. A dielectric constant of unity was used. A convergence parameter (κ) of 0.32 Å−1 and a fifth degree B-spline interpolation was employed with the PME method. In the case of the AMBER force field, explicit scaling of 1-4 electrostatic function was applied, as recommended for nucleic acid simulations (Cheatham et al., 1995).
To neutralize the DNA molecule, 18 Na+ ions were introduced with each one initially placed at a distance of 6.0 Å from the phosphorous atom on the perpendicular bisector defined by the phosphorous and nonbridging oxygen atoms; the ions were fixed in the first stage of the simulation to allow the water molecules to relax around the DNA and counterions. The model was minimized for 1000 steps with the Adopted Basis Newton Raphson (ABNR) method. Periodic boundary conditions were defined using an orthorhombic box (36.0 Å × 40.0 Å × 46.5 Å) filled with TIP3P model water molecules (Jorgensen et al., 1983) so that the minimum thickness of the solvation shell around the DNA and counterions centered in the box was 5 Å. The water molecules in the box were minimized for 400 steps of the Steepest Descent (SD) method. The box was then overlaid onto the system of the DNA decamer model with the sodium ions. Solvent molecules with the oxygen within 2.7 Å of any DNA nonhydrogen atom or any sodium ion were deleted. The solvent was minimized for 100 steps of SD followed by 1000 steps of ABNR, keeping the DNA and ions fixed. After that, the entire model was minimized for 2000 steps with the ABNR method before starting the simulations.
During the equilibration, the structure was relaxed in stages, so that the most strained parts of the system could adjust without introducing artifacts. Harmonic constraints with a force constant of 1 kcal/mol-Å were used. Initially, the DNA and Na+ ions were constrained and only water molecules were allowed to move. The water molecules were simulated at 298 K for 40 ps. The constraints on the ions were released and the water and ions were reheated gradually from 0 to 298 K at increments of 100 K, each for 20 ps for a total of 100 ps. These stages were carried out in the NPT ensemble (T = 298 K, P = 1 atm), so that the water box could equilibrate in accord with the number of 1947 water molecules included in the simulation system. The dimensions of water box were allowed to vary only along the z-axis, because the DNA molecule is oriented in that direction. During the course of the100 ps simulation, the box dimension fluctuated by 2–3 Å from the initial value. Then, the constraints on DNA were removed, and it was allowed to move along with the ions and water molecules, except that NOE-like distance constraints on the terminal basepairs of DNA between the heavy atoms involved in hydrogen bonds were introduced. The distance constraints applied with a force constant of 10 kcal/mol-Å correspond to the distances observed in the x-ray structure with an allowed deviation of ∼0.2 Å. For subsequent simulations, the NVT ensemble was used, as it provides more stable trajectories (Brown and Clarke, 1984). The system was reequilibrated by heating the entire model at increments of 50 K for 20 ps each, from 0 to 298 K. Then a 30-ps simulation was run at 298 K to equilibrate the entire system at this temperature. The heating and equilibration phase of dynamics thus lasted 250 ps for each of the MD simulations. The production simulation was then started and continued for an additional 950 ps at an average temperature 298 K yielding a total simulation time of 1200 ps with each force field. The distance constraints on the terminal basepairs were present during the production simulation. In previous simulations, distance constraints have been used in some cases (Auffinger and Westhof, 1997) and not in others (Cheatham and Kollman, 1996); in the latter there are usually significant distortions in these basepairs and they are not included in the analysis. The simulations with the CHARMM27 force field were extended to 2000 ps, with both B- and A-type DNA starting structures; the B-DNA starting structure corresponded to the x-ray structure (Quintana et al., 1992) and the A-DNA to the canonical A form (Arnott and Hukins, 1972).
Structural analysis
IUPAC-IUB and EMBO nomenclature (IUPAC-IUB joint commission on Biochemical Nomenclature, 1983; EMBO Workshop, 1989) for nucleic acids were followed for the representation of conformational and helicoidal parameters of DNA, respectively. The antiparallel chains of DNA were specified as strand A with nucleotide residues from A1 to A10 and in strand B from B1 to B10 (Fig. 1). The conformational and helicoidal parameters of the double helix for the analysis of DNA structures were calculated, excluding the terminal residues/basepairs which exhibit larger fluctuations than internal basepairs. In the case of the calculated average DNA structures, a minimization of 500 steps of SD was performed before analysis of the structural parameters (average values and standard deviations) to remove unfavorable steric interactions; these arise, in particular, from hydrogen atoms of rotatable methyl groups on the thymines. Root-mean-square deviations (RMSD) were calculated between the DNA structures from the simulation and the minimized x-ray structure, and the canonical A-DNA or B-DNA structures. The RMSD was evaluated after least-square fitting of all the DNA heavy atoms, except for the terminal basepairs. Base helicoidal parameters were evaluated using the program FREEHELIX (Dickerson, 1998). Conformational and helicoidal parameters of canonical A-type DNA (Arnott and Hukins, 1972) and B-type DNA (Arnott and Hukins, 1973), designated hereafter as A and B, were evaluated from DNA duplexes generated with the program InsightII (Molecular Simulation Inc., San Diego, CA, version 98.0).
A cluster analysis was performed to identify a number of representative conformations from each simulation. Root mean square deviations calculated along the simulation with respect to the average structure show that five clusters can be generated using a cluster radius between 1.2 Å (BMS) and 1.9 Å (AMBER and CHARMM). A two-dimensional matrix of the RMSD between 1200 sets of DNA coordinates from the simulation (one every 1 ps) and the x-ray structure was built using the CHARMM program. A RMSD threshold value was chosen so that the 1200 DNA coordinates are distributed in five different clusters for all the force fields, each member of the cluster being more similar to all members of the same cluster and more dissimilar to any member of the four other clusters. The coordinate sets were then organized into five subsets based on the RMSD threshold values, using the program QUANTA (Molecular Simulation Inc., version 98). All the conformers in one subset have RMSDs of less than 1.8 Å from each other. The clusters contain between 96 and 546 coordinate sets. Average coordinates for each cluster were calculated and the conformer having the lowest RMSD with respect to the average structure was chosen as the cluster representative. The five cluster representatives were used for the detailed analysis of the conformational and helicoidal parameters. The RMSD between the five cluster representatives generally varies from 1.2 Å to 1.9 Å (e.g., between 1.3 Å and 1.9 Å for the simulation with the CHARMM27 force field).
Water and ion distributions were computed from the trajectories using the program Surfnet, which generates three-dimensional density distributions of data points and which has been widely used to analyze intermolecular interactions (Laskowski, 1995). Before generation of the distributions, a root mean square fit was carried out between all the DNA conformers obtained from the simulation and the average structure used as reference. The superimposition of all the DNA conformers on the reference structure leads to a distribution of data points corresponding to the water oxygens and sodium ions. A map of these points was written by counting the number of oxygen or sodium atoms on a grid with (144 × 160 × 179) grid points in the (x,y,z) directions, corresponding to a grid separation of 0.25 Å. No correction was applied to account for the nearest periodic images of water or sodium atoms because they lead to only small underestimations of the density at the corners of the box. The grid maps were then contoured using the program InsightII to visualize high-density regions and identify specific hydration patterns.
RESULTS AND DISCUSSION
General features and average structural parameters
The results for the RMSD versus time with respect to the x-ray, canonical B, and canonical A structures are shown in Fig. 2. The MD structure simulated with CHARMM22 exhibits significant deviations from both the experimental B structure (3.8 Å) and canonical B-DNA structure (4.2 Å). After 600 ps, the structure is close to a canonical A-DNA with a RMSD of less than 2.0 Å. This corresponds to a B to A transition. CHARMM27 yields a stable B-DNA structure with a small RMSD, both from the x-ray structure (1.8 Å) and canonical B-DNA (2.2 Å); i.e., it remains slightly closer to the x-ray structure. The AMBER and BMS force fields give a MD structure that deviates more or less equally from the x-ray structure and the canonical B-DNA. The BMS force field has the best agreement with the x-ray structure with an average RMSD of ∼1.5 Å. In all cases, there is a clear anticorrelation between the RMSD with respect to the canonical A-DNA and B-DNA forms. For CHARMM27, in a simulation of two B-DNA duplexes, MacKerell and Banavali (2000) found that as the MD structure deviates from canonical B-DNA, it moves toward canonical A-DNA and vice versa. They demonstrated that this behavior is specific to DNA (and not to RNA). They also showed that CHARMM27 can address conformational changes involved in the A to B or B to A transitions, as influenced, for example, by the ionic environment. The intersection of the curves representing the RMSD versus time with respect to canonical A- and B-DNA in the case of the AMBER and CHARMM27 force fields (e.g. at 500 ps for CHARMM27) reflects a significant sampling of the conformational space between the A and B forms. This highly anticorrelated behavior is common to the CHARMM force fields; the correlation coefficient for the A versus B RMSD is −0.96 for both CHARMM22 and CHARMM27. For the AMBER force field, the correlation coefficient is −0.80. For the BMS force field, the simulated DNA remains close to B-DNA during the entire simulation; the correlation coefficient is −0.68.
FIGURE 2.

Root mean square deviation of all atoms, excluding the end basepairs of the DNA duplex, d(CGATTAATCG)2, versus simulation time using different force fields: (a) CHARMM22, (b) CHARMM27, (c) AMBER, (d) BMS. Deviations from the minimized crystal, canonical B-DNA, and canonical A-DNA structures are indicated by the solid, dotted and dashed lines, respectively.
Table 1 gives the details of the conformational and helicoidal parameters and minor groove distances of the simulated duplexes averaged for the period from 601 to 1200 ps; the corresponding values for canonical A-DNA and B-DNA and the x-ray structure are also listed.
TABLE 1.
Comparison of conformational and helical parameters and minor groove distance of d(CGATTAATCG)2 DNA duplexes and MD simulated structures obtained with different force fields
| Average simulated structure* | |||||||
|---|---|---|---|---|---|---|---|
| Canonical A-DNA | Canonical B-DNA | Crystal structure | CHARMM22 | CHARMM27 | BMS | AMBER | |
| α (°) | 276 | 313.2 | 303.9(13.5) | 289.3(14.4) | 304.1(16.3) | 298.1(7.0) | 297.5(11.4) |
| β (°) | 208 | 214 | 179.1 (2.8) | 167.3(27.3) | 159.4(25.4) | 171.2(24.0) | 160.3(28.5) |
| γ (°) | 45.5 | 36.4 | 47.8(10.3) | 57.7(4.9) | 54.7(12.4) | 52.2(5.7) | 52.8(6.5) |
| δ (°) | 84.3 | 156.4 | 127.1(15.9) | 94.1(16.6) | 128.2(14.0) | 133.7(19.3) | 126.8(18.6) |
| ɛ (°) | 179.5 | 155 | 184.2(25.6) | 205.1(10.3) | 191.9(6.7) | 201.0(25.6) | 211.0(29.8) |
| ζ (°) | 311 | 264.8 | 260.1(28.9) | 282.9(7.5) | 244.7(17.8) | 242.1(40.8) | 237.3(46.7) |
| χ (°) | 206 | 262 | 245.4(16.2) | 203.4(14.9) | 247.8(15.4) | 249.1(17.8) | 246.6(18.3) |
| Pucker (°) | 13.3 | 191.8 | 139.4(38.1) | 45.8(47.7) | 136.4(39.1) | 138.1(39.1) | 137.6(25.1) |
| Amplitude (°) | 40.2 | 37.5 | 36.5(7.5) | 37.5(9.6) | 39.1(5.5) | 39.6(7.9) | 40.1(7.1) |
| Base step parameters: | |||||||
| Tilt (°) | 0 | 0 | 0.1(1.9) | −1.4(2.5) | −1.5(4.4) | 0.1(2.5) | −0.2(4.2) |
| Slide (Å) | −1.53 | −0.16 | −0.10(0.38) | −1.59(0.43) | −0.18(0.23) | 0.09(0.55) | −0.08(0.59) |
| Roll (°) | 10.7(2.2) | −3.6 | 0.0(5.1) | 6.4(7.5) | 3.9(8.8) | 1.3(4.4) | 1.7(5.8) |
| Shift (Å) | 0 | 0 | 0.03(0.27) | 0.16(0.56) | −0.17(0.69) | 0.07(0.75) | 0.03(0.78) |
| Twist (°) | 32.7 | 36 | 36.9(3.7) | 28.5(5.1) | 35.1(2.2) | 36.1(3.6) | 33.9(3.9) |
| Rise (Å) | 2.56 | 3.37 | 3.20(0.21) | 3.39(0.39) | 3.4(0.29) | 3.20(0.20) | 3.39(0.17) |
| Basepair parameters: | |||||||
| Tip (°) | 0 | 0 | −0.8(3.4) | 2.3(7.8) | 0.9(6.1) | 0.2(4.1) | 0.1(5.1) |
| Prop. twist (°) | 11.7 | 4.3 | −14.2(3.1) | −10.6(6.8) | −6.2(11.9) | −7.2(5.0) | −6.4(7.4) |
| Buckle (°) | 0 | 0 | −2.5(6.3) | −3.2(14.6) | 3.7(8.4) | −0.7(7.4) | 1.1(4.3) |
| Inclination (°) | 19.9 | −5.7 | 0.3(1.2) | 16.9(3.4) | 7.3(2.7) | 3.5(2.2) | 5.2(1.7) |
| X-disp. (Å) | −4.49 | 0.23 | −0.27(0.42) | −4.92(0.66) | −1.29(0.42) | −0.49(0.93) | −0.87(0.58) |
| Y-disp (Å) | 0 | 0 | 0.22(0.60) | −0.51(0.49) | 0.14(0.65) | 0.53(0.65) | −0.36(0.47) |
| Minor groove distances (Å)†: | |||||||
| PA4…PB10 | 16.95 | 13.17 | 10.48 | 15.33 | 14.57 | 14.47 | 12.91 |
| PA5…PB9 | 16.95 | 13.17 | 11.49 | 15.25 | 14.81 | 14.46 | 11.87 |
| PA6…PB8 | 16.95 | 13.17 | 13.15 | 14.87 | 13.31 | 15.01 | 13.05 |
| PA7…PB7 | 16.95 | 13.17 | 13.68 | 15.09 | 13.41 | 13.07 | 13.19 |
| PA8…PB6 | 16.95 | 13.17 | 12.68 | 15.31 | 12.71 | 11.72 | 13.24 |
| PA9…PB5 | 16.95 | 13.17 | 11.85 | 15.86 | 13.86 | 12.69 | 13.48 |
| PA10…PB4 | 16.95 | 13.17 | 11.09 | 14.65 | 15.82 | 15.12 | 13.62 |
Averages of conformational and helical parameters exclude the end basepairs of DNA. Values in parentheses correspond to standard deviations.
The values for the torsions, base step and basepair parameters are averaged over the simulation time.
The minor groove distances are calculated between the phosphorus atoms Pi on one strand and Pi+3 on the opposing strand.
A-DNA and B-DNA conformations are differentiated by certain features related to the conformation of the phosphodiester backbone and the geometry of the nucleic acid bases (base stacking and basepairing). The sugar pucker is partly responsible for the DNA form adopted; other backbone movements can vary without changing the backbone conformation due to crankshaft-type displacements. The pucker, characterized by the pseudorotation angle, tends to have values corresponding to C3′-endo/C2′-exo (P from −36° to +36°) and C3′-exo/C2′-endo (P from 137° to 194°) in A-DNA and B-DNA respectively. The base stacking is primarily determined by the basepair separation and in particular the rise, which significantly differs between the A form (2.56 Å) and the B form (3.37 Å). It is also influenced by the relative orientation of adjacent basepairs (twist, slide). Helical twist varies considerably in B-type helices (35°–45°); in A-DNA the variation of twist is less (30°–33°). The large variations of twist in B-DNA and the small difference between the A and B forms makes the identification difficult in terms of this parameter. The slide, corresponding to the relative displacement between two adjacent basepairs along their longitudinal axis, can be used to distinguish the A (−1.7 Å) and B forms (+0.4 Å) because of the small magnitude of its variation and its strong correlation with helical twist. Basepairs are also significantly displaced from the helix axis (X-displacement) into the major groove by −4.4 to −4.9 Å in A-DNA and into the minor groove (0.2–1.8 Å) in B-DNA. This affects the macroscopic structure of the grooves of the helix, resulting in a narrow minor groove in B-DNA and a wide major groove in A-DNA, as described above. The inclination of basepairs to the helix axis is positive (10°–20°) in A-type, whereas it is negative (−6°–16.5°) in B-type.
The comparison of the torsions and parameters related to the geometry of the basepairs confirms the previous trend: CHARMM22 yields an A-like DNA whereas CHARMM27 yields a B-like geometry in good agreement with the x-ray structure (Table 1). Most of the torsion angles generated with CHARMM22 correspond to an A-like geometry for the phosphate backbone (α, ɛ, ζ) including the sugar pucker (δ corresponding to C3′-endo). The same holds true for the basepair geometry of the nucleic acid bases (χ). The particular orientation of the nucleic acid base (χ ≈ −156°) corresponds to an inclination of ∼20° of the basepair planes with respect to the plane perpendicular to the helical axis observed in A-DNA, whereas there is almost no inclination of the basepairs in B-DNA. The X-displacement is another basepair parameter that can be used to discriminate between A and B-DNA because it gives a measure of the depth of the major groove. Again, the average structure obtained with CHARMM22 is close to the A form. The relative orientations of successive basepairs, defined by the base step parameters, differ between A and B-DNA particularly in the slide (relative translation of the basepairs about the long axis of the base step), roll (relative rotation of the basepairs about the long axis of the base step), and twist (relative rotation of the basepairs about an axis perpendicular to the plane of the base step). Based on these parameters, the geometry of the double helix in the CHARMM22 simulation corresponds to that of A-DNA, even if the average rise is very close to that of a standard B-DNA (Table 1).
The average structure obtained with CHARMM27 exhibits torsion angles corresponding to the B form and close to those of the x-ray structure. The CHARMM27 force field correctly reproduces the average ɛ and ζ torsion angles, related to the conformation of the phosphate groups. The AMBER and BMS force fields, give values that deviate slightly more from those of the x-ray structure. Regarding the geometry of the basepairs, the roll and inclination are systematically larger in comparison with those of the x-ray structure. They are also somewhat too large, as well as with the AMBER force field, whereas the helical twist is smaller than the standard values for B-DNA and for the x-ray structure. A decrease in the average value of propeller twist of basepairs relative to the x-ray structure is found in all the MD structures. The geometry of the basepairs that differs least from the x-ray structure is obtained with the BMS force field.
Because the CHARMM22 force field leads to an A-like DNA, the minor groove is wide and shallow (whereas it is deep and narrow in the B-DNA structure); the distance between phosphorous atoms across the minor groove (Pi on one strand and Pi+3 on the opposing strand, Fig. 1) are all more than 1.4 Å over 13.17 Å, a distance that corresponds to the minor groove width for a canonical B-DNA (Table 1). Although the minor groove is slightly wider than in B-DNA in the structure simulated with CHARMM27, it is considerably narrower and B-DNA like.
The minor groove is locally wider at the terminal basepairs (PA4-PB10, PA5-PB9, PA9-PB5, PA10-PB4) and narrower at the center, in particular at the ApA (A6A7) step (PA8-PB6, Table 1). It is also relatively narrow at the TpT and TpA basepair steps (PA6-PB8, PA7-PB7). It differs from the x-ray structure where the minor groove morphology is reversed: a local widening at the central basepair steps (PA6-PB8, PA7-PB7, PA8-PB6), and narrowing at the terminal basepair steps. The BMS force field gives a more similar minor groove morphology than CHARMM27: a local narrowing at the central basepair steps (TpA and ApA) but shifted toward the ApT step (A7A8). By contrast, the AMBER force field leads to a local widening at the three first terminal basepair steps GpA, ApT, and TpT. None of the force field reproduce a local widening at the center of the double helix. These discrepencies between the x-ray structure and the simulated structures will be discussed later.
The dynamic behavior of structural parameters specific to A- and B-DNA
As the dynamic changes in sugar pucker influence the backbone conformation, the variations of the pucker during the MD trajectories are of interest (Fig. 3). Most of the nucleotides adopt a C3′-endo conformation after the B to A transition observed with CHARMM22 at 600 ps (Fig. 3 a); the sugar conversion from C2′-endo to C3′-endo occur earlier (375 ps) at some positions (B2, B3, B7), simultaneously (A2, A5, A6), or later at other positions (A3, A4, B4, B5, B8, B7, B9). These results are consistent with the average parameters (Table 1), showing that the CHARMM22 force field favors A-type over B-type DNA, and contrast with those obtained with the CHARMM27 force field for which the preferred sugar pucker is C2′-endo (Fig. 3 b). Some C2′-endo to C3′-endo transitions with a short lifetime for the C3′-endo pucker (less than 80 ps) are observed with CHARMM27. They occur at a few positions via a O4′-endo intermediate (P ≈ 90°) at A3, A7, B4. Some very short transitions C2′-endo to C3′-endo and back to C2′-endo are also observed at positions A4 and A8 (Fig. 3 a). Nevertheless, the more stable sugar pucker is C2′-endo at all the positions, except for B7 which conserves a C3′-endo conformation during the entire simulation. For the other force fields, AMBER and BMS (Fig. 3, c and d,), C2′-endo to C3′-endo transitions, and back to C2′-endo via a O4′-endo intermediate, are also observed at various positions. The deviations from the standard pucker forms (C2′-endo or C3′-endo) tend to be larger with the AMBER and BMS force fields. The strong tendency for B7 to adopt a C3′-endo conformation with CHARMM27, AMBER, and BMS is consistent with the x-ray data (Quintana et al., 1992).
FIGURE 3.
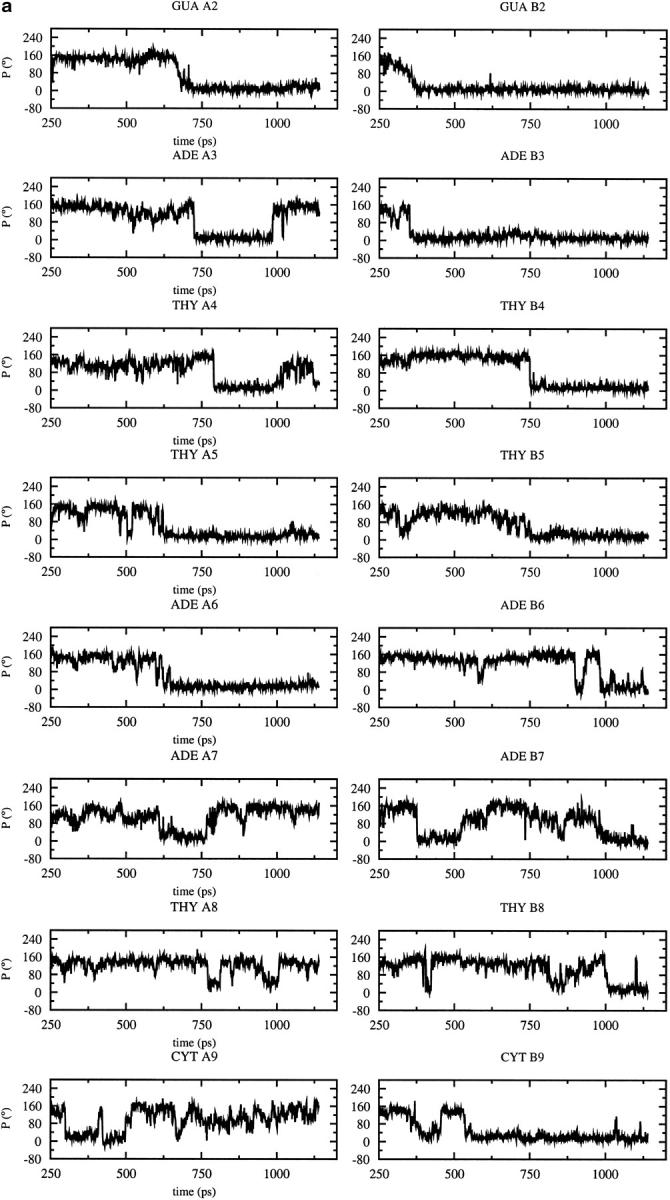
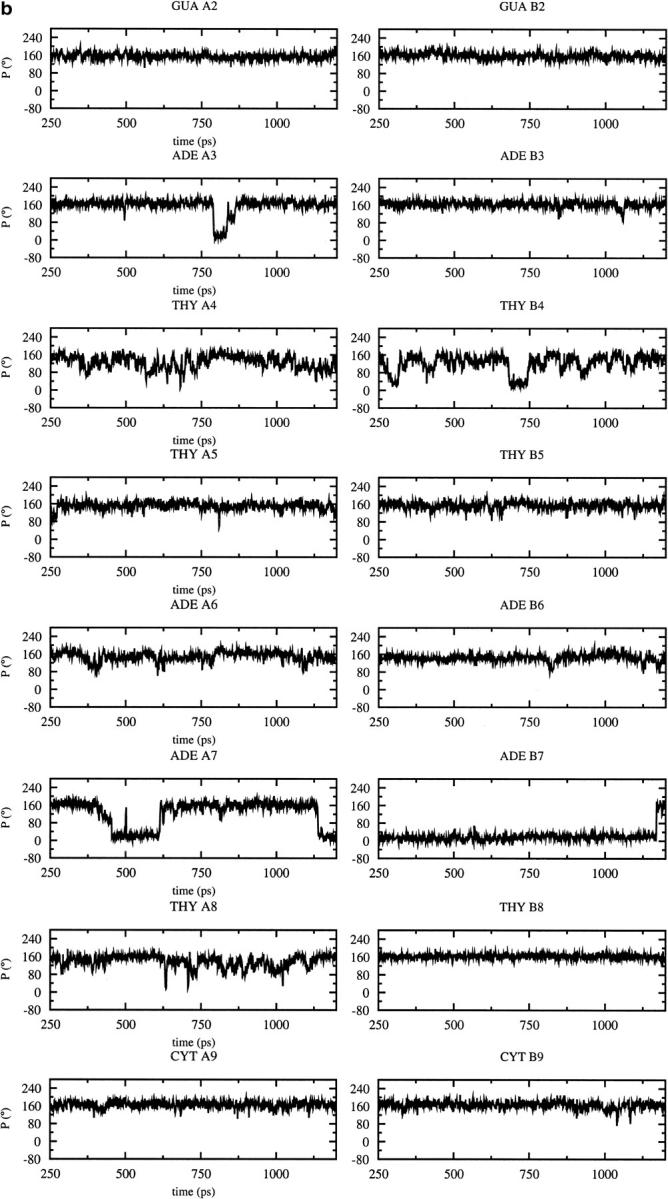
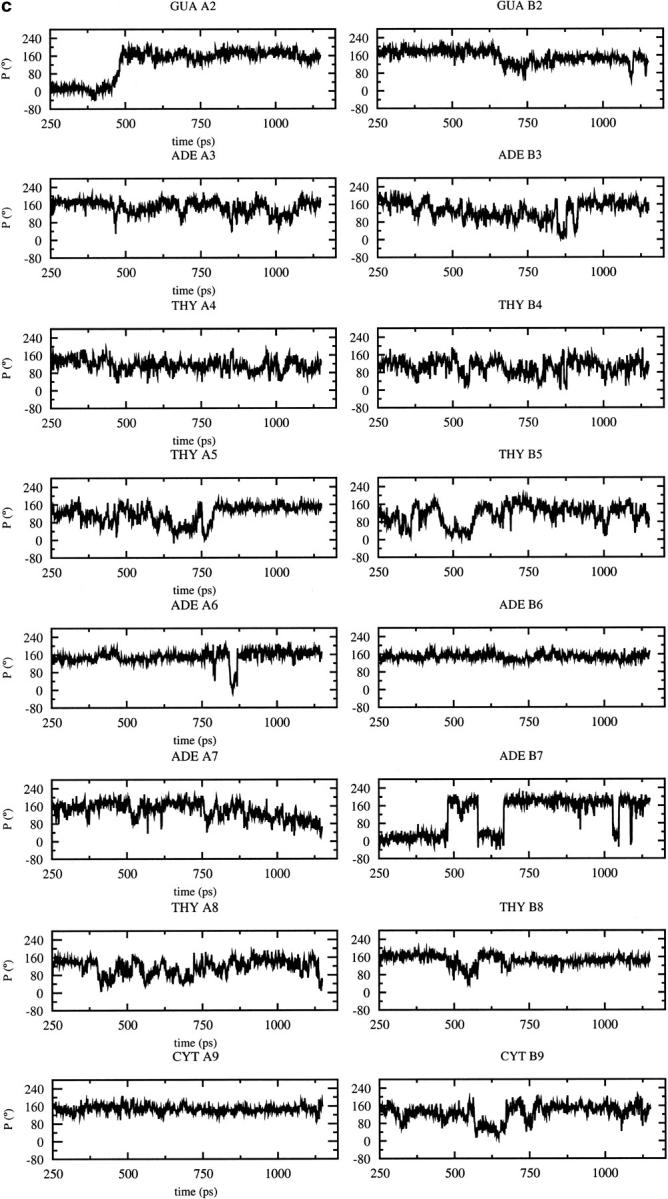
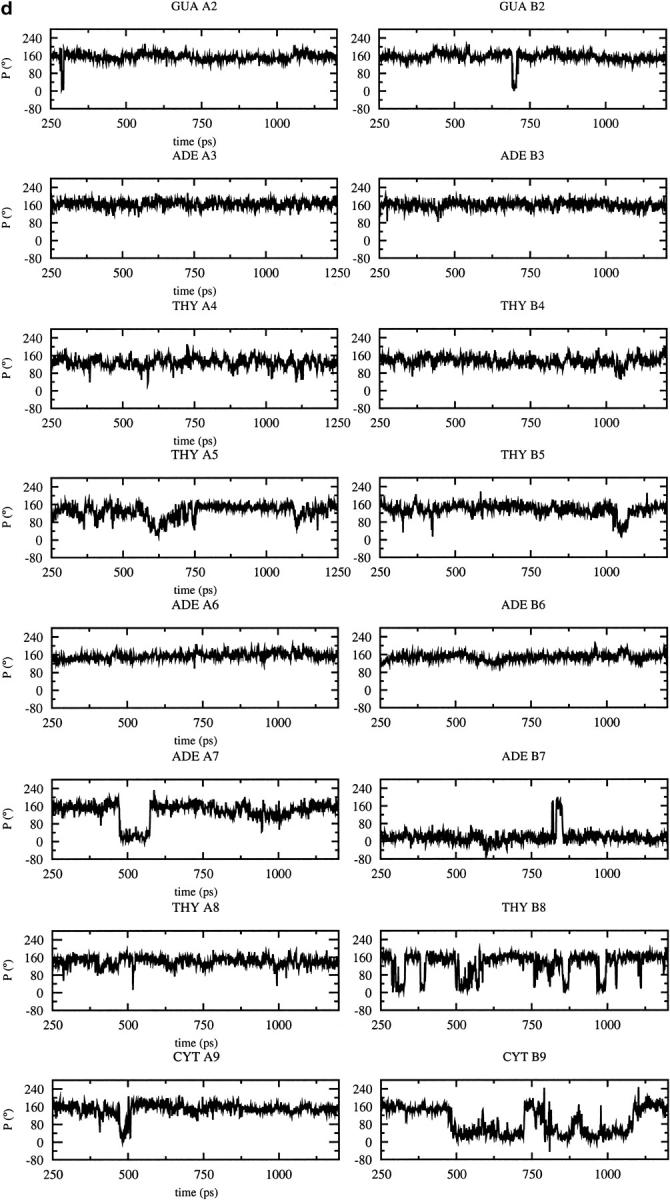
Time dependence of the sugar pseudorotation angle at the all nucleotide positions of the DNA decamer except at the terminal basepairs using different force fields: (a) CHARMM22, (b) CHARMM27, (c) AMBER, (d) BMS.
Although the average torsion and pseudorotation angles provide a description of the general conformational features related to A or B-DNA, discrepancies are observed at particular positions; B7, already mentioned above, is one example. Similarly, the double helix, whose morphology can be evaluated using the base step parameters, can be locally distorted at some positions even if the average parameters are in agreement with a given canonical DNA. The rise between adjacent basepairs, for example, exhibits quite large fluctuations, which are equivalent in magnitude to the difference between the standard values for the A and B forms (see Table 1 and Fig. 4). Despite an A-like conformation, the structure obtained with CHARMM22 is characterized by an average rise closer to canonical B-DNA. Most of the basepair steps exhibit a bistable behavior with an initial value of rise generally close to the standard B value and a final value close to the standard A value. This is particularly evident at the ApT (AT/AT: A3A4/B7B8), TpT (TT/AA: A4A5/B6B7), and TpC (TC/GA: A8A9/B2B3) basepair steps (Fig. 4 a). The rise is closer to the standard B value with CHARMM27 (Fig. 4 b), but it oscillates between the standard A and B values except for the ApT (AT/AT: A3A4/B7B8) and the central TpA (TA/TA: A5A6/B5B6) basepair steps, which exhibit a rise closer to that of a standard B-DNA. Similar behavior is observed in the simulation with BMS (Fig. 4 c, Supplementary Material) whereas the fluctuations in rise observed with AMBER are generally smaller and centered around a standard rise value for the B form (Fig. 4 d, Supplementary Material). The most striking feature that is shared by the MD structures simulated with all the force fields is the high rise at the central TpA (A5A6) basepair step (Fig. 4 b). Although high rise is not specific to TpA steps, it is known as a flexible basepair step whereas ApT, ApA, and TpT are known as rigid basepair steps (El Hassan and Calladine, 1996).
FIGURE 4.


Time dependence of the twist (solid line) and rise (dotted line) at the basepair steps of the B-DNA decamer using the CHARMM force fields: (a) CHARMM22, (b) CHARMM27. The standard values for the canonical A- and B-DNA are represented by dotted lines for the twist and dashed line for the rise; in both cases, the upper one corresponds to the B value and the lower one to the A value. Fig. 4, c and d are in Supplementary Material.
The helical twist also shows fluctuations, which are larger than the difference between the standard A and B values. Although the helical twist is only approximately anticorrelated with the rise, the basepair steps with low rise tend to have high twist and vice versa for a given DNA form (Fig. 4, a and b). In the simulation with CHARMM22, most of the basepair steps have a high twist/low rise profile, then they tend to adopt a low twist/high rise profile (Fig. 4 a). For example, the basepair steps ApT (AT/AT: A3A4/B7B8 and A7A8/B3B4) and the TpT (TT/AA: A4A5/B6B7) switch from the high rise/low twist state to the low rise/high twist state after the B to A conversion in the simulation with CHARMM22 (Fig. 4 a). For the other basepair steps, the average twist value is generally closer to the A value. At the end of the simulation, all basepair steps present a twist/rise profile corresponding to A-like DNA (Fig. 4 a). For CHARMM27, the twist value is close to the standard B value with short transitions toward the A value (Fig. 4 b). Most of the basepair steps exhibit the high twist/low rise state; the twist value is slightly more than that of canonical B and the rise value is close to the canonical B value. It concerns more particularly the purine-purine (GA/TC and AA/TT) and pyrimidine-pyrimidine basepair steps (TT/AA and TC/GA). The exception concerns the two ApT basepair steps (AT/AT: A3A4/B7B8 and A7A8/B3B4), which exhibit a twist closer to the standard A value; this is true also for the central TpA basepair step (TA/TA: A5A6/B5B6). This central TpA basepair step shows a high rise/low twist state, a feature observed in the x-ray structure, as mentioned above for the twist. Structural analyses of DNA structures have shown that TpA steps can adopt the lowest twist (30.6° ± 6.7°, El Hassan and Calladine, 1996). The purine-purine and pyrimidine-pyrimidine basepair steps are the more prone to switch between high twist/low rise and low twist/high rise profiles (Nelson et al., 1987). It occurs at different times during the simulation for the GA/TC and AA/TT basepair steps (Fig. 4 b).
Similar features are observed with BMS and AMBER (Fig. 4, c and d, Supplementary Material). In the case of the GA/TC and TC/GA basepair steps, the deviations in twist and rise, when switching from the high twist/low rise to the low twist/high rise state, are more pronounced with AMBER (Fig. 4 c, Supplementary Material). The twist has a bistable behavior oscillating between the standard A and B values. A common feature in the simulations with CHARMM27, BMS, and AMBER are the very large fluctuations of twist at the central TpA basepair step. These fluctuations correspond to unstacking of the bases at the TpA step (high rise) and changes in the backbone conformation via BI/BII transitions (the BII phosphate conformation requiring the two bases linked to the phosphate to be unstacked). This is related to the local widening of the minor groove in regions where BII conformations are present for basepairs diagonally opposite each other across the groove.
The X-displacement, corresponding to the depth of the major groove, changes in a concerted way at all basepair steps (Fig. 5). This behavior is more obvious in the case of the simulation with CHARMM22 because the wide major groove (B-DNA) becomes deep and narrow (A-DNA) after the B to A transition, taking place at 750 ps (Fig. 5 a). The transition is preceded by a sharp change at 600 ps corresponding to a more B-like conformation before the DNA continues a gradual conversion to the A form. CHARMM27 tends to overestimate the depth of the major groove, which oscillates between the standard A and B values in a concerted way at all the basepairs (Fig. 5 b). AMBER gives similar behavior, with an X-displacement that is only slightly overestimated and closer to the standard B value (Fig. 5 c, Supplementary Material). The X-displacement deviates very little with BMS and stays close to the standard B value (Fig. 5 d, Supplementary Material). The inclination of the basepairs also changes in a concerted way (Fig. 5). The inclination and X-displacement are strongly anticorrelated (the correlation coefficient is around −0.7 at most basepair steps) with CHARMM22 (Fig. 5 a). Despite their common behavior, the rise and X-displacement are not significantly correlated in the CHARMM27 simulation (the maximum correlation coefficient is −0.5), although high rise tends to be associated with low X-displacement and vice versa, in particular at the central basepair steps (Fig. 5 b). The inclination is overestimated with CHARMM27 at all the basepair steps. It is also overestimated, although slightly less, with AMBER but no significant anticorrelation is observed between inclination and X-displacement (the maximum correlation coefficient is –0.34 at the TT/AA basepair step and almost null at the other basepair steps; see Fig. 5 c, Supplementary Material) or with BMS which gives an inclination closer to its standard B value (the maximum correlation coefficient is −0.27 at the TC/GA basepair step and almost null at the other basepair steps, see Fig. 5 d, Supplementary Material). Feig and Pettitt (1997) suggested that the anticorrelation between the inclination and the X-displacement is related to a change in the accessibility of the major groove; that is, when the number of water molecules in the major groove decreases, going for example from a wide major groove (B-DNA) to a narrow major groove (A-DNA), the desolvation of some functional groups in the groove induces an increase of the base inclination angle. We observe a correlation between the fluctuations of the X-displacement and the solvent accessible surface of the major groove calculated by the Lee and Richards method (Lee and Richards, 1971). The stronger anticorrelation between X-displacement and inclination at T:A basepairs is consistent with the fact that adenines are more easily desolvated, in particular in A-DNA (Egli et al., 1998). This feature of DNA solvation is documented in the manuscript which describes the solvation changes associated with the A to B transition (F. Leclerc, S. Y. Reddy, and M. Karplus, unpublished).
FIGURE 5.


Time dependence of the inclination (solid line) and X-displacement (dotted line) at the basepairs of the B-DNA decamer using the CHARMM force fields: (a) CHARMM22, (b) CHARMM27. The standard values for the canonical A- and B-DNA are represented by dotted lines for the inclination (the upper one corresponds to the A value and the lower one to the B value). Dashed lines are used for the X-displacement (the upper one corresponds to the B value and the lower one to the A value). Fig. 5, c and d are in Supplementary Material.
Sequence dependence of the conformational flexibility
To determine the influence of the force field on the conformational flexibility and its sequence dependence, we have analyzed more precisely the backbone and base conformations and compared the simulation results with available experimental data and previous theoretical studies. The CHARMM22 force field calculations are not included because they deviate significantly from the experimental data on B-DNA, as described above. The dynamical behavior of the phosphate backbone can be described by two conformational substates, BI and BII, which are determined by the orientation of the phosphate group. The phosphate group can adopt two conformations: BI with values of ɛ and ζ in the range 120–210° (trans, t) and 235–295° (gauche−, g−), respectively; and BII with torsions ɛ and ζ values in the range 210–300° (gauche−, g−) and 150–210° (trans, t). The conformation of the phosphate group is a good criterion for the evaluation of the conformational flexibility because the interconversion between these two substates is dependent on base destacking and leads to changes in the width of the minor groove. To determine to what extent the force fields can reproduce sequence specific average structural features (comparison with the x-ray structure) and the local conformational flexibility (comparison with analyses of other DNA structures), we use the helicoidal parameters that were introduced in the previous section. For this analysis, we select the five representative conformers from the MD trajectory; they were identified by a cluster analysis, as described in the Methods section. Although we did omit from our simulations the Mg2+ cation bound at the TpT base step in the x-ray structure, we do not expect any significant change in basepair or base step parameters. Because the Mg2+ cation is bound quite deep in the minor groove and not at the top of the minor groove, it has a negligible effect on roll, tilt, and bending (Chiu and Dickerson, 2000).
In the simulation with CHARMM27, substate BI is found to be dominant for all positions, except B6 where the first half of the trajectory corresponds to BII and the second half to BI. There are BI-BII interconversions with a BII life up to 100 ps at many but not all of the positions (the variations of the backbone torsions ɛ and ζ with the different force fields are given in Fig. 6). The nucleotides at the termini, A2:B9 and A9:B2, show BI-BII interconversions as expected because of the ease of base destacking at the ends the double helix. All the other nucleotides preserve a BI conformation, except for those of the central TA base step (A5A6/B5B6). Generally, similar behavior is observed with the AMBER and BMS force fields, although the BII conformation is more persistent and as populated as the BI conformation at A5, A6, A9, and B8 for AMBER, at A5, A6, A9 for BMS; at B6, it is the more populated conformation for both AMBER and BMS. In the x-ray structure, apart from the nucleotides at the terminal basepairs A1 and B1, only A6 and B6 have a BII conformation; BI-BII interconversions are observed at these two positions with all the force fields. The simulation results are in agreement with the x-ray data showing a preference for BI (63–69%) over BII (22–29%) in a survey of about 60 B-DNA structures (Winger et al., 1998). The three force fields can reproduce most of the sequence specific structural features of the DNA backbone related to the sugar pucker (C3′-endo conformation at B7) or the phosphate conformation (BII conformation at A6 and B6).
FIGURE 6.

Basepair parameters (X-displacement and inclination) of the five representative conformations for: CHARMM27, AMBER, and BMS. The bold solid line marked by circles represents the basepair parameter of the x-ray structure; the solid line marked by stars represents the basepair parameter averaged over the five conformations; each of the other lines represents a different conformation.
The results can be compared with a structural analysis performed on eight DNA structures, which has shown that the basepair parameters have large deviations from those of ideal B-DNA, which depend on the nearest-neighbor bases. With CHARMM27, the three more sequence-dependent parameters, (tip, propeller twist, and buckle) show large deviations from the ideal values: up to 25° for the tip, 30° for the propeller twist, and 50° for the buckle at A:T basepairs; the maximum deviations observed in the analysis by Lam and Au-Yeung (1997) are 7°, 10°, and 9° respectively. In the x-ray structure of the d(CGATTAATCG)2 decamer (Quintana et al., 1992), the maximum deviation in propeller twist between two A:T basepairs is 10.5° (between A6:B5 and B3:A8). However, despite these large variations in the simulations, the sequence-specific basepair variability is preserved on average. Two parameters show a slightly different behavior: the inclination and X-displacement. The plots of the X-displacement and inclination at the different basepair positions are shown in Fig. 6 for the simulations with the CHARMM27, AMBER, and BMS force fields. The basepair parameters are represented for each of the five representative conformers, the average structure, and the x-ray structure for comparison. With CHARMM27, the X-displacement is slightly underestimated on average (twice the maximum deviation of 0.5 Å observed by Lam and Au-Yeung) whereas the inclination is slightly overestimated with respect to the x-ray structure (less than the maximum deviation of 18° observed by Lam and Au-Yeung). This tendency to underestimate the X-displacement and overestimate the inclination was also identified in a previous study with CHARMM22 (Feig and Pettitt, 1998). Equivalent results are obtained with the AMBER force field although CHARMM27 tends to better preserve the sequence-specific variations (Fig. 6). On the contrary, the BMS force field reproduces very well the X-displacement and to a lesser extent the inclination of the x-ray structure: the X-displacement and inclination of the average structure are almost identical to those of the x-ray structure at all basepairs. The deviations in X-displacement and inclination between the five representative conformers and the x-ray structure are also very small (Fig. 6).
The variation in the basepair step parameters (tilt, slide, rise, roll, twist, cup) are rather small and close to those observed in the x-ray structure. For illustration, we have chosen to describe more in detail: on the one hand, two backbone independent parameters, the roll and tilt that contribute to the DNA bending (Fig. 7 a), on the other hand two sequence-context-dependent parameters, the twist and slide (Fig. 7 b).
FIGURE 7.


Basepair step parameters (Roll, Tilt, Twist, Slide) of the five representative conformations for CHARMM27, AMBER, and BMS. (a) Roll and Tilt parameters, (b) Twist and Slide parameters. The bold solid line marked by circles represents the basepair parameter of the x-ray structure; the solid line marked by stars represents the basepair parameter averaged over the five conformations; each of the other lines represents a different conformation.
With CHARMM27, there is high roll at TpA (TA/TA: A5A6/B5B6) basepair step and low roll at the TpT (TT/AA: A4A5/B6B7 and B4B5/A6A7) and ApT (AT/AT: A3A4/B7B8 and B3B4/B7B8) basepair steps; high tilt at the TpT (TT/AA: A4A5/B6B7) basepair step and low tilt at the ApT (AT/AT: A3A4/B7B8) and ApA (AA/TT: A6A7/B4B5) basepair steps. All these sequence-specific features are in agreement with the experimental data (Gorin et al, 1995). Another sequence-specific feature that is well described is the bistable character of TpA basepair steps: in the five conformers, when the slide is negative (Fig. 7 b), the roll is positive and when the slide is positive, the roll is low (Fig. 7 a), a rule established from the analysis of base stacking interactions (Hunter, 1993). All the parameters that are essentially backbone independent (roll, tilt, and rise) give variations with CHARMM27 that are compatible with the zsequence-specific variability observed in x-ray structure. On the other hand, the parameters which are backbone-dependent (twist) or strongly sequence-context-dependent (slide) deviate more at some basepair steps. For example, the twist tends to be significantly large, specifically at the central TA/TA basepair step (Fig. 7 a). The AMBER force field gives similar results: the roll and tilt at the ApA, TpT, ApT, and TpA basepair steps are close on average to what is observed in the x-ray structure (Fig. 7 a). The bistable character, in terms of roll and slide (Fig. 7 b) of the TpA basepair step is also reproduced by AMBER. The twist is significantly smaller (compared to that obtained with CHARMM27), except for the central TA/TA basepair step. This is also a feature observed with the BMS force field (Fig. 7 b). The latter force field again gives smaller deviations from the basepair parameters of the x-ray structure. The larger deviations in the basepair step parameters obtained with the CHARMM27 and AMBER force fields result from the larger size of the accessible conformational space, as compared with the more rigid BMS simulation. The larger deviations in roll and tilt between the MD simulated structures and the x-ray structure are observed at the central TpA step with CHARMM27 and AMBER. Because both roll and tilt contribute to the local DNA bending, the larger RMSD with respect to the x-ray structure observed with these two force fields in comparison with the BMS force field (Fig. 2) might be due to some local bending at this particular base step. The plots of the roll, tilt and bending versus time (data not shown) reveal that in the case of AMBER, the jump in RMSD around 500 ps (Fig. 2) is associated with an increase in DNA bending at the GA/TC (A2A3/B8B9) and TA/TA (A5A6/B5B6) basepair steps. In the case of CHARMM27, the first jump in RMSD at 250 ps is related to a general increase of DNA bending at almost all basepair steps. In contrast, no marked bending is observed with the BMS force field, including at the TpA basepair step.
Major and minor groove hydration and ion distribution
Experimental data (Eisenstein and Shakked, 1995; Tippin and Sundaralingam, 1997; Egli et al., 1998; Tereshko et al., 1999) and MD simulations (Young et al., 1997; Feig and Pettitt, 1999a,b) have revealed the existence of hydration patterns which are specific to the A and B forms of DNA, and related to specific sequences. The hydration of the major groove and minor groove show very distinct patterns depending on the DNA form. The exocyclic amino group of adenines in the major groove is generally not solvated in A-DNA because of the formation of hydrogen bonds with stacked thymine bases. By contrast, a string of water molecules bridges adjacent adenines and thymines from opposite strands in the minor groove of B-DNA (Egli et al., 1998). Some sequence-specific patterns are also observed, such as the extended “hydrat-ion” spine in B-DNA minor groove at ApT basepair steps (Tereshko et al., 1999). This specific minor groove hydration is believed to be due to preferred monovalent metal ion coordination bridging the N3 and O2 atoms of adenine and thymine bases, respectively (Tereshko et al., 1999). Other hydration patterns are generally less extended, depending on the sequence, than the “caterpillar-like” structures typical of the minor groove hydration. They result from the presence of more local hydration sites at specific atomic positions, for example at the N4 atoms of cytosines (Feig and Pettitt, 1999a). More extended hydration patterns can also be observed in the major groove, at the four water oxygen atoms along the O6, N7, C8, and backbone phosphate atoms of the guanine bases (Feig and Pettitt, 1999a). Some of this behavior has been reproduced and analyzed with molecular dynamics simulations using the CHARMM22 (MacKerell, 1997) and AMBER1995 (Cheatham and Kollman, 1997) force fields or both force fields (Feig and Pettitt, 1997).
The local sequence-dependent hydration around the hydrogen-bond donors and acceptors of the DNA duplex is described in Fig. 8. The diagrams of local hydration around DNA sites show that the phosphodiester backbone (O1P and O2P) is more strongly hydrated. As found from the x-ray crystallographic analysis of the hydration of DNA at atomic resolution (Egli et al, 1998), the largest number of first-shell water molecules in the A (CHARMM22) or B form DNA duplexes (CHARMM27, AMBER, and BMS) are located around phosphate groups (oxygen atoms O1P, O5′, O3′, O2P, and O4′). This strong hydration is particularly concentrated around the nonbridging oxygens (O1P and O2P) of phosphate groups, a feature observed with all the force fields (Fig. 8, a–d). The more exposed anionic oxygen of the phosphate group (O1P) is slightly more solvated (Fig. 8 e). The BMS force field and to a lesser extent the AMBER force field lead to a stronger solvation of the nonbridging oxygens whereas the CHARMM force fields (and more particularly the CHARMM27 force field) generate a stronger solvation of the sugar oxygen O4′, which contributes to the stabilization of the water spine in the B-DNA minor groove. The more favorable hydration sites of the nucleic acid bases are located around the O6/N6 atoms of purines, N2 of guanines, and N4 of cytosines (Fig. 8, a and b). A comparison between the different force fields reveals that the solvation of the nucleic bases is stronger with BMS and AMBER than with the CHARMM force fields (Fig. 8 f). At all the base sites, the strength of solvation decreases from BMS to AMBER, CHARMM27, and CHARMM22. This trend is slightly changed at O6/N6 sites where AMBER gives a stronger solvation. On the other hand, the trend is reversed at N7 sites. At the basepair level, the G:C (or C:G) basepairs are more solvated than A:T (or T:A) basepairs with any of the force fields (Fig. 8 f). Among the A:T (or T:A) basepairs (6 out of the 10 basepairs, Fig. 1), the symmetrical fourth and seventh basepairs, corresponding to ApT steps, are more strongly solvated, a feature common to the force fields leading to a stable B-DNA (AMBER gives a behavior slightly different where the eighth basepair is a bit more solvated than the seventh one). It is noteworthy that the residence time of water molecules around the nucleic acid bases in the grooves is not significantly longer than that around the phosphate groups; the proportion of short-lived and long-lived water molecules is similar (data not shown). Nevertheless, the presence of water-water contacts in the vicinity of the various and more or less strong hydration sites leads to clear differences in local water densities as discussed below.
FIGURE 8.
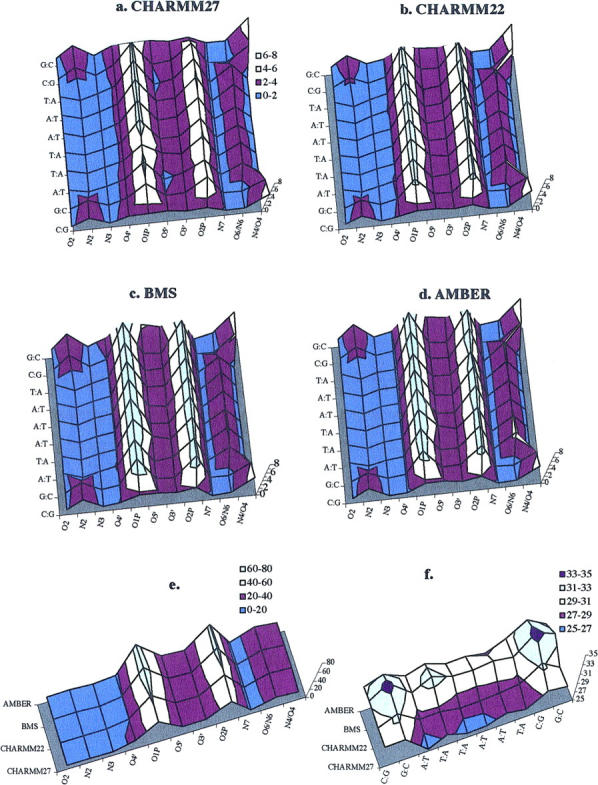
Diagram illustrating the number of water molecules in the hydration shells of individual oxygen and nitrogen atoms averaged over the DNA simulations for the different force fields: (a) CHARMM27, (b) CHARMM22, (c) BMS, (d) AMBER. The number of water molecules averaged over all atomic sites for all basepairs is shown in (e); the average number of water molecules at all atomic sites around each basepair is shown in (f). Water molecules are counted if they are less than 3.0 Å from the hydrogen-bonding partners in the DNA. Colors are used to make clearer the different basepair positions (from the first basepair at the bottom to the last one at the top).
To determine the ability of the different force fields to reproduce specific hydration patterns, we have compared the water and ion densities calculated from the MD trajectories (Figs. 9 and 10). For the CHARMM27 simulation, we first compare the positions of high water density with those of the crystal water molecules. Sixty percents of the high-density spots in the map overlap positions of the crystal water molecules (data not shown). The phosphate groups tend to be more hydrated than the nucleic acid bases (Egli et al., 1998) because of the negative charge carried by the phosphate groups. In the calculated results, the high density spots are generally smaller around the phosphate groups than around the bases (Fig. 11). The organized waters around the phosphate (Fig. 11 a) correspond to the first hydration shell but are kinetically labile (Denisov et al., 1997); the second shell is unorganized. The water around the bases are well-organized and establish hydrogen bonded networks revealed by the presence of large and extended caterpillar-like density spots at specific sites in the grooves (Fig. 11 b). This is in agreement with observations on the hydration of phosphate groups (Schneider et al., 1998), the kinetics of DNA hydration (Denisov et al., 1997) and the x-ray data showing that the water is more ordered around the bases than around the phosphate groups (Egli et al., 1998). The difference of hydration between the phosphate backbone and the DNA grooves comes from the fact that the water molecules around the nucleic acid bases are more organized in the first and second hydration shells. The analysis of the time-dependent organization of water molecules around a high water density spot, in the major groove of ADE 7B, reveals the presence of various organized water molecules in the shells of hydration (Fig. 12). The first shell water molecules making contacts with either the O6 or N7 atoms of ADE 7B are stabilized by second shell water molecules that establish hydrogen bond contacts with those of the first shell and sometimes also with the neighboring phosphate groups.
FIGURE 9.
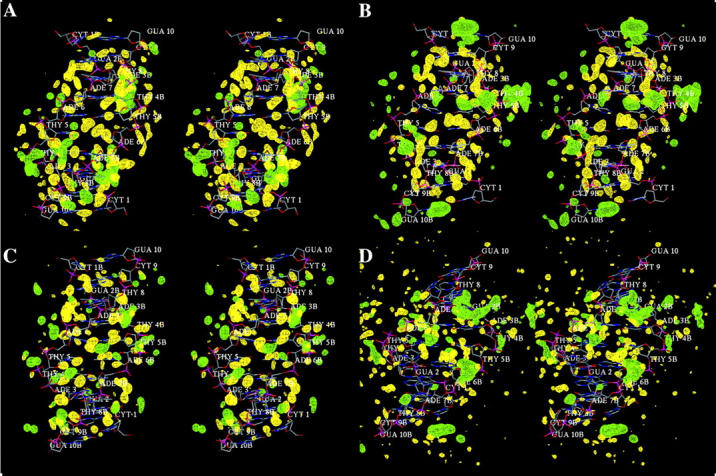
Wall-eyed stereo view of water and ion hydration patterns in the minor groove of B-DNA as obtained from the MD trajectories with (a) AMBER, (b) BMS, (c) CHARMM27, (d) CHARMM22. Density contours show water oxygen (yellow) and sodium ion (green) densities at level of 80 water molecules per nm3 and 10 ions per nm3 calculated from a grid with 0.25 Å resolution.
FIGURE 10.
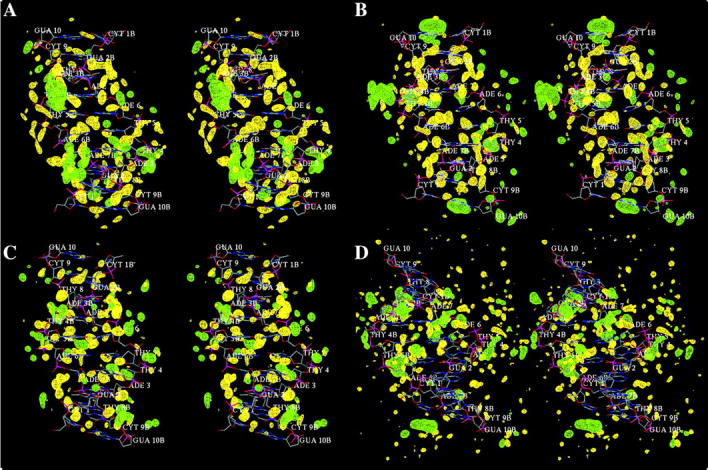
Wall-eyed stereo view of water and ion hydration patterns in the major groove of B-DNA as obtained from the MD trajectories with (a) AMBER, (b) BMS, (c) CHARMM27, (d) CHARMM22. Contours show water oxygen (yellow) and sodium ion (green) densities at level of 80 water molecules per nm3 and 10 ions per nm3 calculated from a grid with 0.25 Å resolution.
FIGURE 11.

Details of water hydration patterns around the phosphate group of THY 5B (A) and around the major and minor groove edges of ADE 7B (B) obtained with CHARMM27.
FIGURE 12.

Snapshots at t = 0,100,500,1000 ps from the CHARMM27 simulation showing the water molecules (cyan) in the first and second hydration shells around the nucleotide ADE 7B corresponding to the high water density at this position in the major groove.
The hydration patterns generated with the different force fields do not differ significantly, except for CHARMM22, which leads to small and very dispersed water density spots (Figs. 9 d and 10 d). This is due in part to the transition from B- to A-DNA that prevents the existence of organized and long-lived water molecules around the bases. For the other force fields, preferred hydration sites are localized at the O2 and N3 atoms of pyrimidines and purines, respectively, in the minor groove fields (Fig. 9, a–c), and at the O6 and N7 atoms of pyrimidines and purines, respectively, in the major groove (Fig. 10, a–c). In the minor groove, preferred hydration sites associated with high water density are observed at the N2 atoms of GUA A2 and B2, at the N3 atoms of ADE A3, B3, A6, and A7, at the O2 atoms of THY A4, B4, A8, B8, and at the O2 atoms of CYT A9 and B9. In the case of the AMBER and BMS force fields (Fig. 9, a and b), many extended high density spots are observed due to the proximity of hydrogen bond acceptors or donors between successive basepairs either on the same strand or on both strands. For example, the region defined by the N3 atoms of GUA B2, ADE B3, and the O2 atom of CYT A9 is associated with a unique and extended high density spot spread out across the minor groove. These density spots correspond to ordered water molecules in the minor groove of B-DNA identified in many x-ray structures (Drew and Dickerson, 1981; Kopka et al., 1983; Shui et al., 1998; Tereshko et al., 1999; Egli et al., 1998). Such high density spots are also present around the O2 atoms of THY A4 and THY B8, which belong to two successive basepairs (THY A4/ADE B7 and ADE A3/THY B8), and similarly around the O2 atoms of THY B4 and THY A8. Another hydration site with a similar pattern is found with the AMBER and CHARMM27 force fields (Fig. 9, a and c): it involves the N2 atoms of GUA A2 and GUA B10. As mentioned above, such hydration patterns are much less frequent in the CHARMM27 simulation. This is due to the presence of many counterions in the minor groove, revealed by the high ion density spots, that prevent the existence of extended water network. Thus, small high water density spots are juxtaposed with high ion density spots. In the major groove, more extended high water density spots are observed in the CHARMM27 simulation due to the lower population of counterions. High water density spots spread out across the major groove between successive basepairs are observed with the AMBER, BMS, and CHARMM 27 force fields (Fig. 10, a–c). They involve the O6 atoms of GUA B2 and THY A8 (and its symmetrical site with GUA A2 and THY B8), the O2 atom of THY B4 and the N6 atom of ADE A6, or the O2 atoms of THY A5 and THY B5, which are 2.62 Å and 2.92 Å far away, respectively, from the same crystal water molecule. Another common hydration pattern corresponds to the high water density spot around the N6 atom of CYT B9 that stretches to the phosphate group of ADE B7.
Sequence-specific binding sites for sodium ions in the minor groove, revealed by the presence of high ion density spots, are shown in details at the following basepair steps: CpG (Fig. 13), ApT (Fig. 14), TpA (Fig. 15), and TpT (Fig. 16). Some ion binding sites are common to DNA duplexes simulated with the different force fields. In other cases, high ion density spots can be substituted by high water density spots. For example, the high water density spot present around CYT A1, GUA A2, and CYT B9 observed with CHARMM27 (Fig. 13 a) is substituted with AMBER by a high water density spot in this region (Fig. 13 b). In a MD simulation on a B-DNA decamer using the AMBER force field, Young et al. (1997) have found high counterion density in a region of same sequence CpGpA (A1-A2-A3 and B1-B2-B3 in this DNA decamer).
FIGURE 13.

Zoom in view of sequence specific hydration and ion binding patterns (the contours for ions or water molecules are represented as described in Fig. 12) at the first CpG (A1A2/B9B10) basepair step obtained with: (A) CHARMM27 (counterions in green), (B) AMBER (water density spots in yellow).
FIGURE 14.

Zoom in view of sequence specific hydration and ion binding patterns at the ApT basepair steps observed with: (A) CHARMM27 (A7A8/B3B4), (B) AMBER (A3A4/B7B8), (C) BMS (A3A4/B7B8).
FIGURE 15.

Zoom in view of sequence specific hydration and ion binding patterns at the TpA basepair step (A5A6/B5B6) observed with: (A) CHARMM27, (B) AMBER.
FIGURE 16.

Zoom in view of sequence-specific hydration and ion binding patterns at the TpT basepair step (A4A5/B6B7) observed with: (A) AMBER, (B) CHARMM27.
The minor groove of AT basepairs is known to be a preferred location for monovalent cations (Sissoeff et al., 1976; Denisov et al., 1997; Halle and Denisov, 1998; Denisov and Halle, 2000). ApT steps are strong sites for monovalent cations localization because of a uniquely low electrostatic potential at these base steps (Young et al., 1997). The DNA structure contains two ApT basepair steps, A3A4/B7B8 and A7A8/B3B4, which are potential binding sites for monovalent ions as identified in x-ray structures determined at very high resolution (Tereshko et al., 1999). One site, at the ApT basepair step A7A8, is identified by CHARMM27 (Fig. 14 a) and the alternate site, at the A3A4 basepair step, is identified by AMBER (Fig. 14 b); neither of the two is identified with BMS. An additional monovalent ion binding site is found in the minor groove with CHARMM27 at the central TpA basepair step (A5A6/B5B6, Fig. 15 a) although it does not correspond to a binding site as strong as those at the ApT steps (Denisov and Halle, 2000). No similar binding site is observed with BMS; a high counterion density spot is observed with AMBER around the residue A6 but at more than 8 Å away from the N3 of the adenine (Fig. 15 b). In the x-ray structure of the DNA decamer, there is one magnesium site centered at the TpT basepair step A4A5 (basepaired to B6B7). A high ion density spot, corresponding to a sodium ion binding site, is observed in this region with AMBER (Fig. 16 a) and CHARMM27 (Fig. 16 b). Such a sodium binding site has already been observed in MD simulations at TpT steps (Feig and Pettitt, 1999b). In the case of BMS, this region is occupied by high water density spots and the close high ion density spot is distant from the original magnesium binding site by more than 8.0 Å. For comparison, the positions of the different ion binding sites identified in the minor groove with the three force fields (AMBER, BMS, CHARMM27) are represented in Fig. 17. It appears that the presence of counterions in the minor groove (Fig. 17) leads to a local groove narrowing at the corresponding cross-strand phosphate groups or neighboring cross-strand phosphate groups (Table 1). A local narrowing is observed at the PA4-PB10, PA5-PB9, PA6-PB8 cross-strand positions with AMBER: two sodium binding sites are observed at the last two positions (Fig. 17 a). A local narrowing is also observed at other positions: PA6-PB8, PA7-PB7, PA8-PB6 with CHARMM27; two sodium binding sites are present at the two first positions and the third position is inserted between two sodium binding sites (Fig. 17 c). By contrast, the local narrowing observed with BMS seems to be more sequence-specific because no close sodium binding sites are observed in the minor groove.
FIGURE 17.

Schematic representation of the locations of counterions binding sites in the minor groove of simulated structures obtained with: (A) AMBER, (B) BMS, (C) CHARMM27. The positions of sodium ions (Na+) are indicated by lines annotated with the coordination distance to N3 of purines and O2 of pyrimidines. The position of the magnesium binding (Mg2+) site found in the x-ray structure is indicated for comparison. The presence of high counterion density spots around the phosphate groups are pointed out by a purple P atom. A red dashed line joins the cross-strand phosphate groups when their distance is lower than the standard value for a regular B-DNA helix (narrowing of the minor groove).
The ions are mostly concentrated around the phosphate groups with CHARMM22 (Fig. 9 d). More counterions are present in the major groove, as we expected for A-DNA. They are also more organized than those in the minor groove with extended caterpillar-like structures (Fig. 10 d). In B-DNA duplexes, because of the larger solvent accessibility of the major groove, counterions can be distributed between multiple binding sites. The presence of only a few high density spots for sodium ions in the simulation structure with CHARMM27 (Fig. 10 c) is consistent with the idea of a reduced localization of counterions in the major groove of B-DNA compared to that of A-DNA (Feig and Pettitt, 1999a, b). Some rare and localized high ion density spots are observed in the major groove of the simulated structures; they can also form caterpillar-like structures and extend from the major groove edge to the phosphate groups, and they are generally located around the N7 of purines (Figs. 10 and 18). They are located at the GpA (A2A3/B8B9) and ApA (A6A7/B4B5) basepair steps with AMBER. A similar location is observed for the only ion density spot obtained with CHARMM27 at the ApA basepair step whereas they appear only at the terminal basepairs with BMS.
FIGURE 18.

Schematic representation of the locations of counterions binding sites in the major groove of simulated structures obtained with: (A) AMBER, (B) BMS, (C) CHARMM27. The positions of sodium ions (Na+) are indicated by lines annotated with the coordination distance to O6/N6 or N7 of purines and O4/N4 of pyrimidines.
Because of the short simulation times, artifacts might appear in the structural and solvation properties of the DNA decamer. Thus, we extended the MD simulation with the CHARMM27 force field to 2 ns to determine the reliability of our results. The DNA structure remains stable and gets closer to both the x-ray structure and a canonical B-DNA after 1400 ps (Fig. 19). From the structural point of view, as a result, the sugar pucker tends to converge toward a C2′-endo pucker; C2′-endo to C3′-endo transitions are less frequent (THY B4) or absent from the second part of the simulation (ADE A3). The more stable C3′-endo conformation, in the first part of the simulation at ADE B7, switches to a C2′-endo conformation that is conserved until the end of the simulation without any repuckering (Fig. 19). Similarly, the deviations of the basepair or base step parameters with respect to the x-ray structure and a canonical B-DNA are slightly reduced. In particular, the deviations in roll and tilt at the central TpA step are reduced and compare well with those observed at this base step with the BMS force field. From the point of view of solvation, some qualitative and quantitative changes are observed around the phosphate groups, which can be related to some changes in sugar pucker (downstream from the position B7 for example). However, no qualitative change is observed regarding the position of sodium binding sites in the minor groove.
FIGURE 19.

Selected structural changes observed during the MD simulation with CHARMM27 extended to 2 ns. (top) RMSD versus time from 1150 to 2000 ps. (bottom) Time dependence of the sugar pseudorotation angle at B7.
CONCLUSIONS
The average simulated structures of the d(CGATTAATCG)2 DNA double helix obtained with the CHARMM27, AMBER, and BMS force fields have a B-form geometry close to the x-ray structure; the starting B-DNA structure undergoes a transition to an A-like DNA structure with CHARMM22. Thus, all three of the newer force fields are clearly more useful for simulation studies of DNA than is CHARMM22. From a strict comparison of the average simulation structures with the x-ray data, the BMS force field gives the best agreement. The two other force fields, AMBER and CHARMM27, give similar results although each of them better describes certain structural features of B-DNA. A major difference between the BMS force field and the other two force fields is that the BMS simulation yields a significantly more rigid structure. The higher conformational flexibility obtained with AMBER and CHARMM27 may be more consistent with the available experimental data. In the simulation with the BMS force field, there are no ions in the primary solvation shell of the minor groove. The lower calculated conformational flexibility of B-DNA with BMS might be responsible for this, because “breathing” of the minor groove is necessary to accommodate some ions. Alternatively, the energetic penalty associated with the partial dehydration of the counterions might be too high to allow the penetration of counterions into the minor groove. The BMS force field gives the strongest solvation of nucleic acid bases among all the force fields. The solvation of the minor groove in the AMBER and CHARMM27 simulations includes ions in the primary shell, in agreement with experimental data (Tereshko et al., 1999) and previous DNA simulations (Feig and Pettitt, 1999b). The minor groove of the average structures obtained with AMBER, BMS, or CHARMM27 tends to be nonspecifically wider than that of the x-ray structure (Table 1). However, some local narrowing of the minor groove is observed. The narrowing of the minor groove is generally associated with the presence of counterions in the minor groove (Feig and Pettitt, 1999b; Hamelberg et al., 2000). The presence of a divalent cation (Mg2+) at the TpT basepair step (A4A5/B6B7) leads to a local widening of the minor groove in the x-ray structure (distance PA6-PB8 in Table 1). In the simulated structures with AMBER and CHARMM27, the substitution of the divalent cation by a monovalent cation induces instead a local narrowing of the minor groove. In the absence of any counterion at the position of the original magnesium binding site, the minor groove does not show any narrowing with the BMS force field.
The anticorrelation observed between basepair inclination and the depth of the major groove (measured by the X-displacement) is another example of the influence of solvation on the global DNA conformation in solution. Because these two features vary in an anticorrelated way, they can be used to monitor the conformational changes between A-like DNA conformations (high inclination and a deep less hydrated major groove) and B-like DNA conformations (low inclination and a more shallow more hydrated major groove).
At a more detailed atomic level, we observe that the phosphate groups are more strongly hydrated than the nucleic acid bases consistent with x-ray crystallographic data (Egli et al., 1998). The water molecules around the nucleic acid bases do not have calculated residence times significantly larger than those around the phosphate groups. However, because of the lack of reorientation of water molecules around the bases due to water contacts between the first and second solvent hydration shells, the solvent density is higher at specific base sites in the minor or major groove and leads to more extended caterpillar-like structures. Ion binding sites are generally more specific and localized in the minor groove for B-DNA duplexes. They can be partially dehydrated in the minor groove whereas they are generally fully hydrated in the major groove.
The results obtained with the CHARMM force fields show a significant improvement of the nucleic acid force field parameters in CHARMM27 relative to CHARMM22. The strong anticorrelation observed between the RMSD versus time with respect to the canonical A and B forms of DNA in the simulation with CHARMM27, together with the low anticorrelation between the base inclination and the X-displacement, indicates that the conformational space between the A and B forms of DNA is sampled. These results suggest that the CHARMM27 force field is appropriate for simulations of the influence of the environment on the form of DNA, including the relative stabilities and possible transitions between the A- and B-DNA forms.
Acknowledgments
We thank A. MacKerell for help with the CHARMM27 parameters and D. Langley for providing the BMS parameters before publication. We also thank R. Yelle, J. Ma, B. Matthias, and Y. Zhou for valuable discussions, and C. L. Brooks, M. Crowley, G. Ravishankar, and M. Feig for information on certain aspects of the PME method. The simulations were done on the T3E at Pittsburgh Supercomputing Center and at National Energy Research Scientific Computing Center under grants from National Institutes of Health and the Department of Energy, respectively. S.Y. was a recipient of a BOYSCAST fellowship from the Department of Science and Technology, (DST) INDIA. F.L. was a fellow of the Human Frontier Science Organization. The work was supported in part by a grant from National Institutes of Health.
References
- Ali, N., and R. Ali. 1997. High salt and solvent induced Z-conformation in native calf thymus DNA. Biochem. Mol. Biol. Int. 41:1227–1235. [DOI] [PubMed] [Google Scholar]
- Arnott, S., and D. W. Hukins. 1972. Optimised parameters for A-DNA and B-DNA. Biochem. Biophys. Res. Commun. 47:1504–1509. [DOI] [PubMed] [Google Scholar]
- Arnott, S., and D. W. Hukins. 1973. Refinement of the structure of B-DNA and implications for the analysis of x-ray diffraction data from fibers of biopolymers. J. Mol. Biol. 81:93–105. [DOI] [PubMed] [Google Scholar]
- Auffinger, P., and E. Westhof. 1997. RNA hydration: three nanoseconds of multiple molecular dynamics simulations of the solvated tRNA(Asp) anticodon hairpin. J. Mol. Biol. 269:326–341. [DOI] [PubMed] [Google Scholar]
- Auffinger, P., and E. Westhof. 1998. Simulations of the molecular dynamics of nucleic acids. Curr. Opin. Struct. Biol. 8:227–236. [DOI] [PubMed] [Google Scholar]
- Beveridge, D. L., and K. J. McConnell. 2000. Nucleic acids: theory and computer simulation, Y2K. Curr. Opin. Struct. Biol. 10:182–196. [DOI] [PubMed] [Google Scholar]
- Brooks, B. R., R. E. Bruccoleri, B. D. Olason, D. J. States, S. Swaminathan, and M. Karplus. 1983. CHARMM: a program for macromolecular energy, minimization, and dynamics calculations. J. Comp. Chem. 4:187–217. [Google Scholar]
- Brown, D., and J. H. R. Clarke. 1984. A comparison of constant energy, constant temperature and constant pressure ensembles in molecular dynamics simulations of atomic liquids. Mol. Phys. 51:1243–1252. [Google Scholar]
- Cheatham, T. E., 3rd., P. Cicplak, and P. A. Kollman. 1999. A modified version of the Cornell et al. force field with improved sugar pucker phases and helical repeat. J. Biomol Struct. Dyn. 16:845–862. [DOI] [PubMed] [Google Scholar]
- Cheatham, T. E., J. L. Miller, T. Fox, T. A. Darden, and P. A. Kollman. 1995. Molecular dynamics simulations highlight the structural differences among DNA:DNA, RNA:RNA, and DNA:RNA hybrid duplexes. J. Am. Chem. Soc. 117:4193–4205. [Google Scholar]
- Cheatham, T. E., and P. E. Kollman. 1996. Observation of the A-DNA to B-DNA transition during unrestrained molecular dynamics in aqueous solution. J. Mol. Biol. 259:434–444. [DOI] [PubMed] [Google Scholar]
- Cheatham, T. E., and P. A. Kollman. 1997. Insight into the stabilization of A-DNA by specific ion association: spontaneous B-DNA to A-DNA transitions observed in molecular dynamics simulations of d[ACCCGCGGGT]2 in the presence of hexaamminecobalt(III). Structure. 5:1297–1311. [DOI] [PubMed] [Google Scholar]
- Cheatham, T. E., and P. E. Kollman. 2000. Molecular dynamics simulations of nucleic acids. Annu. Rev. Phys. Chem. 51:435–471. [DOI] [PubMed] [Google Scholar]
- Cheatham, T. E., and P. E. Kollman. 2001. Molecular dynamics simulation of nucleic acids: successes, limitations, and promise. Biopolymers. 56:232–256. [DOI] [PubMed] [Google Scholar]
- Cheatham, T. E., 3rd., and M. A. Young. 2000. Molecular dynamics simulation of nucleic acids: successes, limitations, and promise. Biopolymers. 56:232–256. [DOI] [PubMed] [Google Scholar]
- Chiu, T. K., and R. E. Dickerson. 2000. 1 Å crystal structures of B-DNA reveal sequence-specific binding and groove-specific bending of DNA by magnesium and calcium. J. Mol. Biol. 301:915–945. [DOI] [PubMed] [Google Scholar]
- Cornell, W. D., P. Cieplak, C. I. Baylay, I. R. Gould, K. M. Merz, D. M. Ferguson, D. C. Spellmeyer, T. Fox, J. W. Caldwell, and P. A. Kollman. 1995. A second generation force field for the simulation of proteins and nucleic acids. J. Am. Chem. Soc. 117:5179–5197. [Google Scholar]
- Darden, T., D. York, and L. Pedersen. 1993. Particle mesh Ewald: an N.log(N) method for Ewald sums in large systems. J. Chem. Phys. 98:10089–10092. [Google Scholar]
- Denisov, V. P., G. Carlström, K. Venu, and B. Halle. 1997. Kinetics of DNA hydration. J. Mol. Biol. 268:118–136. [DOI] [PubMed] [Google Scholar]
- Denisov, V. P., and B. Halle. 2000. Sequence-specific binding of counterions to B-DNA. Proc. Natl. Acad. Sci. USA. 97:629–633. [DOI] [PMC free article] [PubMed] [Google Scholar]
- Dickerson, R. E. 1998. DNA bending: the prevalence of kinkiness and the virtues of normality. Nucleic Acids Res. 26:1906–1926. [DOI] [PMC free article] [PubMed] [Google Scholar]
- Drew, H. R., and R. E. Dickerson. 1981. Structure of a B-DNA dodecamer. III. Geometry of hydration. J. Mol. Biol. 151:535–556. [DOI] [PubMed] [Google Scholar]
- Egli, M., V. Tereshko, M. Teplova, G. Minasov, A. Joachimiak, R. Sanishvili, C. M. Weeks, R. Miller, M. A. Maier, H. An, P. Dan Cook, and M. Manoharan. 1998. X-ray crystallographic analysis of the hydration of A- and B-form DNA at atomic resolution. Biopolymers. 48:234–252. [DOI] [PubMed] [Google Scholar]
- Eisenstein, M., and Z. Shakked. 1995. Hydration patterns and intermolecular interactions in A-DNA crystal structures. Implications for DNA recognition. J. Mol. Biol. 248:662–678. [DOI] [PubMed] [Google Scholar]
- El Hassan, M. A., and C. R. Calladine. 1996. Propeller-twisting of base-pairs and the conformational mobility of dinucleotide steps in DNA. J. Mol. Biol. 259:95–103. [DOI] [PubMed] [Google Scholar]
- Ewald, P. P. 1921. Die Berechnung Optischer und elektrostatischer Gitterpotentiale (Calculation of optic and electrostatic lattice potential). Ann. Phys. 64:253–287. [Google Scholar]
- Fang, Y., T. S. Spisz, and J. H. Hoh. 1999. Ethanol-induced structural transitions of DNA on mica. Nucleic Acids Res. 27:1943–1949. [DOI] [PMC free article] [PubMed] [Google Scholar]
- Feig, M., and B. M. Pettitt. 1998. Structural equilibrium of DNA represented with different force fields. Biophys. J. 75:134–149. [DOI] [PMC free article] [PubMed] [Google Scholar]
- Feig, M., and B. M. Pettitt. 1997. Experiment vs force fields: DNA conformation from molecular dynamics simulations. J. Phys. Chem. 101:7361–7363. [Google Scholar]
- Feig, M., and B. M. Pettitt. 1999a. Modeling high-resolution hydration patterns in correlation with DNA sequence and conformation. J. Mol. Biol. 286:1075–1095. [DOI] [PubMed] [Google Scholar]
- Feig, M., and B. M. Pettitt. 1999b. Sodium and chlorine ions as part of the DNA solvation shell. Biophys. J. 77:1769–1781. [DOI] [PMC free article] [PubMed] [Google Scholar]
- Field, M. J., and M. Karplus. 1992. CRYSTAL: Program for Crystal Calculations in CHARMM, Harvard University, Cambridge, MA.
- Hamelberg, D., L. McFail-Isom, L. D. Williams, and W. D. Wilson. 2000. Flexible structure of DNA: ion dependence of minor-groove structure and dynamics. J. Am. Chem. Soc. 122:10513–10520. [Google Scholar]
- Feller, S. E., R. W. Pastor, A. Rojnuckarin, S. Bogusz, and B. R. Brooks. 1996. Effect of electrostatic force truncation on interfacial and transport properties of water. J. Phys. Chem. 100:17011–17020. [Google Scholar]
- Foloppe, N., and A. D. MacKerell. 2000. All-atom empirical force field for nucleic acids. I. Parameter optimization based on small molecule and condensed phase macromolecular target data. J. Comp. Chem. 21:86–104. [Google Scholar]
- Goodsell, D. S., M. Kaczor-Grzeskowiak, and R. E. Dickerson. 1994. The crystal structure of C–C-A-T-T-A-A-T-G-G. Implications for bending of B-DNA at T-A. J. Mol. Biol. 239:79–96. [DOI] [PubMed] [Google Scholar]
- Gorin, A. A., V. B. Zhurkin, and W. K. Olson. 1995. B-DNA twisting correlates with base-pair morphology. J. Mol. Biol. 247:34–48. [DOI] [PubMed] [Google Scholar]
- Gupta, G., M. Bansal, and V. Sasisekharan. 1980. Conformational flexibility of DNA: polymorphism and handedness. Proc. Natl. Acad. Sci. USA. 77:6486–6490. [DOI] [PMC free article] [PubMed] [Google Scholar]
- Halle, B., and V. P. Denisov. 1998. Water and monovalent ions in the minor groove of B-DNA oligonucleotides as seen by NMR. Biopolymers. 48:210–233. [DOI] [PubMed] [Google Scholar]
- Hunter, C. A. 1993. Sequence-dependent DNA structure. The role of base stacking interactions. J. Mol. Biol. 230:1025–1054. [DOI] [PubMed] [Google Scholar]
- IUPAC-IUB joint commission on Biochemical Nomenclature. 1983. Abbreviations and symbols for the description of conformations of polynucleotide chains. Recommendations. Eur. J. Biochem. 131:9–15. [DOI] [PubMed] [Google Scholar]
- Jones, S., P. van Heyningen, H. M. Berman, and J. M. Thornton. 1999. Protein-DNA interactions: a structural analysis. J. Mol. Biol. 287:877–896. [DOI] [PubMed] [Google Scholar]
- Jorgensen, W., J. Chandrasekhar, J. D. Madura, R. Impey, and M. Klein. 1983. Comparison of simple potential functions for simulating liquid water. J. Chem. Phys. 79:926–935. [Google Scholar]
- Kielkopf, C. L., S. Ding, P. Kuhn, and D. C. Rees. 2000. Conformational flexibility of B-DNA at 0.74 Å resolution: d(CCAGTACTGG)(2). J. Mol. Biol. 296:787–801. [DOI] [PubMed] [Google Scholar]
- Kopka, M. L., A. V. Fratini, H. R. Drew, and R. E. Dickerson. 1983. Ordered water structure around a B-DNA dodecamer. A quantitative study. J. Mol. Biol. 163:129–146. [DOI] [PubMed] [Google Scholar]
- Kumar, G. S., and M. Maiti. 1994. DNA polymorphism under the influence of low pH and low temperature. J. Biomol. Struct. Dyn. 12:183–201. [DOI] [PubMed] [Google Scholar]
- Lam, L., and S. C. F. Au-Yeung. 1997. Sequence-specific local structural variations in solution structures of d(CGXX'CG)2 and d(CAXX'TG)2 self-complementary deoxyribonucleic acids. J. Mol. Biol. 266:745–760. [DOI] [PubMed] [Google Scholar]
- Langley, D. R. 1998. Molecular dynamic simulations of environment and sequence dependent DNA conformations: the development of the BMS nucleic acid force field and comparison with experimental results. J. Biomol. Struct. Dyn. 16:487–509. [DOI] [PubMed] [Google Scholar]
- Laskowski, R. A. 1995. SURFNET: A program for visualizing molecular surfaces, cavities and intermolecular interactions. J. Mol. Graph. 13:323–330. [DOI] [PubMed] [Google Scholar]
- Lee, B., and F. M. Richards. 1971. The interpretation of protein structures: estimation of static accessibility. J. Mol. Biol. 55:379–400. [DOI] [PubMed] [Google Scholar]
- Lee, H., T. Darden, and L. Pedersen. 1995. Accurate crystal molecular dynamics simulations using particle-mesh-Ewald: RNA dinucleotides-ApU and GpC. Chem Phys Lett. 243:229–235. [Google Scholar]
- MacKerell, A. D., J. Wiorkiewicz-Juczera, and M. Karplus. 1995. An all-atom empirical energy function for the simulation of nucleic acids. J. Am. Chem. Soc. 117:11946–11975. [Google Scholar]
- MacKerell, A. D., and N. Banavali. 2000. All-atom empirical force field for nucleic acids. II. Application to molecular dynamics simulations of DNA and RNA in solution. J. Comp. Chem. 21:105–120. [Google Scholar]
- MacKerell, A. D. 1997. Influence of magnesium ions on duplex DNA structural, dynamic, and solvation properties. J. Phys. Chem. 101:646–650. [Google Scholar]
- Minasov, G., V. Tereshko, and M. Egli. 1999. Atomic-resolution crystal structures of B-DNA reveal specific influences of divalent metal ions on conformation and packing. J. Mol. Biol. 291:83–99. [DOI] [PubMed] [Google Scholar]
- Nelson, H. C. M., J. T. Finch, B. F. Luisi, and A. Klug. 1987. The structure of an oligo(dA).oligo(dT) tract and its biological implications. Nature. 330:221–226. [DOI] [PubMed] [Google Scholar]
- Norberg, J., and L. Nilsson. 1996. Constant pressure molecular dynamics simulations of the dodecamers: d(GCGCGCGCGCGC)2 and r(GCGCGCGCGCGC)2. J. Chem. Phys. 104:6052–6057. [Google Scholar]
- Petersen, H. J. 1995. Accuracy and efficiency of the particle mesh Ewald method. J. Chem. Phys. 103:3668–3679. [Google Scholar]
- Quintana, J. R., K. Grzeskowiake, K. Yanagi, and R. E. Dickerson. 1992. Structure of a B-DNA decamer with a central T-A step: C-G-A-T-T-A-A-T-C-G. J. Mol. Biol. 225:379–395. [DOI] [PubMed] [Google Scholar]
- Reinert, K. E. 1999. DNA multimode interaction with berenil and pentamidine: double helix stiffening, unbending and bending. J. Biomol. Struct. Dyn. 17:311–331. [DOI] [PubMed] [Google Scholar]
- Ryckaert, J. P., G. Ciccotti, and H. J. C. Berendsen. 1977. Numerical integration of the cartesian equations of motion of a system with constraints: molecular dynamics of n-alkanes. 1977. J. Comput. Phys. 23:327–341. [Google Scholar]
- Schneider, B., K. Patel, and H. M. Berman. 1998. Hydration of the phosphate group in double-helical DNA. Biophys. J. 75:2422–2434. [DOI] [PMC free article] [PubMed] [Google Scholar]
- Shui, X., L. McFail-Isom, G. H. Hu, and L. D. Williams. 1998. The B-DNA dodecamer at high resolution reveals a spine of water on sodium. Biochemistry. 37:8341–8355. [DOI] [PubMed] [Google Scholar]
- Sissoeff, I., J. Grisvard, and E. Guille. 1976. Studies on metal ions-DNA interactions: specific behavior of reiterative DNA sequences. Prog. Biophys. Mol. Biol. 31:165–199. [DOI] [PubMed] [Google Scholar]
- Tereshko, V., G. Minasov, and M. Egli. 1999. A “Hydrat-Ion” spine in a B-DNA minor groove. J. Am. Chem. Soc. 121:3590–3595. [Google Scholar]
- Tippin, D. B., and M. Sundaralingam. 1997. Comparison of major groove hydration in isomorphous A-DNA octamers and dependence on base sequence and local helix geometry. Biochemistry. 36:536–543. [DOI] [PubMed] [Google Scholar]
- Verlet, L. 1967. Computer “experiments” on classical fluids. I. Thermodynamical properties of Lennard-Jones molecules. Phys. Rev. 159:98–103. [Google Scholar]
- Winger, R. H., R. K. Liedl, S. Rudisser, A. Pichler, A. Hallbrucker, and E. Mayer. 1998. B-DNA's BI…BII conformer substate dynamics is coupled with water migration. J. Phys. Chem. 102:8934–8940. [Google Scholar]
- Yang, L., and B. M. Pettitt. 1996. B to A transition of DNA on the nanosecond time scale. J. Phys. Chem. 100:2564–2566. [Google Scholar]
- York, D. M., W. Yang, H. Lee, T. Darden, and L. G. Pedersen. 1995. Toward the accurate modeling of DNA: the importance of long-range electrostatics. J. Am. Chem. Soc. 117:5001–5002. [Google Scholar]
- Young, M. A., G. Ravishanker, and D. L. Beveridge. 1997. A 5-nanosecond molecular dynamics trajectory for B-DNA: analysis of structure, motions, and solvation. Biophys. J. 73:2313–2336. [DOI] [PMC free article] [PubMed] [Google Scholar]