Abstract
The tight junction of epithelial cells excludes macromolecules but allows permeation of ions. However, it is not clear whether this ion-conducting property is mediated by aqueous pores or by ion channels. To investigate the permeability properties of the tight junction, we have developed paracellular ion flux assays for four major extracellular ions, Na+, Cl−, Ca2+, and Mg2+. We found that the tight junction shares biophysical properties with conventional ion channels, including size and charge selectivity, dependency of permeability on ion concentration, competition between permeant molecules, anomalous mole-fraction effects, and sensitivity to pH. Our results support the hypothesis that discrete ion channels are present at the tight junction. Unlike conventional ion channels, which mediate ion transport across lipid bilayers, the tight junction channels must orient parallel to the plane of the plasma membranes to support paracellular ion movements. This new class of paracellular-tight junction channels (PTJC) facilitates the transport of ions between separate extracellular compartments.
INTRODUCTION
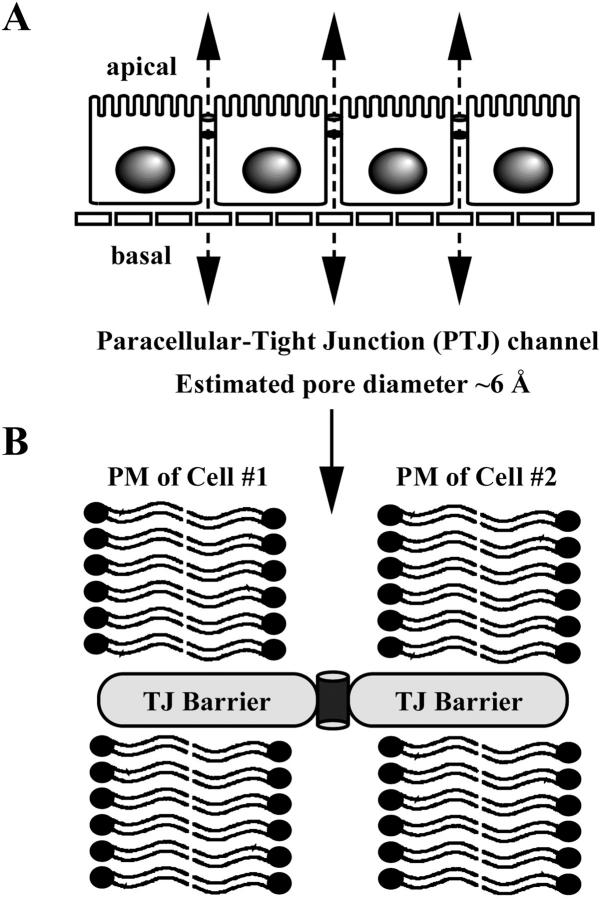
Epithelia form boundaries of biological compartments, creating specialized absorptive and secretive surfaces such as the kidney tubules, the intestinal tract, and the mammary gland. The ability of epithelial cells to regulate absorption and secretion of essential ions such as sodium, chloride, calcium, and magnesium is critical for the maintenance of electrolyte balance. Ion transport across an epithelial layer can be either transcellular or paracellular. The transcellular pathway involves the movement of ions across the cytoplasm via plasma membrane channels, carriers, and exchangers. The paracellular pathway (Fig. 1 A) involves the movement of ions through the intercellular spaces between epithelial cells. The gatekeeper of the paracellular pathway is the tight junction, which is located at apical cell-cell interactions of adjacent epithelial cells. Although three known inherited disorders, familial hypomagnesemia (Simon et al., 1999), hypertension (Wilson et al., 2001), and autosomal recessive deafness (Wilcox et al., 2001) have been linked to proteins that localize at the tight junction, the physiological function of the paracellular pathway remains relatively undefined.
FIGURE 1.
Paracellular ion permeability. (A) Schematic drawing of the paracellular pathway of an epithelial monolayer. Estimated pore diameter of the paracellular tight junction channel (PTJC) is ∼6 Å. (B) PTJC is inserted at the tight junction permeability barrier.
The tight junction permits the passage of ions while restricting the movement of large molecules and proteins (Madara, 1990; Tice et al., 1977). The permeability of the tight junction to ions can be assessed by transepithelial electrical measurements which varies greatly among epithelial cells, ranging from ∼5 to >5000 Ω cm2 (Fromter and Diamond, 1972; Powell, 1981). Studies using membrane impermeant tracers suggested that the tight junction has pores of diameter ∼6 Å (Spring, 1998), a size similar to some conventional ion channels (Balasubramanian et al., 1995; Dwyer et al., 1980; Goulding et al., 1993).
Unlike conventional ion channels, the paracellular tight junction channels (PTJC) are oriented parallel to the plasma membranes (Fig. 1 B). We have hypothesized that specific ion channels are assembled extracellularly, within the physical seal of the tight junction, to allow selective ion permeation (Wong and Goodenough, 1999). Others have proposed that the tight junction contains aqueous pores (Tsukita and Furuse, 2000). If PTJCs were aqueous pores, they would behave as water-filled channels with no ion selectivity, resembling the gramicidin A channel (Myers and Haydon, 1972). On the other hand, if PTJCs were bona fide ion channels, they would possess biophysical properties such as ion and charge selectivity. In this study, we have used established and newly developed assays to investigate the ion-conducting properties of the paracellular tight junction channel.
Movement of ions through the tight junction is a passive process, which largely depends on the concentration gradients of permeant ions. Although electrical measurements provide important insights into ion selectivities, it is imperative to study paracellular ion transport driven by concentration gradients. Current methodologies employ radioactive isotopes, such as 86Rb, 45Ca, and 22Na, which only permit the study of one molecular species at a time and the use of limited amounts (μM) of tracers. However, most paracellular ion transport involves multiple ions and much steeper concentration gradients (mM). In this study, we designed a novel scheme to measure paracellular flux of four major extracellular ions: sodium, chloride, calcium, and magnesium. These new flux assays have advantage over electrical measurements and isotope tracer experiments because absolute ion permeabilities can be obtained over a wide range of concentration gradients and several ions can be studied simultaneously.
MATERIALS AND METHODS
Cell culture and Immunofluorescence
MDCK I (Madin-Darby canine kidney, strain I) and MDCK II (strain II) cells were grown in MEM medium (GIBCO, Grand Island, NY), supplemented with 5% FBS (Hyclone, Logan, UT). T84 (human colon adenocarcinoma) cells (ATTC, Rockville, MD) were grown in DMEM/F-12 medium (GIBCO), supplemented with 10% FBS. Experiments were performed using double-chambered culture dishes with porous support inserts for the cells (Transwell-clear membranes; Costar, Corning NY). Flux experiments were performed on ∼2–3 weeks post-confluent cells when the monolayers had extended up the edges of the Transwell cup. Indirect immunofluorescent staining was performed on cells that had been fixed directly on Transwells immediately after the experiments in 100% methanol at −20°C for 3 h. Mouse anti-occludin (Zymed, S. San Francisco, CA) and FITC-labeled anti-mouse (Chemicon, Temecula, CA) antibodies were used. Images were acquired with Nikon E800 and SPOT digital image acquisition.
Measurements of transepithelial electrical resistance
Voltage and current clamps were performed using EVC4000 Precision V/I Clamp (World Precision Instruments, Sarasota, FL) with agarose bridges containing 0.15 M KCl and 0.15 M NaCl. Clamp measurements were made at 37°C in normal medium without serum. All other transepithelial electrical measurements were obtained using Millicell-ERS and chopstick electrodes (Millipore, Bedford, MA). All chemicals, except HEPES (GIBCO), were purchased from Sigma, St. Louis, MO. For MDCK I and MDCK II cells in Fig. 3, B and C, solutions used were 150 mM NaCl, RbCl, CsCl, or LiCl with 2 mM CaCl2, 1 mM MgCl2, 10 mM glucose, and 10 mM HEPES pH 7.4. For T84 cells in Fig. 3 C, solutions used were 150 mM NaCl, RbCl, CsCl, or LiCl with 1 mM CaCl2, 1 mM MgCl2, 10 mM glucose, and 10 mM HEPES pH 7.4. For MDCK I, MDCK II, and T84 cells in Fig. 3, D–F, solutions used were 120 mM NaCl, 1 mM MgCl2, 10 mM glucose, and 10 mM HEPES pH 7.4 with either 1 mM CaCl2 and 57 mM mannitol, 5 mM CaCl2 and 45 mM mannitol, 10 mM CaCl2 and 30 mM mannitol, or 20 mM CaCl2. For Fig. 7 A, transepithelial electrical resistances (TERs) were measured directly in growth media before flux experiments. For Fig. 8 C, solutions used were 150 mM NaCl, 1 mM MgCl2, 10 mM glucose, and 10 mM HEPES pH 7.4 with either 1 mM or 5 mM CaCl2. For Fig. 8 F, solutions used were 1 mM MgCl2, 10 mM glucose, and 10 mM HEPES pH 7.4 with either 148.5 mM NaCl and 1 mM CaCl2, 147 mM NaCl and 2 mM CaCl2, 143 mM NaCl and 5 mM CaCl2, 136 mM NaCl and 10 mM CaCl2, 122 mM NaCl and 20 mM CaCl2, 108 mM NaCl and 30 mM CaCl2, 96 mM NaCl and 40 mM CaCl2, 10 mM NaCl and 100 mM CaCl2, or 107 mM CaCl2. An additional 5 mM of Na+ contributed from HEPES was used to calculate the ratios of Na+ to Ca2+. For Fig. 9 A, solutions used were Earle's Balanced Salt Solution (GIBCO) with 10 mM HEPES pH 7.4 or 10 mM MES pH 4. For Fig. 9 B, solutions used were 135 mM LiCl, RbCl, NaCl, or CsCl with 1 mM CaCl2, 1 mM MgCl2, 10 mM glucose, and 10 mM HEPES pH 7.4. Buffers prepared in the absence of HEPES were pH 5. All TER data were measured at 37°C and normalized to measurements obtained in the corresponding NaCl-based solutions containing 1 mM CaCl2, 1 mM MgCl2, 10 mM glucose, and 10 mM HEPES pH 7.4 at 37°C in the same experiment.
FIGURE 3.
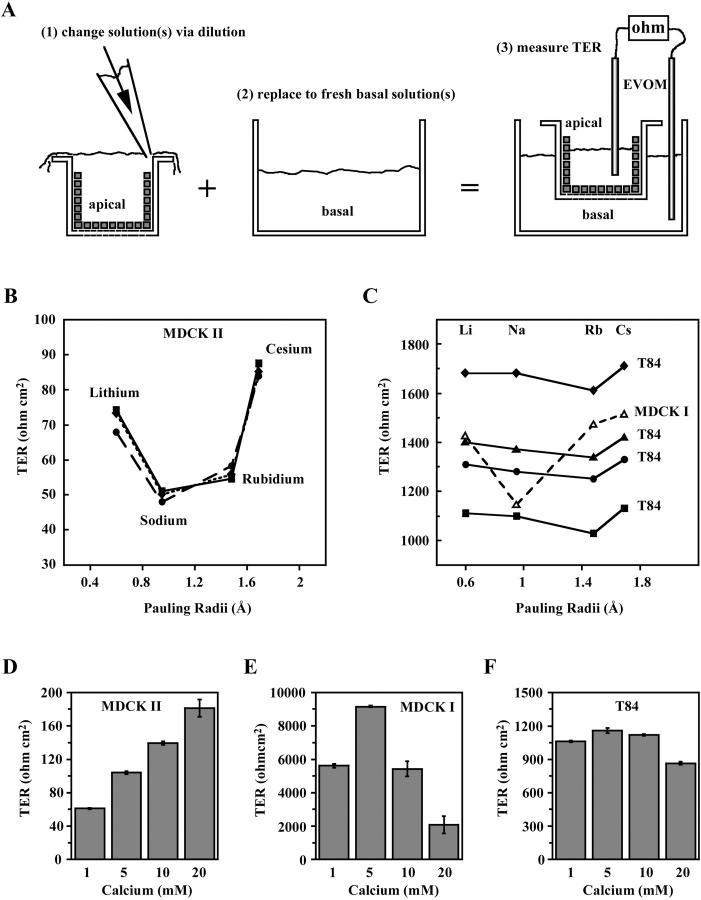
Distinct ion selectivities of the MDCK I, MDCK II, and T84 PTJCs. (A) Schematic protocol for measurements of ion selectivities using chopstick electrodes. (B) Monovalent ion selectivities of MDCK II (three monolayers). (C) Monovalent ion selectivities of MDCK I (one monolayer) and T84 (four monolayers). (D–F) Ca2+ sensitivities of MDCK I, MDCK II, and T84 PTJCs (n = 3).
FIGURE 7.
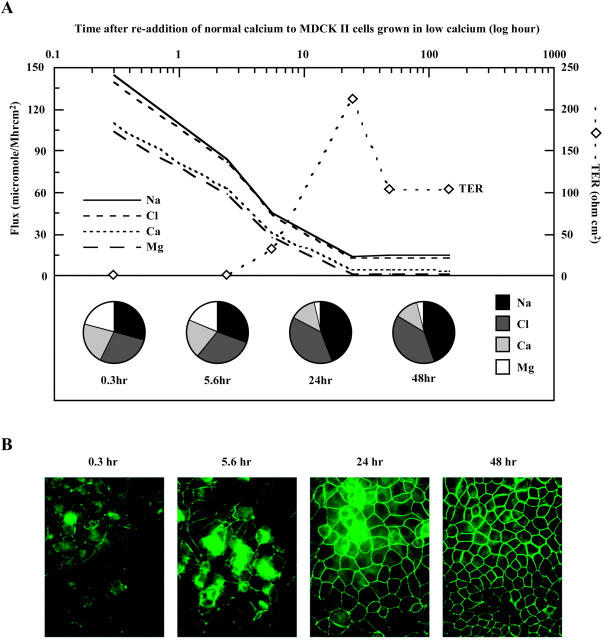
Paracellular ion selectivity required the formation of intact tight junctions. (A) Generation of TER and concomitant decline in paracellular ion fluxes upon tight junction formation by the addition of normal calcium to MDCK II cells (t = 0) that had grown in low calcium medium. Y axis on the left showed ion permeabilities from concurrent tetraionic flux, also displayed as fractional fluxes in pie charts. Y axis on the right showed the corresponding transepithelial electrical resistance (TER). Duplicate monolayers were studied for each time point. The graph was generated using a representative measurement for each time point. (B) Immunofluorescence detection of occludin at various time points after calcium induced tight junction formation.
FIGURE 8.
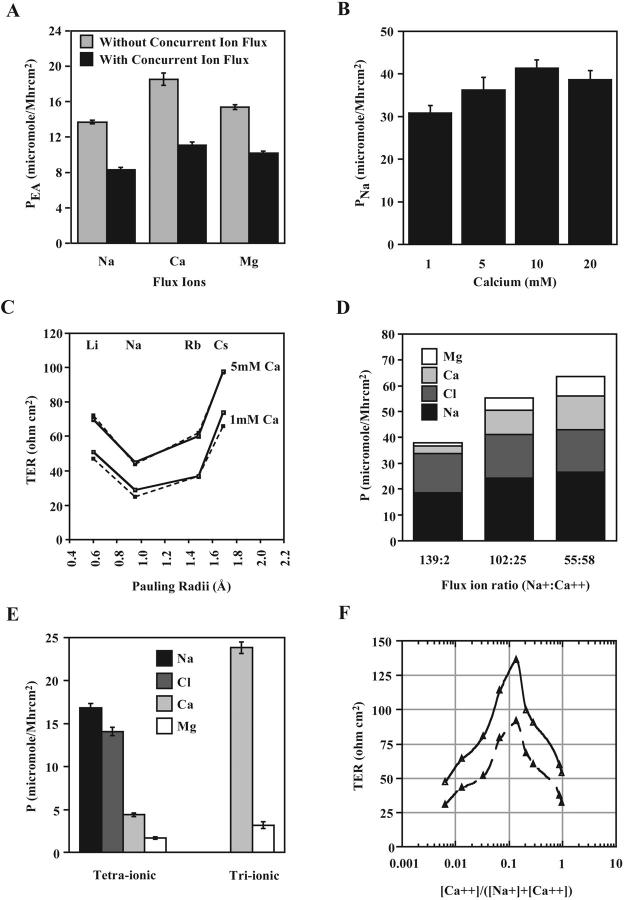
Competition between Na+ and Ca2+ for transit through MDCK II PTJCs. (A) Diminished 14C-ethanolamine flux in the presence of concurrent Na+, Ca2+, and Mg2+ fluxes (n = 6). (B) Addition of Ca2+ did not affect paracellular Na+ permeability (n = 3). (C) Monovalent ion selectivity remained unaltered in the presence of 5 mM Ca2+. Two cell monolayers are plotted. (D) Increased Ca2+ and Mg2+ permeabilities in increasing ratios of basal Ca2+ to Na+ (n = 2). (E) Comparison of tetraionic and triionic (Ca2+, and Mg2+, and Cl−) flux showed increased Ca2+ and Mg2+ permeabilities in the absence of concurrent Na+ flux (n = 3). (F) Anomalous mole-fraction effect between Na+ and Ca2+ by TER measurements. Two monolayers are plotted.
FIGURE 9.
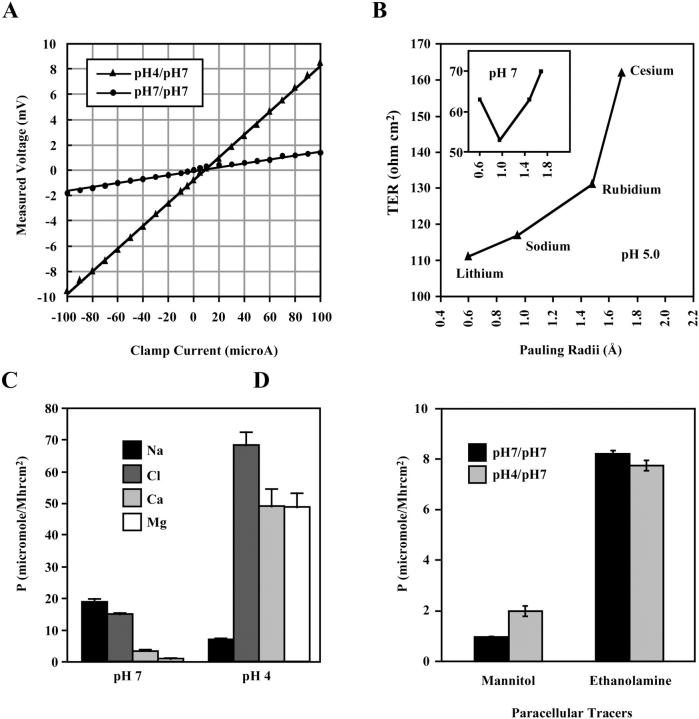
Effects of low pH on paracellular ion selectivity in MDCK II cells. (A) Current-clamp of a cell monolayer showed increased transepithelial electrical resistance at apical pH 4. (B) Monovalent ion selectivity was disrupted at pH 5, which was readily reversible upon replacement to pH 7 solutions (inset). A representative monolayer is shown. (C) Tetraionic permeability profile at apical pH 4 (n = 3). (D) Tracer fluxes of 14C-mannitol and 14C-ethanolamine at apical pH 4. For each tracer, n = 4.
14C-ethanolamine and 14C-mannitol flux
All paracellular tracers were obtained from Amersham, Arlington Heights, IL. Experiments were performed at 37°C for ∼90 min. A final concentration of 10 μM tracers was added to the basal solution. At the end of the experiments, the entire apical solutions were collected and counted in scintillation fluid (Ultima Gold, Parkard, Palo Alto, CA) using Beckman LS60001IC counter. Permeability is the amount of tracer in the apical bathing solution (μmol) per unit driving force (basal molar concentration of tracer), per unit time (h), per area of the monolayer (cm2). For sodium flux in Fig. 8 A, the apical solution was 277 mM mannitol, 1 mM CaCl2, 1 mM MgCl2, 10 mM glucose, and 10 mM HEPES pH 7.4; the basal solution was 145 mM NaCl, 1 mM CaCl2, 1 mM MgCl2, 10 mM glucose, and 10 mM HEPES pH 7.4. For calcium flux in Fig. 8 A, the apical solution was 280 mM mannitol, 1 mM MgCl2, 10 mM glucose, and 10 mM HEPES pH 7.4; the basal solution was 100 mM CaCl2, 1 mM MgCl2, 10 mM glucose, and 10 mM HEPES pH 7.4. For magnesium flux in Fig. 8 A, the apical solution was 280 mM mannitol, 1 mM CaCl2, 10 mM glucose, and 10 mM HEPES pH 7.4; the basal solution was 100 mM MgCl2, 1 mM CaCl2, 10 mM glucose, and 10 mM HEPES pH 7.4. No concurrent flux controls for Fig. 8 A were performed with the basal solutions in both basal and apical wells. For Fig. 9 D, the pH 4 solution was Earle's Balanced Salt Solution (GIBCO), 10 mM glucose, and 10 mM MES; the pH 7 solution was Earle's Balanced Salt solution, 10 mM glucose, and 10 mM HEPES pH 7.4.
Paracellular Na+, Cl−, Ca2+, and Mg2+ flux
Paracellular ion flux experiments were performed from basal to apical as described in Results. At the end of the flux period, apical solutions were collected and spun at 1000 × g for 10 min before determination of ion concentrations. In experiments where net ion flux caused >10% variation in concentration gradients, corrected concentration gradients of 1/2(2[ion]basal−[ion]final apical) were used. For sodium-flux curves in Fig. 5, the apical solution was 280 mM mannitol, 2 mM CaCl2, 1 mM MgCl2, 10 mM glucose, and 10 mM HEPES pH 7.4; the basal solutions were 2 mM CaCl2, 1 mM MgCl2, 10 mM glucose, and 10 mM HEPES pH 7.4 containing either 145 mM NaCl, 110 mM NaCl and 70 mM mannitol, 80 mM NaCl and 130 mM mannitol, 60 mM NaCl and 170 mM mannitol, 40 mM NaCl and 200 mM mannitol, 20 mM NaCl and 240 mM mannitol, 10 mM NaCl and 260 mM mannitol, or 5 mM NaCl and 270 mM mannitol. For calcium-flux curves in Fig. 5, the apical solution was 280 mM mannitol, 1 mM MgCl2, 10 mM glucose, and 10 mM HEPES pH 7.4; the basal solutions were 1 mM MgCl2, 10 mM glucose, and 10 mM HEPES pH 7.4 containing either 100 mM CaCl2, 50 mM CaCl2 and 130 mM mannitol, 20 mM CaCl2 and 220 mM mannitol, 10 mM CaCl2 and 250 mM mannitol, 5 mM CaCl2 and 265 mM mannitol, or 2 mM CaCl2 and 274 mM mannitol. In these Ca2+ studies as well as in the pH studies, described below, it was important that the basolateral compartment was continuously bathed in basal solution during the exchange of apical solutions. For magnesium-flux curves, the apical solution was 280 mM mannitol, 1 mM CaCl2, 10 mM glucose, and 10 mM HEPES pH 7.4; the basal solutions were 1 mM CaCl2, 10 mM glucose, and 10 mM HEPES pH 7.4 containing 100 mM MgCl2, 50 mM MgCl2, and 130 mM mannitol, 20 mM MgCl2 and 220 mM mannitol, 10 mM MgCl2 and 250 mM mannitol, 5 mM MgCl2 and 265 mM mannitol, or 2 mM MgCl2 and 274 mM mannitol.
FIGURE 5.
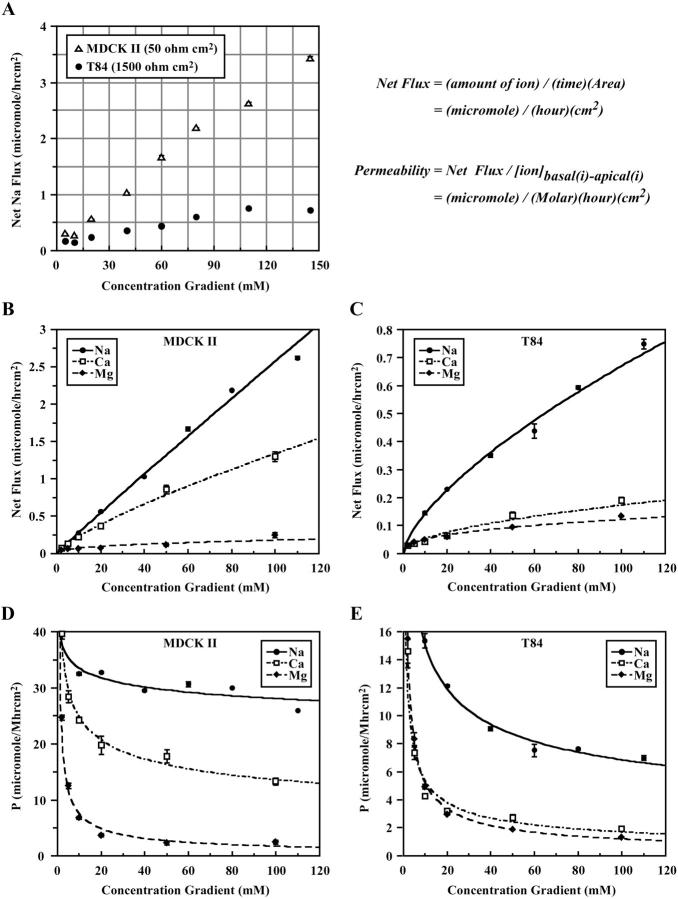
Paracellular Na+, Ca2+, and Mg2+ flux in MDCK II and T84 cells. (A) Na+ flux in MDCK II and T84 cells, as a function of Na+ concentration gradients (n = 3). (B) Na+, Ca2+, and Mg2+ fluxes in MDCK II cells, as functions of concentration gradients. Net sodium flux was calculated by multiplying the concentration of sodium in the final apical solution (molar, M) by its volume (liter, L), divided by the duration of flux (time, h) and the area of the monolayer (cm2), expressed here as μmol/h cm2. Permeability (μmol/M h cm2) is defined here as the net flux divided by the chemical driving force, which has the same unit as the conventional cm/s. (C) Na+, Ca2+, and Mg2+ fluxes in T84 cells, as functions of concentration gradients. (D) Permeabilities of Na+, Ca2+, and Mg2+ in MDCK II cells, as functions of ion concentration gradients. (E) Permeabilities of Na+, Ca2+, and Mg2+ in T84 cells, as functions of ion concentration gradients. For each data point, n = 3.
For tetraionic flux profile in Fig. 6, A and B, and Fig. 8 E, the apical solution was 280 mM mannitol, 10 mM glucose, and 10 mM HEPES pH 7.4; the basal solution was 137 mM NaCl, 10 mM CaCl2, 5 mM MgCl2, 10 mM glucose, and 10 mM HEPES pH 7.4. For calcium switch in Fig. 7 A, the apical solution was 280 mM mannitol, 10 mM glucose, and 10 mM HEPES pH 7.4; the basal solution was 135 mM NaCl, 5 mM CaCl2, 5 mM MgCl2, 10 mM glucose, 10 mM HEPES pH 7. For triionic flux in Fig. 8 E, the apical solution was 150 mM NaCl, 10 mM glucose, and 10 mM HEPES pH 7.5; the basal solution was 128 mM NaCl, 10 mM CaCl2, 5 mM MgCl2, 10 mM glucose, and 10 mM HEPES pH 7.4. For varying the ratios of sodium to calcium flux ions in Fig. 8 D, the apical solution was 280 mM mannitol, 10 mM glucose, and 10 mM HEPES pH 7.4; the basal solutions were 5 mM MgCl2, 10 mM glucose, and 10 mM HEPES pH 7.4 containing 139 mM NaCl and 2 mM CaCl2, 102 mM NaCl and 25 mM CaCl2, or 55 mM NaCl and 58 mM CaCl2. For sodium flux in the presence of increasing calcium in Fig. 8 B, the apical solutions were 220 mM mannitol, 1 mM MgCl2, 10 mM glucose, and 10 mM HEPES pH 7.4 containing either 1 mM CaCl2 and 57 mM mannitol, 5 mM CaCl2 and 45 mM mannitol, 10 mM CaCl2 and 30 mM mannitol, or 20 mM CaCl2; the basal solutions were 120 mM NaCl, 1 mM MgCl2, 10 mM glucose, and 10 mM HEPES pH 7.4 containing either 1 mM CaCl2 and 57 mM mannitol, 5 mM CaCl2 and 45 mM mannitol, 10 mM CaCl2 and 30 mM mannitol, or 20 mM CaCl2. For flux measurements at pH 4 and 7 in Fig. 9 C, the apical solution was 280 mM mannitol, 10 mM glucose, and 10 mM HEPES pH 7.4 or MES pH 4; the basal solution was 135 mM NaCl, 5 mM CaCl2, 5 mM MgCl2, 10 mM glucose, and 10 mM HEPES pH 7.4.
FIGURE 6.
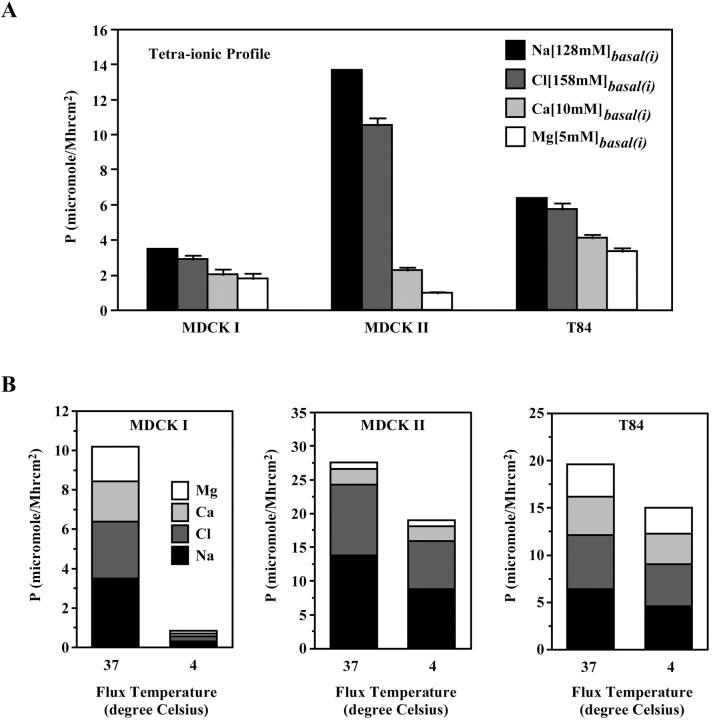
Distinct tetraionic permeability profiles in the three epithelial cells. (A) Concurrent fluxes of Na+, Cl−, Ca2+, and Mg2+ in MDCK I, MDKC II, and T84 monolayers (n = 3). (B) Comparison of tetraionic permeabilities at 37°C and 4°C for MDCK I, MDKC II, and T84 monolayers (n = 3).
Measurement of ion concentration
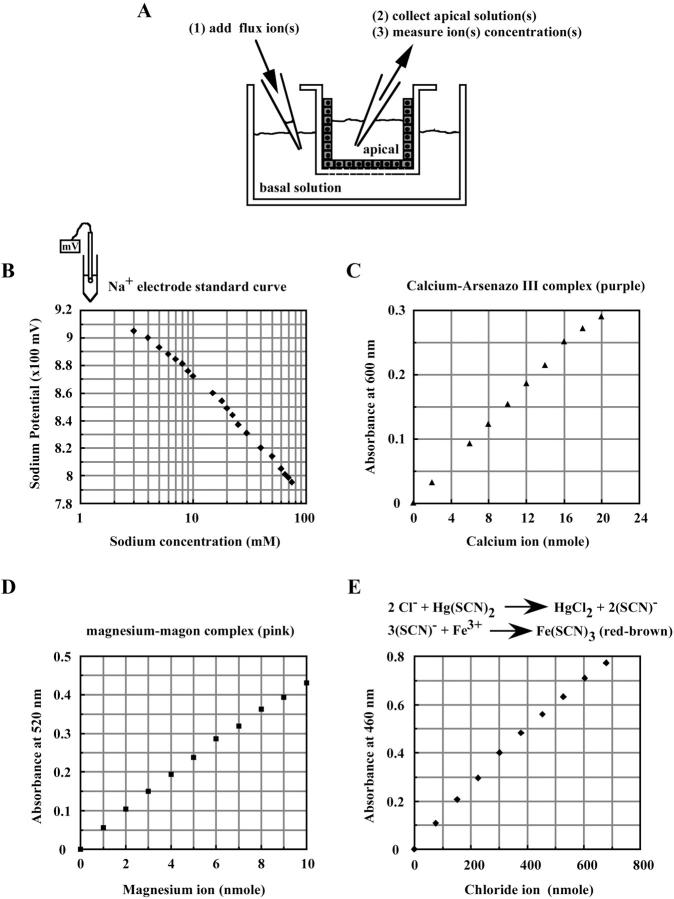
For Na+ concentrations, 25 μL aliquots of the apical solutions from each Transwell were added to 25 μL of water before recording with a sodium electrode (Orion, Beverly, MA). Standard Na+ curves were generated for each experiment by using 25 μL preflux apical solutions and 25 μL water containing known concentrations of NaCl. Sodium concentrations in each sample were then calculated from the standard curve. For Ca2+, Mg2+, or Cl− concentrations, colorimetric assays were optimized for each flux sample and ion concentrations were calculated from standard linear curves. Calcium concentrations were measured using Arsenazo III (2,2′-[1,8-Dihydroxy-3,6-disulfonapthylene-2,7-bisazo]-bis-benzenearsonic acid, Sigma #588-3) which formed a 600-nm absorbance maximum complex upon calcium binding under acidic conditions. Magnesium concentrations were measured using Magon (1-azo-2-hydroxy-3-(2,4-dimethyl-carboxanilido)-naphthalene-1′-(2-hydroxybenzene-5-sulfonate, Sigma #596-3, that formed a 520-nm absorbance maximum complex upon magnesium binding under alkaline conditions. Chloride concentrations were measured by the formation of a 420-absorbance maximum precipitate, Fe(SCN)3 upon displacement of SCN from Hg(SCN)2 by chloride under acidic conditions (Sigma #461-3). Briefly, an aliquot of the final apical solution was added to 500 μL of either calcium reagent, magnesium reagent or chloride reagent. Absorbance of individual samples was measured with a spectrometer. Sample volumes varied from 0.2 μL to 300 μL and were determined empirically to fit in the linear ranges of the colorimetric assays. Standard Ca2+, Mg2+, or Cl− curves were generated with equal volumes of preflux apical solutions.
RESULTS
We have chosen three well-characterized epithelial cell lines, MDCK I, MDCK II, and T84, for our present study. MDCK I cells show morphological and biochemical characteristics of renal collecting duct epithelia, which have high TER, i.e., low paracellular ionic conductance (Barker and Simmons, 1981; Richardson et al., 1981). MDCK II cells show morphological and biochemical characteristics of renal proximal tubule epithelia, which have low TER, i.e., high paracellular ionic conductance (Barker and Simmons, 1981; Richardson et al., 1981). T84 cells show characteristics of intestinal epithelia and have moderately high TER (Madara and Dharmsathaphorn, 1985), intermediate to that of MDCK I and MDCK II cells.
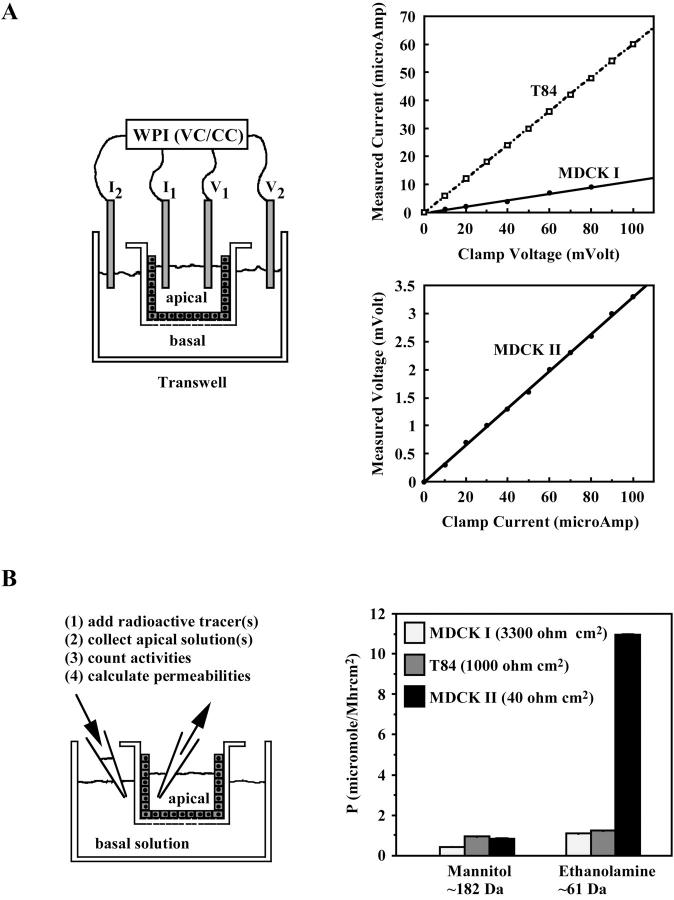
To establish consistent measurements, cells were plated at confluent density and allowed postconfluent growth for about two weeks. This routine was important for the control of cell number and tight junction maturity, giving reproducible electrical and flux measurements that could be used for comparisons between experiments. Fig. 2 A shows transepithelial electrical measurements using voltage-clamp and current-clamp techniques. In our setup (see Materials and Methods), voltage clamp was used for the high resistance MDCK I and T84 cells and current clamp was used for the low resistance MDCK II cells. We found that all current-voltage relationships were ohmic and transgressed through the origin, indicating that ion transit was passive and a direct function of voltage.
FIGURE 2.
Three epithelial cell lines, MDCK I, MDCK II, and T84, had different paracellular ion and tracer permeabilities. (A) Voltage and current clamps showed ohmic I-V relationships in all three cell types. (B) Paracellular tracer fluxes of 14C-ethanolamine and 14C -mannitol in MDCK I, MDCK II, and T84 cells (n = 6).
Comparison of paracellular fluxes of tracers (14C-mannitol, mol wt 182; 14C-choline, mol wt 105) suggested that PTJCs had narrow pores (Fig. 2 B). 14C-mannitol, which has a calculated diameter of ∼7.2 Å (Madara and Dharmsathaphorn, 1985), had low permeabilities which failed to correlate qualitatively with TER of the three cell lines. Although mannitol is widely used for the assessment of tight junction function, our present data indicate that this six-carbon linear sugar cannot move freely through the paracellular pore. Indeed, paracellular permeabilities of the other larger tracers inulin (mol wt 5000) and dextran (mol wt 1000 and 3000) were negligible using our current protocol (data not shown). Paracellular flux assays using a smaller tracer, 14C-ethanolamine, which has a calculated diameter of ∼4.9 Å (Dwyer et al., 1980), showed a substantially higher permeability in the low resistance MDCK II cells than in the higher resistance T84 and MDCK I cells. These results suggested that the functional pores of the PTJCs must be at least 4.9 Å in diameter but not much bigger than 7 Å, which is comparable to the dimension of some conventional ion channels (Balasubramanian et al., 1995; Dwyer et al., 1980; Goulding et al., 1993).
To investigate the biophysical properties of the PTJCs, we measured transepithelial electrical resistance in defined electrolyte solutions using a pair of AgCl/AgCl pellet electrodes. All physiological experiments presented here were performed using cell monolayers grown on Transwell membranes, where both apical and basolateral bathing solutions could be changed separately. To avoid disturbing the epithelial monolayer during experiments, it was necessary to change the bathing solutions by gently pipetting at the top edge of the culture wells to allow gradual dilution and exchange of the apical solution rather than direct removal and replacement (Fig. 3 A). All solutions were prewarmed to 37°C and cells were maintained at 37°C during experiments on a heat block. This protocol was essential for reproducibility because ion mobility is a function of temperature. At the end of each experiment, TERs of the monolayers were again measured in the starting solutions. Only monolayers that showed completely reversible TERs were considered healthy and undisturbed. For comparison of TERs obtained in different solutions, measurements were normalized electroequivalently to a standard NaCl-based solution (see Materials and Methods).
To assess the selectivities of the PTJCs to monovalent ions, we substituted the primary conductor, NaCl, with other alkaline metal cations (Fig. 3, B and C). We found that the monovalent ion selectivities were distinct for all three epithelial cell types. The radius-TER curves, obtained by plotting the measured TERs against the radii of the cations, revealed that ion mobility deviated from free diffusion of ions in solution (Eisenman, 1962; Robinson and Stokes, 1965). Three monolayers of MDCK II cells generated similar U-shaped radius-TER curves with the selectivity Na+ > Rb+ > Li+ > Cs+ (Fig. 3 B), a sequence that is shared by the retinal and gustatory cyclic nucleotide-gated channel (Goulding et al., 1993; Lee et al., 2001). MDCK I cells had a V-shaped radius-TER curve (Fig. 3 C) with the selectivity sequence, Na+ > Li+ > Rb+ > Cs+, identical to that of the olfactory cyclic nucleotide-gated channel (Goulding et al., 1993). These data were reproducible with two additional MDCK I monolayers (data not shown). Measurements of four T84 monolayers generated shallower V-shaped radius-TER curves revealing a weak selectivity for the monovalent cations (Fig. 3 C). All four T84 monolayers produced identical ion selectivity sequences, despite variations in TER, indicating that the biophysical properties of the PTJCs were conserved within the same cell type regardless of the numbers of open channels. These data indicated that the paracellular channels showed selectivity for size/charge.
Many conventional ion channels show a conductance block by divalent ions such as calcium (Kerschbaum and Cahalan, 1998; Nasi and del Pilar Gomez, 1999; Worley et al., 1992; Zufall and Firestein, 1993). To assess whether the PTJCs also share this property with conventional channels, we measured TER in increasing concentrations of Ca2+ in a solution containing NaCl as the primary conductor. We found that the sensitivities to Ca2+ were distinct in all three epithelial cell types (Fig. 3, D–F). Although T84 channels were relatively insensitive to Ca2+, MDCK I and MDCK II cells showed variable sensitivity to calcium.
To further examine the ion-conducting properties of PTJCs, we developed paracellular flux assays for Na+, Cl−, Ca2+, and Mg2+ (see Materials and Methods). In these assays, the ion of interest was added to the basal compartment of the Transwell and its flux across the epithelial monolayer was calculated from its concentration in the apical solution at the end of an experiment (Fig. 4 A). In general, paracellular ion flux reached steady state within an hour. All flux experiments were performed at 37°C for ∼1–3 h. A sodium electrode was used to measure sodium concentrations. Colorimetric assays were used to measure calcium, magnesium, and chloride concentrations. Quantitative assays were optimized for each flux sample and ion concentrations were calculated from standard linear curves (Fig. 4, B–E).
FIGURE 4.
Establishing ion flux assays. (A) Schematic protocol for measurements of paracellular ion fluxes. (B) A Na+ standard curve generated with sodium potentials. (C) A Ca2+ standard curve. (D) A Mg2+ standard curve. (E) A Cl− standard curve.
When the paracellular flux of Na+ was measured with increasing Na+ concentration gradients, we found a linear relationship between the net flux and the concentration gradient (Fig. 5 A). The Na+ flux-gradient curve for MDCK II monolayers did not show saturation at physiological Na+ concentration. However, T84 monolayers had a less graded flux-gradient curve that eventually saturated at ∼100 mM Na+ (reproducible in three separate experiments). A plateau of Na+ flux was evident at low gradients (5–10 mM), suggesting increased Na+ permeabilities. These results were in qualitative agreement with TER measurements for T84 and MDCK II cells. To the best of our knowledge, there is no basal-to-apical transcellular ion transport mechanism in MDCK and T84 cells that is known to operate under our experimental conditions, therefore the majority of the measured Na+ flux must pass through the tight junction.
Measurements of paracellular fluxes of Ca2+ and Mg2+ indicated that the divalent cations had lower fluxes than sodium in both MDCK II and T84 cells (Fig. 5, B and C). Ca2+ was more permeable than Mg2+ in MDCK II cells. However, both Ca2+ and Mg2+ had low paracellular fluxes in T84 cells. To assess the concentration-conductance relationship, ion permeabilities were plotted against their respective concentration gradients (Fig. 5, D and E). With the exception of sodium permeabilities in MDCK II channels, which were approximately constant from 10 to 145 mM Na+ gradients, all ions showed increasing permeabilities with decreasing concentration gradients. The substantial rise in Ca2+ and Mg2+ permeabilities at low concentration gradients could be physiologically significant as most paracellular transports of these divalents operate at a range below 5 mM. The observed dependency of ion permeability on ion concentration is also a characteristic of many conventional ion channels (Balasubramanian et al., 1997; Guia et al., 2001; Heginbotham and MacKinnon, 1993; Olans et al., 1984).
When the fluxes of all four extracellular ions were measured simultaneously, a permeability profile representing concurrent ionic fluxes was obtained (Fig. 6 A). The overall ion permeability correlated qualitatively with TER for the three epithelial cells. Although MDCK I and T84 channels allowed approximately equal permeation of the four ions, MDCK II channels showed a strong selectivity for Na+ and Cl− over Ca2+ and Mg2+. Two interesting observations emerged. First, the permeabilities of Na+, Ca2+, and Mg2+ in MDCK II cells were substantially lower when obtained in a profile than one ion at a time (Figs. 5 D and 6 A). Whereas Na+ permeability was reduced twofold, Ca2+ and Mg2+ permeabilities decreased almost 10-fold. These results suggested that all three cations competed with each other for transit through the channels. This was not true for T84 channels as the three cations retained their permeabilities even when measured concurrently in a profile. Second, despite having the lowest TER, MDCK II cells were least permeable to Mg2+ when compared to MDCK I and T84 cells. Furthermore, T84 cells, which had intermediate TER, were twofold more permeable to Ca2+ than both the higher TER MDCK I cells and the lower TER MDCK II cells at the same time. These observations underscored the value of our permeability measurements over the standard TER method. Because TER is the summated conductance of all ions moving in both directions, apically and basally, it is strongly biased toward the movements of the primary conductors and thus does not necessarily represent the permeabilities of secondary ions such as calcium and magnesium.
The temperature sensitivity of ion flux will be different depending on whether it is a physical process, such as ion flow through a pore, or a chemical process that involves carriers and transporters. According to the Q10 rule of Arrhenius, the rate of a physical process changes ∼10–15% per each 10 degree difference in temperature whereas the rate of a chemical process changes ∼two- to threefold per 10 degrees. To verify that paracellular ion flux represents a true physical process rather than a chemical process, we compared ion fluxes performed at 37°C and 4°C (Fig. 6 B). We found reduction in ion permeabilities according to the Q10 rule for both MDCK II and T84 channels. MDCK II Na+ flux decreased from 13.7 μmol/M h cm2 to 8.7 μmol/M h cm2 and T84 Na+ flux decreased from 6.5 μmol/M h cm2 to 4.3 μmol/M h cm2, both values within the predictions for a physical process. In addition, the overall paracellular ion flux profiles were maintained at 4°C for both MDCK II and T84 cells. Therefore, the paracellular ion permeabilities in MDCK II and T84 cells approximated the temperature sensitivity expected from channels, but not carriers or transporters. However, ion permeabilities of MDCK I monolayers showed sensitivities to temperature beyond the prediction of the Q10 rule, making it difficult to interpret the flux results.
To establish the role of tight junctions in the generation of paracellular ion selectivity, ion fluxes were monitored during tight junction assembly (Fig. 7 A). When MDCK II cells are allowed to grow in low calcium medium (<50 μM), tight junctions do not form. Synchronized formation of tight junctions can be induced by the addition of normal Ca2+-containing medium (Wittchen et al., 2000). In the absence of tight junctions, paracellular ion permeabilities increased >10× and the flux profiles were completely abolished (Fig. 7 A, see the earliest time point, t = 0.3 h). Upon addition of Ca2+, TER peaked at ∼24 h and restabilized to ∼60 Ω cm2 at ∼48 h. The overshoot of TER at ∼24 h was a reproducible phenomenon during tight junction assembly although its nature is unknown (Wittchen et al., 2000). The paracellular flux of all ionic species decreased continually during tight junction formation, until a steady state was reached at ∼24 h. At this time, the characteristic ion permeability profile was fully established, correlating with the continuous morphological localization of occludin, an integral membrane protein of the tight junction (Fig. 7 B). These results suggested that paracellular ion selectivity required the formation of intact tight junctions.
Channels show exclusion effects as permeant molecules compete for occupancy. Our results suggested that Na+, Ca2+ and Mg2+ competed with each other for transit through the MDCK II channels (Figs. 5 and 6). To further study this exclusion effect, we examined 14C-ethanolamine permeabilities in the presence and absence of a concurrent flux of Na+, Ca2+, or Mg2+. We found that 14C-ethanolamine permeabilities were reduced when the tracer and the ions were driven simultaneously by concentration gradients (Fig. 8 A). Therefore, Na+, Ca2+ and Mg2+ also competed with 14C-ethanolamine for transit. These results suggested that all four permeant molecules share a common PTJC and affect transport of each other by exclusion.
Besides competing with other permeant molecules, Ca2+ also increased TER in a dose dependent manner in MDCK II cells, suggesting a blockade of the PTJCs (Fig. 2 C). To clarify these Ca2+ effects, the paracellular flux of Na+ was measured in the presence of 1, 5, 10, or 20 mM Ca2+ in both apical and basal compartments, i.e., in the absence of concomitant Ca2+ flux. We found that the permeability of Na+ was not decreased by Ca2+, indicating that the PTJCs were not blocked (Fig. 8 B). To determine whether the ion selectivities of the PTJCs were affected, radius-TER curves were obtained in the presence of 1 and 5 mM Ca2+ (Fig. 8 C). We found an upward shift of the radius-TER curves without a change in the ion selectivity sequence. Therefore, the increases in TER must be due to the exclusion of the alkaline metal ions by Ca2+ when all the ions were driven simultaneously to traverse the PTJCs. In conclusion, Ca2+ did not close, block, or modify the paracellular pathway. Instead, Na+ and Ca2+ must be competing for the same PTJCs.
Ion-ion and ion-pore interactions have been used to explain a behavior called the “anomalous mole-fraction effect,” where two different ions, having different affinities for the pore, compete and interact with each other. To test whether such a phenomenon can be used to explain our observations on the ion permeation properties of MDCK II channels, we measured ion flux profile in varying ratios of flux ions (Fig. 8 D). We found that the permeabilities of Na+ to Ca2+ changed from ∼6:1 to ∼2:1 when their initial concentrations in the basal solution were changed from 139:2 to 55:58. In addition, the permeabilities of Na+ to Mg2+ also changed from ∼17:1 to ∼4:1. These results confirmed that all three cations indeed competed for the same PTJCs. On the other hand, the permeability of Cl− remained relatively constant, suggesting that the anion did not compete with the cations and/or directly interact with the pores. Moreover, in the absence of concurrent Na+ flux, Ca2+ permeability increased sevenfold, exceeding that of Na+ in a parallel experiment (Fig. 8 E). We also reproduced the anomalous effect by electrical measurements (Fig. 8 F). When the ratio of Na+ to Ca2+ was varied systematically, we observed a rise in transepithelial electrical resistance as the bathing solution contained increasing concentrations of Ca2+, until a peak TER was reached and further addition of Ca2+ resulted in a decline in TER. These data also showed that two independent monolayers of MDCK II cells, despite having different basal TERs, manifested a similar anomalous mole-fraction effect. Again, it was the absolute numbers of channels that would account for the variation in TER between individual monolayers although the physical properties of the PTJCs were conserved within the same cell type. Many conventional ion channels share this anomalous mole-fraction effect where a mixture of two permeant ions yields a lower single channel conductance than with either ion species alone (Friel and Tsien, 1989; Heginbotham and MacKinnon, 1993; Qu et al., 2001; Sesti et al., 1995).
Electrostatic interactions are the basis for ion-ion and ion-pore interactions. Therefore, changing the pH frequently results in the modulation of ion conducting properties of channels (Dzeja et al., 1999; Tombaugh and Somjen, 1996; Zhou and Jones, 1996). To assess the possible role of fixed-charges on the PTJCs, we studied the effects of pH on ion permeabilities and selectivities of MDCK II channels. When the apical bathing solution was changed from pH 7 to 4, we found an ∼4× increase in TER, as shown by the generation of a steeper I-V curve (Fig. 9 A). This was accompanied by a disruption of the radius-TER curve (Fig. 9 B). The disruption of ion selectivity by low pH was reversible immediately upon returning to neutral pH and was likely to be a direct effect of protonation of channel side chains (inset, Fig. 9 B). Lowering the pH also altered the overall ion flux profile, resulting in an ∼3× decrease in Na+ permeability, an ∼6× increase in Cl− permeability, and ∼10× increases in Ca2+ and Mg2+ permeabilities (Fig. 9 C). However, the disruption of the ion selectivities of PTJCs was unlikely to be due to closing or decrease in numbers of channels because tracer flux of 14C-mannitol actually increased whereas 14C-ethanolamine did not decrease (Fig. 9 D). In conclusion, fixed charges appeared to also play a role in ion permeation through the PTJCs.
DISCUSSION
Using established methods, we found that the tight junction of MDCK I, MDCK II, and T84 cells had distinct monovalent ion selectivity, Ca2+ sensitivity, and permeabilities to paracellular tracers. Comparison of 14C-mannitol and 14C-ethanolamine fluxes suggested that the tight junction channels have pores of diameter ∼5 to 7 Å, a dimension comparable to many ion channels. Larger tracers, such as 14C-inulin and Dextran (mol wt > 3000), were impermeant in our experiments (data not shown).
In general, tracer flux experiments have their limitations and caveats. Chemical decay of tracers that generate smaller and more permeant degradation products can increase the apparent flux measurements. In fact, it is essential to purify the larger tracers, 14C-inulin and Dextran, by gel filtration (Sephadex G-25) immediately before each experiment to prevent erroneous results (unpublished data). Purification of smaller tracers requires putting the radioactive compounds through HPLC (high performance liquid chromatography), which is not done routinely. 3H-compounds are chemically less stable and have higher degradation rates which can potentially compromise the accuracy of flux measurements.
Beside tracer fluxes, the study of tight junction permeability has relied on TER measurements. Relative ion permeabilities (permeability ratios) have been obtained that are based on the assumption that ions transit through the tight junction are independent of each other. Frequently, the permeabilities of many ions (such as calcium and magnesium) in the bathing solutions were assumed to be zero for the ease of interpretation and the calculation of permeability ratios (Colegio et al., 2002; Van Itallie et al., 2001). As this approach may obscure the potentially interesting permeability of divalent ions, we developed a new experimental design that permits the direct measurement of paracellular ion fluxes.
We have used a novel scheme to measure paracellular flux of four major extracellular ions (Na+, Cl−, Ca2+, and Mg2+). We have continued to use MDCK I, MDCK II, and T84 cells in our study because these epithelial cells have very small membrane conductance (Bell and Quinton, 1992; Cereijido, 1984; Cliff and Frizzell, 1990; Devor et al., 1990; Lang and Paulmichl, 1995). The resting membrane potentials of both MDCK and T84 cells are measured at ∼50 mV, suggesting that their cell membrane conductances are primarily of potassium and/or chloride currents (Devor et al., 1990; Paulmichl et al., 1986). Indeed, whole cell membrane resistance of T84 cells was measured to be >3 GΩ with negligible sodium and calcium currents (Bell and Quinton, 1992; Devor and Duffey, 1992; Devor et al., 1990). Whole cell membrane resistance of MDCK cells was measured to be ∼60 MΩ or ∼2000 Ω cm2, also with negligible sodium and calcium conductance (Cereijido, 1984; Lang and Paulmichl, 1995; Paulmichl et al., 1986; Ritter and Lang, 1990). In addition, electrode probe experiments that scan the surface of MDCK cells had identified the intercellular junction as the major site of ion conductance (Cereijido et al., 1981). Therefore, these epithelial cells have minimal transcellular ion channel activities when compared to the paracellular pathway and provide an invaluable, well-characterized system for the study of tight junction ion permeability.
Using our new techniques, we have shown that the paracellular tight junction channel (PTJC) manifested biophysical properties of ion channels including ion and size selectivity, concentration dependent ion permeability, competition between permeant molecules, anomalous mole-fraction effect, and sensitivity to pH. In addition, formation of intact tight junctions appeared to be a functional prerequisite for paracellular ion selectivity. We propose that discrete ion channels be inserted at the tight junction to support paracellular ion transport.
PTJCs have been hypothesized to be constructed by the extracellular domains of integral membrane proteins, creating pores that are oriented parallel to the membrane plane (Wong and Goodenough, 1999). The insertion of these PTJCs at the tight junction would provide regulated extracellular ion transport through the paracellular pathway. The tight junction contains linear arrays of intramembrane particles forming a network of fibrils that can be seen in freeze-fracture replicas by electron microscopy. Unfortunately, the structural information provided by these freeze-fracture replicas is insufficient to explain the variation in ion conducting properties of the tight junction in different epithelial cells. Although a correlation between TER and fibril structures can sometimes be made (Claude and Goodenough, 1973), numerous studies have indicated that structure does not relate function (Cereijido et al., 1983; Furuse et al., 2001; González-Mariscal et al., 1984; Jaeger et al., 1997; Mandel et al., 1993; Martinez-Palomo and Erlij, 1975; Mollgard et al., 1979; Stevenson et al., 1988; von Bulow et al., 1984; Walker et al., 1988). Therefore, elements that are not revealed by freeze-fracture replicas must be important in dictating the ion conducting properties of PTJCs.
Many proteins, including occludin (three isoforms), claudin (>21 orthologs), and JAM (junction-associated molecule) have been localized to the tight junction. However, the stoichiometry of these proteins in a single tight junction fibril and their oligomerization into heteromeric and heterotypic assemblies are not known. Elucidation of the unit composition of PTJC and the overall molecular architecture of the tight junction is a very challenging but essential step in the understanding paracellular ion transport. However, without the knowledge of the molecular composition of a unit PTJC, it is premature to assign precise function to each tight junction protein.
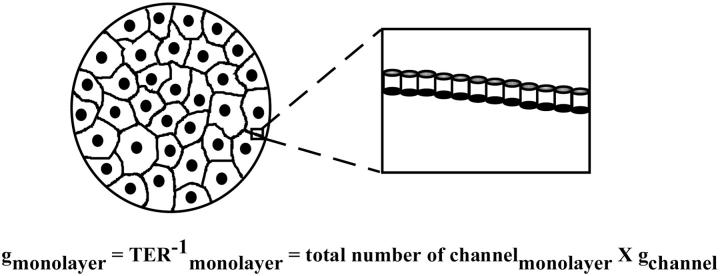
Our data do not provide enough information for the comparison of individual PTJCs between different epithelial cells. Inasmuch as TER and fluxes are measurements from a population of PTJCs, they cannot be directly translated into unitary conductance without the knowledge of the total numbers of PTJCs in each cell monolayer (Fig. 10). Experiments that directly count PTJCs in these epithelial cells are necessary for further understanding and characterization of these paracellular ion channels.
FIGURE 10.
Working hypothesis of paracellular tight junction channels.
Acknowledgments
We thank David L. Paul for critical comments and encouragement throughout the project. Drs. Alan S. Yu, David Clapham, and Wayne Lencer provided helpful discussions in the early stages of this study. We also thank Friso Postma for thoughtful suggestions on the manuscript.
This research was supported by GM18974 (DAG), GM37751 (David L. Paul), F270379 (Marian R. Neutra), and DK09796-02 (VWT).
References
- Balasubramanian, S., J. W. Lynch, and P. H. Barry. 1995. The permeation of organic cations through cAMP-gated channels in mammalian olfactory receptor neurons. J. Membr. Biol. 146:177–191. [DOI] [PubMed] [Google Scholar]
- Balasubramanian, S., J. W. Lynch, and P. H. Barry. 1997. Concentration dependence of sodium permeation and sodium ion interactions in the cyclic AMP-gated channels of mammalian olfactory receptor neurons. J. Membr. Biol. 159:41–52. [DOI] [PubMed] [Google Scholar]
- Barker, G., and N. L. Simmons. 1981. Identification of two strains of cultured canine renal epithelial cells (MDCK cells) which display entirely different physiological properties. Q. J. Exp. Physiol. 66:61–72. [DOI] [PubMed] [Google Scholar]
- Bell, C. L., and P. M. Quinton. 1992. T84 cells: anion selectivity demostrates expression of Cl− conductance affected in cystic fibrosis. Am. J. Physiol. 262:C555–C562. [DOI] [PubMed] [Google Scholar]
- Cereijido, M. 1984. Electrical properties of Madin-Darby canine kidney cells. Federation Proc. 43:2230–2235. [PubMed] [Google Scholar]
- Cereijido, M., L. Gonzalez-Mariscal, and L. Borboa. 1983. Occluding junctions and paracellular pathways studied in monolayers of MDCK cells. J. Exp. Biol. 106:205–215. [DOI] [PubMed] [Google Scholar]
- Cereijido, M., I. Meza, and A. Martinez-Palomo. 1981. Occluding junctions in cultured epithelial monolayers. Am. J. Physiol. 240:C96–C102. [DOI] [PubMed] [Google Scholar]
- Claude, P., and D. A. Goodenough. 1973. Fracture faces of zonulae occludentes from “tight” and “leaky” epithelia. J. Cell Biol. 58:390–400. [DOI] [PMC free article] [PubMed] [Google Scholar]
- Cliff, W. H., and R. A. Frizzell. 1990. Separate Cl− conductances activated by cAMP and Ca2+ in Cl−-secreting epithelial cells. Proc. Natl. Acad. Sci. USA. 87:4956–4960. [DOI] [PMC free article] [PubMed] [Google Scholar]
- Colegio, O. R., C. M. Van Itallie, H. J. McCrea, C. Rahner, and J. M. Anderson. 2002. Claudins create charge-selective channels in the paracelular pathway between epithelial cells. Am. J. Physiol. 283:C142–C147. [DOI] [PubMed] [Google Scholar]
- Devor, D. C., and M. E. Duffey. 1992. Carbachol induces K+, Cl− and non-selective cation conductances in T84 cells: a perforated patch-clamp study. Am. J. Physiol. 263:C780–C787. [DOI] [PubMed] [Google Scholar]
- Devor, D. C., S. M. Simasko, and M. E. Duffey. 1990. Carbachol induces oscillations of membrane potassium conductance in a colonic cell line, T84. Am. J. Physiol. 258:C318–C326. [DOI] [PubMed] [Google Scholar]
- Dwyer, T. M., D. J. Adams, and B. Hille. 1980. The permeability of the endplate channel to organic cations in frog muscle. J. Gen. Physiol. 75:469–492. [DOI] [PMC free article] [PubMed] [Google Scholar]
- Dzeja, C., V. Hagen, U. B. Kaupp, and S. Frings. 1999. Ca2+ permeation in cyclic nucleotide-gated channels. EMBO J. 18:131–144. [DOI] [PMC free article] [PubMed] [Google Scholar]
- Eisenman, G. 1962. Cation selective glass electrodes and their mode of operation. Biophys. J. 2(Suppl.):259–323. [DOI] [PMC free article] [PubMed] [Google Scholar]
- Friel, D. D., and R. W. Tsien. 1989. Voltage-gated calcium channels:direct observation of the anomalous mole fraction effect at the single-channel level. Proc. Natl. Acad. Sci. USA. 86:5207–5211. [DOI] [PMC free article] [PubMed] [Google Scholar]
- Fromter, E., and J. M. Diamond. 1972. Route of passive ion permeation in epithelia. Nature (Lond.). 235:9–13. [DOI] [PubMed] [Google Scholar]
- Furuse, M., K. Furuse, H. Sasaki, and S. Tsukita. 2001. Conversion of Zonulae Occludentes from tight to leaky strand type by introducing claudin-2 into Madin-Darby canine kidney I cells. J. Cell Biol. 153:263–272. [DOI] [PMC free article] [PubMed] [Google Scholar]
- González-Mariscal, L., B. Chavez de Ramirez, and M. Cereijido. 1984. Effect of temperature on the occluding junctions of monolayers of epithelioid cells (MDCK). J. Membr. Biol. 79:175–184. [DOI] [PubMed] [Google Scholar]
- Goulding, E. H., G. R. Tibbs, D. Liu, and S. A. Siegelbaum. 1993. Role of H5 domain in determining pore diameter and ion permeation through cyclic nucleotide-gated channels. Nature. 364:61–64. [DOI] [PubMed] [Google Scholar]
- Guia, A., M. D. Stern, E. G. Lakatta, and I. R. Josephson. 2001. Ion concentration-dependence of rat cardiac unitary L-type calcium channel conductance. Biophys. J. 80:2742–2750. [DOI] [PMC free article] [PubMed] [Google Scholar]
- Heginbotham, L., and R. MacKinnon. 1993. Conductance properties of the cloned Shaker K+ channel. Biophys. J. 65:2089–2096. [DOI] [PMC free article] [PubMed] [Google Scholar]
- Jaeger, M. M. M., G. Kalinec, V. Dodane, and B. Kachar. 1997. A collagen substrate enhances the sealing capacity of tight junctions of A6 cell monolayers. J. Membr. Biol. 159:263–270. [DOI] [PubMed] [Google Scholar]
- Kerschbaum, H. H., and M. D. Cahalan. 1998. Monovalent permeability, rectification, and ionic block of store-operated calcium channels in Jurkat T lumphocytes. J. Gen. Physiol. 111:521–537. [DOI] [PMC free article] [PubMed] [Google Scholar]
- Lang, F., and M. Paulmichl. 1995. Properties and regulation of ion channels in MDCK cells. Kidney Int. 48:1200–1205. [DOI] [PubMed] [Google Scholar]
- Lee, H. M., Y. S. Park, W. Kim, and C.-S. Park. 2001. Electrophysiological characteristics of rat gustatory cyclic nucleotide-gated channel expressed in Xenopus oocytes. J. Neurophysiol. 85:2335–2349. [DOI] [PubMed] [Google Scholar]
- Madara, J. L. 1990. Maintenance of the macromolecular barrier at cell extrusion sites in intestinal epithelium: physiological rearrangement of tight junctions. J. Membr. Biol. 116:177–184. [DOI] [PubMed] [Google Scholar]
- Madara, J. L., and K. Dharmsathaphorn. 1985. Occluding junction structure-function relationships in a cultured epithelial monolayer. J. Cell Biol. 101:2124–2133. [DOI] [PMC free article] [PubMed] [Google Scholar]
- Mandel, L. J., R. Bacallao, and Z. Guido. 1993. Uncoupling of the molecular ‘fence’ and paracellular ‘gate’ functions in epithelial tight junctions. Nature (Lond.). 361:552–555. [DOI] [PubMed] [Google Scholar]
- Martinez-Palomo, A., and D. Erlij. 1975. Structure of tight junctions in epithelia with different permeability. Proc. Natl. Acad. Sci. USA. 72:4487–4491. [DOI] [PMC free article] [PubMed] [Google Scholar]
- Mollgard, K., B. Lauritzen, and N. R. Sauders. 1979. Double replica technique applied to choroid plexus from early foetal sheep: completeness and complexity of tight junctions. J. Neurocytol. 8:139–149. [DOI] [PubMed] [Google Scholar]
- Myers, V. B., and D. A. Haydon. 1972. Ion transfer across lipid membranes in the presence of gramicidin A. II. The ion selectivity. Biochim. Biophys. Acta. 274:313–322. [DOI] [PubMed] [Google Scholar]
- Nasi, E., and M. del Pilar Gomez. 1999. Divalent cation interactions with light-dependent K channels. Kinetics of voltage-dependent block and requirement for an open pore. J. Gen. Physiol. 114:653–672. [DOI] [PMC free article] [PubMed] [Google Scholar]
- Olans, L., S. Sariban-Sohraby, and D. J. Benos. 1984. Saturation behavior of single, amiloride-sensitive Na+ channels in planar lipid bilayers. Biophys. J. 46:831–835. [DOI] [PMC free article] [PubMed] [Google Scholar]
- Paulmichl, M., F. Friedrich, and F. Lang. 1986. Electrical properties of Madin-Darby-canine-kidney cells. Pflugers Arch. 407:258–263. [DOI] [PubMed] [Google Scholar]
- Powell, D. W. 1981. Barrier function of epithelia. Am. J. Physiol. 241:G275–G288. [DOI] [PubMed] [Google Scholar]
- Qu, W., A. J. Moorhouse, A. M. Cunningham, and P. H. Barry. 2001. Anomalous mole-fraction effects in recombinant and native cyclic nucleotide-gated channels in rat olfactory receptor neurons. Proc. R. Soc. Lond. B Biol. Sci. 268:1395–1403. [DOI] [PMC free article] [PubMed] [Google Scholar]
- Richardson, J. C. W., V. Scalera, and N. L. Simmons. 1981. Identification of two strains of MDCK cells which resemble separate nephron tubule segments. Biochim. Biophys. Acta. 673:26–36. [PubMed] [Google Scholar]
- Ritter, M., and F. Lang. 1990. Determination of cell membrane resistance in cultured renal epithelioid (MDCK) cells: effects of cadmium and mercury ions. Pflugers Arch. 417:29–36. [DOI] [PubMed] [Google Scholar]
- Robinson, R. A., and R. H. Stokes. 1965. Electrolyte Solutions. Butterworths. London:. 571 pp.
- Sesti, F., E. Eismann, U. B. Kaupp, M. Nizzari, and V. Torre. 1995. The multi-ion nature of the cGMP-gated channel from vertebrate rods. J. Physiol. (Lond.). 487:17–36. [DOI] [PMC free article] [PubMed] [Google Scholar]
- Simon, D. B., Y. Lu, K. A. Choate, H. Velazquez, E. Al-Sabban, M. Praga, G. Casari, A. Bettinelli, G. Colussi, J. Rodriguez-Soriano, D. McCredie, D. Milford, S. Sanjad, and R. P. Lifton. 1999. Paracellin-1, a Renal Tight Junction Protein Required for Paracellular Mg2+ Resorption. Science. 285:103–106. [DOI] [PubMed] [Google Scholar]
- Spring, K. R. 1998. Routes and mechanism of fluid transport by epithelia. Annu. Rev. Physiol. 60:105–119. [DOI] [PubMed] [Google Scholar]
- Stevenson, B. R., J. M. Anderson, D. A. Goodenough, and M. S. Mooseker. 1988. Tight junction structure and ZO-1 content are identical in two strains of Madin-Darby canine kidney cells which differ in transepithelial resistance. J. Cell Biol. 107:2401–2408. [DOI] [PMC free article] [PubMed] [Google Scholar]
- Tice, L. W., R. L. Carter, and M. C. Cahill. 1977. Tracer and freeze fracture observations on developing tight junctions in fetal rat thyroid. Tissue Cell. 9:395–417. [DOI] [PubMed] [Google Scholar]
- Tombaugh, G. C., and G. G. Somjen. 1996. Effects of extracellular pH on voltage-gated Na+, K+, and Ca2+ currents in isolated rat CA1 neurons. J. Physiol. (Lond.). 493:719–732. [DOI] [PMC free article] [PubMed] [Google Scholar]
- Tsukita, S., and M. Furuse. 2000. Pores in the wall: claudins constitute tight junction strands containing aqueous pores. J. Cell Biol. 149:13–16. [DOI] [PMC free article] [PubMed] [Google Scholar]
- Van Itallie, C., C. Rahner, and J. M. Anderson. 2001. Regulated expression of claudin-4 decreased paracellular conductacne through a selective decrease sodium permeability. J. Clin. Invest. 107:1319–1327. [DOI] [PMC free article] [PubMed] [Google Scholar]
- von Bulow, F., K. Mollgard, and B. van Deurs. 1984. Tight junction structure in relation to transepithelial resistance in the frog choroid plexus. Eur. J. Cell Biol. 33:90–94. [PubMed] [Google Scholar]
- Walker, D. C., A. L. MacKenzie, B. R. Wiggs, J. G. Montaner, and J. C. Hogg. 1988. Assessment of Tight Junctions between Pulmonary Epithelial and Endothelial Cells. J. Appl. Physiol. 64:2348–2356. [DOI] [PubMed] [Google Scholar]
- Wilcox, E. R., Q. L. Burton, S. Naz, S. Riazuddin, T. N. Smith, B. Ploplis, I. Belyantseva, T. Ben-Yosef, N. A. Liburd, R. J. Morell, B. Kachar, D. K. Wu, A. J. Griffith, S. Riazuddin, and T. B. Friedman. 2001. Mutations in the gene encoding tight junction claudin-14 cause autosomal recessive deafness DFNB29. Cell. 104:165–172. [DOI] [PubMed] [Google Scholar]
- Wilson, F. H., S. Disse-Nicodeme, K. A. Choate, K. Ishikawa, C. Nelson-Williams, I. Desitter, M. Gunel, D. V. Milford, G. W. Lipkin, J.-M. Achard, M. P. Feely, B. Dussol, Y. Berland, R. J. Unwin, H. Mayan, D. B. Simon, Z. Farfel, X. Jeunemaitre, and R. P. Lifton. 2001. Human hypertension caused by mutations in Wnk kinases. Science. 293:1107–1112. [DOI] [PubMed] [Google Scholar]
- Wittchen, E. S., J. Haskins, and B. R. Stevenson. 2000. Exogenous expression of the amino-terminal half of the tight junction protein ZO-3 perturbs junctional complex assembly. J. Cell Biol. 151:825–836. [DOI] [PMC free article] [PubMed] [Google Scholar]
- Wong, V., and D. A. Goodenough. 1999. Paracellular channels. Science. 285:62. [DOI] [PubMed] [Google Scholar]
- Worley, J. F., R. J. French, B. A. Pailthorpe, and B. K. Krueger. 1992. Lipid surface charge does not influence conductance or calcium block of single sodium channels in planar bilayers. Biophys. J. 61:1353–1363. [DOI] [PMC free article] [PubMed] [Google Scholar]
- Zhou, W., and S. W. Jones. 1996. The effects of external pH on calcium channel currents in bullfrog sympathetic neurons. Biophys. J. 70:1326–1334. [DOI] [PMC free article] [PubMed] [Google Scholar]
- Zufall, F., and S. Firestein. 1993. Divalent cations block of the cyclic nucleotide-gated channel of olfactory receptor neurons. J. Neurophysiol. 69:1758–1768. [DOI] [PubMed] [Google Scholar]


