

Abstract
Activation of skeletal muscle ryanodine receptors (RyRs) by suramin and disulfonic stilbene derivatives (Diisothiocyanostilbene-2′,2′-disulfonic acid (DIDS), 4,4′-dibenzamidostilbene-2,2′-disulfonic acid (DBDS),and 4,4′-dinitrostilbene-2,2′-disulfonic acid (DNDS)) was investigated using planar bilayers. One reversible and two nonreversible mechanisms were identified. Ka for reversible activation (∼100 μM) depended on cytoplasmic [Ca2+] and the bilayer composition. Replacement of neutral lipids by negative phosphatidylserine increased Ka fourfold, suggesting that reversible binding sites are near the bilayer surface. Suramin and the stilbene derivatives adsorbed to neutral bilayers with maximal mole fractions between 1–8% and with affinities ∼100 μM but did not adsorb to negative lipids. DIDS activated RyRs by two nonreversible mechanisms, distinguishable by their disparate DIDS binding rates (105 and 60 M−1 s−1) and actions. Both mechanisms activated RyRs via several jumps in open probability, indicating several DIDS binding events. The fast and slow mechanisms are independent of each other, the reversible mechanism and ATP binding. The fast mechanism confers DIDS sensitivity ∼1000-fold greater than previously reported, increases Ca2+ activation and increases Ki for Ca2+/Mg2+ inhibition 10-fold. The slow mechanism activates RyRs in the absence of Ca2+ and ATP, increases ATP activation without altering Ka, and slightly increases activity at pH < 6.5. These findings explain how different types of DIDS activation are observed under different conditions.
INTRODUCTION
Muscle function, is regulated by the release of calcium from the internal stores. In striated muscle this occurs via calcium release channels (ryanodine receptors (RyRs)) in the sarcoplasmic reticulum (SR). Modulation of RyR function by constituents of the cytoplasm and SR lumen, such as ATP, Ca2+, Mg2+, and pH, is central to their role in muscle contraction (Coronado et al., 1994; Meissner, 1994). There are several isoforms of the RyR. In mammals, three isoforms of RyRs have been cloned and sequenced: RyR-1 (skeletal muscle), RyR-2 (cardiac muscle) and RyR-3 (numerous cell types). In amphibian, fish, and avian muscle, two isoforms have been sequenced (RyR-α and RyR-β), which are similar to RyR-1 and RyR-3, respectively (Sutko and Airey, 1996). One isoform has been identified in Caenorhabditis elegans (Hamada et al., 2002).
Disulfonic stilbene derivatives have been extensively used as pharmacological probes to study the transport kinetics and molecular structure of a wide range of membrane transporters. Excellent examples of this include the elucidation of the double-barreled structure of ClC0 (Miller and White, 1984), the transport kinetics and structure of the band-3 anion transporter (Knauf, 1979) and structure of the ATP binding site of the SR CaATPase (Hua and Inesi, 1997). In muscle, diisothiocyanostilbene-2′,2′-disulfonic acid (DIDS) has been widely used to understand the role, and mechanism, of various ion transport processes in the sarcolemma and the membranes of internal organelles such as the SR.
Disulfonic stilbene derivatives are known to activate and inhibit ion channels and transporters by both reversible and nonreversible mechanisms. Nonreversible effects are due to the isothiocyanate groups which form covalent bonds with a variety of amino acid residues by reacting with NH2 groups on lysine residues, OH groups on serine residues, and aromatic groups on tyrosine and cysteine residues. DIDS has two isothiocyanate groups and 4′-acetamido-4′-isothiocyanostilbene-2′,2′-disulfonic acid (SITS) only has one of these groups (Fig. 1). 4,4′-Dibenzamidostilbene-2,2′-disulfonic acid (DBDS), and 4,4′-dinitrostilbene-2,2′-disulfonic acid (DNDS) both lack isothiocyanate groups and so cannot form covalent bonds with amino acids. Given the promiscuous nature of disulfonic stilbene derivatives, it is not surprising that they also affect the calcium release channels in muscle (Hill and Sitsapesan, 2002; Kawasaki and Kasai, 1989; Oba et al., 1996; Sitsapesan, 1999; Zahradnikova and Zahradnik, 1993).
FIGURE 1.

Structural formulae of the commonly used disulfonic stilbene derivatives.
Kawasaki and Kasai (1989) were the first to report that DIDS and SITS activate RyR-1 from rabbit skeletal muscle in both SR vesicles and lipid bilayers. They found that these compounds locked RyRs in to an open state with a Ba2+ conductance not significantly different to native RyRs. They could discern reversible and nonreversible effects of DIDS in Ca2+ release measurements by the fact that reversible activation occurred more rapidly than nonreversible activation. Zahradnikova and Zahradnik (1993) were the first to report that DIDS had a similar activating effect on RyR-2 from dog heart while using Cs+ as the conducting ion. Investigations of the effect of DIDS on RyR-α from frog muscle revealed that DIDS modified RyRs could still be regulated by Mg2+, ruthenium red, and ryanodine (Oba et al. 1996). However, it was not until recently that the first investigation of reversible and nonreversible effects of DIDS on RyR-2 was published (Sitsapesan, 1999). DIDS also causes a 20% increase in the Ca2+ conductance of the RyRs although only producing 8% increase in K+ conductance (Hill and Sitsapesan, 2002) and no significant change in Cs+ conductance (Oba et al., 1996; Zahradnikova and Zahradnik, 1993).
Suramin (1,3,5-naphthylenetrisulfonic acid) is a trypanocide which acts as an ATP antagonist for P2-purinoceptors (Dunn and Blakeley, 1988; Kennedy, 1990). Although suramin is a strong activator of RyRs, it regulates RyRs via a site that is distinct from its adenine nucleotide binding sites (Hohenegger et al., 1996; Sitsapesan and Williams, 1996). Similarities in the structures of suramin and DIDS and their effects on RyR function suggest that these compounds may share a common mode of action on RyRs (Sitsapesan, 1999).
The manifold effects of disulfonic stilbene derivatives and suramin on RyRs make these compounds potentially useful probes for elucidating the mechanisms of RyR function. Two studies have already used these compounds to probe the inactivation properties of RyRs (Hill and Sitsapesan, 2002) and interactions between RyRs and their coproteins, calmodulin (Klinger et al., 2001) and the 30-kDa protein (Hirata et al., 1999). Moreover, efforts have been made to identify high affinity suramin analogs that may ultimately lead to therapies based on modifying RyR function in vivo (Klinger et al., 1999). Despite the burgeoning interest in DIDS and suramin analogs, the mechanisms underlying their reversible and nonreversible activation of RyRs are largely unknown. Furthermore, it is not known how disulfonic stilbene derivatives modify the way RyRs are regulated by physiologically important ligands. This paper describes a detailed investigation of the mechanisms of RyR activation by suramin and the disulfonic stilbene derivatives, DIDS, DBDS, and DNDS, and how these compounds modify RyR regulation by ATP, Ca2+, Mg2+, and pH. The effects of these compounds were measured from recordings of RyR activity in lipid bilayers. Experiments were greatly improved by the use of a relatively fast, local perfusion technique to apply and withdraw modifying agents. This permitted higher time resolution of the RyR activation time course than previously achieved using the aliquot addition methods. This approach revealed two independent mechanisms for nonreversible activation by DIDS which affect RyR function in different ways.
MATERIALS AND METHODS
Preparation of SR microsomes
SR vesicles were prepared from the back and leg muscles of New Zealand rabbits killed by captive bolt before muscle removal. The procedure was carried out by the holder of a current license granted under ACT State legislation. Native SR vesicles were isolated using techniques based on Chu et al. (1988), as previously described by Laver et al. (1995).
Lipid bilayers, chemicals, and solutions
Unless otherwise stated, lipid bilayers were formed from phosphatidylethanolamine (PE) and phosphatidylcholine (PC) (8:2) (Avanti Polar Lipids, Alabaster, Alabama) dissolved in 20 μl n-decane (50 mg/ml). In some experiments bilayers were formed from phosphatidylserine (PS), which possesses a negative charge on its polar headgroup. The bilayers were formed across an aperture of 100–200 μm diameter in a Delrin cup. The bilayer separated two solutions: cis and trans (∼1 ml). Vesicles were added to the cis solution and vesicle incorporation with the bilayer occurred as described by Miller and Racker (1976). Due to the orientation of RyRs in the SR vesicles, RyRs added to the cis chamber incorporated into the bilayer with the cytoplasmic face of the channel orientated to the cis solution. In a minority of experiments SR vesicles were subject to several freeze-thaw cycles before use to produce larger vesicle sizes. Vesicles were snap frozen in liquid N2 and thawed at room temperature. RyRs treated this way were the same as native RyRs in regard to their regulation by Ca2+, Mg2+, ATP, and pH.
During SR vesicle incorporation the cis (cytoplasmic) solution contained 250 mM Cs+ (230 mM CsCH3O3S, 20 mM CsCl) with 1.0 or 0.1 mM CaCl2, and the trans (luminal) solution contained 50 mM Cs+ (30 mM CsCH3O3S, 20 mM CsCl), and 0–1.0 mM CaCl2. The osmotic gradient across the membrane and the Ca2+ in the cis solution also aided vesicle fusion with the bilayer. The cesium salts were obtained from Aldrich Chemical Company and CaCl2 from BDH Chemicals. Unless otherwise stated, solutions were pH buffered with 10mM N-tris[Hydroxymethyl]methyl-2-aminoethanesulfonic acid (TES, obtained from ICN Biomedicals) and solutions were titrated to pH 7.4 using CsOH (optical grade from ICN Biomedicals).
The required free [Ca2+] was attained by buffering with 4.5 mM BAPTA (1,2-bis(o-aminophenoxy)ethane-N,N,N′,N′-tetraacetic acid, obtained as a tetrapotassium salt from Molecular Probes) and titrated with CaCl2. Free [Ca2+] in excess of 0.1 μM was measured using a Ca2+ electrode (Fluka). At lower concentrations, free [Ca2+] was estimated using published association constants (Marks and Maxfield, 1991) and the program “Bound and Determined” (Brooks and Storey, 1992). Solutions, which mimicked zero Ca2+, were made with 4.5 mM BAPTA and no added Ca2+. In these solutions the total [Ca2+] arising from impurities was measured to be 15 μM so that with addition of 4.5 mM BAPTA the free [Ca2+] was calculated to be 1 nM. Adenosine 5′-triphosphate (ATP) and adenosine were obtained in the form of sodium salts from Sigma Chemicals. Unless otherwise stated, DIDS, DBDS, DNDS, and suramin (sodium salts) were prepared as stock solutions in DMSO (dimethyl sulfoxide) at concentrations between 5–50 mM. DIDS, suramin, and DMSO were obtained from ICN Biomedicals and DBDS and DNDS from Molecular Probes. Care was taken to insure that DMSO in the bath solutions did not exceed 1% because DMSO concentrations above 2% inhibited RyR activity (see Results).
Solution changes
During experiments the composition of the cis solution was altered either by addition of aliquots of stock solutions or by perfusion of the bath near the bilayer. The local perfusion method allowed solution exchange, in ∼1 s, between twelve available solutions in random sequence. A 10-fold speed improvement on our previously described apparatus (Laver et al., 2000) was achieved using a finer micro manifold (a generous gift from ALA Scientific Instruments, 1100 Shames Drive, Westbury, NY 11590). Desired flow rates were achieved using a pressure driven syringe injection system (produced in-house). The perfusion system allowed convenient addition and removal of drugs, improved the time resolution in the channel activation experiments and permitted accurate measurement of solution composition.
Data acquisition and analysis
Bilayer potential was controlled and currents recorded using an Axopatch 200B amplifier (Axon Instruments). The cis chamber was electrically grounded to prevent electrical interference from the perfusion tubes, and the potential of the trans chamber was varied. However, all electrical potentials are expressed here using standard physiological convention (i.e., cytoplasmic side relative to the luminal side at virtual ground). Single channel recordings were obtained using a bilayer potential difference of +40 mV.
During the experiments the channel current was recorded after low pass filtering at 5 kHz and sampling at 50 kHz. The data were stored on computer disk using a data interface (Data Translation DT301) under the control of in-house software written in Visual Basic. For measurements of unitary current and Po, the current signal was digitally filtered at 1 kHz with a Gaussian filter and sampled at 5 kHz. Unitary current and time-averaged currents were measured using Channel2 software (P.W. Gage and M. Smith, Australian National University, Canberra). To calculate Po from single channel records, a threshold discriminator was set at 50% of channel amplitude to detect channel opening and closing events. For experiments in which bilayers contained several RyRs, the time-averaged current was divided by the unitary current and the number of channels. The number of channels in each experiment could be determined during periods of strong activation. In experiments where suramin or stilbene derivatives were poor activators, ATP was used to activate channels for counting. Both methods of calculating Po gave similar results. Frequency histograms of dwell-time durations were compiled from channel records filtered at 5 kHz and sampled at 50 kHz. Event durations were extracted from the data using 50% threshold detection which, in conjunction with the filtering, had a dead time of ∼40 μs. The histograms are presented as probability distributions using variable bin widths with equal separation on a log scale as described by Sigworth and Sine (1987).
Statistics and curve fitting
Unless otherwise stated the data are presented as mean ± standard error on the mean (SEM). Theoretical curves were fitted to the data using the criteria of least squares. The open probability (Po) of RyRs, activated or inhibited by a compound with concentration c was fitted by Hill equations, Eqs. 1 and 2, respectively:
 |
(1) |
 |
(2) |
where Pi and Pmax are RyR open probabilities in the absence of drug and at maximal activation, respectively. Ka and Ki are half activation and inhibition concentrations and na and ni are the corresponding Hill coefficients. The magnitude of activation produced by two compounds (noted by subscripts in Eq. 3) that act at a common site is given by:
 |
(3) |
Analysis of adsorption of suramin, DIDS analogs to lipid bilayers
The method for measuring changes in bilayer surface potential and the binding constants for DIDS and its analogs is similar to that used to previously to measure the binding of cations to lipid bilayers (Laver and Curtis, 1996). The change in surface potential ΔV that drives the capacitive current I can be calculated from the bilayer capacitance, C, by Eq. 4.
 |
(4) |
where t is the duration of the current transient. Ca2+ and Cs+ can bind competitively with PS headgroups in the bilayer and Ca2+ and DIDS bind competitively with the neutral lipids. Although Ca2+ binds to lipids with 1:1 stoichiometry (McLaughlin et al., 1978; McLaughlin et al., 1981), DIDS only binds to a fraction F of the neutral lipid headgroups. The Stern equation (Eq. 5) relates the surface charge density σ to the bilayer and bath composition.
 |
(5) |
where
 |
(6) |
 |
(7) |
 |
(8) |
Eqs. 6–8 relate the bulk ionic concentrations, Ca2+(∞), Cs+(∞), and DIDS2−(∞) with their concentrations at the bilayer surface, Ca2+(0), Cs+(0), and DIDS2−(0). P− and P are the concentrations of negatively charged lipids (PS) and zwitterionic lipids (PC and PE), respectively. K1 to K4 are the association constants for the following molecular pairs: K1 (Cs+ and PS), K2 (Ca2+ and PS), K3 (Ca2+ and PE or PC), and K4 (DIDS and PE or PC). The first term in Eq. 5 predicts the surface charge arising from the binding of Ca2+ to PS in competition with Cs+. The second term predicts the charge from competitive binding of DIDS and Ca2+ to the fraction F of PE or PC headgroups. The last term shows the charge contribution from Ca2+ binding to the fraction of neutral lipids that do not bind DIDS.
Mobile ions in the bath screen the bilayer surface charge and affect the surface potential ψo. The Grahame equation (Eq. 9, Grahame, 1947) relates the surface charge density to the surface potential.
 |
(9) |
RESULTS
Adsorption of DIDS analogs and suramin to lipid bilayers
The molecular structures of these compounds are shown in Fig. 1. Rapid application and removal of DIDS, DBDS, DNDS, and suramin to lipid bilayers elicited transient currents through the bilayer as shown in Fig. 2 A. The transients were generally flatter and broader during washout than during application. The magnitude of the transient current increased with increasing [DIDS] in the perfusing solution and also depended on the lipid composition of the bilayer (Fig. 2 B). DIDS application to bilayers composed of zwitterionic lipids (i.e., net neutral) such as PE and PC produced transients as shown in Fig. 2 B (traces 2–5). However, when bilayers were formed from negatively charged lipids, the current transients were either very small or absent (trace 1). These transients are similar to those seen in previous bilayer experiments where the phenomenon was shown to be due to a change in the bilayer surface potential (Laver and Curtis, 1996). The magnitude of the surface potential depended on the bilayer surface charge (i.e., the charge arising from the lipid headgroups and ions adsorbed from the bath) and the screening of this charge by mobile ions in the bath. Changes in bilayer surface potential were accurately predicted by the Gouy-Chapman-Stern theory and the known affinities for cation binding to lipid headgroups. Thus, it is likely that the current transients observed here are due to the adsorption of the DIDS molecules to the bilayer surface. The broader transient associated with DIDS removal could reflect a relatively slow desorption of DIDS from the bilayer. However, we can not rule out the possibility that these differences stem from different rates of application and washout.
FIGURE 2.

Changes in bilayer surface potential upon rapid application and removal of DIDS analogs and suramin. (A) Current transients produced by rapid DIDS application (downward) followed by removal (upward). When DIDS solutions came in contact with the bilayer the current departed from its steady baseline (dashed line) and returned to baseline levels after complete solution exchange had occurred. The two downward spikes preceding each transient marks the time that the solenoid valves switched solution flow. (B) The size of the transient current depended on the DIDS concentration and the lipid composition of the bilayer. Trace 1 shows the relatively weak transient in response to 500 μM DIDS applied to PS bilayers. Traces 2–5 show current transients through PE bilayers in response to DIDS concentrations of 50 μM, 100 μM, 200 μM, and 500 μM, respectively. (C) The change in bilayer surface potential caused by DIDS absorption to the bilayer. The surface potential changes on bilayers formed from neutral lipids (PE) are much larger than those seen with negatively charged PS bilayers. This indicates that DIDS preferentially adsorbs to the neutral lipids. (D) The surface potentials generated by adsorption of DIDS, DBDS, DNDS and suramin to bilayers composed of PE and PC (80:20). There was no significant difference in the adsorption of DIDS to the bilayer at 1 nM and 1 mM cytoplasmic Ca2+. The curves show fits of the Stern and Grahame equations to the data (Eqs. 5–9). The parameters used to fit the data are given in Table 1.
Changes in the bilayer surface potential ΔV caused by the application and removal of DIDS and suramin were measured from the capacitive current and compared with the predictions of Gouy-Chapman-Stern theory in Fig. 2, C and D (Eqs. 4–9, see Materials and Methods). Generally, ΔV calculated from DIDS washout was 80% ± 10% (six sets of experiments) of that during application and the averages of the values are shown in Fig. 2. The theory was fitted using only two variable parameters; namely, the mole fraction of the neutral lipids that can bind suramin and DIDS analogs (F) and their binding affinities (K4, see Table 1). The binding affinities for Ca2+ and Cs+ (K1, K2, and K3) have been determined independently from electrophoresis studies (McLaughlin et al., 1981) and these are given in the caption to Table 1. This analysis shows that DIDS and its analogs bind, on average, to 1–8% of the neutral lipids with binding affinities of the order of 100 μM (see Table 1). DIDS did not bind as strongly to bilayers containing 50% negatively charged PS and showed no detectable binding to bilayers composed of entirely of PS. Incorporation of 50% PS into lipid bilayers did not significantly alter the fraction of neutral lipids that were available for DIDS binding.
TABLE 1.
Binding constants for stilbenes to lipid bilayers
| Row | F (PE) | K4, m3/mole | Affinity, μM | |
|---|---|---|---|---|
| 1 | DIDS | 0.07 ± 0.01 | 3 ± 1 | 330 ± 110 |
| F (PE:PC) (80:20) | ||||
| 2 | DIDS | 0.077 ± 0.010 | 5 ± 2 | 200 ± 80 |
| 3 | DBDS | 0.03 ± 0.02 | 5 ± 2 | 200 ± 80 |
| 4 | DNDS | 0.020 ± 0.003 | 1.5 ± 0.3 | 660 ± 130 |
| 5 | suramin | 0.013 ± 0.003 | 10 ± 5 | 100 ± 50 |
| F (PS:PE) (50:50) | ||||
| 6 | DIDS | 0.08 ± 0.02 | 3 ± 1 | 330 ± 110 |
The variable parameters in Eqs. 5–9 used to fit the data in Fig. 2 C (rows 1 & 6) and D (rows 2–5). The other parameters used in the fits were determined by (McLaughlin et al., 1981). These are: (m3/mole) K1 = 5 × 10⁻⁵, K2 = 1.2 × 10⁻², K3 = 3 × 10⁻³. Lipid concentrations P− and P (mole/m2) are calculated from the lipid weight fraction multiplied by 2.38 × 10⁻⁶.
Effects of suramin, DIDS, DBDS, DNDS, and DMSO on RyRs
Once vesicles were added to the cis bath, the fusion of RyRs with the bilayer ensued in 5–10 min. The number of RyRs incorporated with the bilayer with any particular vesicle fusion event varied enormously from one fusion to the next and appeared to follow a bimodal distribution. Most fusion events incorporated either a few (1 or 2) or many RyRs (10–30). This bimodal nature of RyR incorporation proved very useful because single channel properties could be readily measured during experiments involving single RyR incorporations whereas multiple channel incorporations allowed a convenient and rapid bulk assay for RyR activity. As seen in previous studies on cardiac RyRs (Sitsapesan, 1999), DIDS added to the cytoplasmic side of the bilayer activates RyRs by both reversible and nonreversible mechanisms which are both apparent in Fig. 3 A. Also consistent with previous studies we found that suramin and DIDS analogs (DNDS and DBDS) that lacked the isothiocyanate moieties could reversibly activate RyRs but showed no significant nonreversible effects on RyR activity (e.g., Fig. 3 D). These compounds had no significant effect on the Cs+ conductance of RyRs. The conductance of RyRs in the presence of 500 μM DIDS ([Ca2+] = 1/0 mM cis/trans) was equal to 0.99 ± 0.01 (n = 5) of control in neutral bilayers and 0.97 ± 0.05 (n = 4) in PS bilayers.
FIGURE 3.

The reversible and nonreversible effects of DIDS and suramin on RyRs in neutral (PE and PC) and charged (PS) bilayers. (A) Nine RyRs in a neutral bilayer in the presence of ∼1 nM cytoplasmic Ca2+ (4.5 mM BAPTA plus 15 μM Ca2+ impurity). Cis addition of 500 μM DIDS (bars) strongly activated all the channels to Po ∼ 1. Washout of DIDS after a 10 s exposure reversed most of the DIDS induced activation. However, subsequent longer exposures (20 s, 30 s, and 60 s) resulted in substantial nonreversible activation of RyRs (n = 8). (B) Similar experiment as A except the cytoplasmic bath contained 1 mM Ca2+. In this experiment 7 RyRs showed strong activation by 500 μM DIDS. However, in the presence of 1 mM Ca2+, a 5 s exposure to DIDS resulted in activation that was mainly nonreversible (n = 10). (C) Approximately 20 RyRs in a PS bilayer in the presence of 1 mM cytoplasmic Ca2+. Again, 500 μM DIDS activated RyRs but the activation was not as complete as seen in parts A and B. Like part B, the nonreversible effect of DIDS was relatively large compared to that seen during similar DIDS exposures in A (n = 5). (D) Approximately 20 RyRs in the presence of 1 mM Ca2+ exposed to 1 mM suramin for the duration of the bar. The effect of suramin was totally reversible. (A–D) Bilayers were held at +40 mV. The current baselines are shown by the dashed lines and approximate scales for mean open probability (Po) of the RyRs at the right of each panel. Drug addition and washout was done using local perfusion, which in these experiments exchanged solutions at the bilayer surface in less than 2 s.
The relatively fast solution exchange method employed in these experiments revealed novel features in the reversible and nonreversible DIDS activation mechanisms. In bilayers formed from neutral lipids, skeletal RyRs were strongly and rapidly activated in the presence of 500 μM DIDS. The recordings in Fig. 3, A and B and other single channel recordings (n = 8, not shown) indicate that RyRs are activated to Po ∼ 1 in the presence of DIDS. In the near absence of free Ca2+ (∼1 nM) short exposures to DIDS produced activation that was mainly reversible. However, a clear nonreversible effect of DIDS slowly accumulated in the RyR population during long exposures (Fig. 3 A). In the presence of 1 mM Ca2+ (Fig. 3 B) the immediate activation of RyRs by 500 μM DIDS was similar to that seen in the absence of Ca2+. However, even after very short DIDS exposures the nonreversible effect of DIDS was relatively large indicating that nonreversible activation occurs much more rapidly in the presence of Ca2+ than in its absence.
Given that negative charge on the PS headgroups abolished adsorption of DIDS to the bilayer surface it was of interest to see if RyRs residing in bilayers composed of PS responded differently to DIDS. Fig. 3 C shows an example of 5 experiments showing the effect of DIDS on many RyRs in a PS bilayer in 1 mM Ca2+. Comparison of Fig. 3, B and C shows that DIDS produced less activation in PS bilayers than in neutral bilayers. This difference is shown again in single channel records in Fig. 4, A and B The reduced activation in the presence of PS is due to its effect on reversible activation because it also reduced RyR activation by suramin (Fig. 4, C and D, and see below).
FIGURE 4.

Representative recordings of the effect of bilayer lipid charge on the activation of single RyRs by DIDS and suramin. (A and B) RyR activity in bilayers composed of negative PS (n = 5) and neutral PE:PC (80%:20%, n = 8) before and during exposure to 500 μM DIDS (bar). (C and D) Similar bilayers with RyRs continuously exposed to 200 μM suramin (n = 10 for PS, n = 10 for PE:PC). Channel openings are upward current transitions from the baseline (dashed lines). RyR activation was more pronounced in bilayers composed of neutral lipids. Note the current transient associated with DIDS adsorption to neutral lipids in B which is absent from bilayers composed of PS lipids in A. Bilayers were held at +40 mV and cis [Ca2+] = 1 mM.
DMSO had a pronounced inhibitory effect on RyRs at concentrations in excess of 2% (4 experiments on 12 channels). The Po of RyRs, relative to control, in the presence of 1mM Ca2+ and either suramin or ATP was 1.1 ± 0.13 in 2% DMSO, 0.71 ± 0.05 in 3% DMSO and 0.56 ± 0.09 in 4% DMSO.
Reversible activation in bilayers of neutral and negative lipids
The reversible effects of stilbene derivatives were most easily studied using suramin, DBDS, and DNDS, which did not produce additional nonreversible activation of RyRs. The concentration dependencies of RyR activation by these compounds in the presence of 1 mM cytoplasmic Ca2+ are shown in Fig. 5 A, B, and D, and the Hill fit parameters are summarized in Table 2. Suramin and DBDS activated RyRs to a Po in excess of 0.8 whereas DNDS could only produce a Po of 0.31. The concentration dependence of the reversible effect of DIDS (Fig. 5 C) was more difficult to measure due to the onset of nonreversible activation. This problem was alleviated to a large extent by doing experiments in low [Ca2+] with bilayers containing large numbers of RyRs so that reliable estimates of mean channel activity could be made over short time intervals. Nonreversible activation by DIDS is relatively slow in the absence of Ca2+ (e.g., see Figs. 3 A and 6 A), which kept the level of nonreversible activation to less than 10% (i.e., Po ∼ 0.1) during these experiments. The apparent affinities of these compounds for RyRs follow the sequence: suramin (47 μM) > DBDS (151 μM) > DNDS (714 μM). The Hill coefficients of activation exceeded 1 (na ∼ 2) which indicates that the binding of two or more molecules is involved in RyR activation. The concentration dependencies of suramin activation in bilayers composed of negatively charged lipids are compared with neutral lipids in Fig. 5, A and D. Bilayers composed of PS (Fig. 5 D) significantly reduced the effects of suramin and DBDS. In the case of suramin, this occurred mainly by via a 350% reduction in apparent affinity (160 μM compared with 47 μM in neutral lipids; see Table 2). Thus membrane composition is an important consideration when comparing data obtained from bilayers studies with data obtained from native SR which is low in PS (3–4% PS; Krainev et al., 1995).
FIGURE 5.

The reversible effects of DIDS, DBDS, DNDS, and suramin, on the open probability of RyRs. (A) Activation of RyRs by DBDS (4, 23) or suramin (10,175) in neutral bilayers, in the presence of 1 mM cytoplasmic Ca2+. (B) DNDS activation of RyRs (4, 30) in neutral bilayers in the presence of 1 mM cytoplasmic Ca2+. (C) Activation of RyRs by DBDS (3, 18) and DIDS (4, 62) in neutral bilayers in the absence of Ca2+. For the DIDS experiments short exposure times (∼5 s) were used so that the activation was largely due to the reversible effects of DIDS (nonreversible activation by DIDS is relatively slow in the absence of Ca2+, e.g., see Figs. 3 A and 6 A). The relative size of the nonreversible effects can be seen here in Po values at zero [DIDS]. (D) Activation of RyRs by suramin (10, 124) and DBDS (4, 16) in bilayers composed of PS in the presence of 1 mM Ca2+. In bilayers composed of negatively charged PS, suramin and DBDS are much weaker activators of the RyR. The curves show fits of Po to the Hill equation (Eq. 1). The parameters of the fits are given in Table 2. The data points show the means of several experiments, which were mostly carried out on multiple RyRs. Numbers in parentheses represent the numbers of channels and experiments, respectively.
TABLE 2.
Hill-fit parameters for stilbene activation
| Pmax | Pi | Ka, μM | na | |
|---|---|---|---|---|
| Suramin | 0.83 ± 0.07 | 0.03 ± 0.05 | 47 ± 8 | 1.7 ± 0.5 |
| Suramin (PS) | 0.50 ± 0.05 | 0.14 ± .05 | 160 ± 30 | 3.0 ± 1.0 |
| DNDS | 0.31 ± 0.03 | 0.08 ± 0.02 | 714 ± 110 | 2.2 ± 0.6 |
| DBDS | 0.89 ± 0.07 | 0.05 ± 0.03 | 151 ± 16 | 1.6 ± 0.5 |
| DBDS (1 nM Ca2+) | 0.55 ± 0.13 | 0 ± 0.001 | 320 ± 80 | 2.2 ± 0.6 |
| DIDS (1 nM Ca2+) | 0.77 ± 0.10 | 0.08 ± 0.05 | 170 ± 35 | 4.0 ± 2.0 |
The parameter values used to fit the data in Fig. 5A, C, and D (see Eqs. 1 and 2). Unless otherwise stated the effects of these compounds were measured in neutral bilayers in the presence of 1 mM cytoplasmic Ca2+.
FIGURE 6.

The time course of DIDS induced nonreversible activation of RyRs. (A) RyRs were repeatedly exposed to 500 μM DIDS for periods lasting 5–60 s. The progressive, nonreversible activation was measured using the experimental protocol shown in Fig. 3 A. The mean Po is plotted against total DIDS exposure time. The curves show exponential fits to each time course. In the absence of cytoplasmic Ca2+, DIDS activated RyRs with a time constants of 48 ± 13 s (6, 50) (no ATP) and 93 ± 36 s (10 mM ATP) (7, 15) and in the presence of 10 mM Ca2+, 12 ± 6 s (8, 126). (B) The activation of ∼15 RyRs in response to 1 μM DIDS (applied at the arrow) in the presence of 100 μM Ca2+. Activation showed a marked latency that was much longer than any delay expected from solution exchange (∼1 s). (C) 12 RyRs in the presence of 3 μM Ca2+ were exposed to 10 μM DIDS (arrow) which activated the RyRs to a steady level for the following 90 s. Subsequently increasing [DIDS] to 500 μM caused an immediate increased in RyR activity which was not completely reversed by returning to 10 μM DIDS. (D) 15 RyRs, initially in 100 μM Ca2+, were perfused with solution with 1 nM Ca2+ (solid bar). During this time the RyRs were exposed to 1 μM DIDS (open bar) which does not significantly activate RyRs under these conditions (see A). However, returning [Ca2+] to 100 μM reveals that DIDS has altered RyR activity. The current spikes that occurred during the [Ca2+] steps are due to Ca2+ activation of RyRs as the [Ca2+] passed through the range 1–100 μM. Approximate scales for mean open probability (Po) of the RyRs are shown at the right of panels B–D. Numbers in parentheses represent the numbers of channels and experiments, respectively.
Reversible activation at high and low [Ca2+]
Previous studies have shown that the apparent affinity of suramin for RyRs is enhanced by the presence of cytoplasmic Ca2+ (Hohenegger et al., 1996; Klinger et al., 1999; Suko et al., 2001). Inasmuch as suramin and DIDS analogs might share common reversible binding sites (Sitsapesan, 1999), we tested the possibility that reversible binding of DIDS and DBDS were also Ca2+ dependent. The data in Fig. 5, A and C show that this is indeed the case. The concentration dependence of DBDS activation in the presence and absence of Ca2+ are distinctly different. In the absence of Ca2+, RyRs are less activated by DBDS and do so with a weaker apparent affinity (320 μM compared with 151 μM in 1 mM Ca2+, see Table 2).
Competition experiments with reversible activation
The question of whether suramin activates RyRs by binding to the adenine nucleotide site on RyRs has been addressed previously by measuring the additive effects of ATP and suramin on RyR activation (Hohenegger et al., 1996; Sitsapesan and Williams, 1996). Here we apply another test for this hypothesis where we examine effect of adenosine on suramin activated RyRs. Adenosine is a weak RyR agonist that inhibits ATP activated RyRs by competing with ATP for the activating sites on the RyR. If suramin and ATP activate RyRs by the same mechanism, then adenosine should also act as an inhibitor of suramin activated RyRs. We found that the opposite was the case. Before adenosine addition, RyRs in the presence of 0.1 μM Ca2+ (Po = 0) were activated by the addition of 100 μM suramin to a mean Po = 0.07 (average of 8 channels in 2 experiments). Addition of 5 mM adenosine further activated RyRs to a Po of 0.26. Therefore, in accord with conclusions of previous studies, suramin activates RyR at a set of sites that are distinct from the ATP activation sites.
We were unable to resolve competitive inhibition by DNDS of suramin activated RyRs. In 3 experiments on 16 channels, 2 mM DNDS reduced the Po of suramin activated RyRs to 0.97 ± 0.08 (i.e., no significant effect). However, given the values of Ka and Pmax for channel activation (Table 2), the inhibiting effect of DNDS is not likely to be larger than 15% (see Eq. 3).
Nonreversible activation in the presence and absence of Ca2+
DIDS produced nonreversible activation of RyRs in both the absence and presence of cytoplasmic Ca2+. However, the rate constants for activation varied enormously with [Ca2+]; being 3 orders of magnitude larger in the presence of activating [Ca2+] (>1 μM) than in its absence (∼1 nM). The DIDS activation rates at low and high Ca2+ were so disparate that it was necessary to measure them using different [DIDS]; 500 μM in the absence of Ca2+ and 1 μM in the presence of Ca2+. Fig. 6 A shows the activation of RyRs at two extremes of [Ca2+] in the presence of 500 μM DIDS. To distinguish nonreversible activation from the reversible effects of DIDS at these high concentrations it was necessary to wash away the DIDS solution before each measurement of RyR activity. The experimental protocol used for this is the same as that used to produce the multi-channel recording in Fig. 3 A. RyR activation obtained in this way followed an exponential dependence on DIDS exposure time with a time constant of 48 ± 13 s that corresponds to an apparent binding rate constant of ∼60 M−1 s−1. The same experiments carried out in the presence of 10 mM Ca2+ produced much faster activation. Although exponential fits to the activation time course had a time constant of 12 ± 6 s, it is likely that this value is strongly affected by the rate of solution exchange. A more accurate measure of the activation rate in high [Ca2+] was achieved by adding much lower DIDS concentrations (1 μM) to the bath (see Fig. 6 B). In the presence of 100 μM Ca2+, 1 μM DIDS produced half activation of RyRs in 23 ± 3 s (4 experiments on 60 RyRs) which gives an apparent binding rate constant of ∼105 M−1 s−1 (cf. 60 M−1 s−1 in the absence of Ca2+). The time course of activation was strongly sigmoidal. In all experiments there was a substantial latency that was far too long to be attributed to the time for solution exchange.
The different DIDS activation rates seen in the presence and absence of Ca2+ could be due to the combined effect of two independent mechanisms (fast and slow) that affect RyR activity over different [Ca2+] ranges or alternatively, due to the Ca2+ dependence of DIDS binding per se. To investigate this further we carried out two sets of experiments. In the first set we measured DIDS induced activation at 3 μM Ca2+ (this is approximately equal to the half-activating concentration for Ca2+, see Fig. 9 A) to see if fast and slow activation mechanisms could be discerned at a given [Ca2+]. Three experiments (two multi- and one single-channel recording) were carried out as shown by the example in Fig. 6 C. After control recordings were obtained at 3 μM Ca2+, RyRs were rapidly activated by 10 μM DIDS and channel activity reached a relatively steady level after ∼2 s. After a minute the RyRs were exposed for ∼30 s to 500 μM DIDS after which [DIDS] was returned to 10 μM. In all cases, transient exposure to 500 μM DIDS irreversibly activated RyRs by another twofold. This indicates that a slow DIDS binding process was operating in addition to a fast DIDS binding mechanism.
FIGURE 9.

Regulation of DIDS modified and native RyRs by cytoplasmic Ca2+, Mg2+, ATP, and pH. Also shown are theoretical fits to the data from DIDS modified RyRs (solid curves) and from native RyRs obtained previously (dashed lines, the original data have been omitted for clarity). (A) Regulation by cytoplasmic Ca2+ (20, 95) of RyRs exposed to 100 μM DIDS for 3–4 min. (B) Mg2+ inhibition in the presence of 1 mM Ca2+ (2, 30) of RyRs exposed to 100 μM DIDS for 1 min. (C) ATP activation in the absence of Ca2+ (5, 83) of exposed to 100 μM DIDS for either 1 or 4 min. One minute incubation with DIDS produced relatively little activation reflecting the low rate of DIDS activation. (D) Inhibition by low pH in the presence of 100 μM Ca2+ (6, 20) of RyRs exposed to 100 μM DIDS for either 1 or 4 min. pH was buffered using 5 mM TES and 5 mM MES (2-[N-Morpholino]ethane-sulfonic acid). RyRs. DIDS had no significant effect on pKi but did produce a significant but small increase in RyR activation at pH below 6.5. The parameters for the fitted curves are listed in Table 3 and the sources for the native RyR data are listed in the Table caption. The arrows indicate specific RyR properties that are modified by fast (F) and slow (S) DIDS mechanisms. Upper case labels indicate major contributions by fast and slow mechanism and lower case symbols indicate minor contributions. Numbers in parentheses represent the numbers of channels and experiments, respectively.
In the second set of experiments we exposed RyRs to DIDS at one Ca2+ concentration and measured the degree of RyR activation at a different Ca2+ concentration. In one set of experiments RyRs were exposed to 1 μM DIDS for ∼20 s in the presence of 1 nM Ca2+. DIDS was then washed away and [Ca2+] was raised to 100 μM. One example, typical of four experiments is shown in Fig. 6 D. RyRs were found to be activated to the same degree as would have been achieved if they had been exposed to DIDS in the presence of Ca2+. In converse experiments, (n = 4, not shown) RyRs were incubated with DIDS in the presence of 100 μM Ca2+ and their activity was measured in the absence of Ca2+. These channels required long exposures to 500 μM DIDS to show any significant activation once DIDS and Ca2+ were removed. Thus the DIDS effects depend on [Ca2+] during the measurement rather than on [Ca2+] during DIDS incubation. This indicates that the fast and slow DIDS binding processes are independent of Ca2+ and that the fast DIDS binding mechanism only affects RyR activity in the presence of Ca2+.
Multi-step, nonreversible activation
Single-channel recordings from ten experiments reveal that fast and slow DIDS activation are multi-step binding processes involving the binding of several DIDS molecules. Individual RyRs would progressively activate during several minutes of sustained exposure to low [DIDS]. Fast activation could be seen to proceed in distinct steps. A representative example of three identical experiments is shown in Fig. 7 A. The trace in this figure commences when 1 μM DIDS was rapidly perfused onto the RyR (first arrow) in the presence of 100 μM Ca2+. The activity of the RyR remained unaffected for ∼40 s after the addition of DIDS and then it appeared to abruptly enter a new, more active mode of activity (second arrow). This occurred again at ∼60 s further into the record (third arrow). In a separate experiment, the stepwise increase in channel activity could be arrested during intermediate phases by removing DIDS from the bath (not shown). Frequency distributions of open and closed dwell times, compiled from several sections within each phase, showed that channel activity was indeed stationary within these sections. This is shown in Fig. 7, B and C for the data in Phase 2 where the length of the error bars shows variations in dwell-time distributions occurring within this section. Thus there are several phases to the DIDS modification of RyRs, which can be identified by different levels of activity. Frequency distributions of RyR gating in Phase 1 are not significantly different from that of native RyRs. Phase 2 is marked by order of magnitude increases and decreases in mean open and closed times, respectively. Similar changes in open and closed times again marked the progression into Phase 3 of RyR activation. The mean duration and Po of the three phases of activation from the three experiments were: Phase 1– 28 ± 9 s, 0.08 ± 0.06; Phase 2– 53 ± 14 s, 0.39 ± 0.03 and Phase 3– Po = 0.87 ± 0.02. Progressive activation due to the slow DIDS mechanism was analyzed in four experiments where RyRs were exposed to 10 μM DIDS in the absence of Ca2+ (∼1 nM). The stepwise increments in RyR activation were present but were not as clearly defined as those seen in Fig. 7 A. The mean duration and Po of the four segments of activation were: Phase 1– 56 ± 11 s, (1.6 ± 0.5) × 10−4, Phase 2– 65 ± 16 s, (7 ± 2) × 10−4, Phase 3– 260 ± 140 s, (4.5 ± 2.7) × 10−3 and Phase 4– Po = (4.0 ± 0.5) × 10−2.
FIGURE 7.

Nonreversible activation of RyRs by DIDS occurs in several phases. (A) A single RyR is activated by 1 μM DIDS. The first arrow indicates the time when DIDS was applied to the RyR by fast perfusion. The second and third arrows mark abrupt increases in Po. These arrows delineate three apparent phases of channel activation labeled 1 to 3. The Po values of the RyRs during Phases 1 to 3 were 0.028, 0.4, and 0.86, respectively. (B) Open and (C) closed dwell-time distributions from the three phases of channel activation in A plus the control conditions before addition of DIDS. To show the stationarity of gating in Phase 2, dwell-time data were compiled from the first and second halves of this section. Vertical bars through the data indicate the difference in the distributions. The recording was filtered at 5 kHz and sampled at 50 kHz. Channel openings are upward transitions form the baseline (dashed line). The data are plotted using logarithmically spaced bins as described by Sigworth and Sine (1987).
Competition experiments with nonreversible activation
We investigated the possibility that reversible and nonreversible activation was due to DIDS binding to a common set of sites on the RyR. One could imagine that DIDS first interacts with the RyR with weak binding and then after some time cross-links with available amino acid residues to form a covalent bond. If this were the case then reversible DIDS activation should not be apparent in DIDS modified RyRs. Furthermore, suramin, DBDS, and DNDS, which compete with DIDS for reversible sites, should also protect the RyR from nonreversible DIDS binding. With regard to the former, we found that after short exposures to 500 μM DIDS, DIDS could still produce a small reversible increase in RyR activity in the presence of 1 mM Ca2+ (e.g., see Fig. 3, B and C). Even after 3–9 min exposure to 500 μM DIDS, the presence of 500 μM DIDS reversibly activated the DIDS modified RyRs from 0.29 ± 0.03 to 0.61 ± 0.03 (4 experiments on 14 channels). This result indicates that slow, nonreversible activation and reversible activation are associated with different DIDS binding sites on the RyR.
The effect of suramin and DBDS on nonreversible DIDS activation of RyRs is shown in Fig. 8. In the presence of a very high concentration of suramin (Fig. 8 A) or DBDS (Fig. 8 B), RyRs were exposed to 1 μM DIDS for ∼30 s. Suramin at 1 mM (20 × Ka(suramin), see Table 2) should slow the onset of DIDS activation by 20-fold if suramin and DIDS share common binding sites. However, DIDS exposure in the presence of suramin had the same effect as normally seen in the absence of suramin; demonstrating that suramin does not impede activation by DIDS. Similar experiments using 500 μM DBDS (3 × Ka(DBDS)) instead of suramin gave the same finding. Therefore different binding sites are associated with the reversible and fast nonreversible mechanisms.
FIGURE 8.
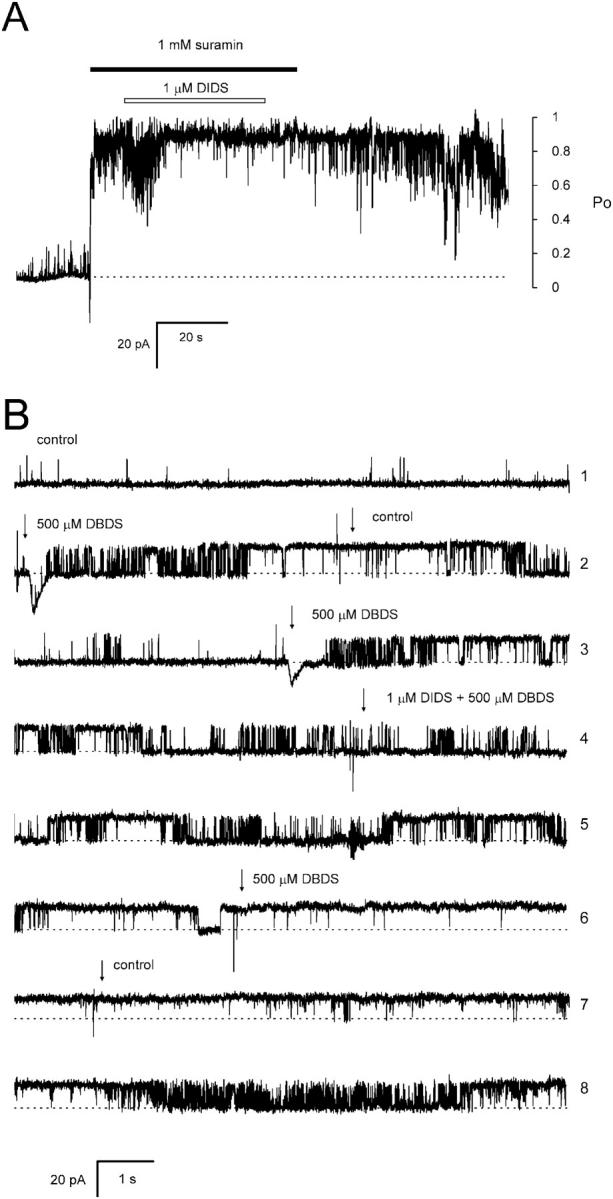
High concentrations of suramin or DBDS do not protect RyRs from fast DIDS activation. (A) Four RyRs in the presence of 1 mM Ca2+ are exposed to 1 mM suramin (solid bar). During this time the RyRs are exposed to 1 μM DIDS for ∼30 s (open bar). In the presence of suramin DIDS further activated the RyRs and activity did not return to control levels after the removal of DIDS and suramin. (B) Effects of DBDS and DIDS on a single RyR shown in consecutive traces. The top three traces demonstrate reversible activation by DBDS alone. Traces 4–8 show that 20 s DIDS exposure in the presence of DBDS causes nonreversible activation. In these experiments channel openings produce upward current jumps from the baseline (dashed line). Approximate scales for mean Po are shown at the right of A.
Nonreversible activation and ATP binding
We investigated the possibility that DIDS activated RyRs by covalently binding to the nucleotide activation sites on the RyR. This was tested by exposing RyRs to DIDS in the presence of high concentrations (10 mM, 30 × Ka(ATP)) of ATP and then seeing if ATP slowed the progression of nonreversible activation by DIDS. The exponential time constant of nonreversible DIDS activation of RyRs in the presence of ATP (Fig. 6 A) was 93 ± 36 s which was not significantly different to that in the absence of ATP (48 ± 13 s). Thus ATP had no protective effect against slow DIDS activation observed in the absence of Ca2+. In analogous experiments to those shown in Fig. 8 (not shown), ATP did not prevent fast, nonreversible activation by 1 μM DIDS in the presence of 1 mM Ca2+. These findings indicate that both the fast and slow DIDS activation sites are distinct from the ATP binding sites on the RyR.
Ligand regulation of DIDS modified RyRs
We explored the ligand regulation of RyRs that had been modified by the covalent binding of DIDS. DIDS modification was achieved by incubating RyRs for periods of 1 and 4 min. The comparative effects of DIDS modification after these exposure times indicated whether channel modification was due to fast or slow DIDS activation mechanisms. DIDS was then washed away before channel activity was measured. A summary of the regulation of DIDS-modified RyRs by Ca2+, Mg2+, ATP, and pH is shown in Fig. 9. This is compared with the regulation of native RyRs measured in previous studies from this laboratory. Table 3 lists the key parameters from theoretical fits to the data from native and DIDS-modified RyRs.
TABLE 3.
| Parameter | DIDS modified RyRs | Native RyRs | ||
|---|---|---|---|---|
| Ca2+ regulation | ||||
| Ka(Ca) | 4 ± 2 μM | 1.0 ± 0.7 μM | ||
| Ki(Ca) | 9.3 ± 2.2 mM | 0.71 ± 0.08 mM | ||
| na(Ca) | 1.2 ± 0.5 | 1.3 ± 0.5 | ||
| ni(Ca) | 1.2 ± 0.3 | 2.2 ± 0.2 | ||
| Pmax(Ca) | 0.71 ± 0.07 | 0.5 ± 0.15 | ||
| Pi(Ca) | 0.44 ± 0.11 | 0 | ||
| Mg2+ inhibition | ||||
| Ki(Mg) at 1 mM Ca2+ | 7.5 ± 2.8 mM | 0.49 ± 0.07 mM | ||
| ni(Mg) at 1 mM Ca2+ | 1.5 ± 0.4 | 1.9 ± 0.2 | ||
| ATP activation | ||||
| Ka(ATP) | 0.32 ± 0.04 mM | 0.36 ± 0.08 mM | ||
| na(ATP) | 2.6 ± 0.4 | 1.8 ± 0.7 | ||
| Pmax(ATP) | 0.91 ± 0.04 | 0.33 ± 0.04 | ||
| Pi(ATP) | 0.54 ± 0.11 | 0 | ||
| Low-pH inhibition | ||||
| DIDS exposure
|
RyR activated by:
|
|||
| 1 min | 4 min | (5 mM ATP) | (50 μM Ca2+) | |
| pKi | 6.7 ± 0.03 | 6.67 ± 0.02 | 6.7 ± 0.2 | 6.6 ± 0.1 |
| na(pH) | 4 ± 2 | 2.8 ± 0.3 | 2.0 ± 0.4 | 2.6 ± 0.2 |
| Pmax(pH) | 0.8 ± 0.1 | 0.67 ± 0.03 | 0.48 ± 0.02 | 0.07 ± 0.02 |
| Pi(pH) | 0 ± 0.001 | 0.025 ± 0.002 | 0 ± 0.001 | 0 ± 0.001 |
Parameters used for the theoretical curves in Fig. 9 (see Eqs. 1 and 2). Pmax and Pi are the RyR open probabilities at maximally activating ligand concentration and in the absence of ligands, respectively. na, nI, and Ka are the Hill coefficient and apparent affinity for activation, respectively, and ni and Ki are corresponding parameters for inhibition. pKi is the pH for half inhibition. Parameters obtained for native RyRs were obtained from Laver et al. (1995, 1997) for Ca2+ regulation, Laver et al. (1997) for Mg2+ inhibition, Laver et al. (2001) for ATP activation and Laver et al. (2000) for pH inhibition.
The Ca2+ regulation of RyRs was strongly affected by covalent DIDS modification (Fig. 9 A). DIDS activated RyRs over the entire experimental range of cytoplasmic [Ca2+]. The bell-shaped Ca2+ dependence, characteristic of native RyRs, was still apparent after DIDS treatment. RyR sensitivity to Ca2+ activation was not significantly affected. However, Ca2+ inhibition was shifted by an order of magnitude to higher [Ca2+] and there was a large component of channel activity that did not require Ca2+. The rates of DIDS activation, shown in Fig. 6, were determined at [Ca2+] = 1 nM (Fig. 6 A), 3 μM (Fig. 6 C), 100 μM (Fig. 6 B) and 10 mM (Fig. 6 A). These results indicate that modification of the Ca2+-independent part of the Ca2+ dependence ([Ca2+]<1 μM) is associated only with the slow DIDS activation mechanism whereas modification of the bell-shaped part is primarily associated with the fast mechanism. We noted that the slow DIDS binding process did have a minor activating effect on RyRs at high [Ca2+]. In the presence of 500 μM DIDS, RyR activation by the fast mechanism should have been very fast (∼10 ms). However, sustained application of 500 μM DIDS from 20 s to120 s exposure times further increased RyR activity by 25% ± 15% (n = 5).
Mg2+ inhibition of DIDS modified RyRs is shown in Fig. 9 B. In the presence of 1 mM [Ca2+], Mg2+ inhibited RyRs with an effective Ki of 7.5 mM. Thus, DIDS modified RyRs were 10-fold less sensitive to Mg2+ inhibition than native ones and modification of Mg2+ inhibition occurred in less than 1 min and so was likely to be associated with the fast DIDS process. As yet we have not determined whether the slow process contributes to modification of Mg2+ inhibition.
DIDS produced substantial activation of ATP activated RyRs after 4 min exposure (Fig. 9 C). DIDS increased Po by ∼0.4 over the entire experimental range of [ATP] (0–8 mM) but did not significantly alter the ATP sensitivity, Ka(ATP), of the RyR (see Table 3). DIDS exposures of only 1 min had relatively little effect on the ATP activation properties of RyRs indicating that the effect of DIDS was primarily a result of the slow DIDS modification process.
Similarly, DIDS had no significant effect on the sensitivity of RyRs to inhibition by low pH (Fig. 9 D). In addition to RyR activation at high pH (see above) DIDS caused a small but significant increase in RyR activity at low pH which was only apparent after 4 min exposures to DIDS. Thus it appears that this effect is due to the slow DIDS modification process.
DISCUSSION
The experimental findings indicate that DIDS can activate RyRs by one reversible and two nonreversible mechanisms, each associated with DIDS binding at different sites on the RyR complex. The two nonreversible mechanisms are distinguished by their disparate DIDS binding rates and the different effects they exert on RyRs. The faster mechanism confers a DIDS sensitivity to RyRs that is 3 orders of magnitude greater than previously thought (e.g., Hirata et al., 1999; Sitsapesan, 1999). DIDS, DBDS, and DNDS may all share a common reversible activation mechanism.
Mechanism for reversible activation
Reversible activation by suramin and DBDS can produce near maximal activity (Po ∼ 0.8) of RyRs in the absence of Ca2+ and ATP and at high concentrations of Ca2+ and Mg2+ where RyRs are normally inactive. Klinger et al. (1999), Sitsapesan (1999) and Sitsapesan and Williams (1996) have seen similar levels of activation by suramin.
Suramin and DBDS produce the same effects on RyR conductance (Hill and Sitsapesan, 2002; Sitsapesan, 1999). We show that disulfonated stilbenes and suramin have a number of other features in common. The activating effects of these compounds decrease with decreasing cytoplasmic Ca2+ and with increasing amounts of negatively charged PS in the lipid bilayer (see below). This further supports the hypothesis (see Sitsapesan, 1999) that suramin and DBDS bind at common sites on the RyR.
The number of reversible binding sites on each RyR is not certain but the Hill coefficients indicate that more than one site is involved in the reversible activation process. This is expected because as the RyR has a homotetrameric structure that can have four copies of each binding site. The effect of lipid headgroup charge on DIDS, DBDS, and suramin binding implies that these binding sites are in close proximity to the bilayer surface. Electrostatic repulsion between these compounds and the lipid headgroups is a relatively short range interaction because of charge screening by mobile ions in the bath. Therefore a binding site on the RyR that is more than ∼1 nm from the membrane (the Debye length in 250 mM monovalent electrolyte) will not be significantly affected by charge on the lipid headgroups. It is also unlikely that the binding sites lie within the bilayer itself because these compounds are unable to permeate the bilayer and activate RyRs from the luminal side (Sitsapesan and Williams, 1996). The fact that suramin, DBDS, and DIDS can bind to the lipids opens up the possibility that the lipid headgroups form part of their binding pocket. This is supported by the fact that the apparent affinities for adsorption of these compounds to lipid bilayers matches that for their activating effects on RyRs.
It is unlikely that the lipids confer the Ca2+ dependence on reversible activation because DIDS adsorption to lipids was not dependent on [Ca2+] over the range 0–1 mM (Fig. 2 C). It is more likely that the disulfonated stilbenes and suramin act synergistically with Ca2+ to activate RyRs in a manner similar to that known for adenine nucleotides and Ca2+ (Meissner, 1994). The Ca2+ dependence of reversible activation seen here for DBDS (c.f. Fig. 5, A and C) is similar to that reported previously for suramin. At submicromolar [Ca2+] the suramin dose response is strongly sigmoidal with half activation concentrations in the range 200–2000 μM while in the presence of 5–100 μM Ca2+, half activation occurs at ∼50 μM (Hohenegger et al., 1996; Klinger et al., 1999; Suko et al., 2001).
Several studies have focused on determining if suramin activates RyRs by binding at the adenine nucleotide activation sites on the RyR (see introduction). Biochemical (Hohenegger et al., 1996) and functional assays (Sitsapesan and Williams, 1996) show that ATP and suramin bind at different sites on the RyR. We confirmed this hypothesis with an alternative functional assay to that used by Sitsapesan and Williams (1996) in which we measured the effect of adenosine on suramin activated RyRs. Adenosine is known to inhibit ATP-activated RyRs by competing with ATP (Laver et al., 2001). However, in the presence of suramin, adenosine was a RyR activator, clearly demonstrating that adenosine does not compete with suramin for a common activation site.
Two nonreversible activation mechanisms
Two mechanisms underlying nonreversible activation could be distinguished by the 1000-fold difference in their rate of onset. The apparent binding rates were 105 M−1 s−1and 60 M−1 s−1 for the fast and slow mechanisms, respectively. The nonreversible and reversible mechanisms are independent because as their activation effects are additive, and DBDS and suramin did not inhibit DIDS activation (Fig. 8). Fast and slow mechanisms are also independent of each other and they are associated with DIDS binding which is independent of [Ca2+]. These DIDS binding sites are unlikely to be the ATP activation binding sites because ATP and DIDS activation were additive and ATP did not inhibit DIDS activation (either fast or slow).
Both mechanisms activated the RyRs in several stages that were distinguished by step changes in RyR open probability. The stages of activation referred to here should not be confused with a similar phenomenon reported by Sitsapesan (1999), in which RyRs were initially activated reversibly and subsequently modified by covalent DIDS binding. In our study, [DIDS] was kept low when observing stepwise activation to avoid significant reversible activation. The multiple stages of activation reveal the complexity of the DIDS activation mechanism. It is likely that a DIDS binding event initiates each stage of the activation sequence because increasing [DIDS] speeds activation through all stages and DIDS removal arrests further activation. However, it is not clear whether the multiplicity of binding events is due to DIDS binding at single or multiple sites on each subunit of the RyR. DIDS binding at a single site on each subunit could produce four stages of activation, each corresponding to a different number of covalently modified subunits.
The two nonreversible mechanisms have different effects on the RyRs. Slow activation is near maximal after ∼4 min of exposure to 100 μM DIDS but has relatively little effect at less than 1 min exposure. An example of slow activation can be seen in Fig. 3 A. The slow mechanism 1) activates RyRs in the absence of Ca2+ and ATP, 2) activates RyRs in the presence of ATP without altering Ka(ATP), 3) produces minor activation of RyRs at inhibiting pH levels (i.e., pH less than 6.5) without altering pKi, 4) makes a minor contribution to the activation of Ca2+ activated RyRs. Fast activation of RyRs is more specific in its effect on RyR gating. Here it only modified the Ca2+/Mg2+ regulation of the channel. Fast activation increases the maximal Po of Ca2+ activation from 0.45 to 0.71, and causes a 10-fold decrease in RyR sensitivity to Ca2+/Mg2+ inhibition. The fast mechanism was not reported in previous studies (Sitsapesan, 1999; Zahradnikova and Zahradnik, 1993) where DIDS was applied in aliquots with bath stirring. In our study we were also unable to resolve fast activation when using this method of DIDS application.
The precise reason for the pronounced latency in the activation time course at low [DIDS] is not known. The latency indicates that there is a relatively slow, [DIDS]-dependent reaction step somewhere in the activation process that does not produce immediate activation of the RyRs. This reaction step could either be limited access of DIDS to the RyR, or a DIDS binding event that leaves RyR activity unaffected. Though we cannot completely rule out the possibility of limited access we feel it is unlikely because RyRs respond reversibly to DIDS and the other compounds in less than 1 s. We considered the possibility that adsorption of DIDS to the lipid bilayer temporarily siphons DIDS away from the RyRs. However, the DIDS buffering capacity of the lipid bilayer is not high enough to significantly lower the DIDS concentration near the RyR for more than a few milliseconds after the onset of perfusion. The more likely scenario is that there is a delay, for some reason, between in the first DIDS binding event and the onset of RyR activation.
General significance
The increased multiplicity of DIDS activation mechanisms gives new insights into RyR function and also provides an explanation of controversies in the literature. For example, Hirata et al. (1999) propose that DIDS modifies RyRs by binding to a 30 kDa coprotein on the cytoplasmic side of the membrane. They did not detect DIDS binding to the RyR at all. However, DIDS modification of purified cardiac RyRs (Hill and Sitsapesan, 2002) clearly demonstrates that DIDS can bind directly to the RyR. These contradictory interpretations could be reconciled if the conflicting experiments were measuring different mechanisms. Hirata et al. (1999) experiments that used low [DIDS] (3 μM) would have only detected the fast mechanism, and Hill and Sitsapesan (2002) study, using high [DIDS] (1 mM) would observed the combined effects of the fast and slow mechanisms.
Both DIDS and DBDS increased RyR conductance to K+ and Ca2+ (Hill and Sitsapesan, 2002). These effects were reversible in the short term and nonreversible in the long term. Thus conductance modification occurs at sites that can bind DIDS reversibly and nonreversibly. The DIDS binding sites identified by Hill and Sitsapesan (2002) for cardiac RyRs must be different to those identified in skeletal RyRs in this study because the reversible and nonreversible mechanisms here are independent.
The actions of DIDS reported here reveal new ways that DIDS might elucidate RyR function. For example, the fact that the fast DIDS mechanism modifies Ca2+-dependent gating and not ATP-dependent gating indicates that the transduction of Ca2+ and ATP binding into channel opening occurs via different molecular pathways. Also, the stepwise activation of RyRs by DIDS is consistent with the cooperative molecular events in the four subunits of the RyR homotetramer that lead to gating of the pore.
The high sensitivity and functional specificity for fast activation are attributes that favor the use of DIDS-based compounds as therapeutic agents for enhancing Ca2+-induced Ca2+ release from the SR of skeletal and cardiac muscle. Indeed, DIDS at relatively low concentrations has already proved beneficial in protecting ischemic myocardium (Ramasamy et al., 2001). Finally, the marked effect of membrane lipids on the pharmacology of RyRs has not been reported before and it confirms that functional interactions occur between membrane proteins and the cell membranes in which they are embedded.
Acknowledgments
Thanks to Angela Dulhunty, Suzy Pace, and Joan Stivala for supplying SR vesicles, and to Graham Lamb and Dirk Van Helden for helpful discussions and critically reading the manuscript.
This work was supported by the Australian Research Council (ARC). DRL was supported by an ARC Professorial Fellowship and ERO'N by an ARC project grant (number A00103779).
References
- Brooks, S. P., and K. B. Storey. 1992. Bound and determined: a computer program for making buffers of defined ion concentrations. Anal. Biochem. 201:119–126. [DOI] [PubMed] [Google Scholar]
- Chu, A., M. C. Dixon, A. Saito, S. Seiler, and S. Fleischer. 1988. Isolation of sarcoplasmic reticulum fractions referable to longitudinal tubules and junctional terminal cisternae from rabbit skeletal muscle. Methods Enzymol. 157:36–50. [DOI] [PubMed] [Google Scholar]
- Coronado, R., J. Morrissette, M. Sukhareva, and D. M. Vaughan. 1994. Structure and function of ryanodine receptors. Am. J. Physiol. 266:C1485–C1504. [DOI] [PubMed] [Google Scholar]
- Dunn, P. M., and A. G. Blakeley. 1988. Suramin: a reversible P2-purinoceptor antagonist in the mouse vas deferens. Br. J. Pharmacol. 93:243–245. [DOI] [PMC free article] [PubMed] [Google Scholar]
- Grahame, D. C. 1947. The electrical double layer and the theory of electrocapillarity. Chem. Rev. 41:441–501. [DOI] [PubMed] [Google Scholar]
- Hamada, T., Y. Sakube, J. Ahnn, D. H. Kim, and H. Kagawa. 2002. Molecular dissection, tissue localization and Ca2+ binding of the ryanodine receptor of Caenorhabditis elegans. J. Mol. Biol. 321:123–135. [DOI] [PubMed] [Google Scholar]
- Hill, A. P., and R. Sitsapesan. 2002. DIDS Modifies the Conductance, Gating, and Inactivation Mechanisms of the Cardiac Ryanodine Receptor. Biophys. J. 82:3037–3047. [DOI] [PMC free article] [PubMed] [Google Scholar]
- Hirata, Y., N. Nakahata, M. Ohkura, and Y. Ohizumi. 1999. Identification of 30 kDa protein for Ca2+ releasing action of myotoxin a with a mechanism common to DIDS in skeletal muscle sarcoplasmic reticulum. Biochim. Biophys. Acta. 1451:132–140. [DOI] [PubMed] [Google Scholar]
- Hohenegger, M., M. Matyash, K. Poussu, A. Herrmann-Frank, S. Sarkozi, F. Lehmann-Horn, and M. Freissmuth. 1996. Activation of the skeletal muscle ryanodine receptor by suramin and suramin analogs. Mol. Pharmacol. 50:1443–1453. [PubMed] [Google Scholar]
- Hua, S., and G. Inesi. 1997. Lys515-Lys492 cross-linking by DIDS interferes with substrate utilization by the sarcoplasmic reticulum ATPase. Biophys. J. 73:2149–2155. [DOI] [PMC free article] [PubMed] [Google Scholar]
- Kawasaki, T., and M. Kasai. 1989. Disulfonic stilbene derivatives open the Ca2+ release channel of sarcoplasmic reticulum. J. Biochem. (Tokyo). 106:401–405. [DOI] [PubMed] [Google Scholar]
- Kennedy, C. 1990. P1- and P2-purinoceptor subtypes–an update. Arch. Int. Pharmacodyn. Ther. 303:30–50. [PubMed] [Google Scholar]
- Klinger, M., E. Bofill-Cardona, B. Mayer, C. Nanoff, M. Freissmuth, and M. Hohenegger. 2001. Suramin and the suramin analogue NF307 discriminate among calmodulin-binding sites. Biochem. J. 355:827–833. [DOI] [PMC free article] [PubMed] [Google Scholar]
- Klinger, M., M. Freissmuth, P. Nickel, M. Stabler-Schwarzbart, M. Kassack, J. Suko, and M. Hohenegger. 1999. Suramin and suramin analogs activate skeletal muscle ryanodine receptor via a calmodulin binding site. Mol. Pharmacol. 55:462–472. [PubMed] [Google Scholar]
- Knauf, P. A. 1979. Erythrocyte anion exchange and the Band 3 protein: transport kinetics and molecular structure. Current topics in membranes and transport. 12:249–363. [Google Scholar]
- Krainev, A. G., D. A. Ferrington, T. D. Williams, T. C. Squier, and D. J. Bigelow. 1995. Adaptive changes in lipid composition of skeletal sarcoplasmic reticulum membranes associated with aging. Biochim. Biophys. Acta. 1235:406–418. [DOI] [PubMed] [Google Scholar]
- Laver, D. R., and B. A. Curtis. 1996. Surface potentials measure ion concentrations near lipid bilayers during rapid solution changes. Biophys. J. 71:722–731. [DOI] [PMC free article] [PubMed] [Google Scholar]
- Laver, D. R., K. R. Eager, L. Taoube, and G. D. Lamb. 2000. Effects of cytoplasmic and luminal pH on Ca2+ release channels from rabbit skeletal muscle. Biophys. J. 78:1835–1851. [DOI] [PMC free article] [PubMed] [Google Scholar]
- Laver, D. R., G. K. Lenz, and G. D. Lamb. 2001. Regulation of the calcium release channel from rabbit skeletal muscle by the nucleotides ATP, AMP, IMP and adenosine. J Physiol. 537:763–778. [DOI] [PMC free article] [PubMed] [Google Scholar]
- Laver, D. R., V. J. Owen, P. R. Junankar, N. L. Taske, A. F. Dulhunty, and G. D. Lamb. 1997. Reduced inhibitory effect of Mg2+ on ryanodine receptor-Ca2+ release channels in malignant hyperthermia. Biophys. J. 73:1913–1924. [DOI] [PMC free article] [PubMed] [Google Scholar]
- Laver, D. R., L. D. Roden, G. P. Ahern, K. R. Eager, P. R. Junankar, and A. F. Dulhunty. 1995. Cytoplasmic Ca2+ inhibits the ryanodine receptor from cardiac muscle. J. Membr. Biol. 147:7–22. [DOI] [PubMed] [Google Scholar]
- Marks, P. W., and F. R. Maxfield. 1991. Preparation of solutions with free calcium concentration in the nanomolar range using 1,2-bis(o-aminophenoxy)ethane-N,N,N′,N′-tetraacetic acid. Anal. Biochem. 193:61–71. [DOI] [PubMed] [Google Scholar]
- McLaughlin, A., C. Grathwohl, and S. McLaughlin. 1978. The adsorption of divalent cations to phosphatidylcholine bilayer membranes. Biochim. Biophys. Acta. 513:338–357. [DOI] [PubMed] [Google Scholar]
- McLaughlin, S., N. Mulrine, T. Gresalfi, G. Vaio, and A. McLaughlin. 1981. Adsorption of divalent cations to bilayer membranes containing phosphatidylserine. J. Gen. Physiol. 77:445–473. [DOI] [PMC free article] [PubMed] [Google Scholar]
- Meissner, G. 1994. Ryanodine receptor/Ca2+ release channels and their regulation by endogenous effectors. Annu. Rev. Physiol. 56:485–508. [DOI] [PubMed] [Google Scholar]
- Miller, C., and E. Racker. 1976. Ca++-induced fusion of fragmented sarcoplasmic reticulum with artificial planar bilayers. Cell. 9:283–300. [DOI] [PubMed] [Google Scholar]
- Miller, C., and M. M. White. 1984. Dimeric structure of single chloride channels from Torpedo electroplax. Proc. Natl. Acad. Sci. USA. 81:2772–2775. [DOI] [PMC free article] [PubMed] [Google Scholar]
- Oba, T., M. Koshita, and D. F. Van Helden. 1996. Modulation of frog skeletal muscle Ca2+ release channel gating by anion channel blockers. Am. J. Physiol. 271:C819–C824. [DOI] [PubMed] [Google Scholar]
- Ramasamy, R., Y. Hwang, S. Bakr, and S. R. Bergmann. 2001. Protection of ischemic hearts perfused with an anion exchange inhibitor, DIDS, is associated with beneficial changes in substrate metabolism. Cardiovasc. Res. 51:275–282. [DOI] [PubMed] [Google Scholar]
- Sigworth, F. J., and S. M. Sine. 1987. Data transformations for improved display and fitting of single-channel dwell time histograms. Biophys. J. 52:1047–1054. [DOI] [PMC free article] [PubMed] [Google Scholar]
- Sitsapesan, R. 1999. Similarities in the effects of DIDS, DBDS and suramin on cardiac ryanodine receptor function. J. Membr. Biol. 168:159–168. [DOI] [PubMed] [Google Scholar]
- Sitsapesan, R., and A. J. Williams. 1996. Modification of the conductance and gating properties of ryanodine receptors by suramin. J. Membr. Biol. 153:93–103. [DOI] [PubMed] [Google Scholar]
- Suko, J., G. Hellmann, and H. Drobny. 2001. Short- and Long-Term Functional Alterations of the Skeletal Muscle Calcium Release Channel (Ryanodine Receptor) by Suramin: Apparent Dissociation of Single Channel Current Recording and [3H] ryanodine binding. Mol. Pharmacol. 59:543–556. [DOI] [PubMed] [Google Scholar]
- Sutko, J. L., and J. A. Airey. 1996. Ryanodine receptor Ca2+ release channels: does diversity in form equal diversity in function? Physiol. Rev. 76:1027–1071. [DOI] [PubMed] [Google Scholar]
- Zahradnikova, A., and I. Zahradnik. 1993. Modification of cardiac Ca2+ release channel gating by DIDS. Pflugers Arch. 425:555–557. [DOI] [PubMed] [Google Scholar]