Abstract
Epicholesterol (Echol) is an epimeric form of cholesterol (Chol). A molecular dynamics simulation of the fully hydrated dimyristoylphosphatidylcholine-Echol (DMPC-Echol) bilayer membrane containing ∼22 mol % of Echol was carried out for 5 ns. A 3-ns trajectory generated between 2 and 5 ns of molecular dynamics simulation was used for analyses to determine the effects of Echol on the membrane properties. As reference systems, pure DMPC and mixed DMPC-Chol bilayers were used. The study shows that Echol, like Chol, changes the organization of the bilayer/water interface and increases membrane order and condensation, but to a lesser degree. Effects of both sterols are based on the same atomic level mechanisms; their different strength arises from different vertical localizations of Echol and Chol hydroxyl groups in the membrane/water interface.
INTRODUCTION
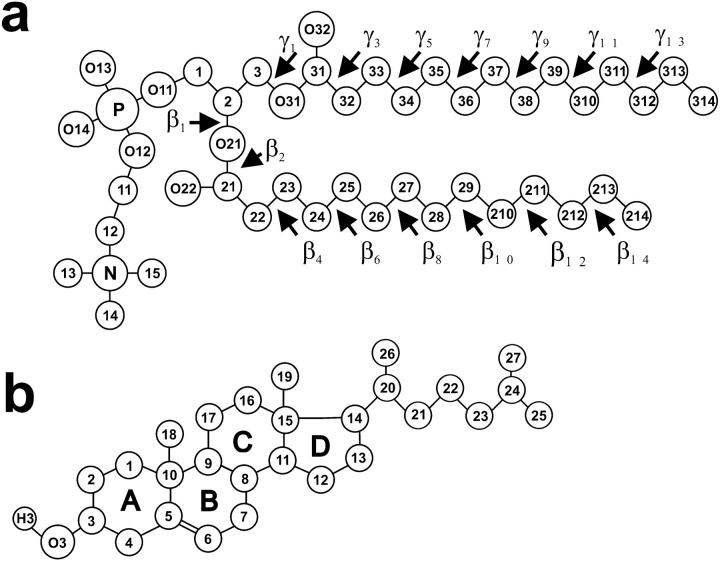
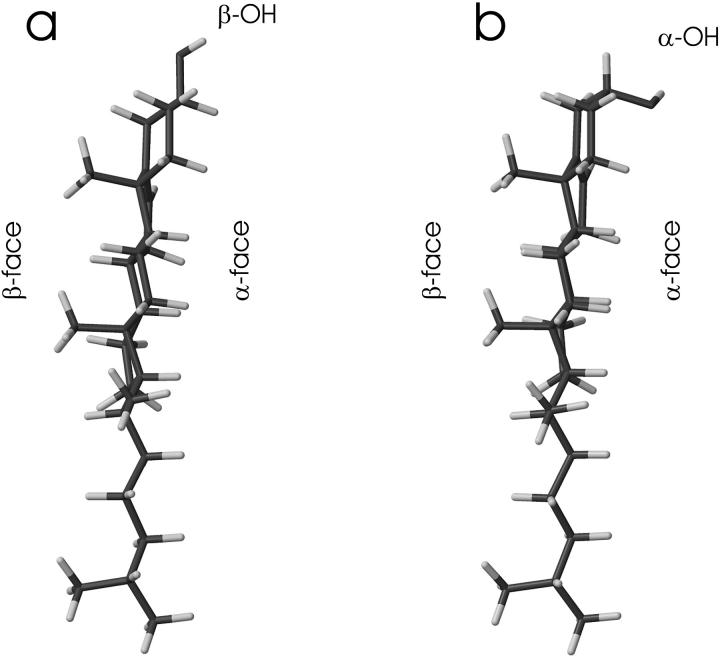
Cholesterol (Chol, β-OH-Chol) is an important constituent of the animal cell membrane, where it accounts for up to 50 mol % of the membrane lipids (e.g., Sackmann, 1995). In contrast, epicholesterol (Echol, α-OH-Chol), which is an epimeric form of Chol, is rare in nature. Animal cells that are not able to synthesize cholesterol can grow in the cell culture only when the medium contains Chol; other sterols, including Echol, cannot practically substitute for Chol (Esfahani et al., 1984). Chol and Echol have the same planar tetracyclic ring system and isooctyl chain (Fig. 1). The ring system is asymmetric about the ring plane and has a flat side with no substituents (α-face) and a rough side with two methyl substituents (β-face) (Fig. 2). Structurally Chol and Echol differ in the chirality of C3 (compare to Fig. 1). In Chol, the hydroxyl group is in the β-conformation (is located on the β-face), whereas in Echol, the hydroxyl group, is in the α-conformation (is located on the α-face). Three-dimensional structures of Chol and Echol are shown in Fig. 2.
FIGURE 1.
Molecular structures of (a) DMPC, and (b) Chol molecules with numbering of atoms (the chemical symbol for carbon atoms, C, is omitted) and torsion angles. The Chol rings are labeled A, B, C, and D.
FIGURE 2.
Three-dimensional structures of (a) Chol, and (b) Echol molecules. The smooth (α-face) and rough (β-face) faces of sterol molecules are labeled.
Although Chol and Echol differ only in the absolute conformation of the hydroxyl group, they influence membrane properties to a different extent. Passive permeability of the membrane to ions and small, uncharged molecules like glucose is reduced more by Chol than Echol (De Kruyff et al., 1972, 1973; Demel et al., 1972). On the molecular level, Chol induces higher ordering of phospholipid alkyl chains in the liquid-crystalline phase (ordering effect) than Echol (Dufourc et al., 1984). Hsia et al. (1972) even suggested that chain ordering by Echol is negligible. Chol in concentration 30 mol % eliminates the main phase transition, whereas Echol does not (De Kruyff et al., 1972). Weaker interactions between phospholipids and Echol than Chol are also suggested by the much higher rate of spontaneous transfer of Echol than Chol between liposomes (Nakagawa et al., 1980). Nevertheless, both sterols promote formation of detergent insoluble domains, enriched in saturated lipid and sterol molecules (Xu and London, 2000).
An excellent overview of recent advances in computer simulations of lipid bilayers is given by Scott (2002). Among extensively studied membrane systems are phosphatidylcholine (PC) bilayers containing Chol. Using a combined Monte Carlo and molecular dynamics (MD) simulation method, Chiu et al. (2001a,b) investigated the effect of Chol at high and low concentrations on PC bilayers made of saturated and monounsaturated PCs. The study was extended on saturated PC bilayers containing broadly varying concentrations of Chol (Chiu et al., 2002). Results it provided give new details of PC-Chol interactions. Smondyrev and Berkowitz (2001a, b) performed comparative MD simulation studies of the effect of Chol, ergosterol, lanosterol, and 6-ketocholestanol on the saturated PC bilayer and explained differences in their effects. All these membrane models contained from 72 to over 160 lipid molecules, and were simulated for 2.5–5.0 ns.
In our papers on the dimyristoylphosphatidylcholine (DMPC)-Chol bilayer, effects of Chol on the membrane/water interface (Pasenkiewicz-Gierula et al., 2000), order of hydrocarbon chains (Róg and Pasenkiewicz-Gierula, 2001a), and membrane condensation (Róg and Pasenkiewicz-Gierula, 2001b) were studied using MD simulation. In this paper, effects of Echol both on the membrane/water interface and the hydrocarbon chain region of a DMPC bilayer are investigated and compared with those of Chol. α-OH-Chol affects the membrane order and condensation less than β-OH-Chol. A direct cause of the reduced ability of Echol to increase membrane order and condensation compared to that of Chol is its localization in the bilayer that protrudes ∼2 Å more into the membrane/water interface.
METHOD
Simulation systems
A DMPC-Echol bilayer membrane used in this study consisted of 56 DMPC, 16 Echol (∼22 mol % Echol), and 1622 water molecules. It was obtained from a DMPC-Chol bilayer simulated for over 5 ns (Pasenkiewicz-Gierula et al., 2000) by changing the configuration of the hydroxyl group from β to α in all Chol molecules. MD simulation of the DMPC-Echol bilayer was carried out for 5 ns. As reference systems, pure DMPC bilayer simulated for 12 ns (Pasenkiewicz-Gierula et al., 1997, 1999), and DMPC-Chol bilayer simulated for 15 ns (Róg and Pasenkiewicz-Gierula, 2001a) were used. Details concerning construction and equilibration of DMPC and DMPC-Chol bilayers were described in Pasenkiewicz-Gierula et al. (1997, 1999, 2000), and Róg and Pasenkiewicz-Gierula (2001a). Fig. 1 shows the structure and numbering of atoms and torsion angles in DMPC and sterol molecules.
Simulation parameters
DMPC-Echol, DMPC-Chol, and pure DMPC bilayers were simulated using AMBER 4.0 (Pearlman et al., 1991). For DMPC and both sterols, optimized potentials for liquid simulations (OPLS) parameters (Jorgensen and Tirado-Rives, 1988) were used. The procedure for supplementing the original OPLS base with the missing parameters for DMPC was described by Pasenkiewicz-Gierula et al. (1999), and for Chol by Pasenkiewicz-Gierula et al. (2000). For water, TIP3P parameters (Jorgensen et al., 1983) were used. The united-atom approximation was applied to CH, CH2, and CH3 groups of DMPC and sterols. The water molecule and the hydroxyl group of sterols were treated with full atomic details. The atomic charges of the DMPC molecule were taken from Charifson et al. (1990) (details are given in Pasenkiewicz-Gierula et al., 1999). The atomic charges of the Echol molecule were the same as those of Chol given in (Pasenkiewicz-Gierula et al., 2000).
Simulation conditions
Three-dimensional periodic boundary conditions with the usual minimum image convention were used. The SHAKE algorithm (Ryckaert et al., 1977) was applied to OH bonds of the water molecule and the sterol hydroxyl group; the time step was set at 2 fs (Egberts et al., 1994). For nonbonded interactions a residue-based cutoff was used with a cutoff distance of 12 Å. Each DMPC molecule was divided into six residues (Pasenkiewicz-Gierula et al., 1997), and each sterol molecule was divided into three residues (Pasenkiewicz-Gierula et al., 2000). The list of nonbonded pairs was updated every 25 steps.
Simulation was carried out at a constant temperature of 310 K = 37°C, which is above the main phase transition temperature for a pure DMPC bilayer (∼23°C), and a constant pressure (1 atm). Temperatures of the solute and solvent were controlled independently. Both the temperature and pressure of the system were controlled by the Berendsen method (Berendsen et al., 1984). The relaxation times for temperatures and pressure were set at 0.4 and 0.6 ps, respectively. Applied pressure was controlled anisotropically, where each direction was treated independently and the trace of the pressure tensor was kept constant (1 atm).
RESULTS
Characterization of the membrane system
Time development of the DMPC-Echol bilayer temperature (Fig. 3 a), potential energy (Fig. 3 b), surface area/DMPC (Fig. 3 c), and number of gauche conformations/myristoyl chain (Fig. 3 d), was monitored from the onset of simulation until 5 ns. The surface area/DMPC in the DMPC-Echol membrane was calculated in the same way as that in the DMPC-Chol bilayer (Pasenkiewicz-Gierula et al., 2000). Because in the literature there is no available estimate of the Echol surface area, it was assumed that Echol occupies, in the bilayer, the same surface area as Chol, of 39 Å2. Such a value was determined for Chol in a Chol monolayer by Hyslop et al. (1990). Other experiments on Chol monolayers (Brzozowska and Figaszewski, 2002) give a value of 41 ± 1 Å2 per Chol molecule and indicate that the value changes little with the applied surface pressure up to over 20 mN/m. The latter result would suggest that Chol surface area in the bilayer is not very different from that in the monolayer. A different conclusion was drawn by Chiu et al. (2002) based on simulations of bilayers containing varying concentrations of Chol. Due to the way of the DMPC-Echol bilayer construction (compare to Simulation Systems), none of the monitored parameters changed significantly during the whole simulation. From the time profile of the surface area/DMPC, it was assumed that the system equilibrated during the initial 2 ns of the simulation time. The results described in this paper were obtained from a 3-ns trajectory of the DMPC-Echol bilayer generated between 2 and 5 ns of MD simulation. They were compared with those obtained from an 8-ns trajectory of the DMPC-Chol bilayer generated between 7 and 15 ns of MD simulation (Róg and Pasenkiewicz-Gierula, 2001a) and from a 6-ns trajectory of the pure DMPC bilayer generated between 6 and 12 ns of MD simulation (Róg and Pasenkiewicz-Gierula, 2001a). Reported average values for all bilayers are time and ensemble averages; errors are given in standard errors. After equilibration of the DMPC-Echol bilayer, the average value of the surface area/DMPC is 57.5 ± 0.5 Å2, and the average number of gauche conformations for torsion angles 4–14 (see explanation below) is 2.3 ± 0.1.
FIGURE 3.
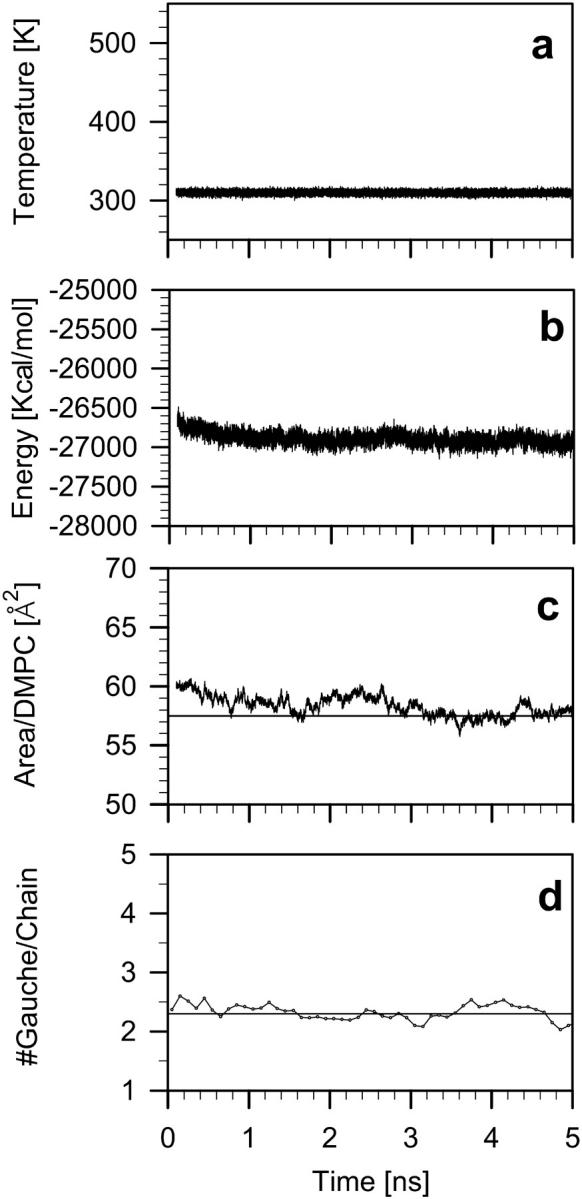
Time profiles of the (a) temperature, (b) potential energy, (c) surface area per DMPC, and (d) number of gauche bonds per chain in DMPC-Echol bilayer. The thin lines in c and d indicate average values after equilibration of, respectively, the surface area of 57.5 Å2/DMPC, and gauche bonds per chain (compare to text), of 2.3 ± 0.1.
The membrane/water interface
To elucidate the effect of Echol on the bilayer/water interface, the atomic-level interactions of the Echol hydroxyl group (OH-Echol) with PC headgroups and water molecules were analyzed. The extent to which these interactions interfere with formations of water bridges and charge pairs between PCs observed in pure DMPC bilayer (Pasenkiewicz-Gierula et al., 1997, 1999) was established and compared to that of the Chol hydroxyl group (OH-Chol). The effect of OH-Chol on the bilayer/water interface was studied in details in Pasenkiewicz-Gierula et al. (2000), where a 2-ns trajectory generated during MD simulation of the DMPC-Chol bilayer was analyzed. The results for the DMPC-Chol bilayer presented here were recalculated from a longer, 8-ns trajectory (Róg and Pasenkiewicz-Gierula, 2001a), and in this sense are new; nevertheless they do not considerably differ from those already published. The same geometrical definitions of hydrogen (H-) bonding, water bridging, and charge pairing is used as in our previous papers (Pasenkiewicz-Gierula et al., 1997, 1999, 2000).
H-bonds formed by sterols
OH-Echol, like OH-Chol, participates in H-bonding with water and PC oxygen atoms. Average numbers of OH-Echol H-bonds with water and PC phosphate (Op) and carbonyl (Oc) oxygen atoms are given in Table 1 and compared with those of OH-Chol. For both epimers, 75% of H-bonds with water are made via the hydroxyl hydrogen atom (Hch) (water⋯Hch H-bonds) and 25% via the oxygen atom (Och) (water⋯Och H-bonds). On average, each sterol makes nearly one H-bond with water. Both Echol and Chol make H-bonds predominately with Op (0.27/Echol and 0.17/Chol) however, the number of Op-OH-Echol H-bonds is ∼60% higher than Op-OH-Chol ones.
TABLE 1.
Interactions in the membrane/water interface
| DMPC | DMPC-Chol | DMPC-Echol | |
|---|---|---|---|
| Sterol-Water H-bonds | − | 0.8 ± 0.1/Chol | 0.7 ± 0.1/Echol |
| Sterol-PC H-bonds | − | 0.28 ± 0.01/Chol | 0.40 ± 0.01/Echol |
| OP | 0.20 ± 0.01/Chol | 0.33 ± 0.01/Echol | |
| OC | 0.08 ± 0.01/Chol | 0.07 ± 0.01/Echol | |
| Sterol-PC water bridges | − | 0.56 ± 0.01/Chol | 0.44 ± 0.01/Echol |
| OP | 0.31 ± 0.01/Chol | 0.25 ± 0.01/Echol | |
| OC | 0.25 ± 0.01/Chol | 0.19 ± 0.01/Echol | |
| Sterol-PC charge pairs | − | 0.2 ± 0.1/Chol | 0.2 ± 0.2/Echol |
| PC-PC water bridge | 0.57 ± 0.01/PC | 0.53 ± 0.01/PC | 0.50 ± 0.01/PC |
| PC-PC charge pairs | 2.08 ± 0.04/PC | 1.81 ± 0.03/PC | 1.46 ± 0.04/PC |
| OP | 1.25 ± 0.04 | 1.09 ± 0.03 | 0.91 ± 0.04 |
| OC | 0.83 ± 0.03 | 0.72 ± 0.03 | 0.55 ± 0.04 |
| PC-Water H-bonds | 10.6 ± 0.1/PC | 11.5 ± 0.1/PC | 11.7 ± 0.1/PC |
| OP, OC | 4.5 ± 0.1 | 4.8 ± 0.1 | 5.0 ± 0.1 |
| Choline† | 6.1 ± 0.1 | 6.7 ± 0.1 | 6.7 ± 0.1 |
Sterol-water, Sterol-DMPC, and DMPC-DMPC H-bonds, water bridges, and charge pairs in DMPC,* DMPC-Chol, and DMPC-Echol bilayers. Errors are given in standard errors.
From Pasenkiewicz-Gierula et al. (1999) (from 5-ns trajectory).
Water in the clathrate.
PC-sterol water bridges
Numbers of PC-sterol water bridges are given in Table 1. In 85% of cases the bridge is formed via one of the water hydrogen atoms and the water oxygen atom (PC-O⋯H-wat-O⋯HO-Sterol) and only 15% via the two water hydrogen atoms (PC-O⋯H-wat-H⋯OH-Sterol). More than half (54%) of the water bridges are formed with Op. The number of water bridges between PC and Chol is ∼30% higher than Echol; nevertheless, on average, every other sterol molecule is linked to a PC via a water bridge.
PC-sterol charge pairs
The negatively-charged oxygen atom of the sterol hydroxyl group can interact with a positively charged methyl group of the PC choline moiety (N-CH3) to form charge pairs. Both in DMPC-Chol and DMPC-Echol bilayers the average number of Och-N-CH3 charge pairs per sterol molecule is the same and equal to 0.2 (Table 1).
PC-PC interactions
Our previous study demonstrated that the membrane/water interface organization is mainly determined by an average PC-PC distance that is proportional to the surface area available to PC headgroups (Murzyn et al., 2001). Incorporation of sterol molecules into hydrated PC bilayers increases the distance. This results in higher hydration of PC headgroups and lower number of PC-PC interactions (charge pairs and water bridges). Average numbers of PC-PC water bridges, charge pairs, and PC hydrating water molecules for DMPC, DMPC-Chol, and DMPC-Echol bilayers are given in Table 1. Among the three bilayers, numbers of water bridges and charge pairs are the lowest and the number of hydrating water molecules is the highest for the DMPC-Echol bilayer, where the surface area per DMPC headgroup is the largest.
Location of the sterol hydroxyl group in the interface
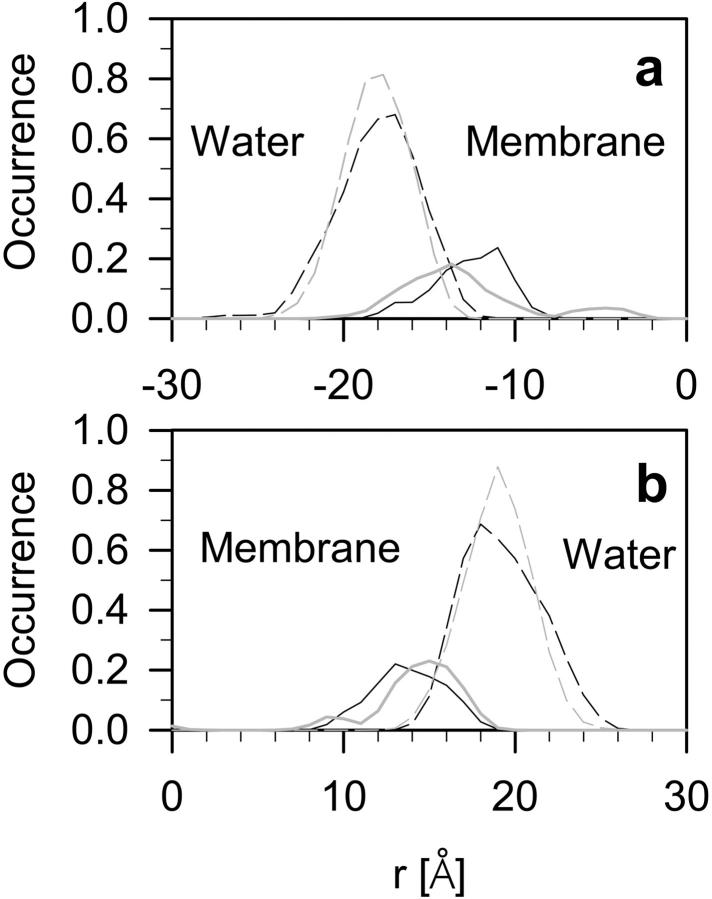
Profiles of the atom density of sterol oxygen atoms along the bilayer normal in the DMPC-Chol and DMPC-Echol bilayers together with profiles of PC phosphate oxygen atoms are compared in Fig. 4, separately for both bilayer leaflets. Because the thickness of each bilayer is different, the profiles are displayed in such a way that average positions of Ops in upper and lower leaflets of both bilayers overlap. As can be seen from Fig. 4, on average, OH-Echol is located ∼2 Å higher in the water phase than OH-Chol.
FIGURE 4.
Profiles of the atom density of Op (dashed line), and sterol HO group (solid line) in DMPC-Chol (black line) and DMPC-Echol (gray line) bilayers.
The membrane hydrocarbon core
In the analyses below, averaging conformation-related quantities, only torsion angles 4–14 were taken into account, because neither in pure DMPC nor in mixed bilayers are β3 and γ3 in well-defined, stable conformations (trans or gauche) (Róg and Pasenkiewicz-Gierula, 2001a).
Sterols ordering effect
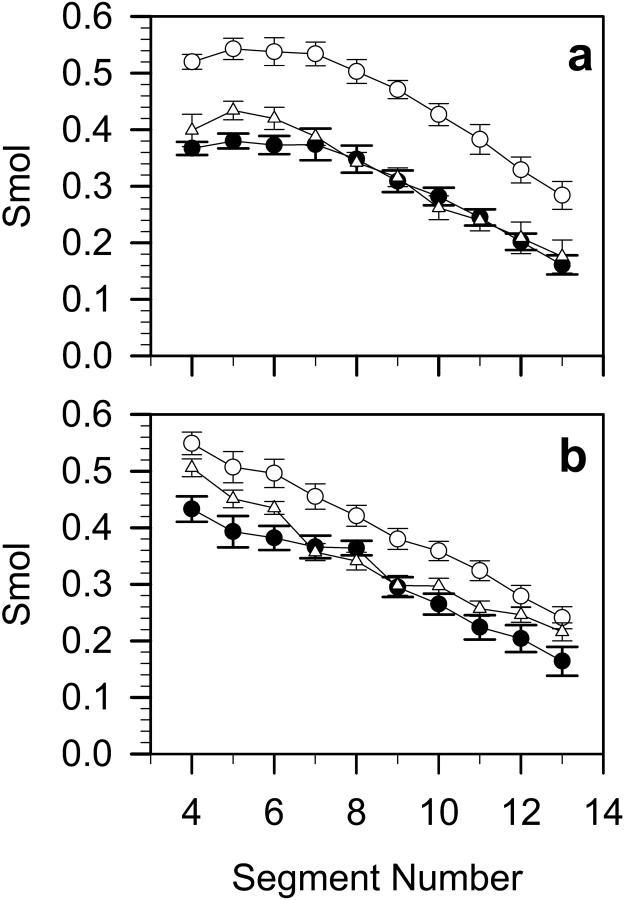
Molecular order parameter, Smol, profiles along the β- and γ-chain in DMPC, DMPC-Chol, and DMPC-Echol bilayers are shown in Fig. 5. Mean values (averages over Cn−1 – Cn+1 segments 4–14) of Smol for the β- and γ-chain are given in Table 2. As can be seen from Fig. 5 and Table 2, the ordering effect of Chol is stronger than Echol. Chol orders more β- than γ-chain, whereas the effect of Echol is reversed but weak.
FIGURE 5.
Profiles of the molecular order parameter (Smol) calculated for the DMPC (a) β-chain, and (b) γ-chain in pure DMPC (•), DMPC-Chol (○), and DMPC-Echol (▵) bilayers.
TABLE 2.
Sterols ordering effect
| Smol | Tilt (°) | No. gauche | Lifetime (ps) trans/gauche | |||||
|---|---|---|---|---|---|---|---|---|
| Membrane | β-chain | γ-chain | β-chain | γ-chain | β-chain | γ-chain | β-chain | γ-chain |
| DMPC | 0.30 ± 0.01 | 0.31 ± 0.01 | 27 ± 0.5 | 28 ± 0.5 | 2.4 ± 0.1 | 2.4 ± 0.1 | 180 ± 4/55 ± 2 | 190 ± 4/55 ± 2 |
| DMPC-Chol | 0.45 ± 0.01 | 0.40 ± 0.01 | 20 ± 0.5 | 22 ± 0.5 | 2.3 ± 0.1 | 2.2 ± 0.1 | 215 ± 4/60 ± 2 | 230 ± 4/60 ± 2 |
| Chol | 17† ± 2 | |||||||
| DMPC-Echol | 0.32 ± 0.01 | 0.34 ± 0.01 | 27 ± 0.5 | 25 ± 0.5 | 2.4 ± 0.1 | 2.2 ± 0.1 | 180 ± 4/60 ± 2 | 185 ± 6/60 ± 2 |
| Echol | 16† ± 2 | |||||||
Average (over segments and torsion angles 4–14, see text) values of the molecular order parameter, Smol, chain tilt angle, number of gauche/alkyl chain, and lifetimes of trans and gauche conformations, for the β- and γ-chain in DMPC,* DMPC-Chol,* and DMPC-Echol bilayers. Errors are given in standard errors.
Tilt of the sterol ring.
A tilt angle of a PC chain was calculated from cos2 of the angle between the bilayer normal and the average segmental vector (averaged over segmental vectors 4–14; the n-th segmental vector is a vector linking Cn−1 and Cn+1 atoms in the alkyl chain). As can be read from Table 2, Chol decreases the membrane average tilt of both β- and γ-chain by ∼7°, whereas Echol decreases only the tilt of the γ-chain by ∼3°. Sterol tilt was defined as an angle between the C3-C15 vector (compare to Fig.1 b) and the membrane normal. The average tilt, calculated based on the cone angle formalism, of Chol is 17° and of Echol is 16° (Table 2).
Differences between membrane average numbers of gauche rotamers per chain in DMPC, DMPC-Chol, and DMPC-Echol bilayers are small and statistically insignificant (Table 2). Probability profiles of the gauche conformation along the β- and γ-chain in DMPC, DMPC-Chol, and DMPC-Echol bilayers are shown in Fig. 6. The effect of Chol on the probability of gauche for torsion angles β4 and β5 was discussed in Róg and Pasenkiewicz-Gierula (2001a). The effect of Echol on the gauche probability for β4 is less than that of Chol, whereas that for β5 is similar. Both sterols have practically no effect on the gauche probability in the γ-chain.
FIGURE 6.
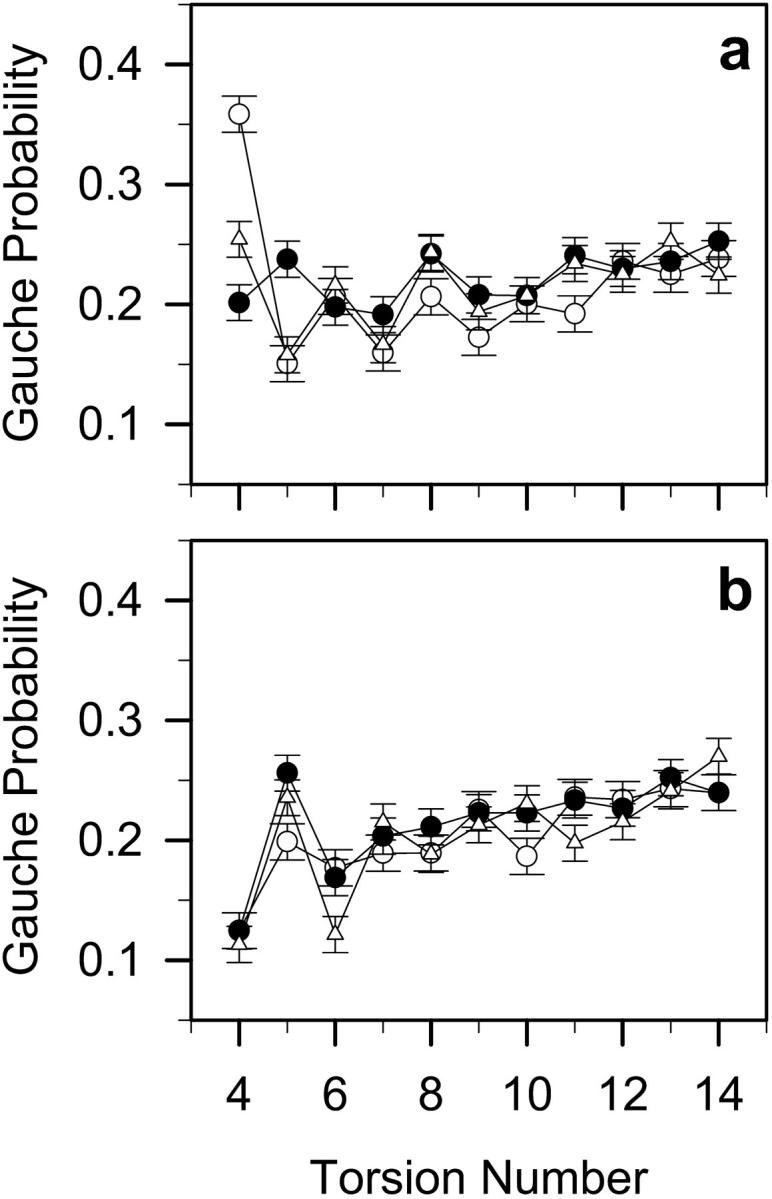
Probabilities of gauche conformations along the (a) β-chain, and (b) γ-chain in pure DMPC (•), DMPC-Chol (○), and DMPC-Echol (▵) bilayers.
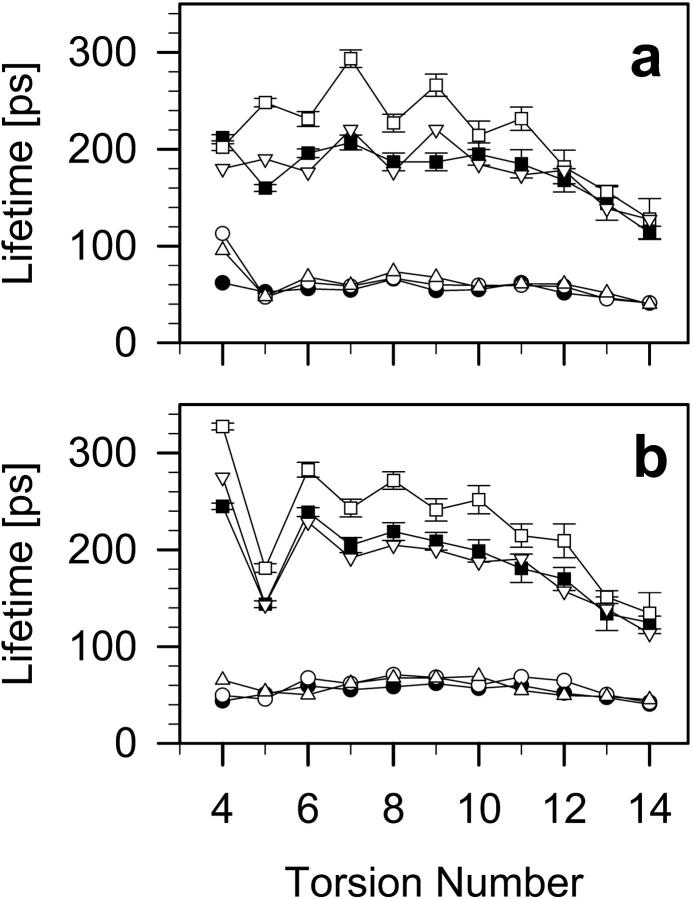
Lifetime profiles of gauche and trans conformations along the β- and γ-chain in DMPC, DMPC-Chol, and DMPC-Echol bilayers, shown in Fig. 7, are consistent with the results in Figs. 5 and 6. Average lifetimes are given in Table 2. From Fig. 7 and Table 2 one can conclude that Chol stabilizes trans conformation and changes little gauche conformation, whereas Echol has little effect on either trans or gauche conformation.
FIGURE 7.
Profiles of lifetimes of the trans (▪, □, ▿), and gauche (•, ○, ▵) conformations along the (a) β-chain, and (b) γ-chain in pure DMPC (▪, •), DMPC-Chol (□, ○), and DMPC-Echol (▿, ▵) bilayers.
Sterols condensing effect
As a measure of the membrane thickness, the distance between average phosphorus position from opposite membrane leaflets was used. The P–P distance is 32.9 ± 0.1 Å in DMPC, 35.1 ± 0.1 Å in DMPC-Chol, and 33.8 ± 0.1 Å in DMPC-Echol membrane (Table 3). Concomitant with an increase of the DMPC-sterol bilayer thickness, the cross-section area per DMPC molecule decreases from 61 ± 1 Å2 in pure DMPC bilayer to 53 ± 1 Å2 in DMPC-Chol bilayer and to 58 ± 1 Å2 in DMPC-Echol bilayer (Table 3). The decrease in the surface area/PC is followed by the increase of the bilayer surface density (the mass of all lipid molecules in the bilayer divided by the bilayer surface area) from 1.87 in DMPC to 2.04 in DMPC-Chol and 1.92 × 10⁻⁷g/cm2 in DMPC-Echol bilayers (Table 3).
TABLE 3.
Sterols condensing effect
| Membrane | DMPC | DMPC-Chol | DMPC-Echol |
|---|---|---|---|
| Surface area/DMPC [Å2] | 61 ± 0.5 | 53 ± 0.5 | 58 ± 0.5 |
| P–P distance [Å] | 32.9 ± 0.1 | 35.1 ± 0.1 | 33.8 ± 0.1 |
| Surface density ×10−7g/cm2 | 1.87 ± 0.01 | 2.04 ± 0.01 | 1.92 ± 0.01 |
| Number of neighbors | 38.82 ± 0.05 | 40.15 ± 0.05 | 39.82 ± 0.05 |
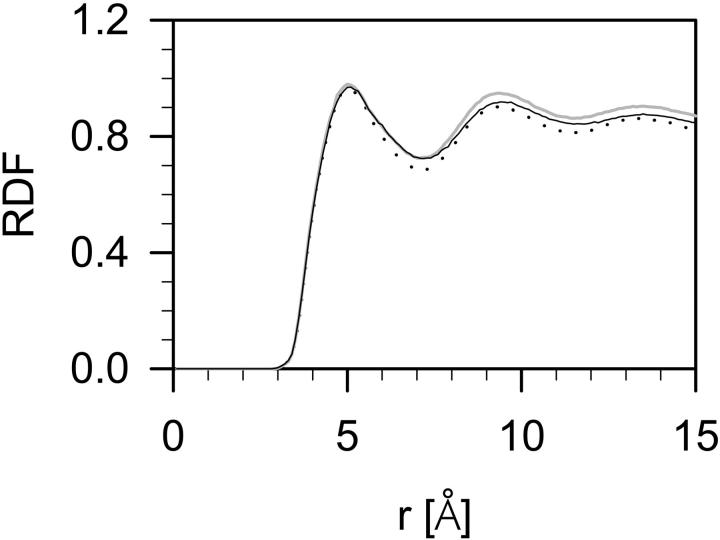
A radial distribution function (RDF) is a quantitative measure of groups ordering relative to each other. RDFs of a carbon atom relative to the remaining carbon atoms in the hydrophobic core of the DMPC, DMPC-Chol (Róg and Pasenkiewicz-Gierula, 2001b), and DMPC-Echol bilayers are compared in Fig. 8. The pairs of atoms that are linked by the bonding interactions (bond, angle, and torsion) were omitted when calculating RDFs. All RDFs have two well-resolved maxima, the first at 6 Å and the second at 9 Å, and a minimum at 7 Å. RDF for DMPC-Echol bilayer has intermediate values between those for DMPC and DMPC-Chol bilayers, the latter having ∼5% higher values than the former. Thus, packing of atoms is tighter in DMPC-Chol bilayer than in DMPC-Echol and DMPC bilayers.
FIGURE 8.
Three-dimensional radial distribution functions (RDF) for carbon atoms in the hydrophobic core of pure DMPC (dotted line), DMPC-Chol (solid gray line), and DMPC-Echol (solid black line) bilayers.
As we showed in our previous study (Róg and Pasenkiewicz-Gierula, 2001b), to the RDF for DMPC-Chol bilayer contribute RDF for the carbon atoms solely of the DMPC alkyl chains and RDF of the Chol ring carbon atoms relative to DMPC alkyl chain atoms. Only the first RDF has the three extrema mentioned above and reflects tight vdW contacts between DMPC chains. The shape of the other one indicates weak interactions between DMPC chains and the steroid ring of Chol. Similar results were obtained for DMPC-Echol bilayer (data not shown), so the same conclusions can be drawn for the steroid ring of Echol.
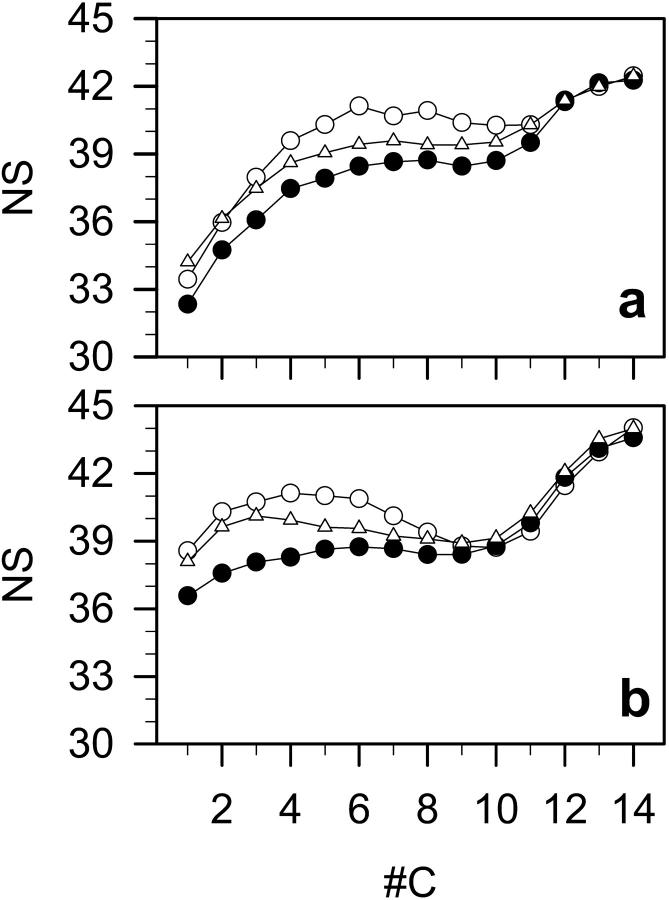
The packing of atoms in the bilayer core can be estimated by calculating the number of neighbors according to the method described in Róg and Pasenkiewicz-Gierula (2001b). A neighbor is each atom of a different molecule located not further than 7 Å (the position of the first minimum in RDF) from an arbitrary chosen carbon atom in the hydrophobic core of the bilayer. The average number of neighbors is 38.82 ± 0.05 in DMPC, 40.15 ± 0.05 in DMPC-Chol, and 39.82 ± 0.05 in DMPC-Echol bilayers (Table 3). Profiles of the number of neighbors along the β- and γ-chain in DMPC, DMPC-Chol, and DMPC-Echol bilayers are shown in Fig. 9. Both in DMPC-Chol and DMPC-Echol bilayers, atoms 1−11 in the β-chain and 1−8 in the γ-chain have more neighbors than in DMPC bilayer; however, the number of neighbors is higher in DMPC-Chol than in DMPC-Echol bilayers. These atoms penetrate the same depth of the bilayer as the atoms of steroid rings. Numbers of neighbors of atoms that are located in the bilayer center (12−14 and 9−14 in the β- and γ-chain, respectively) are the same in all three bilayers.
FIGURE 9.
Profiles of the number of neighbors (NS) (compare to text) along the (a) β-chain, and (b) γ-chain in DMPC (•), DMPC-Chol (○), and DMPC-Echol (▵) bilayers.
Discussion
The primary aim of this study was to determine the effect of the sterol hydroxyl group conformation (α or β) on the DMPC bilayer interface and hydrophobic core, and to elucidate atomic level mechanisms responsible for the effect. Scarce experimental studies demonstrated that Echol increases the PC chain order (Dufourc et al., 1984) and decreases membrane permeability (De Kruyff et al., 1972, 1973; Demel et al., 1972) less than Chol, and also that the rate of spontaneous transfer between liposomes of Echol is higher than Chol (Brainard and Cordes, 1981). Thus, this MD simulation study confirmed that α-OH-Chol increases the order of PC hydrocarbon chains and their packing; however, to a lesser extent than β-OH-Chol.
As we showed in our previous studies (Murzyn et al., 2001), properties of the membrane/water interface are predominately determined by an average PC-PC distance, the quantity that can be derived from an average surface area available to the PC headgroup (when calculating the surface area per PC headgroup in the bilayer, the area of sterol molecules is not subtracted from the total surface area of the simulation box). With an increasing area, the number of short distance interactions involving PC polar groups and water is reduced and the hydration of PC headgroups is increased (Murzyn et al., 2001). Results obtained in this research fit well with this data. Of the three bilayers studied, the number of PC-PC links via water bridges and charge pairs is the lowest in the DMPC-Echol bilayer where the average surface area per PC headgroup of 69 Å2 is larger than those in DMPC bilayer of 61 Å2 and DMPC-Chol bilayer of 64 Å2. In DMPC bilayers containing 22 mol % Echol and Chol, the number of PC-PC water bridges is reduced, relative to that in pure DMPC bilayer, by 12% and 7%, respectively, and the number of PC-PC charge pairs by 30% and 13%, respectively. Compared to that of Chol, the Echol-induced increase of the DMPC headgroup hydration is not remarkable. The number of PC H-bonded water molecules is by 0.2 larger in DMPC-Echol than DMPC-Chol bilayers, whereas the number of water molecules bound to the PC choline group is the same in both bilayers. This indicates that PC hydration in DMPC-Chol bilayer nearly reached its limiting value and further increase in the surface area/headgroup cannot significantly change it.
Interactions between polar groups of sterol and PC molecules are affected by the sterol hydroxyl group conformation. The number of direct H-bonds between PC and Echol is higher than Chol, however, only for H-bonds made with Op (the number of Oc-sterol H bonds is practically the same in both bilayers). This correlates well with higher localization of Echol than Chol at the bilayer interface. Direct H-bonding between Echol and Op competes with PC-Echol and PC-PC water bridges so the number of these water-mediated interactions is less in DMPC bilayer containing Echol than Chol.
As was mentioned above, the effect of α-OH-Chol on the bilayer order and condensation is weaker than that of β-OH-Chol. However, molecular mechanisms of the sterol effects are of a similar origin for Echol and Chol. The increase of Smol is due to the decreased tilt of PC chains (in the case of Echol, mainly the γ-chain) and, respectively, increased and decreased gauche probability of β4 and β5; the increase of membrane condensation is due to tighter vdW contacts between PC chains.
The most apparent difference between α-OH-Chol and β-OH-Chol in the bilayer is their localization. Echol sticks out into the bilayer interface more than Chol. The hydroxyl group of Echol is, on average, located in the region of PC phosphate groups, whereas that of Chol is in the region of PC carbonyl groups (Fig. 4, and Pasenkiewicz-Gierula et al., 2000). The vertical distance between average positions of Echol and Chol hydroxyl group is ∼2 Å.
A correlation between sterol vertical localization in the bilayer and its effect on the PC bilayer evident in this study was observed for oxidized-cholesterol (Karolis et al., 1998), 6-ketocholestanol (Smondyrev and Berkowitz, 2001a), and cholesterol sulfate (Faure et al., 1996; Smondyrev and Berkowitz, 2000). These sterol molecules stick into the interface more than Chol and are less effective in increasing the PC chain order.
Different localizations of Echol than Chol in the bilayer most likely result from their different molecular shapes. The α-conformation of OH-Echol interferes with the flat α-face of the steroid ring (compare to Fig. 2) so the molecule fits worse to the membrane environment and is pushed up. Interactions of OH-Echol with Ops stabilize this arrangement. As Róg and Pasenkiewicz-Gierula (2001a) showed, Chol increases PC chain order and packing predominantly by affecting torsion angles in the bent region of the β-chain (torsions β4 and β5). Thus, a small change in the vertical location of a sterol molecule may well result in a different magnitude of ordering and condensing effects observed for Chol and Echol both experimentally and in this MD simulation. Furthermore, the less flat α-face of the Echol steroid ring might be less effective in increasing the order of PC chains than the flat α-face of Chol.
CONCLUSIONS
This MD simulation study confirmed experimental results that α-OH-Chol increases the order and packing of PC hydrocarbon chains to a lesser extent than β-OH-Chol and suggested its most likely reason. The α-conformation of the Echol hydroxyl group brings about vertical dislocation of the sterol molecule and also disturbs the flat α-face of the steroid ring. These make α-OH-Chol less effective in decreasing tilt of PC chains and affecting gauche probability of β4 and β5 that promote membrane order and condensation. For this reason, the rate of spontaneous transfer between liposomes of Echol is higher than Chol.
Chol and Echol molecules that intercalated into a PC bilayer act as spacers and increase separation among PC headgroups. This reduces the number of PC-PC interactions in the interfacial region of the bilayer. Because Echol has lower ability to increase membrane condensation, the reduction is greater in the bilayer containing Echol than Chol. For this reason, a bilayer containing Echol is more permeable to ions and small, uncharged molecules than that containing Chol.
Acknowledgments
T.R. holds a fellowship award from the Polish Foundation for Science in 2002. This study was supported by Grant 6PO4A03121 from the Committee for Scientific Research, Poland. All calculations were performed at the Academic Computer Center Cyfronet, Poland, under Grants KBN/sgi_origin_200/UJ/004/2000.
References
- Berendsen, H. J. C., J. P. M. Postma, W. F. van Gunsteren, A. DiNola, and J. R. Haak. 1984. Molecular dynamics with coupling to an external bath. J. Chem. Phys. 81:3684–3690. [Google Scholar]
- Brainard, J. R., and E. H. Cordes. 1981. Carbon-13 nuclear magnetic resonance studies of cholesterol-egg yolk phosphatidylcholine vesicles. Biochemistry. 20:4607–4617. [DOI] [PubMed] [Google Scholar]
- Brzozowska, I., and Z. A. Figaszewski. 2002. The equilibrium of phosphatidylcholine-cholesterol in monolayers at the air/water interface. Colloid Surface B. 23:51–58. [Google Scholar]
- Charifson, P. S., R. G. Hiskey, and L. G. Pedersen. 1990. Construction and molecular modeling of phospholipid surfaces. J. Comp. Chem. 11:1181–1186. [Google Scholar]
- Chiu, S. W., E. Jakobsson, R. J. Mashl, and H. L. Scott. 2002. Cholesterol-induced modifications in lipid bilayers: a simulation study. Biophys. J. 83:1842–1853. [DOI] [PMC free article] [PubMed] [Google Scholar]
- Chiu, S. W., E. Jakobsson, and H. L. Scott. 2001a. Combined Monte Carlo and molecular dynamics simulation of hydrated dipalmitoyl-phosphatidylcholine-cholesterol lipid bilayers. J. Chem. Phys. 114:5435–5443. [Google Scholar]
- Chiu, S. W., E. Jakobsson, and H. L. Scott. 2001b. Combined Monte Carlo and molecular dynamics simulation of hydrated lipid-cholesterol lipid bilayers at low cholesterol concentration. Biophys. J. 80:1104–1114. [DOI] [PMC free article] [PubMed] [Google Scholar]
- de Kruyff, B., R. A. Demel, and L. L. van Deenen. 1972. The effect of cholesterol and epicholesterol incorporation on the permeability and on the phase transition of intact Acholeplasma laidlawii cell membranes and derived liposomes. Biochim. Biophys. Acta. 255:331–347. [DOI] [PubMed] [Google Scholar]
- de Kruyff, B., P. W. van Dijck, R. W. Godlbach, R. A. Demel, and L. L. van Deenen. 1973. Influence of fatty acid and sterol composition on the lipid phase transition and activity of membrane-bound enzymes in Acholeplasma laidlawii. Biochim. Biophys. Acta. 330:269–282. [DOI] [PubMed] [Google Scholar]
- Demel, R. A., K. R. Bruckdorfer, and L. L. van Deenen. 1972. The effect of sterol structure on the permeability of liposome to glucose, glycerol and Rb+. Biochim. Biophys. Acta. 255:321–330. [DOI] [PubMed] [Google Scholar]
- Dufourc, E. J., E. J. Parish, S. Chitrakorn, and I. C. P. Smith. 1984. Structural and dynamical details of cholesterol-lipid interaction as revealed by deuterium NMR. Biochemistry. 23:6062–6071. [Google Scholar]
- Egberts, E., S.-J. Marrink, and H. J. C. Berendsen. 1994. Molecular dynamics simulation of a phospholipid membrane. Eur. Biophys. J. 22:423–436. [DOI] [PubMed] [Google Scholar]
- Esfahani, M., L. Scerbo, and T. M. Devlin. 1984. A requirement for cholesterol and its structural features for a human macrophage-like cell line. J. Cell. Biochem. 25:87–97. [DOI] [PubMed] [Google Scholar]
- Faure, C., J. F. Tranchant, and E. J. Dufourc. 1996. Comparative effects of cholesterol and cholesterol sulfate on hydration and ordering of dimyristoylphosphatidylcholine membranes. Biophys. J. 70:1380–1390. [DOI] [PMC free article] [PubMed] [Google Scholar]
- Hsia, J. C., R. A. Long, F. E. Hruska, and H. D. Gesser. 1972. Steroid-phosphatidylcholine interactions in oriented multibilayers—a spin label study. Biochim. Biophys. Acta. 290:22–31. [DOI] [PubMed] [Google Scholar]
- Hyslop, P. A., B. Morel, and R. D. Sauerheber. 1990. Organization and interaction of cholesterol and phosphatidylcholine in model bilayer membrane. Biochemistry. 29:1025–1038. [DOI] [PubMed] [Google Scholar]
- Jorgensen, W. L., J. Chandrasekhar, J. D. Madura, R. W. Impey, and M. L. Klein. 1983. Comparison of simple potential functions for simulating liquid water. J. Chem. Phys. 79:926–935. [Google Scholar]
- Jorgensen, W. L., and J. Tirado-Rives. 1988. The OPLS potential functions for proteins. Energy minimizations for crystals of cyclic peptides and crambin. J. Am. Chem. Soc. 110:1657–1666. [DOI] [PubMed] [Google Scholar]
- Karolis, C., H. G. Coster, T. C. Chilcott, and K. D. Barrow. 1998. Differential effects of cholesterol and oxidised-cholesterol in egg lecithin bilayers. Biochim. Biophys. Acta. 1368:247–255. [DOI] [PubMed] [Google Scholar]
- Murzyn, K., T. Róg, G. Jezierski, Y. Takaoka, and M. Pasenkiewicz-Gierula. 2001. Effects of phospholipid unsaturation on the membrane/water interface: a molecular simulation study. Biophys. J. 81:170–183. [DOI] [PMC free article] [PubMed] [Google Scholar]
- Nakagawa, Y., S. Nojima, and K. Inoue. 1980. Transfer of steroids and alpha-tocopherol between liposomal membranes. J. Biochem. 87:497–502. [DOI] [PubMed] [Google Scholar]
- Pasenkiewicz-Gierula, M., T. Róg, K. Kitamura, and A. Kusumi. 2000. Cholesterol effects on the phosphatidylcholine bilayer polar region: a molecular simulation study. Biophys. J. 78:1376–1389. [DOI] [PMC free article] [PubMed] [Google Scholar]
- Pasenkiewicz-Gierula, M., Y. Takaoka, H. Miyagawa, K. Kitamura, and A. Kusumi. 1997. Hydrogen bonding of water to phosphatidylcholine in the membrane as studied by a molecular dynamics simulation: location, geometry and lipid-lipid bridging via hydrogen bonded water. J. Chem. Phys. 101:3677–3691. [Google Scholar]
- Pasenkiewicz-Gierula, M., Y. Takaoka, H. Miyagawa, K. Kitamura, and A. Kusumi. 1999. Charge pairing of headgroups in phosphatidylcholine membranes: a molecular dynamics simulation study. Biophys. J. 76:1228–1240. [DOI] [PMC free article] [PubMed] [Google Scholar]
- Pearlman, D. A., D. A. Case, J. C. Caldwell, G. L. Seibel, U. C. Singh, P. K. Weiner, and P. A. Kollman. 1991. Amber 4.0. University of California, San Francisco.
- Róg, T., and M. Pasenkiewicz-Gierula. 2001a. Cholesterol effects on the phosphatidylcholine bilayer nonpolar region: a molecular simulation study. Biophys. J. 81:2190–2202. [DOI] [PMC free article] [PubMed] [Google Scholar]
- Róg, T., and M. Pasenkiewicz-Gierula. 2001b. Cholesterol effects on the membrane packing and condensation: a molecular simulation study. FEBS Lett. 502:68–71. [DOI] [PubMed] [Google Scholar]
- Ryckaert, J. P., G. Ciccotti, and H. J. C. Berendsen. 1977. Numerical integration of the Cartesian equations of motion of a system with constraints: molecular dynamics of n-alkanes. J. Comp. Phys. 23:327–341. [Google Scholar]
- Sackmann, E. 1995. Biological membranes architecture and function. In Structure and Dynamics of Membranes. R. Lipowsky, and E. Sackmann, editors. Elsevier, Amsterdam. 1–64.
- Scott, H. L. 2002. Modeling the lipid component of membranes. Curr. Opin. Struct. Biol. 12:495–502. [DOI] [PubMed] [Google Scholar]
- Smondyrev, A. M., and M. L. Berkowitz. 2000. Molecular dynamics simulation of dipalmitoylphosphatidylcholine membrane with cholesterol sulfate. Biophys. J. 78:1672–1680. [DOI] [PMC free article] [PubMed] [Google Scholar]
- Smondyrev, A. M., and M. L. Berkowitz. 2001a. Effects of oxygenated sterol on phospholipid bilayer properties: a molecular dynamics simulation. Chem. Phys. Lipids. 112:31–39. [DOI] [PubMed] [Google Scholar]
- Smondyrev, A. M., and M. L. Berkowitz. 2001b. Molecular dynamics simulation of the structure of dimyristoylphosphatidylcholine bilayers with cholesterol, ergosterol, and lanosterol. Biophys. J. 80:1649–1658. [DOI] [PMC free article] [PubMed] [Google Scholar]
- Xu, X., and E. London. 2000. The effect of sterol structure on membrane lipid domains reveals how cholesterol can induce lipid domain formation. Biochemistry. 39:843–849. [DOI] [PubMed] [Google Scholar]


