Abstract
The relationship among protein oligomerization, secondary structure at the interface, and the interfacial behavior was investigated for spread layers of native pulmonary surfactant associated proteins B and C. SP-B and SP-C were isolated either from butanol or chloroform/methanol lipid extracts that were obtained from sheep lung washings. The proteins were separated from other components by gel exclusion chromatography or by high performance liquid chromatography. SDS gel electrophoresis data indicate that the SP-B samples obtained using different solvents showed different oligomerization states of the protein. The CD and FTIR spectra of SP-B isolated from all extracts were consistent with a secondary structure dominated by α-helix. The CD and FTIR spectra of the first SP-C corresponded to an α-helical secondary structure and the spectra of the second SP-C corresponded to a mixture of α-helical and β-sheet conformation. In contrast, the spectra of the third SP-C corresponded to antiparallel β-sheets. The interfacial behavior was characterized by surface pressure/area (π-A) isotherms. Differences in the oligomerization state of SP-B as well as in the secondary structure of SP-C all produce significant differences in the surface pressure/area isotherms. The molecular cross sections determined from the π-A isotherms and from dynamic cycling experiments were 6 nm2/dimer molecule for SP-B and 1.15 nm2/molecule for SP-C in α-helical conformation and 1.05 nm2/molecule for SP-C in β-sheet conformation. Both the oligomer ratio of SP-B and the secondary structure of SP-C strongly influence organization and behavior of these proteins in monolayer assemblies. In addition, α-helix → β-sheet conversion of SP-C occurs simply by an increase of the summary protein/lipid concentration in solution.
INTRODUCTION
Pulmonary surfactant contains four specific proteins: SP-A, SP-B, SP-C, and SP-D. SP-A and SP-D are hydrophilic proteins and as members of the collectin family of proteins contribute to host defense against invading pathogens (Haagsmann and Diemel, 2001; Crouch and Wright, 2001). SP-B and SP-C are extremely hydrophobic and play important roles in regulating surface tension in the lungs, thereby preventing alveoli collapse (Weaver, 1998; Pérez-Gil and Keough, 1998).
Ovine SP-B consists of 79 amino acids and has a molecular weight of 8690 Da. The content of hydrophobic amino acids in SP-B is 40.5% (11 Val, 13.9%; 15 Leu, 19%; and 6 Ile, 7.6%). Mature SP-B is commonly a homodimer in many species, with two monomeric units linked by disulphide bounds at Cys 48. Bovine SP-B occurs also as covalent trimer (Haagsmann and Diemel, 2001; Hawgood et al., 1998), and oligomeric forms of ovine SP-B have been described (Bünger et al., 2001). SP-B is remarkably thermally stable, and its α-helical domains are not much influenced by reduction of the disulfide bounds (Hawgood et al., 1998). SP-B is essential for lung function and its absence is lethal (Nogee, 1998). Despite the functional importance of SP-B, little is known about the biophysical activity of the different oligomeric forms.
Ovine SP-C consists of 35 amino acids and has a molecular weight of 4200 Da. The content of hydrophobic amino acids in SP-C is 65.7% (12 Val, 34.3%; 7 Leu, 20%; and 4 Ile, 11.4%). Despite its low molecular weight, SP-C has several structural features. The α-helical valyl-rich domain consists of amino acids in positions 11–34 and is 25 amino acids long.
Palmitoylation of the cysteines at positions 5 and 6 increases hydrophobicity of SP-C (Johansson et al., 1994; Johansson, 1998; Weaver, 1998). Dimeric SP-C that has almost exclusively β-sheet structure and is not acylated enhances the surface tension lowering properties of surfactant (Baatz et al., 1992). The β-sheet structure of SP-C develops from an α-helix located at the amino acids in position 11–34 upon incubation in solution (Kallberg et al., 2001). Removal of the palmitoyl groups accelerates α-helix → β-sheet conversion and fibril formation. Amyloidlike fibrils of SP-C were found in lung washings from patients with alveolar proteinosis (Gustafsson et al., 2001). The specific functional role of SP-C for breathing and the consequences of α-helix → β-sheet conversion are unknown.
The experimental determination of the conformation and the secondary structure of a protein provides understanding of the protein function. The conformation of proteins can be changed during each single step of pretreatment, isolation, and purification procedures, as well as sample preparation for the different methods used for the spectroscopic measurements (Lohner et al., 1997; Heremans and Smeller, 1998).
To date, there are only a few studies about the effect of the isolation method on surfactant protein conformation and the influence of protein conformation on the interfacial behavior. Therefore, the first objective of this study is to investigate the structure of hydrophobic surfactant proteins obtained by different isolation and purification procedures using circular dichroism (CD), Fourier transform infrared (FTIR) and matrix-assisted laser desorption/ionization time-of-flight mass (MALDI-TOF) spectroscopy. A second objective of this study is to compare the interfacial behavior of SP-B and SP-C with their structural data and to determine the molecular cross section of these proteins. Surface behavior of SP-B and SP-C monolayers was evaluated in a captive bubble surfactometer using axisymmetric drop shape analysis (ADSA).
MATERIALS AND METHODS
Materials
Chloroform (Ultra-Resi analyzed) was obtained from J.T. Baker (Griesheim, Germany) and methanol (LiChrosolv, gradient grade) from Merck (Darmstadt, Germany). Water was purified by means of a Milli-Q Plus Water System (Millipore, Eschborn, Germany) and had a surface tension of 72.4 ± 0.2 mN/m at 23°C as determined by using the axisymmetric drop shape analysis for captive bubbles (ADSA-CB) (Prokop et al., 1998). All glass vessels used for this study and the measuring cell were cleaned in KOH-saturated isopropanol.
Isolation of SP-B and SP-C
The pulmonary surfactant was obtained from cell-free sheep lung lavage fluid after 2-h centrifugation at 53,000 g. The pellet was homogenized in 1.64 N NaBr for density gradient centrifugation at 100,000 g overnight. (Hawgood et al., 1985; Pison et al., 1989). The pellicle was removed, washed, and homogenized in 4 mL water and the hydrophobic surfactant components were extracted into either 1-butanol (Bünger et al., 2000) or chloroform/methanol (Folch et al., 1957). The hydrophilic components of pulmonary sheep surfactant were discharged and the remaining solvents containing the hydrophobic surfactant components were evaporated in vacuum at 40°C and residues were weighed.
The first residue contained the hydrophobic components of pulmonary surfactant from butanol extraction (lipids, SP-B-1, and SP-C-1). It was weighted and resolved in 5 mL acidified (5% 0.1 M HCl) chloroform/methanol (1:1, v/v). Surfactant proteins were isolated using gel exclusion chromatography on LH-60 column (100 × 2.6 cm ID) (Pharmacia, Upsala, Sweden) with 5% 0.1 M HCl acidified chloroform/methanol (1:1, v/v) solvent as the mobile phase. SP-B-1 and SP-C-1 fractions were collected (50 ml of each protein) and aliquots of the solutions (1.5 ml) with final concentration of 0.04 to 0.06 mg/ml were stored at −20°C. The final concentration was determined using the HPLC method as described elsewhere (Bünger et al., 2000).
The second residue contained the hydrophobic components of pulmonary surfactant from chloroform/methanol extraction (lipids, SP-B-2 and SP-C-2). It was resolved in 5 mL acidified (5% 0.1 N trifluoroacetic acid) chloroform/methanol (1:1, v/v). Surfactant proteins were isolated using a semipreparative HPLC column (250 × 10 mm ID) with Vydac C4, a butyl silica gel (Bünger et al., 2000). SP-B-2 and SP-C-2 fractions were collected, the solvent was evaporated and the purified proteins weighted and then redisolved in chloroform/methanol (1:1, v/v) to give a final concentration of ∼0.8 −1.0 mg/ml. Aliquots were stored at −20°C.
The third residue contained the hydrophobic components of pulmonary surfactant from chloroform/methanol extraction (lipids, SP-B-3 and SP-C-3). It was resolved in 1.5 mL acidified (5% 0.1 N trifluoroacetic acid) chloroform/methanol (1:1, v/v) but then treated as the second residue. It should be emphasized that the only difference between residues 2 and 3 is the concentration of their protein/lipid extracts entering the HPLC column.
On SDS polyacrylamide gel electrophoresis (16% gels) under nonreducing conditions, SP-B-1 showed a single wide band centered at ∼23–24 kDa, and SP-B-2 and SP-B-3, at ∼29 kDa. SP-C-1, SP-C-2, and SP-C-3 showed only one band at ∼5 kDa (Fig. 1). Table 1 summarizes the three isolation and purification procedures that were used to obtain SP-B and SP-C.
FIGURE 1.
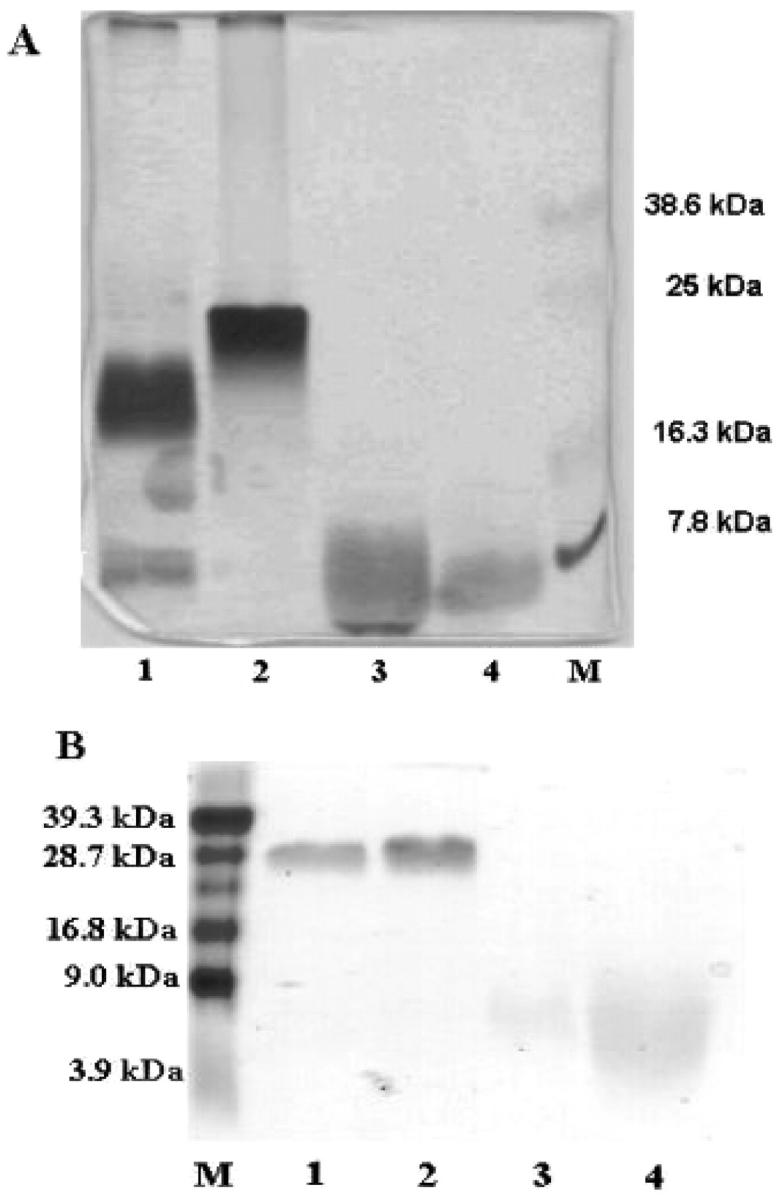
(A) Silver-stained nonreducing SDS–PAGE gels of fractions corresponding to SP-B-1 (lane 2) and SP-C-1 (lane 4) peaks from butanol extracts of sheep lavages. Gels show protein bands in fractions corresponding to SP-B (lane 1) and SP-C (lane 3) peaks from chloroform extracts of porcine lavages as comparison. (B) Coomassie brilliant blue-stained nonreducing SDS-PAGE gels of fractions corresponding to SP-B-2 (lane 1), SP-B-3 (lane 2), SP-C-2 (lane 3), and SP-C-3 (lane 4) peaks from chloroform/methanol extracts of sheep lavages.
TABLE 1.
Isolation/purification procedures and parameters characterizing surface behavior of SP-B and SP-C
| p-A Isotherms results
|
||||||||
|---|---|---|---|---|---|---|---|---|
| Liftoff point
|
Molecule cross-section
|
|||||||
| Protein sample | Extraction solvent/isolation method/volume of lipid extracts | Protein storage concentration [mg/ml] | [nm2/molecule] | [nm2/residue] | Plateaus [mN/m] | Starting point of plateau region [nm2/molecule] | [nm2] | [nm2/residue] |
| SP-B-1 | butanol/LH 60 column/5 ml | 0.04–0.06 | 23–24 | 0.146–0.152 | 20–25 | 12.8 | 6.1 | 0.0385 |
| SP-B-2 | chloroform-methanol/HPLC column/5 ml | 0.8–1.0 | 23–24 | 0.146–0.152 | 40–46 | 12.5 | 6 | 0.038 |
| SP-B-3 | chloroform-methanol/HPLC column/1.5 ml | 0.8–1.0 | 23–24 | 0.146–0.152 | 44–50 | 12.5 | 6 | 0.038 |
| SP-C-1 | butanol/LH 60 column/5 ml | 0.04–0.06 | 7.5 | 0.214 | ∼14 | 5.65 | 1.15 | 0.034 |
| ∼25 | – | |||||||
| ∼30 | 3.5 | |||||||
| 37–43 | 2.4 | |||||||
| SP-C-2 | chloroform-methanol/HPLC column/5 ml | 0.8–1.0 | 5 | 0.143 | 23–25 | 3.6 | 1.15 | 0.034 |
| 37–43 | 2.3 | |||||||
| SP-C-3 | chloroform-methanol/HPLC column/1.5 ml | 0.8–1.0 | 3 | 0.086 | ∼65 | – | 1.05 | 0.030 |
Mass spectrometry
Matrix-assisted laser desorption/ionization time-of-flight mass spectrometry of the protein samples was performed as previously described (Plasencia et al., 2001) on a BIFLEX time-of-flight instrument (Bruker-Franzen Analytik, Bremen, Germany) operated in the positive mode. A saturated solution of sinapinic acid in acetonitrile:water (1:2) with 0.1% trifluoroacetic acid was used as the matrix. Equal volumes of the matrix and the sample solution were put together and vortexed, and 1 ml of the mixture was spotted on the target and air-dried. Samples were analyzed in the linear mode, and typically 100 laser shots were summed into a single mass spectrum. External calibration was performed, using myoglobin as the standard.
Circular dichroism spectroscopy at spread protein layers
CD measurements are usually applied to characterize the secondary structure of proteins in solution. The secondary structure of proteins strongly depends on their primary structure, i.e., amino acid sequence, and on the environment and sample pretreatment conditions, such as protein concentration, the solvents and buffers used, and temperature (Dobson et al., 1998). Typical proteins can be unfolded by organic solvents. The strongly hydrophobic surfactant proteins, however, are known to retain their secondary structure in organic solvents (Cruz et al., 1995). The protein structure also may change by contacting interfaces. Therefore the pretreatment and storage of the layer supporting quartz plates are extremely important to mimic fluid interfaces.
The special feature of our CD experiments is a sample preparation using spreading of proteins onto a quartz surface. The necessary amount of protein is determined by the signal-to-noise ratio, which increases proportionally with the square root of the scan time. The spreading amount of proteins was 80 μg, as an excellent spectrum was obtained with as little as 0.01 mg of protein in solution (Pelton and McLean, 2000). There are different possibilities to set up interfaces into the measuring cell. A simple method is to use several quartz plates for carrying the spread layers. A similar form of sample preparation has been used previously for gelatin (Wüstneck, 1988), SP-B (Oviedo et al., 2001), SP-C (Creuwels et al., 1995), and for some antibiotic peptides (Yang et al., 2000).
An optimal procedure to create well-defined protein layers is spreading of the protein in organic solution (chloroform/methanol) on pretreated Suprasil QX quartz plates. Before spreading, the plates of 1.25-mm thickness were cleaned with KOH-saturated isopropanol solution and then soaked in pure water to hydrate the surface of the quartz glass, thus maintaining maximum similarity to the air/water interface in monolayer experiments.
Far UV CD spectra were obtained at room temperature using a JASCO J715 spectropolarimeter (Jasco, Germany). After 5 min waiting at room temperature to allow the solvent to evaporate, 1–4 quartz glass plates were placed in the measuring chamber with minimum space between individual plates. The area per plate was ∼100 mm2; the cross section was ∼10 mm. The spectra were recorded at 20 nm/min scan rate, the response time was 2 s, and the band width was 1 nm. During each measurement the chamber was flushed with nitrogen. Four consecutive scans from 260 to185 nm were accumulated and averaged. The CD spectra were recorded in millidegrees of ellipticity as a function of wavelength. The CD spectra of our three SP-B and three SP-C samples were qualitatively compared regarding the positions of their positive and negative bands.
FTIR spectroscopy at spread protein layers
FTIR spectroscopy is one of the techniques widely used to provide additional information on the conformation of proteins.
FTIR spectra were recorded at room temperature using a Bruker IFS 66 spectrometer (Bruker, Germany) equipped with a DTGS detector and were analyzed using the OPUS/IR2 program. Pure protein layers were obtained by spreading of chloroform/methanol solution (80 μg of protein) onto a self-pressed KBr plate. After 5 min waiting at room temperature to allow the solvent to evaporate, the plate was placed into the measuring chamber. During each measurement the chamber was flushed with dry air. One hundred consecutive scans were accumulated and averaged.
Surface pressure measurements
Surface pressure (π) versus area (A) measurements were performed using an airtight captive bubble cell as described in detail earlier (Wüstneck et al., 2000; 1999). The surface pressure, π = γ0 − γ, is the difference between the surface tension of the subphase, γ0, and the film-covered surface, γ. The π-A isotherms were obtained by continuous variation of the internal cell pressure, which yields a compression of the bubble volume and a corresponding reduction of the surface area. The surface tension was determined by using the axisymmetric captive bubble shape analysis (ADSA-CB) developed by Prokop et al. (1998).
SP-B and SP-C were dissolved in chloroform/methanol (3:1, v/v). The protein solutions were spread at the air bubble surface using a 0.5 μl Hamilton syringe. The bubble size in all experiments was 70 μl. The amount of spreading solution was minimized to 0.1 μl to avoid influences of the spreading solvent on the surface behavior of the monolayer as described earlier (Wüstneck et al., 2000). Control experiments revealed that such small amounts of chloroform and methanol dissolved in 2.5 ml water of the captive bubble chamber did not change the surface tension.
To evaluate and to improve the spreading technique we investigated the influence of bubble size, syringe needle parameters, and syringe handling procedure on surface tension measurements. Evaporation of the extremely small samples before spreading was prevented by additional aspiration of an air cushion of at least 0.1 μl after filling of the syringe needle with the spreading solution. Standard syringes were used with a sharp, 90° cut needle tip (pst3), which guarantees proper contact of the needle with the bubble surface. The spreading solution was slowly and gently injected on to the surface of the bubble under continuous video monitoring. After optimization of all parameters it was possible to spread even 0.4 μl solution without any problems caused by solvent vapors in the bubble. Ten min after solvent evaporation and equilibration of the surface film, protein monolayers were continuously compressed. To evaluate the spreading quantity of protein, each spreading experiment was repeated 5–10 times.
The surface pressure-area isotherms were plotted using nm2/molecule calculated by using a molecular weight for SP-B of 17,380 (dimer, 158 amino acid residues) and 4200 for SP-C (dipalmitoylated form, 35 amino acid residues).
It is not possible to determine the point where a monolayer is compressed to its complete coverage without auxiliary experiments. This critical point corresponds to the minimal area demand per molecule or molecule cross section. During further compression of protein monolayer, the formation of bi- or multilayers begins. This point can be determined using dynamic monolayer cycling, i.e., repeated fast monolayer compression/dilatation. The compression of the monolayer to molecular areas smaller than the minimal area demand per molecule yields a gradual shift of the whole isotherm to the left, i.e., to smaller molecular areas.
Therefore, after π-A isotherm measurements, dynamic cycling of the monolayer was carried out by compressing and expanding the bubble surface. For cycling experiments the bubble volume was continuously changed at 10 cycles per min.
RESULTS
Mass spectrometry
Molecular masses of SP-B and SP-C were determined using MALDI-TOF MS. The main peak of all SP-B samples was caused by the [M + H]+ ion of the dimeric protein (Table 2).
TABLE 2.
Average masses of the major forms of the surfactant proteins measured using MALDI-TOF-MS compared to the theoretical masses based on sequence analysis
| Protein sample | Theoretical molecular weight [M+H]+ | MALDI-TOF-MS [M+H]+ | Difference [Da] |
|---|---|---|---|
| SP-B-1 | 8691 | 8738 | 47 |
| 17381 | 17558 | 177 | |
| SP-B-2 | 8691 | 8705 | 14 |
| 17381 | 17424 | 43 | |
| SP-B-3 | 8691 | 8710 | 19 |
| 17381 | 17424 | 42 | |
| SP-C-1 | 4201 | 4198 | 3 |
| 4217 | 16 | ||
| SP-C-2 | 4201 | 4201 | 0 |
| SP-C-3 | 4201 | 4201 | 0 |
There were no crucial differences between SP-B-1, SP-B-2, and SP-B-3 concerning their mass spectra if the measurements were carried out using a protein concentration of 0.05–0.1 mg/ml. If the concentration of the protein increased to 0.8–1.0 mg/ml as for SP-B-3, the molar masses were consistent with dimeric and oligomeric forms of SP-B-3 (Bünger et al., 2001). Additionally, the HPLC chromatogram of SP-B-1 showed two peaks corresponding to the dimeric and oligomeric forms of protein, whereas only one peak corresponding to the oligomeric form of SP-B-2 and SP-B-3 was found (unpublished).
The differences between the theoretical molecular mass of ovine SP-B (17380) and the average masses of the major forms of SP-B-1 (17558), SP-B-2 (17424), and SP-B-3 (17423) are shown in Table 2. They are consistent with possible protein modification by the solvents (Taneva et al., 1998), i.e., butanol in the case of SP-B-1 and methanol in the case of SP-B-2 and SP-B-3.
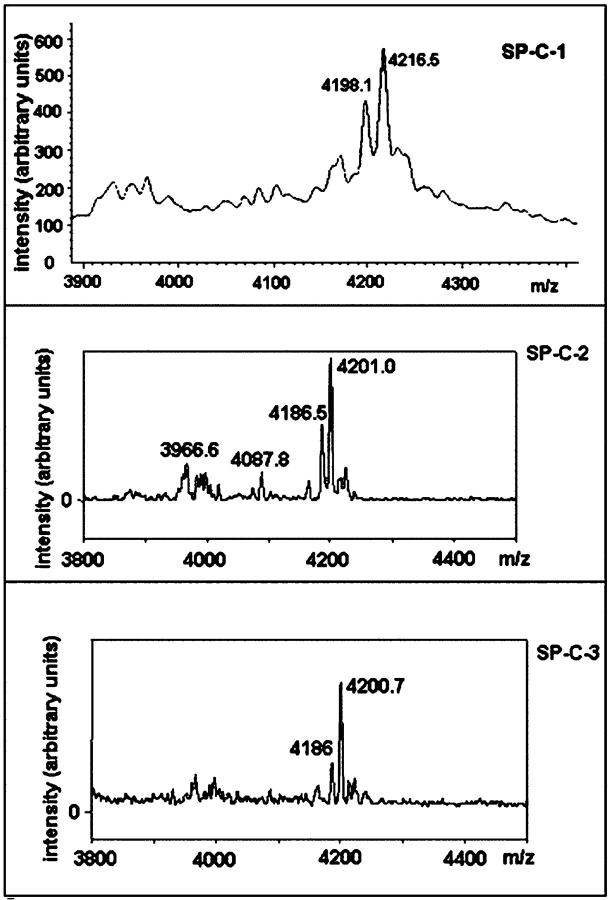
Common mass spectra were obtained for SP-C samples (Fig. 2). The SP-C-1 showed a main component with an [M + H]+ ion at m/z 4217; SP-C-2 and SP-C-3, however, showed a main component with an [M + H]+ ion at m/z 4201, indicating that monomeric SP-C is predominantly dipalmitoylated (Table 2). The difference between the theoretical molecular mass of ovine SP-C (4201) and the average masses of the major forms of SP-C-1 (4217) is consistent with possible protein modification by the solvent used for the second step of the isolation procedure (methanol) or by oxidation of Met33 (Griffiths et al., 1998).
FIGURE 2.
Molecular masses of the three SP-C samples determined using MALDI-TOF-MS.
Circular dichroism measurements
CD spectra of proteins were measured on one, two, three, and four quartz plates respectively, to monitor the changes of CD signal. The proportional increase of CD signal with increasing numbers of plates convincingly demonstrates that the sample preparation procedure was appropriate for performing the CD spectra.
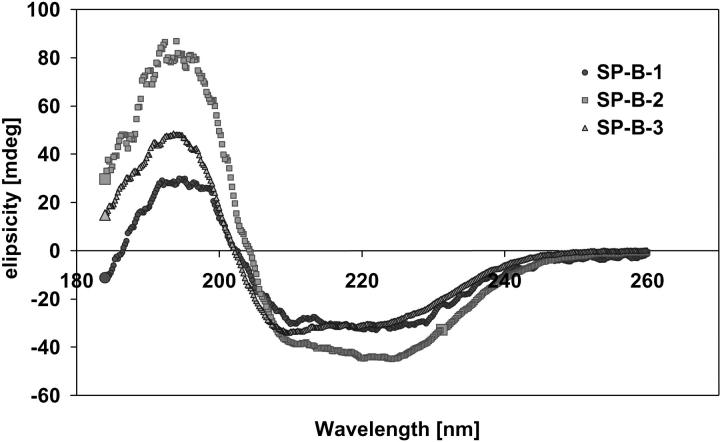
The far UV CD spectra of the three SP-B samples are displayed in Fig. 3. The spectra of all samples were quite similar and showed the shape and all typical special features of a mainly α-helical secondary structure: negative ellipticity bands near 222 nm and 208 nm, and a positive band at 192 nm. The minimum in ellipticity near 222 nm of SP-B-1 was of the same size as the minimum near 208 nm. The minimum in ellipticity near 222 nm of SP-B-2 was slightly deeper than the minimum near 208 nm, and SP-B-3 showed its deepest minimum near 208 nm. The SP-B-3 maximum near 192 nm was much higher compared with values for SP-B-1 and SP-B-2. Considering the position of minima and maxima in ellipticity of the spectra for all three SP-B samples, we assume that the main conformation of all three proteins is α-helix.
FIGURE 3.
Far UV CD spectra of the three SP-B samples: SP-B-1 (closed circles) was obtained from butanol extracts; SP-B-2 (squares) and SP-B-3 (triangles) were obtained from chloroform/methanol extracts. The shape of the spectra for all SP-B samples was typical for the main conformation of α-helix.
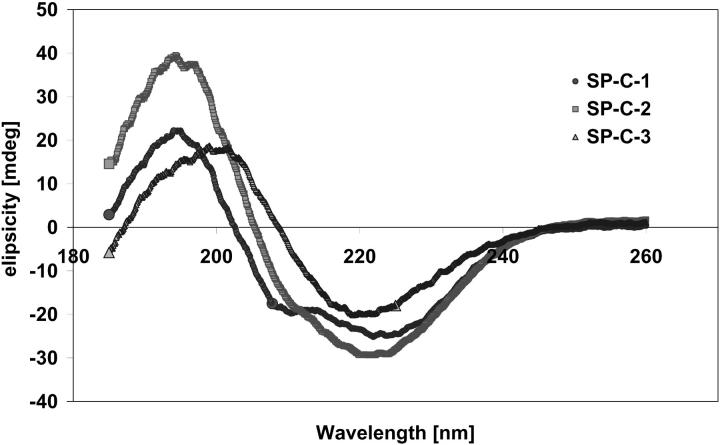
The far UV CD spectra of the three SP-C samples are shown in Fig. 4. The spectra obtained for SP-C-1 and SP-C-2 displayed characteristic features for α-helical secondary structure. The minimum in ellipticity near 222 nm in the CD spectra of both SP-C-1 and SP-C-2 was deeper than the minimum near 208 nm. The maximum near 192 nm in the spectrum of SP-C-2 was much higher compared with values for SP-C-1. The shape and position of SP-C-2 spectrum indicated that a part of SP-C-2 may also exist in β-sheet conformation. In contrast, the spectrum of SP-C-3 displayed a negative band near 216 nm and a positive band between 195 and 200 nm, which is representative for antiparallel β-sheet secondary structure.
FIGURE 4.
Far UV CD spectra of the three SP-C samples: SP-C-1 (closed circles) was obtained from butanol extracts; SP-C-2 (squares) and SP-C-3 (triangles) were obtained from chloroform/methanol extracts. The shape of the spectra for all SP-C-1 and SP-C-2 samples was typical for the main conformation of α-helix; the shape of the SP-C-3 spectrum was typical for antiparallel β-sheet secondary structure.
FTIR measurements
To correlate the CD results with the infrared spectroscopy we collected FTIR spectra of all protein samples. The spectra of the SP-B samples (data not shown) were characterized by the presence of an amide-I band component centered at 1656 cm−1, accompanied by some contributions at lower wavenumber. Amide-I bands centered ∼1650–1658 cm−1 are generally considered to be characteristic of α-helices (Pelton and McLean, 2000). The position of the amide-I band at 1656 cm−1 thus confirmed the expected α-helical structure for all three SP-B samples. These data are in good agreement with CD results.
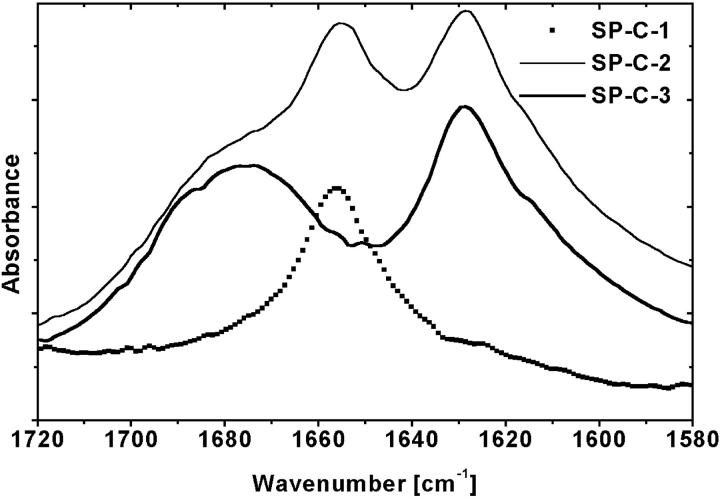
The FTIR spectra of the three SP-C samples are displayed in Fig. 5. The spectrum obtained for SP-C-1 was characterized by the presence of an amide-I band component centered at 1656 cm−1, a characteristic amide-I band component for α-helical conformation without any contributions of β-sheet conformation. The spectrum of SP-C-2 shows the bands at 1628 cm−1 and 1656 cm−1, and a clear shoulder at 1676 cm−1. A strong band between 1612 and 1640 cm−1 and a weaker one between 1670 and 1690 cm−1 are commonly observed for β-sheets. These data confirm that the SP-C-2 sample consists of a mixture of two protein conformations: α-helix and β-sheet. Compared to SP-C-1, SP-C-3 sample shows a completely different FTIR spectrum. The spectrum of SP-C-3 lacked any α-helical characteristics and, instead, show the amide-I band components at 1628 cm−1 and at 1676 cm−1. These bands correspond to antiparallel β-sheet conformation of protein and, thus, reinforce the conclusions from examination of the CD spectrum.
FIGURE 5.
FTIR spectra of the three SP-C samples: SP-C-1 (points) was obtained from butanol extracts; SP-C-2 (thin line) and SP-C-3 (thick line) were obtained from chloroform/methanol extracts. Protein chloroform/methanol solutions (80 μg of protein) were spread onto a KBr plate.
Monolayers of surfactant proteins SP-B and SP-C
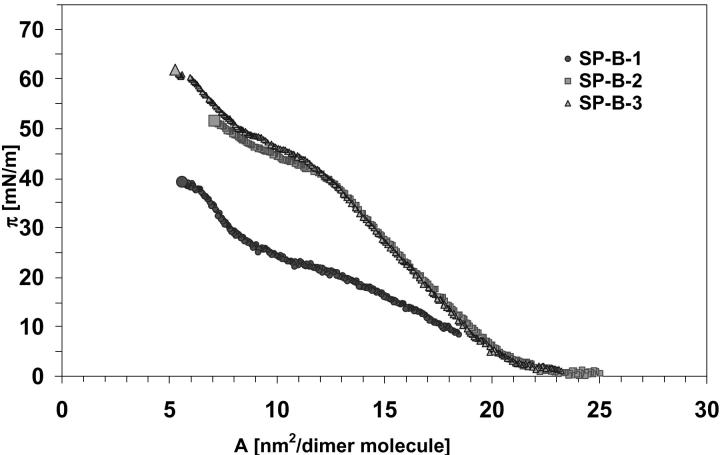
The π-A isotherms for monolayer compression of the three SP-B samples are given in Fig. 6. The surface pressure started to increase at a surface coverage of 23 nm2/molecule. This particular point, the so-called liftoff point, was similar for all investigated SP-B samples. The isotherm for SP-B-1 had one plateau region between 20 and 25 mN/m. In contrast, the SP-B-2 isotherm had a plateau region at a much higher surface pressure, i.e., 42 to 46 mN/m, whereas SP-B-3 had a corresponding plateau at 44 to 50 mN/m. The starting point of plateaus for all SP-B samples corresponds to a critical area of 12.5–12.8 nm2 per molecule. Molecular cross sections were almost identical for all three SP-B samples, i.e., ∼6 nm2/molecule or 0.038 nm2/amino acid respectively.
FIGURE 6.
The π-A isotherms for monolayer compression of the three SP-B samples: SP-B-1 (closed circles) was obtained from butanol extracts; SP-B-2 (squares) and SP-B-3 (triangles) were obtained from chloroform/methanol extracts.
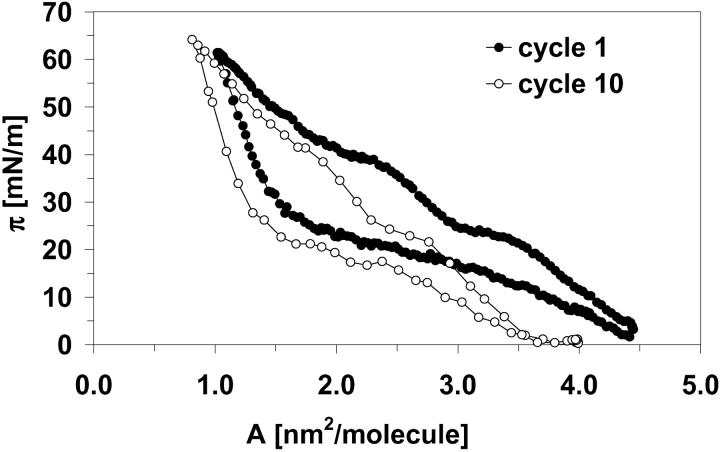
The minimal area demands on molecule cross sections for all proteins were determined using dynamic cycling experiments. An example of the first and the tenth compression/dilatation cycle for monolayer of one of SP-C samples is given in Fig. 7.
FIGURE 7.
The first (closed symbols) and the tenth (open symbols) compression/dilatation cycle for monolayer of SP-C-2. The compression of the monolayer to molecular areas smaller than the minimal area demand per molecule yield a gradual shift of the whole isotherm to the left.
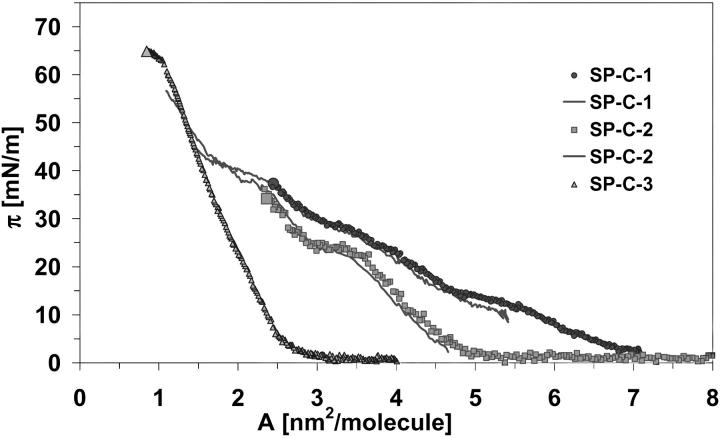
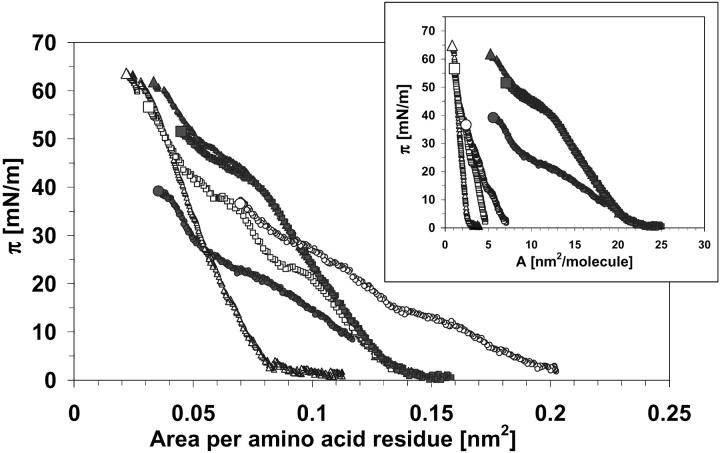
The π-A isotherms for monolayer compression of SP-C samples are shown in Fig. 8. The SP-C-1 and SP-C-2 isotherms consist of two separate curves (points and line) taken from two experiments, one of which was carried out in the lower surface pressure region and the other in the upper region. The surface pressure for each of the three SP-C samples lifted off at different molecular areas, which are given in Table 1. The SP-C-1 isotherm had at least three plateau regions, the first plateau at π∼15 mN/m, the second at π∼30 mN/m, and a third at π∼37–43 mN/m. Furthermore, there was a slightly pronounced inflection point at 25 mN/m. The SP-C-2 isotherm had a distinct plateau at 22–25 mN/m and a plateau at π∼37–43 mN/m. Both plateaus of the SP-C-2 isotherm had the appropriated pendant in the SP-C-1 curves. The isotherm of SP-C-3 had an absolutely unusual shape. The surface pressure increased very quickly during compression to ∼60 mN/m after collapse of the monolayer. The starting points of plateaus are given in Table 1. The starting point of the last SP-C-1 and SP-C-2 plateau is a critical area of 2.3–2.4 nm2 per molecule. The molecule cross sections of SP-C-1 and SP-C-2 were similar, ∼1.15 nm2/molecule or 0.034 nm2/amino acid. The molecule cross section of SP-C3 was different: 1.05 nm2/molecule or 0.03 nm2/amino acid. Fig. 9 represents the π-A isotherms for monolayers of all proteins recalculated for area per one amino acid residue of each protein. The parameters which characterize surface behavior and which were drawn from the isotherms of SP-B and SP-C samples are summarized in Table 1.
FIGURE 8.
The π-A isotherms for monolayer compression of the three SP-C samples: SP-C-1 (closed circles) was obtained from butanol extracts; SP-C-2 (squares) and SP-C-3 (triangles) were obtained from chloroform/methanol extracts. The SP-C-1 and SP-C-2 isotherms consist of two separate curves (points and line) taken from two experiments.
FIGURE 9.
The π-A isotherms for monolayers of all proteins recalculated for area per one amino acid residue of each protein: SP-B-1 (closed circles) and SP-C-1 (open circles) were obtained from butanol extracts; SP-B-2 (closed squares), SP-C-2 (open squares), SP-B-3 (closed triangles), and SP-C-3 (open triangles) were obtained from chloroform/methanol extracts. For better comparison, the conventional π-A isotherms (inset) are shown.
DISCUSSION
In the present study we evaluate the conformation of native hydrophobic surfactant proteins SP-B and SP-C isolated from sheep lung washings by either butanol or chloroform/methanol lipid extraction using gel exclusion or high performance liquid chromatography. SDS gel electrophoresis data and the structural data obtained from CD and FTIR spectroscopy are compared with the interfacial behavior of the pure proteins.
From examination of SDS gel electrophoresis data under nonreducing conditions it appears that the SP-B-1 sample extracted using butanol had a higher molecular weight than porcine SP-B (Fig. 1 A), but a lower molecular weight than SP-B-2 and SP-B-3 samples extracted in chloroform/methanol. These data suggest that the SP-B-1 sample consists mostly of dimers and probably trimers, whereas the SP-B-2 and SP-B-3 samples are mostly trimers. The existence of dimer/oligomer mixture in the SP-B-1 sample was additionally confirmed by the appearance of two peaks in HPLC chromatograms. By contrast, the chromatograms of the other samples showed only one peak. Therefore, it was concluded that the use of butanol instead of chloroform/methanol may decrease the oligomerization of SP-B.
The appearance of SP-B trimers in our preparation is consistent with a report by Baatz et al. (2001), who described trimers of SP-B in bovine lung surfactant. Oligomerization of modified human SP-B (Cys48Ser) expressed in transgenic mice was studied by Zaltash et al. (2001), who found more noncovalent dimers of SP-B (Cys48Ser) if the polarity of the solvent was decreased and/or if the concentration of SP-B increased. In chloroform/methanol solutions multimeric forms of the protein were observed as well. These results are in full agreement with our own observations that changes in the protein purification procedure, such as protein/lipid concentration and/or solvent polarity, obviously change the oligomerization state of protein. The oligomerization state of SP-B might be important for in vivo function as suggested by Beck et al. (2000).
The secondary structure of SP-B and SP-C was evaluated using CD and FTIR spectra. The CD and FTIR spectra of all three SP-B samples were consistent with the secondary structure of α-helix, as were the CD and FTIR spectra of SP-C-1. The CD spectrum and FTIR data of SP-C-2 showed that this sample consists of a mixture of two protein conformations: α-helix and β-sheet. In contrast, the CD and FTIR spectra of SP-C-3 strongly corresponded to secondary structure of antiparallel β-sheet.
Comparing the purification protocols of SP-C-1 and SP-C-2, we assumed that the α-/β-conversion of protein could be caused either by utilization of chloroform/methanol instead of butanol in the extraction step or by the utilization of HPLC instead of gel exclusion chromatography. Comparing the purification protocols of SP-C-2 and SP-C-3, it is essential to note that the both chloroform/methanol extracted SP-C samples differed only in their protein/lipid concentration after extraction (Table 1); all other parameters of the isolation procedure were identical. We concluded that the formation of β-sheets in SP-C-3 sample occurred after resolving of protein/lipid extracts in an extremely small amount of solvent but before the separation of proteins from lipids. This β-sheet formation probably took place by exceeding the summary critical micelle concentration of the protein/lipid mixture in the organic solvent, and not as a result of separation.
The phospholipid concentration of the SP-C-2 containing extracts was 70 mg/ml (0.1 M, considering all lipids as DPPC) and the total protein concentrations was 1.5 mg/ml. The lipid concentration of SP-C-3 containing extract, however, was 330 mg/ml (0.45 M, considering all lipids as DPPC) and the total protein concentration was 6 mg/ml. For example, the critical micelle concentration of DPPC in methanol is 1 × 10⁻² M (Smith and Tanford, 1972). It was also found (Datta et al., 1992) that DPPC exists as reverse micelles in chloroform solutions at concentrations beyond 6 × 10⁻³ M. This means that the driving force of α-/β-conversion was definitively the extremely high concentration of protein/lipid extracts of the SP-C-3 sample.
Our assumption that the protein/lipid concentration influences the secondary structure of SP-C is supported by several other studies. Blondelle and co-workers (Blondelle et al., 1997) used different concentrations of monomeric sodium dodecyl sulfate (SDS) to mimic a lipid environment and analyzed the secondary structure of a polyalanine-based peptide. They found 87% β-sheet conformation of the polyalanine-based peptide in 2 mM SDS, but 80% α-helical structure elements in 10 mM micellar SDS. In addition, authors (Osman et al., 1994) reported that pure protein—surfactin—forms α-helical and β-sheet structures below and above the critical micelle concentration, respectively. Furthermore, transformation of pure SP-C in organic solution from α-helix into β-sheet was reported after 1 week incubation at a protein concentration of 4.6 mg/ml (Szyperski et al., 1998; Gustafsson et al., 1999). Such a concentration of SP-C in solution is comparable with the concentration we used for isolation of SP-C-3 (6 mg/ml). Taken together, the current observations reveal the possible common mechanism at work to convert the α-helical to β-sheet structure of native SP-C.
Another objective of this paper was to compare the interfacial behavior of SP-B and SP-C and to determine the molecule cross sections by measuring their surface pressure-area isotherms. There are only a few reliable π-A-isotherms reported for pure SP-B and SP-C monolayers (Dieudonne et al., 2001; Taneva et al., 1998). The surface behavior of SP-B and SP-C obviously strongly depends on such structural properties as oligomerization and secondary structure.
All of the three SP-B isotherms showed identical liftoff points indicating very similar folding states of the proteins when the surface pressure started to increase. The surface pressure liftoff occurred at a residual area of ∼0.15 nm2/residue (23–24 nm2/dimer molecule) and was in the range of 0.16 nm2/residue found for poly-L-alanine (molecular weight 18800) (Lavigne et al., 1998) and of 40–60 nm2/dimer molecule reported for β-lactoglobulin (molecular weight 35000) (Sanchez-Gonzalez et al., 2001). Plateaus of the three SP-B isotherms differed from each other probably due to differences in oligomerization state. Whereas the first plateau detected in our experiments for SP-B-1 (mostly dimer) was in the range of 20–25 mN/m, the corresponding plateau for SP-B-2 and SP-B-3 (∼30% dimer) appeared at 40–50 mN/m. Taneva et al. reported π-A-isotherms for porcine SP-B prepared by a different protein isolation procedure, but only up to a surface pressure of 40 mN/m (Taneva and Keough, 1995; Taneva et al., 1998). Beside the similarities in shape and plateau regions between their SP-B isotherms and ours, one major difference exists. Our liftoff points were identical for all three SP-B samples but shifted to lower surface coverage in comparison to those found for porcine SP-B. This difference may be related to different protein folding, probably due to amino acid sequence variation related to species. The major variation between the SP-B sequence from pig and sheep is located between amino acids 50 and 72 (Haagsmann and Diemel, 2001). This difference may be also caused by endogenous lipids which remained associated with the porcine protein (Taneva et al., 1998).
Although surface behavior of our three SP-B samples was quite similar, the isotherms obtained with SP-C samples differ substantially. The significantly lower liftoff point of SP-C-3 indicated that the surface pressure for protein in β-sheet conformation started to increase at a smaller area per molecule than that for SP-C-1 in α-helical conformation. It is not surprising that the liftoff point of the SP-C-2 sample, consisting of a mixture of α-helix and β-sheet conformations, was located between the liftoff points of SP-C-1 and SP-C-3. The first plateau and inflection points detected in our experiments with SP-C-1 might be related to some surface rearrangements of N-terminal amino acids and the palmitoyl groups, forming a polar headgroup-like structure. The last plateau of the SP-C-1 and SP-C-2 isotherms at a surface pressure of 37–43 mN/m can be interpreted as a phase transition of the protein (Deleu et al., 1999). The compressibility of the SP-C in β-sheet conformation is extremely low, indicated by the steep slope of the π-A-isotherm of SP-C-3. This result is consistent with measurements of π-A-isotherms of two sequential amphiphilic peptide isomers described by others (Maget-Dana et al., 1999). Indeed, these authors reported that β-sheet peptide monolayers were more stable and less compressible than monolayers formed by α-helical isomers. Lower compressibility of β-sheets compared with helical and loop regions of proteins were also found in denaturation experiments using high pressure (Akasaka et al., 1999). The liftoff points, the shape, and the plateau regions of the isotherms determined for α-helical SP-C-1 and α-/β-mixtured SP-C-2 were identical with those found for pig proteins (Taneva et al., 1998). In our study we have shown that the secondary structure of SP-C is crucial for its behavior: to reach a surface pressure of 45 mN/m, SP-C-1 was compressed from 7.2 to 1.5 nm2/molecule, SP-C-2 from 5.2 to 1.5 nm2/molecule, and SP-C-3 from 3.2 to 1.5 nm2/molecule. These findings correspond to compression ratios of 4.8, 3.5, and 2.0, respectively. This means that SP-C-3, the protein with β-sheet conformation, requires only a small compression ratio to produce very high surface pressure in the protein containing monolayers. Therefore, care is necessary if the surface activity of identical proteins from different preparations and/or species are compared without knowing their conformation.
The molecule cross section of all three SP-B samples was 6 nm2/dimer molecule, i.e., 3 nm2/monomer. Therefore, we suggest that the molecule of SP-B consists of four α-helices oriented vertically to the interface plane in a highly compressed monolayer. The cross section of one α-helix is 0.75 nm2, assuming the average helical diameter of 0.96 nm. This value is exactly equal to the value calculated as average distance of closest approach for 45 transmembrane helices (Bowie, 1997).
The molecule cross section of SP-C-1 in α-helical conformation was 1.15 nm2/molecule. The molecule of SP-C consists of two palmitoyl groups tightly closed to the α-helix oriented vertically to the interface plane in a highly compressed monolayer. The cross section of two palmitoyl groups is ∼0.4 nm2, yielding a cross section for the apolar α-helix of ∼0.75 nm2. This size corresponds to the size of a single α-helix as deduced above for SP-B and reported for transmembrane helices (Bowie, 1997).
Finally, from the results described in this paper, we would like to comment on the biological consequences of extensive alpha-to-beta transformation in SP-C. Several human diseases of different etiology are characterized by the extracellular deposition of amyloidlike fibrils, a process that is initiated by the transition of α-helices into β-sheets of amyloid-forming proteins (Guijarro et al., 1998; Baskakov et al., 2001). Our results suggest that α-helix to β-sheet transition could originate as a simple consequence of increase of the summary protein/lipid concentration in the alveolar or cellular environment, similar to the α-helix → β-sheet conversion occurring in the SP-C-3 sample. The mechanism may be common in the development of several human diseases of different etiology characterized by the extracellular deposition of amyloid (Soto, 1999) and may influence lung diseases such as alveolar proteinosis, acute respiratory distress syndrome, and lung fibrosis.
Acknowledgments
The authors are grateful to L. Kaufner and H. Bünger for protein isolation and determination of protein concentration; G. Brezesinski for technical support at the CD experiments; U. Bentrup for kind assistance with the FTIR experiments; and I. Plasencia and A. Prieto, for technical support with PAGE and mass spectrometry analyses.
Financial support by the Deutsche Forschungsgemeinschaft (Grant Pi 165/7) and Spanish Direccion General de Investigacion Cientifica y Tecnica (BIO2000-0929) is gratefully acknowledged.
References
- Akasaka, K., H. Li, H. Yamada, R. Li, T. Thoresen, and C. K. Woodward. 1999. Pressure response of protein backbone structure. Pressure-induced amide 15N chemical shifts in BPTI. Protein Sci. 8:1946–1953. [DOI] [PMC free article] [PubMed] [Google Scholar]
- Baatz, J. E., K. L. Smyth, J. A. Whitsett, C. Baxter, and D. R. Absolom. 1992. Structure and functions of a dimeric form of surfactant protein SP-C: a Fourier transform infrared and surfactometry study. Chem. Phys. Lipids. 63:91–104. [DOI] [PubMed] [Google Scholar]
- Baatz, J. E., Y. Zou, J. T. Cox, Z. Wang, and R. H. Notter. 2001. High-yield purification of lung surfactant proteins SP-B and SP-C and the effects on surface activity. Protein Expr. Purif. 23:180–190. [DOI] [PubMed] [Google Scholar]
- Baskakov, I. V., G. Legname, S. B. Prusiner, and F. E. Cohen. 2001. Folding of prion protein to its native α-helical conformation is under kinetic control. J. Biol. Chem. 276:19687–19690. [DOI] [PubMed] [Google Scholar]
- Beck, D. C., M. Ikegami, C.-L. Na, S. Zaltash, J. Johansson, J. A. Whitsett, and T. E. Weaver. 2000. The role of homodimers in surfactant protein B function in vivo. J. Biol. Chem. 275:3365–3370. [DOI] [PubMed] [Google Scholar]
- Blondelle, S. E., B. Forood, R. A. Houghten, and E. Perez-Paya. 1997. Secondary structure induction in aqueous versus membrane-like environments. Biopolymers. 42:489–498. [DOI] [PubMed] [Google Scholar]
- Bowie, J. U. 1997. Helix packing in membrane proteins. J. Mol. Biol. 272:780–789. [DOI] [PubMed] [Google Scholar]
- Bünger, H., L. Kaufner, and U. Pison. 2000. Quantitative analysis of hydrophobic pulmonary surfactant proteins by high-performance liquid chromatography with light-scattering detection. J. Chromatogr. A. 870:363–369. [DOI] [PubMed] [Google Scholar]
- Bünger, H., R. P. Krüger, S. Pietschmann, N. Wüstneck, L. Kaufner, R. Tschiersch, and U. Pison. 2001. Two hydrophobic protein fractions of ovine pulmonary surfactant: isolation, characterization, and biophysical activity. Protein Expr. Purif. 23:319–327. [DOI] [PubMed] [Google Scholar]
- Creuwels, L. A. J. M., R. A. Demel, L. M. G. van Golde, and H. P. Haagsmann. 1995. Characterisation of the dimeric canine form of surfactant protein C (SP-C). Biochim. Biophys. Acta. 1254:326–332. [DOI] [PubMed] [Google Scholar]
- Crouch, E., and J. R. Wright. 2001. Surfactant proteins A and D and pulmonary host defence. Annu. Rev. Physiol. 63:521–554. [DOI] [PubMed] [Google Scholar]
- Cruz, A., C. Casals, and J. Perez-Gil. 1995. Conformational flexibility of pulmonary surfactant proteins SP-B and SP-C, studied in aqueous organic solvents. Biochim. Biophys. Acta. 1255:68–76. [DOI] [PubMed] [Google Scholar]
- Datta, G., P. S. Parvathanathan, U. R. Rao, and K. U. Deniz. 1992. Reverse micelles of dipalmitoyl phosphatidyl choline in chloroform and their interactions with dapsone. Physiol. Chem. Phys. Med. NMR. 24:51–61. [PubMed] [Google Scholar]
- Deleu, M., M. Paquot, P. Jacques, P. Thonart, Y. Adriaensen, and Y. F. Dufrene. 1999. Nanometer scale organization of mixed surfactin/phosphatidylcholine monolayers. Biophys. J. 77:2304–2310. [DOI] [PMC free article] [PubMed] [Google Scholar]
- Dieudonne, D., R. Mendelsohn, R. S. Farid, and C. R. Flach. 2001. Secondary structure in lung surfactant SP-B peptides: IR and CD studies of bulk and monolayer phases. Biochim. Biophys. Acta. 1511:99–112. [DOI] [PubMed] [Google Scholar]
- Dobson, C. M., A. Sali, and M. Karplus. 1998. Protein folding: a perspective from theory and experiment. Angew. Chem. Int. Ed. 37(7):868–893 [DOI] [PubMed] [Google Scholar]
- Folch, J., M. Lees, and G. H. S. Stanley. 1957. A simple method for the isolation and purification of total lipides from animal tissues. J. Biol. Chem. 226:497–509. [PubMed] [Google Scholar]
- Griffiths, W. J., M. Gustafsson, Y. Yang, T. Curstedt, J. Sjovall, and J. Johansson. 1998. Analysis of variant forms of porcine surfactant polypeptide-C by nano-electrospray mass spectrometry. Rapid Commun. Mass Spectrom. 12:1104–1114. [DOI] [PubMed] [Google Scholar]
- Guijarro, J. I., M. T. Sunde, J. A. Jones, I. D. Campbell, and C. R. M. Dobson. 1998. Amyloid fibril formation by an SH3 domain. Proc. Natl. Acad. Sci. USA. 95:4224–4228. [DOI] [PMC free article] [PubMed] [Google Scholar]
- Gustafsson, M., J. Thyberg, J. Näslung, E. Eliasson, and J. Johansson. 1999. Amyloid fibril formation by pulmonary surfactant protein C. FEBS Lett. 464:138–142. [DOI] [PubMed] [Google Scholar]
- Gustafsson, M., W. J. Griffiths, E. Furusjö, and J. Johansson. 2001. The palmitoyl groups of lung surfactant protein C reduce unfolding into a fibrillogenic intermediate. J. Mol. Biol. 310:937–950. [DOI] [PubMed] [Google Scholar]
- Haagsmann, H. P., and R. V. Diemel. 2001. Surfactant-associated proteins: functions and structural variations. Comp. Biochem. Physiol. A. Mol. Integr. Physiol. 129:91–108. [DOI] [PubMed] [Google Scholar]
- Hawgood, S., B. J. Benson, and R. L. Hamilton, Jr. 1985. Effects of a surfactant-associated protein and calcium ions on the structure and surface activity of lung surfactant lipids. Biochemistry. 24:184–190. [DOI] [PubMed] [Google Scholar]
- Hawgood, S., M. Derrick, and F. Poulain. 1998. Structure and properties of surfactant protein B. Biochim. Biophys. Acta. 1408:150–160. [DOI] [PubMed] [Google Scholar]
- Heremans, K., and L. Smeller. 1998. Protein structure and dynamics at high pressure. Biochim. Biophys. Acta. 1386:353–370. [DOI] [PubMed] [Google Scholar]
- Johansson, J., T. Szyperski, T. Curstedt, and K. Wutrich. 1994. The NMR structure of the pulmonary surfactant-associated polypeptide Sp-C in an apolar solvent contains a valyl-rich alpha-helix. Biochemistry. 33:6015–6023. [DOI] [PubMed] [Google Scholar]
- Johansson, J. 1998. Structure and properties of surfactant protein C. Biochim. Biophys. Acta. 1408:161–172. [DOI] [PubMed] [Google Scholar]
- Kallberg, Y., M. Gustafsson, B. Persson, J. Thyberg, and J. Johansson. 2001. Prediction of amyloid fibril-forming proteins. J. Biol. Chem. 276:12945–12950. [DOI] [PubMed] [Google Scholar]
- Lavigne, P., P. Tancrede, and F. Lamarche. 1998. The monolayer technique as a tool to study the energetics of protein-protein interactions. Biochim. Biophys. Acta. 1382:249–256. [DOI] [PubMed] [Google Scholar]
- Lohner, K., A. Latal, R. I. Lehrer, and T. Ganz. 1997. Differential scanning microcalorimetry indicates that human defensin, HNP-2, interacts specifically with biomembrane mimetic systems. Biochemistry. 36:1525–1531. [DOI] [PubMed] [Google Scholar]
- Maget-Dana, R., D. Lelièvre, and A. Brack. 1999. Surface active properties of amphiphilic sequential isopeptides: comparison between α-helical and β-sheet conformations. Biopolymers. 49:415–423. [DOI] [PubMed] [Google Scholar]
- Nogee, L. M. 1998. Genetics of the hydrophobic surfactant proteins. Biochim. Biophys. Acta. 1408:323–333. [DOI] [PubMed] [Google Scholar]
- Osman, M., Y. Ishigami, K. Ishikawa, Y. Ishizuka, and H. Holmsen. 1994. Dynamic transition of alpha-helix to beta-sheet structure in linear surfactin correlating to critical micelle concentration. Biotechnol. Lett. 16:913–918. [Google Scholar]
- Oviedo, J. M., F. Valiño, I. Plasencia, A. G. Serrano, C. Casals, and J. Perez-Gil. 2001. Quantitation of pulmonary surfactant protein SP-B in the absence or presence of phospholipids by enzyme-linked immunosorbent assay. Anal. Biochem. 293:78–87. [DOI] [PubMed] [Google Scholar]
- Pelton, J. T., and L. R. McLean. 2000. Spectroscopic methods for analysis of protein secondary structure. Anal. Biochem. 277:167–176. [DOI] [PubMed] [Google Scholar]
- Pérez-Gil, J., and K. M. W. Keough. 1998. Interfacial properties of surfactant proteins. Biochim. Biophys. Acta. 1408:203–217. [DOI] [PubMed] [Google Scholar]
- Pison, U., E. K. Tam, G. H. Caughey, and S. Hawgood. 1989. Proteolytic inactivation of dog lung surfactant-associated proteins by neutrophil elastase. Biochim. Biophys. Acta. 992:251–257. [DOI] [PubMed] [Google Scholar]
- Plasencia, I., A. Cruz, J. L. Lopez-Lacomba, C. Casals, and J. Perez-Gil. 2001. Selective labeling of pulmonary surfactant protein SP-C in organic solution. Anal. Biochem. 296:49–56. [DOI] [PubMed] [Google Scholar]
- Prokop, R. M., A. Jyoti, M. Eslamian, A. Garg, M. Mihaila, O. I. del Río, S. S. Susnar, Z. Policova, and A. W. Neumann. 1998. A study of captive bubbles with axisymmetric drop shape analysis. Colloids Surf. A. 131:231–247. [Google Scholar]
- Sanchez-Gonzalez, J., M. A. Cabrerizo-Výlchez, and M. J. Galvez-Ruiz. 2001. Interactions, desorption and mixing thermodynamics in mixed monolayers of beta-lactoglobulin and bovine serum albumin. Colloids Surf. B. 21:19–27. [DOI] [PubMed] [Google Scholar]
- Smith, R., and C. Tanford. 1972. The critical micelle concentration of L-dipalmitoylphosphatidyl choline in water and water-methanol solutions. J. Mol. Biol. 67:75–83. [DOI] [PubMed] [Google Scholar]
- Soto, C. 1999. Plaque busters: strategies to inhibit amyloid formation in Alzheimer's disease. Mol. Med. Today. 5:343–350. [DOI] [PubMed] [Google Scholar]
- Szyperski, T., G. Vandenbussche, T. Curstedt, J. M. Ruysschaert, K. Wüthrich, and J. Johansson. 1998. Pulmonary surfactant-associated polypeptide C in a mixed organic solvent transforms from a monomeric α-helical state into insoluble β-sheet aggregates. Protein Sci. 7:2533–2540. [DOI] [PMC free article] [PubMed] [Google Scholar]
- Taneva, S. G., and K. M. W. Keough. 1995. Calcium ions and interactions of pulmonary surfactant proteins SP-B and SP-C with phospholipids in spread monolayers at the air/water interface. Biochim. Biophys. Acta. 1236:185–195. [DOI] [PubMed] [Google Scholar]
- Taneva, S. G., J. Stewart, L. Taylor, and K. M. W. Keough. 1998. Method of purification affects some interfacial properties of pulmonary surfactant proteins B and C and their mixtures with dipalmitoylphosphatidylcholine. Biochim. Biophys. Acta. 1370:138–150. [DOI] [PubMed] [Google Scholar]
- Weaver, T. E. 1998. Synthesis, processing and secretion of surfactant proteins B and C. Biochim. Biophys. Acta. 1408:173–179. [DOI] [PubMed] [Google Scholar]
- Wüstneck, R. 1988. Kolloidchemische Charakterisierung des Systems Tensid/Gelatine. Dissertation B. Academy of Sciences, Berlin, Germany.
- Wüstneck, R., N. Wüstneck, D. Vollhardt, R. Miller, and U. Pison. 1999. The influence of spreading solvent traces in the atmosphere on surface tension measurements by using a microfilm balance and the captive bubble method. Mater. Sci. Eng. C. 8–9:57–64. [Google Scholar]
- Wüstneck, N., R. Wüstneck, V. B. Fainerman, U. Pison, and R. Miller. 2000. Investigation of over-compressed spread dipalmitoyl phosphatidylcholine films and the influence of solvent vapour in the gas phase on p-A isotherms measured by using the captive bubble technique. Colloids Surf. A. 164:267–278. [Google Scholar]
- Yang, L., T. M. Weiss, R. I. Lehrer, and H. W. Huang. 2000. Crystallization of antimicrobial pores in membranes: magainin and protegrin. Biophys. J. 79:2002–2009. [DOI] [PMC free article] [PubMed] [Google Scholar]
- Zaltash, S., W. J. Griffiths, D. Beck, C. Duan, T. E. Weaver, and J. Johansson. 2001. Membrane activity of (Cys48Ser) lung surfactant protein B increases with dimerisation. Biol. Chem. 382:933–939. [DOI] [PubMed] [Google Scholar]


