Abstract
Saposin C (Sap C) is a small glycoprotein required for hydrolysis of glucosylceramidase in lysosomes. The full activity of glucosylceramidase requires the presence of both Sap C and acidic phospholipids. Interaction between Sap C and acidic phospholipid-containing membranes, a crucial step for enzyme activation, is not fully understood. In this study, the dynamic process of Sap C interaction with acidic phospholipid-containing membranes was investigated in aqueous buffer using atomic force microscopy. Sap C induced two types of membrane restructuring: formation of patch-like structural domains and the occurrence of membrane destabilization. The former caused thickness increase whereas the latter caused thickness reduction in the gel-phase membrane bilayer, possibly as a result of lipid loss or an interdigitating process. Patch-like domain formation was independent of acidic phospholipids, whereas membrane destabilization is dependent on the presence and concentration of acidic phospholipids. Sap C effects on membrane restructuring were further studied using synthetic peptides. Synthetic peptides corresponding to the amphipathic α-helical domains 1 (designated “H1 peptide”) and 2 (H2 peptide) of Sap C were used. Our results indicated that H2 contributed to domain formation but not to membrane destabilization, whereas H1 induced neither type of membrane restructuring. However, H1 was able to mimic Sap C's destabilization effect in conjunction with H2, but only when H1 was present first and H2 was added afterwards. This study provides an approach to investigate the structure-function aspects of Sap C interaction with phospholipid membranes, with insights into the mechanism(s) of Sap C-membrane interaction.
INTRODUCTION
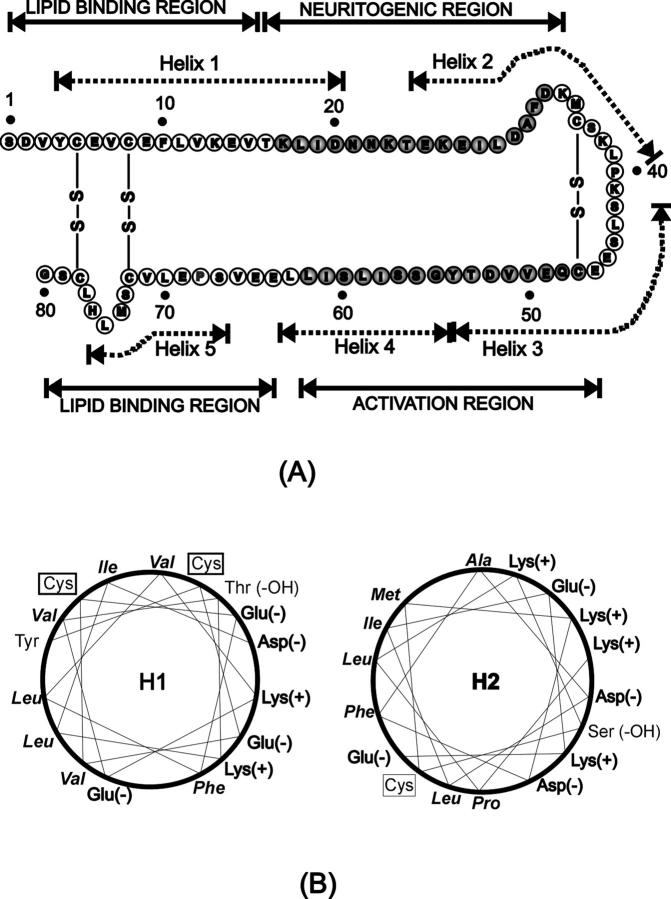
Saposin C (Sap C) is a member of the saposin family that includes Sap A, B, C, and D (Kishimoto et al., 1992; Vaccaro et al., 1999; Qi and Grabowski, 2001b; Schutte et al., 2001). These four saposins are ∼80 amino acid glycoproteins that are derived from a single precursor protein, prosaposin, by selective proteolytic cleavage (Leonova et al., 1996). The highly homologous saposins contain six conserved cysteine residues in nearly identical positions, all of which are involved in the formation of three disulfide bonds (see Fig. 1 A). These disulfide bonds render the saposins structurally compact and highly stable in heat and acidic environments (Kishimoto et al., 1992; Vaccaro et al., 1999; Qi and Grabowski, 2001b; Schutte et al., 2001). The maintenance of the disulfide bond-stabilized structure is essential for proteolytic stability and possibly other functional properties of saposins (Munford et al., 1995; Vaccaro et al., 1999).
FIGURE 1.
Schematic illustration of Sap C amino acid sequence and function. (A) The structural and functional domains are indicated by dashed and solid lines, respectively (Qi and Grabowski, 2001b). The shaded amino acid residues are critical to the indicated function. (B) Helical wheel models of Sap C's α-helical domain 1 and 2 represented by the H1 and H2 peptides. Cysteine residues are boxed, and hydrophobic residues are set in italics.
Saposins are important activators of selected enzymes that cleave sphingolipids in lysosomes (Kishimoto et al., 1992; Vaccaro et al., 1999; Qi and Grabowski, 2001b; Schutte et al., 2001). Sap C is known to stimulate the in vitro and in vivo hydrolytic activity of glucosylceramidase (GCase), the enzyme that degrades glucosylceramide to ceramide and glucose in lysosomes. Studies have shown that the full activity of GCase requires the presence of Sap C and acidic phospholipids, such as phosphatidylserine (PS) (Kishimoto et al., 1992; Vaccaro et al., 1994; Qi et al., 1996). Deficiency in either GCase or Sap C leads to variant forms of Gaucher's disease (Schnabel et al., 1991; Rafi et al., 1993). Thus, Sap C and acidic phospholipids are both needed for the in vivo physiological function of the GCase enzyme.
The activation mechanism of GCase has been studied extensively (Berent and Radin, 1981; Iyer et al., 1983; Vaccaro et al., 1999; Qi and Grabowski, 2001b). The effect of acidic phospholipids and Sap C on the enzyme activation has been related to direct interactions with the enzyme but not to direct interactions with each other or with the substrate (Berent and Radin, 1981; Iyer et al., 1983). The interaction of acidic phospholipids with GCase enhances the enzyme activity at acidic pH by inducing a conformational change in the enzyme (Grabowski and Horowitz, 1997). Subsequent addition of Sap C leads to further conformational changes in GCase and optimal hydrolytic activity (Qi and Grabowski, 1998). Recent studies indicate that Sap C stimulation of GCase activity results from changes in phospholipid membrane structure (Vaccaro et al., 1999). Sap C is thought to destabilize phospholipid membranes at acidic pH, promoting association of GCase with the acidic phospholipid (Vaccaro et al., 1995). Sap C also appears capable of inducing fusion and aggregation of acidic phospholipid vesicles at low pH (Vaccaro et al., 1994). However, the details of this interaction and the relationship to GCase are poorly understood (Ruysschaert et al., 1998; Wilkening et al., 1998; Qi and Grabowski, 2001a).
The three-dimensional structure of Sap C is unknown, which has complicated structure-function studies. On the other hand, the three-dimensional structure of NK-lysin, a protein with a high degree of sequence homology to the saposins, has been solved by nuclear magnetic resonance spectroscopy (Liepinsh et al., 1997). The structure of NK-lysin in aqueous solution comprises five amphipathic α-helices folded into a single globular domain with a hydrophobic core and a hydrophilic surface. Based on this model, it has been speculated that NK-lysin could bind to membranes by inserting into the membrane its ring of lysine and arginine residues interacting with the negatively charged lipid headgroups, and with the negatively charged portion remaining solvent-exposed. In addition, the plant-specific insert, an internal domain of plant aspartic proteinase prophytepsin, bears a high degree of sequence homology with saposins. Analysis of the crystal structure of the plant-specific insert has revealed that it is highly structurally homologous to NK-lysin (Kervinen et al., 1999). Therefore, it has been suggested that because of the high degree of sequence and structure homology shared among the saposins and saposin-like proteins, the proteins of this family most probably share a common “saposin-fold structure,” that is, a five α-helical globular structure as illustrated in Fig. 1 A for Sap C (Liepinsh et al., 1997; Kervinen et al., 1999; Qi and Grabowski, 2001a; Schutte et al., 2001). Furthermore, the saposins and saposin-like proteins may also share functional properties with regard to membrane binding and/or perturbation. NK-lysin was shown to induce membrane destabilization (Ruysschaert et al., 1998), and the recombinant plant-specific insert was able to induce leakage of phospholipid vesicles in a pH- and lipid-dependent manner (Egas et al., 2000).
Sap C binding to the membranes of acidic phospholipid-containing vesicles has been studied using gel filtration, fluorescence microscopy (including fluorescence quenching analysis), fluorescence resonance energy transfer, and various other techniques (Vaccaro et al., 1994; Vaccaro et al., 1995; Qi and Grabowski, 1998; Qi and Grabowski, 2001a). Perturbation of the membrane of PS vesicles, at lower pH, was demonstrated by the Sap C-induced release of entrapped calcein (Vaccaro et al., 1994; Vaccaro et al., 1995). The secondary structures of Sap C, in the absence of and bound to phospholipid vesicles, have been estimated from circular dichroism spectra (Qi and Grabowski, 1998). Finally, negative-staining electron microscopy has been used to monitor the size increase in PS-containing vesicles during Sap C-induced membrane fusion (Vaccaro et al., 1994). These studies have contributed to a better understanding of Sap C-membrane interaction.
In the present study, the dynamic process of Sap C interaction with PS-containing phospholipid membranes on a solid support was investigated extensively in aqueous buffer using atomic force microscopy (AFM). AFM is a microscopic technique that allows the elucidation of the three-dimensional structure of biological materials at high resolution and in their native physiological environments (Lal and John, 1994; You and Yu, 1999). In addition to the previously observed formation of the Sap C-lipid structural domains (You et al., 2001), Sap C was found to induce membrane destabilization at acidic pH. The Sap C effect on membrane destabilization showed a clear dependence on the presence and the concentration of acidic phospholipids. To correlate the function of Sap C with certain structural domains, further studies on the specific interaction between Sap C and phospholipid membranes were carried out, using two synthetic peptides corresponding to the putative helices 1 and 2 of Sap C (see Fig. 1 B). These approaches offer a new way to study structure-function relationships of Sap C and provide insight into the nature of Sap C-membrane interactions.
MATERIALS AND METHODS
Materials
All synthetic phospholipids, such as 1,2-distearoyl-sn-glycero-3-phosphocholine (DSPC) and 1-palmitoyl-2-oleoyl-sn-glycero-3-[phospho-L-serine] (POPS), were purchased from Avanti Polar Lipids (Alabaster, AL) and dissolved in chloroform. All other chemical reagents were reagent grade or better. Water used in this study was filtered with a Millipore Milli-Q Plus system (Bedford, MA) with a resistance higher than 18 MΩ/cm. The synthetic peptides (purity is better than 95%) were obtained commercially from the SynPep Corp. (Dublin, CA). The amino acid sequence of the peptides corresponded to the putative helices 1 and 2 of Sap C was as follows: YCEVCEFLVKEVTKLID (H1) and EKEILDAFDKMCSKLPK (H2).
Purification of Saposin C
The recombinant Sap C was overexpressed in Escherichia coli cells by using the isopropyl-1-thio-β-D-galactopyranoside-induced pET system (Qi et al., 1994). The proteins expressed with a His6 tag were purified on nickel columns, dialyzed, and lyophilized. As shown before (Qi and Grabowski, 1998), the His6 tag has no effect on Sap C function. The dried proteins were dissolved in 0.1% trifluoroacetic acid and further purified via an HPLC C4 reverse-phase column. The column was washed with 0.1% trifluoroacetic acid for 10 min, and a linear (0–100%) gradient of acetonitrile was established over a period of 60 min. The major protein peak was collected and lyophilized. Protein concentrations were determined as previously described (Qi et al., 1994).
Preparation of phospholipid vesicles
Unilamellar vesicles were prepared by bath sonication. DSPC and POPS stock solutions in chloroform mixed in a molar ratio of 10:1, 10:2.5, or 10:5, respectively, were dried under a flow of N2 gas and further under vacuum. The lipid films were hydrated by adding 50 mM NaCl, 20 mM Tris-HCl (pH 7.4) and incubation in a water bath at 47–67°C, according to the molar ratio. Hydrated lipid suspensions were sonicated at room temperature in a bath sonicator (Fisher Scientific, Pittsburgh, PA) to clarity.
Preparation of supported phospholipid membranes
A vesicle fusion method (Tamm and McConnell, 1985) was used to prepare supported phospholipid membranes. Freshly cleaved mica was immersed in the freshly prepared vesicle suspension and incubated overnight in a water bath at 67°C, 55°C, or 47°C for the DSPC/POPS mixes with a molar ratio of 10:1, 10:2.5, or 10:5, respectively. To facilitate vesicle bonding to the negatively charged mica surface, 1% (v/v) 20 mM CaCl2 was added to the lipid solution. At the end of incubation, samples were allowed to cool down to room temperature under ambient conditions and always maintained in an aqueous environment. Afterward, the samples were gently washed with the buffer containing 50 mM NaCl and 20 mM Tris-HCl (pH 7.4) to remove excessive vesicles, and immediately mounted for AFM imaging.
Atomic force microscopy
The in situ AFM observation was performed using a NanoScope IIIa MultiMode AFM (Digital Instruments, Santa Barbara, CA) equipped with a J scanner (maximal scan range 120 μm). An AFM was operated in contact mode. The AFM fluid cell (Digital Instruments) was washed extensively with ultrapure water and 95% ethanol, and was exposed to UV light before each experiment. An O-ring was not used with the fluid cell. The fluid cell was filled with 200 mM citrate phosphate buffer (CPS: 200 mM citric acid, 200 mM di-sodium phosphate, pH 4.7). The pH value of 4.7 was used to mimic the acidic intralysosomal environment, where mature Sap C is located (Grabowski and Horowitz, 1997; Vaccaro et al., 1999). Standard V-shaped silicon nitride cantilevers with a nominal spring constant of 0.06 N/m (Digital Instruments) were used for the entire study. The loading force was typically preset at less than 1 nN and minimized during imaging. Both height and deflection images (512 × 512 pixels), acquired in the retrace direction, were obtained from the same area at a scanning rate of 2.54–3.2 Hz. We found that the deflection images offered better contrast for visualizing subtle topographic changes, probably because of the dynamic nature of the Sap C-membrane interaction. Thus, deflection images were presented in most of the experimental description. Height images were provided, in some cases, side by side with deflection images for the important information on height variation. All off-line measurements (e.g., surface coverage, thickness, etc.) were conducted on the height images using the SPIP software (Image Metrology, Lyngby, Denmark).
Imaging was started only when the AFM system was thermally stabilized. The DSPC/POPS lipid membranes were first surveyed under AFM to identify a surface area with reasonably large coverage by phospholipid membranes. Once a desirable surface area was located, its surface topography was examined in both height and deflection imaging formats and saved for reference and off-line analysis. While continuously scanning, Sap C or peptide solution was injected, using a Hamilton microsyringe (Hamilton, Reno, NV) into the imaging buffer (CPS, pH 4.7) through the gap between the sample and the fluid cell. The Sap C and peptide solutions prepared in CPS buffer (pH 4.7) were thermally equilibrated to room temperature before use. Solution injection generally did not cause substantial thermal drift to the AFM system, but could induce some perturbation to the scanning tip and the sample. In these cases, a force-distance curve was taken at the end of each scanning frame and the cantilever loading force was readjusted to less than 1 nN.
RESULTS
Sap C interaction with DSPC/POPS (10:1) phospholipid membranes
Fig. 2 shows a typical time sequence of AFM images of the DSPC/POPS (molar ratio of 10:1) phospholipid membrane on mica, obtained before (Fig. 2 A) and after the addition of 0.84 μM Sap C (Fig. 2, B–F). The membranes prepared by the vesicle fusion method generally showed a smooth surface (Fig. 2 A), containing holes (white arrow) typical of formation defects in membrane preparations (Tamm and McConnell, 1985; Fang and Yang, 1997; Grandbois et al., 1998). Also visible are round-shaped granules (Fig. 2 A, black arrow), likely the aggregates of unfused lipid vesicles remaining at the surface that could not be removed by washing during the preparation step. At the end of the first scan frame of Fig. 2 A, 0.84 μM Sap C was injected into the imaging buffer. No immediate changes in membrane topography were evident (Fig. 2 B). About 15 min after Sap C addition, small patches appeared on top of phospholipid membranes along the edges of the membrane, i.e., at the rim of the holes (Fig. 2 C). With time, these small patches expanded along the surface of the lipid membrane and fused with neighboring patches (Fig. 2, D and E), until patch coverage was extensive and expansion stopped by ∼90 min (Fig. 2 F). The newly formed patch-like domains differed in imaging contrast (Fig. 2 F), suggesting the formation of Sap C-lipid complexes, in agreement with our earlier observation under similar conditions (You et al., 2001). Sometimes, a distinct structure of small ridges appeared at the leading edge of newly formed Sap C-lipid domains (Fig. 2 E, black arrows). Such small ridges did not expand with time (Fig. 2 F).
FIGURE 2.
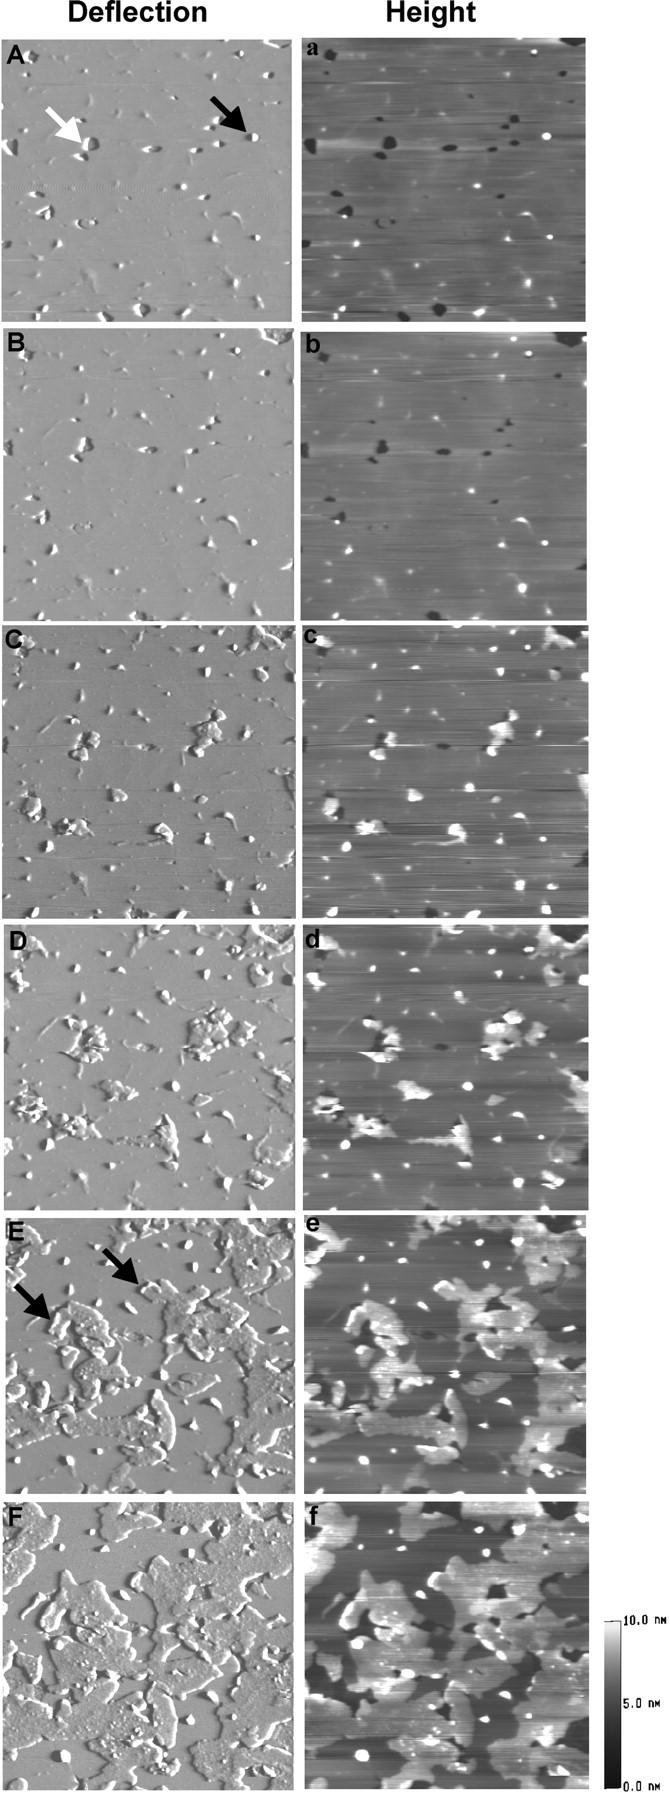
Time-sequence AFM deflection (A–F) and height (a–f) images of DSPC/POPS (molar ratio 10:1) phospholipid membranes on mica, showing Sap C-induced formation of patch-like domains. Images were obtained before Sap C addition (A, a) and 4 min (B, b), 15 min (C, c), 18 min (D, d), 44 min (E, e), and 90 min (F, f) after adding 0.84 μM Sap C. In (A), the white arrow points at a hole, a typical growth defect, at which the edge of the membrane is exposed; the black arrow points at an aggregate of vesicles. In (E), the black arrows indicate the smaller, second type of structures appearing at the crest of the newly formed Sap C-lipid domains. The thickness of the patch-like domains was measured at 3.03 ± 0.37 nm (n = 168). Image size: 4 × 4 μm.
Sap C interaction with DSPC/POPS (10:2.5) phospholipid membranes
The concentration of POPS, a negatively charged acidic phospholipid, in the vesicle preparation was increased, and Sap C effects on DSPC/POPS membranes were examined. Fig. 3 shows a typical series of time-lapse AFM images of DSPC/POPS (10:2.5) membranes on mica after the addition of 1.68 μM Sap C. Addition of Sap C did not cause immediate changes in the membrane topography (Fig. 3 B). About 7 min after Sap C addition, small structures similar to those shown in Fig. 2 C developed at membrane edges (Fig. 3 C), and expanded gradually. Here, we observed a novel Sap C-induced membrane restructuring process—membrane destabilization (Fig. 3, D and E). The membrane destabilization took place in the form of thickness reduction in the gel-phase membrane bilayer, starting at membrane edges and expanding along the membrane surface. Interestingly, this restructuring process of membrane destabilization appeared to compete with the other membrane restructuring process—formation of the patch-like domains, as the expansion of patch domains became restricted (Fig. 3, D and E) until eventual disappearance (Fig. 3 F).
FIGURE 3.
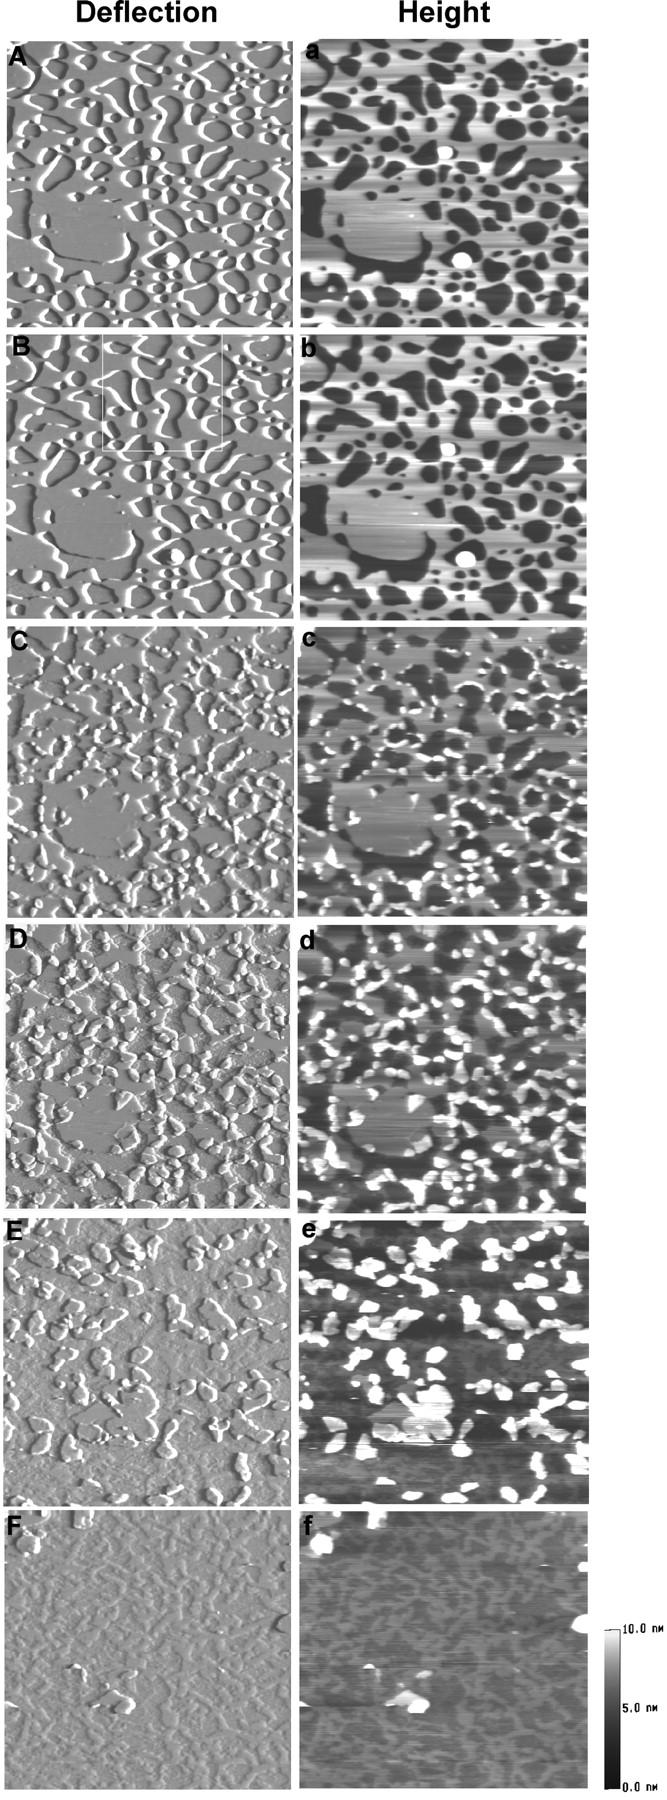
Time-sequence AFM deflection (A–F) and height (a–f) images of DSPC/POPS (molar ratio 10:2.5) phospholipid membranes on mica, showing a novel membrane restructuring process induced by Sap C—membrane destabilization. Images were obtained before Sap C addition (A, a) and 4 min (B, b), 7 min (C, c), 16 min (D, d), 40 min (E, e), and 59 min (F, f) after adding 1.68 μM Sap C. Image size: 4 × 4 μm.
To better visualize the subtle changes in Sap C-induced membrane restructuring, close-up images (Fig. 4, A–D) were selected from the same area (Fig. 3 B, white box) of Fig. 3, B–E, respectively. Line profiles (Fig. 4, E–G) were taken from corresponding height images across the indicated region (Fig. 4, A–C, white lines). The DSPC/POPS membrane bilayer (Fig. 4 A) showed as a single bilayer of ∼7.10 nm in height (Fig. 4 E). After the addition of Sap C, the lipid membrane appeared to be restructured in two distinct layers—an “upper” and a “lower” layer (Fig. 4 F), with thickness of 2.43 ± 0.33 nm and 1.58 ± 0.38 nm (n = 98), respectively. The appearance of upper and lower layers was observed only after the addition of Sap C and rarely at places where the Sap C-lipid patches had already formed (Fig. 4, B and C). Interestingly, close examination indicated that the edge of the lower layer remained relatively unchanged throughout the process (Fig. 4, B–D, black arrows). The thickness of this layer is 1.38 ± 0.16 nm as measured from Fig. 3 F. The major changes visible were the gradual retreat of the upper layer from the edge, creating an expanding plateau of the lower layer (Fig. 4, F and G). These results suggest that at a higher molar ratio of POPS in the DSPC/POPS (10:2.5) membrane, Sap C induced a novel type of membrane restructuring process, i.e., destabilization of the DSPC/POPS membranes.
FIGURE 4.
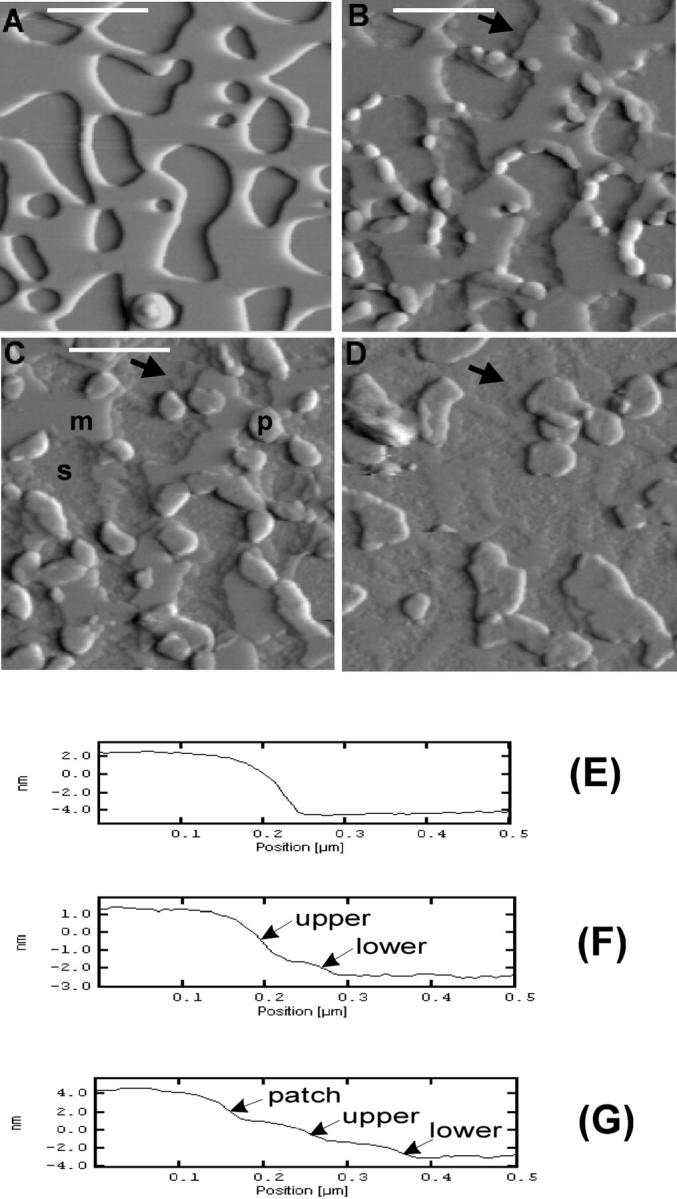
High-magnification AFM images showing the two types of membrane restructuring induced by Sap C—formation of patchlike domains and membrane destabilization. (A–D) Enlargements of Fig. 3, B–E, respectively, from the area marked by the white box in Fig. 3 B. (E–G) Line profiles taken from the corresponding height images of A, B, and C, respectively, at the position indicated by the white line. In C, the substrate mica surface, the membrane, and the patchlike domains induced by Sap C are marked as “s,” “m,” and “p,” respectively. In F, the membrane destabilization process resulted in two distinct layers at the edge of the phospholipid membrane, marked as “upper” and “lower.” The two layers are also visible adjacent to the Sap C-lipid patch domains (patch) in G. Thickness of the upper and lower layers was measured at 2.43 ± 0.33 nm and 1.58 ± 0.38 nm (n = 98), respectively. The arrows in B, C, and D indicate the edge of the lower layer, the location of which remained unchanged during the restructuring process. Image size: 1.60 × 1.60 μm.
Sap C interaction with DSPC/POPS (10:5) phospholipid membranes
We employed an even higher POPS molar ratio (10:5) in the preparation of DSPC/POPS phospholipid membranes to further examine the Sap C effect on the membrane. A typical series of time-lapse AFM images is shown in Fig. 5. Immediately after adding Sap C (1.68 μM), small structures appeared at the edge of the membrane bilayer, and simultaneously, rapid membrane destabilization occurred (Fig. 5 B). Within ∼17 min, the original phospholipid membrane seen in Fig. 5 A disappeared from the scanned area (Fig. 5, C–E). Unlike the above experiments, in these, no upper and lower layers were discernable at the edge of the membrane. Therefore, to verify that a membrane layer still remained on the mica surface, the central area (3 × 3 μm) in Fig. 5 F was subjected to a scan at a high force (>5 nN) and at a high scanning rate (>15 Hz), expecting to “scrape” away any remaining lipids and exposing the underlying mica. As shown in Fig. 5 F, the high force-scraped central area did expose the mica surface as the image contrast differed between the central and surrounding areas, indicating the presence of a remaining layer over the mica surface in the surrounding areas. In this case, the thickness of the remaining layer on the mica surface appeared smaller, in the range of 0.7–1.2 nm.
FIGURE 5.
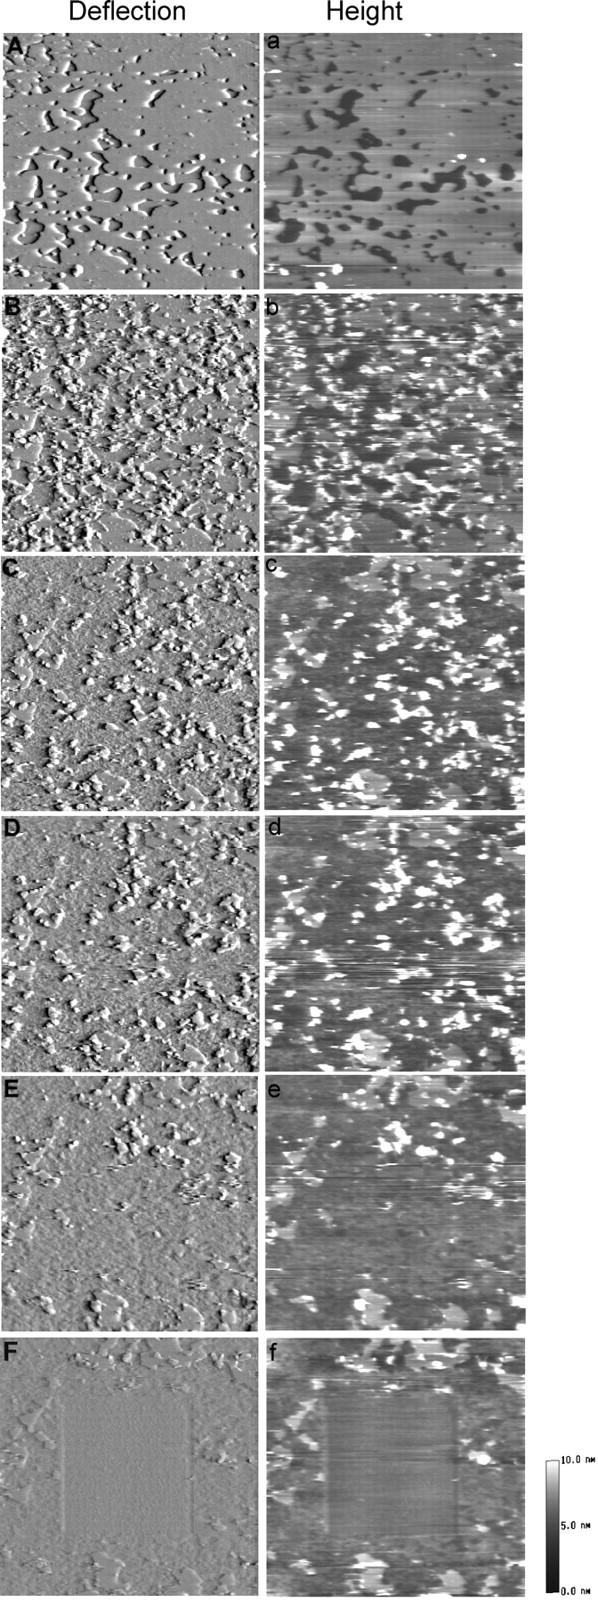
Time-lapse series of AFM deflection (A–F) and height (a–f) images of DSPC/POPS phospholipid membranes (molar ratio 10:5), showing that the highest POPS molar ratio tested gave the most extensive Sap C-induced membrane destabilization. Images were obtained before Sap C addition (A, a) and 5 min (B, b), 9 min (C, c), 13 min (D, d), and 17 min (E, e) after adding 1.68 μM Sap C. (F, f) The central area (3 × 3 μm) was scanned at a high force (>5 nN) and high scanning rate (>15 Hz) before returning to the previous scanned area (6 × 6 μm) under normal scanning conditions. Image size: 6 × 6 μm.
Quantitative analysis of Sap C-induced membrane restructuring
Fig. 6 A shows the quantitative analysis of the Sap C-lipid domains in DSPC/POPS (10:1) membranes. Surface coverage (At) of patch-like domains was calculated using grain analysis from the complete series of the AFM images and was normalized to the initial membrane surface coverage (A0) before Sap C addition. A lower concentration of Sap C (0.84 μM) induced slower formation of the patch-like domains and a partial coverage (∼51%) of the membrane surface (Fig. 6 A). A higher concentration of Sap C (1.68 μM) significantly accelerated the expansion of the patch-like domains and resulted in a nearly full surface coverage (∼90%) (Fig. 6 A). It should be noted that at the DSPC/POPS molar ratio of 10:1, only the patch formation process took place, and there was no membrane destabilization.
FIGURE 6.
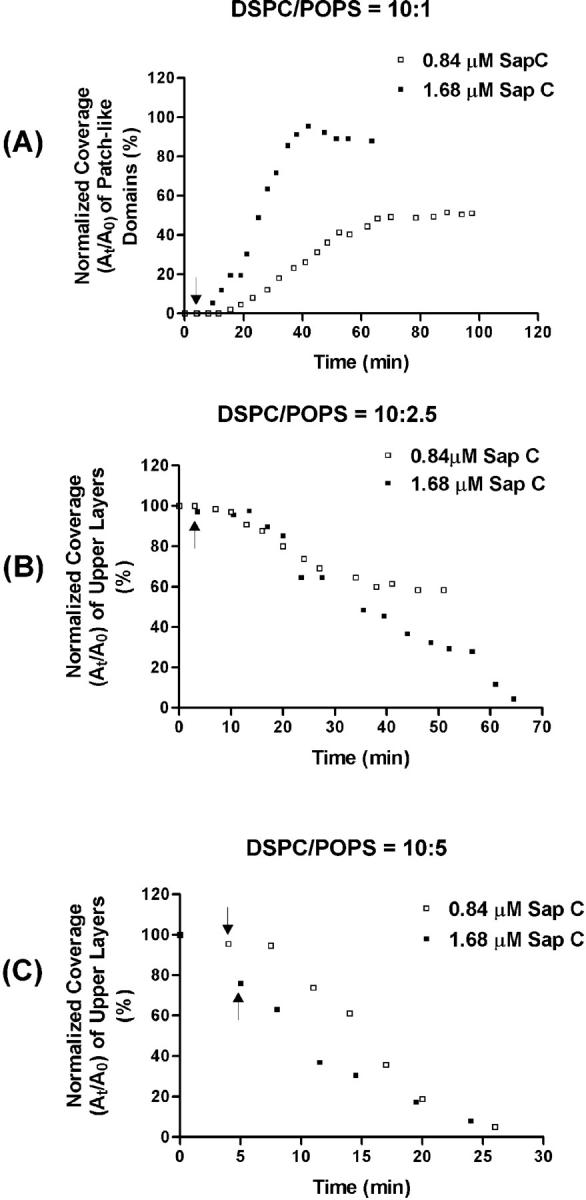
Quantitative analysis of Sap C-induced restructuring of DSPC/POPS membranes with molar ratios of (A) 10:1, (B) 10:2.5, and (C) 10:5, respectively. Surface coverage of the initial surface membrane (A0) and of structures (At) including the patchlike domains (A) and the upper layers (B, C) were each calculated by grain analysis of typical series of complete AFM images. In the graphs, At data for each time point have been normalized to A0. The arrows indicate the time of Sap C addition.
Quantitative analysis of the Sap C effects on the DSPC/POPS membranes with higher POPS molar ratios was also performed (Fig. 6, B and C). First, the surface coverage (At) by the upper layer during the membrane destabilization process was calculated. Then, the At was normalized to the initial surface membrane coverage (A0). With a 10:2.5 molar ratio, ∼58% of the upper layer remained at the surface at the end of the process when Sap C of a lower concentration (0.84 μM) was added, whereas the upper layer completely disappeared by the end of the destabilization process when Sap C of a higher concentration (1.68 μM) was added (Fig. 6 B). At the highest molar ratio (10:5) of DSPC/POPS, both low and high Sap C concentrations led to complete disappearance of the upper layer, and only the higher Sap C concentration allowed a faster rate of initial membrane destabilization (Fig. 6 C).
Synthetic peptide interaction with DSPC/POPS phospholipid membranes
The above experiments indicate that Sap C induces two types of structural changes in the DSPC/POPS membranes—the formation of the Sap C-lipid patch domains and the destabilization of the phospholipid membrane. To elucidate the potential role of sequence regions of Sap C in observed membrane restructuring processes, synthetic peptides were used. The H1 peptide contains the Sap C amino acid sequence from the α-helical domain 1; the H2 peptide is from the α-helical domain 2 (see Fig. 1 A). Helical wheel models of H1 and H2 peptides (Fig. 1 B) indicate that these peptides are amphipathic, i.e., hydrophobic residues predominating on one side of the helical column and hydrophilic ones on the other side.
These peptides were selected because: 1) an amphipathic α-helix is a common structural motif for protein-membrane interactions (Epand et al., 1995; Shai, 1999); 2) the α-helix 1 contains a region involved in Sap C-lipid binding, and the α-helix 2 represents a solvent-exposed region (Ruysschaert et al., 1998; Qi and Grabowski, 2001a); and 3) the peptides are structurally specific and, thus, offer a way to study the specific structure-function relationships.
H1 peptide and Sap C interaction with DSPC/POPS phospholipid membranes
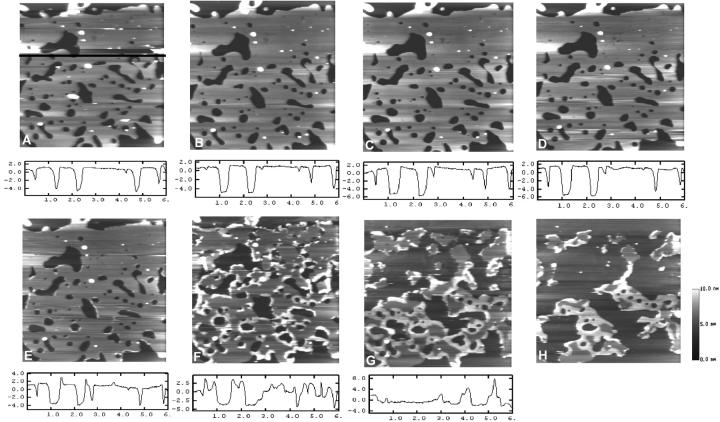
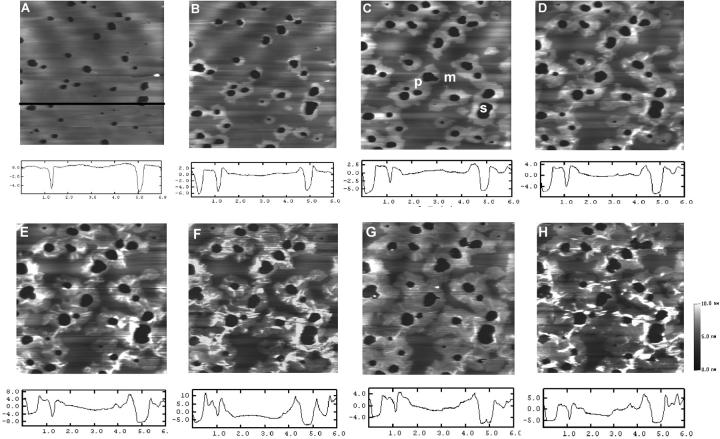
A typical time sequence of AFM images of the DSPC/POPS (10:2.5) lipid membranes was acquired before and after sequentially adding H1 and Sap C (Fig. 7). When H1 peptide (9.84 μM) was added (Fig. 7 B), no change in membrane topography was observed over a period of ∼58 min (Fig. 7, B–D), suggesting that H1 peptide alone did not induce membrane restructuring like any described above. At ∼67 min, 1.68 μM Sap C was added. Immediately after, small patches appeared at the edge of the membrane (Fig. 7 E) and these rapidly progressed (Fig. 7 F). Membrane disappearance became more prominent with time (Fig. 7, G and H). About 52 min after Sap C addition, a large percentage of the membrane disappeared even though some persisted (Fig. 7 H).
FIGURE 7.
Time-sequence AFM height images of DSPC/POPS (molar ratio 10:2.5) phospholipid membranes on mica with sequential addition of H1 peptide and Sap C. The images presented were obtained at (A) 0 min, (B) 5 min, (C) 30 min, (D) 63 min, (E) 67 min, (F) 79 min, (G) 95 min, and (H) 119 min. At ∼5 min, 9.84 μM H1 peptide was added, and at ∼67 min, 1.68 μM Sap C was added. The line profiles were obtained from the images directly above at the location indicated by the black line in (A). The units of x and y axes in the line profiles are μm and nm, respectively. Image size: 6 × 6 μm.
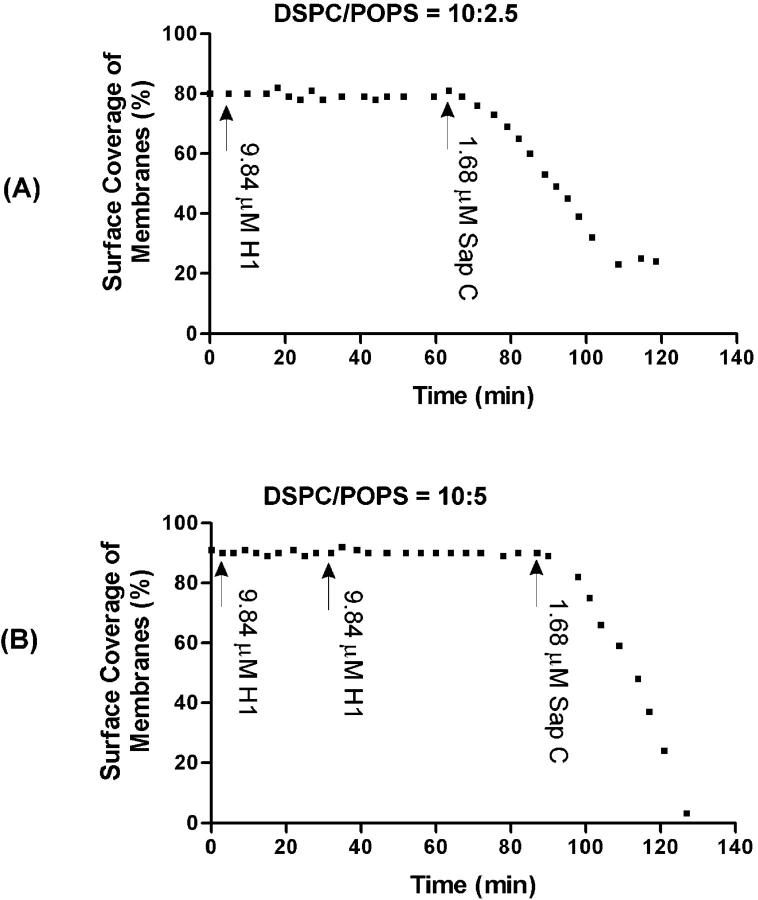
Quantitative presentation of experiments with DSPC/POPS membranes with molar ratios of 10:2.5 and 10:5 are shown in Fig. 8, A and B, respectively. H1 peptide alone was not able to induce any reduction of membrane surface coverage even with repeated dosing. Furthermore, membrane disappearance resulting from subsequent Sap C addition was different to that induced by Sap C alone (Fig. 6, B and C), i.e., no upper or lower layers were formed during the process. In addition, the lag time (≥8 min) observed in membrane destabilization with Sap C alone (Fig. 6 B) was eliminated when H1 peptide was added before Sap C (Fig. 8). This suggests that H1 peptide may alter the lipid environment for Sap C-induced membrane destabilization, resulting in immediate onset of the destabilization process once Sap C is present.
FIGURE 8.
Quantitative presentation of H1 peptide and Sap C effects on DSPC/POPS phospholipid membranes with a molar ratio of (A) 10:2.5 and (B) 10:5, showing a lack of effect by H1 peptide alone. The surface coverage (%) of the membrane at each time point was calculated and plotted. Arrows indicate the time of addition of H1 peptide and Sap C, respectively.
H2 peptide and Sap C interaction with DSPC/POPS phospholipid membranes
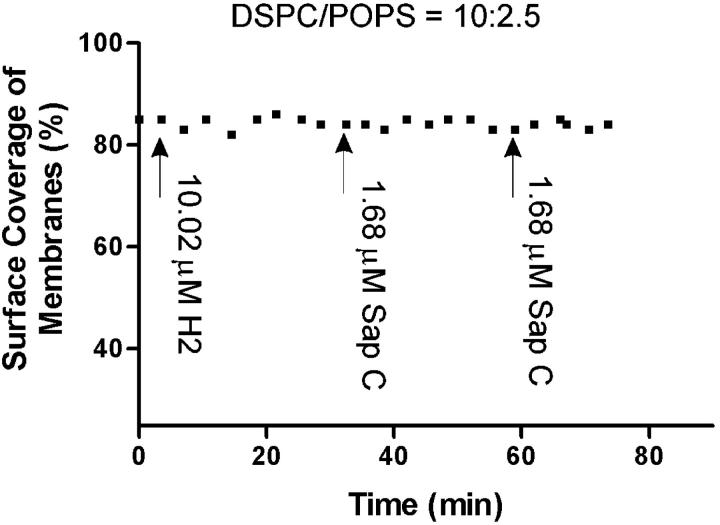
Experiments similar to those described above were conducted with H2 peptide and Sap C on DSPC/POPS (10:2.5) phospholipid membranes (Fig. 9). Addition of H2 peptide (10.02 μM) did not induce any membrane destabilization or disappearance. Importantly, membrane destabilization did not occur upon subsequent addition of 1.68 μM Sap C (Fig. 9).
FIGURE 9.
Quantitative presentation of H2 peptide and Sap C effects on DSPC/POPS (molar ratio 10:2.5) phospholipid membranes, showing the inhibition of Sap C-induced membrane destabilization by H2 peptide. The surface coverage (%) of the membrane at each time point was calculated and plotted. Arrows indicate the time of addition of H2 peptide and Sap C, respectively.
Real-time monitoring of restructuring of the DSPC/POPS (10:5) membrane upon the addition of H2 peptide (10.02 μM) and Sap C (1.68 μM) is shown in Fig. 10. Small patches appeared at the edge of the membrane shortly after adding 10.02 μM H2 peptide (Fig. 10 B), and these spread laterally (Fig. 10 C). From ∼21 min on, some rod-shaped features gradually developed, stabilized, and became more visible within the patch-like domains (Fig.10, D and E). These rod-shaped features were not observed in the patches formed in DSPC/POPS (10:2.5) membranes. To examine the effect of H2 peptide on Sap C, at ∼48 min, 1.68 μM Sap C was added (Fig. 10 F). Patch-like domains underwent reorganization, i.e., the rod-shaped features disappeared (Fig. 10 G) and then reappeared (Fig. 10 H). However, the addition of Sap C did not induce further expansion of the patch-like domains. More importantly, the membrane destabilization induced by Sap C alone, as observed above, was absent. The results presented in Figs. 9 and 10 show that H2 peptide contributes to the formation of patch-like domains, but inhibits Sap C-induced membrane destabilization.
FIGURE 10.
Time-sequence AFM height images of DSPC/POPS (molar ratio 10:5) phospholipid membranes on mica with sequential addition of H2 peptide and Sap C, showing patch formation and absence of Sap C-induced membrane destabilization. The images presented were obtained at (A) 0 min, (B) 4 min, (C) 11 min, (D) 21 min, (E) 44 min, (F) 48 min, (G) 51 min, and (H) 73 min. At ∼4 min, 10.02 μM H2 peptide was added and late at ∼48 min, 1.68 μM Sap C was added. The line profiles were obtained from the image directly above at the location indicated by the black line in A. The units of x and y axes in the line profiles are μm and nm, respectively. In (C), the letters “s,” “m,” and “p” denote the substrate mica, the membrane, and the patchlike domains induced by Sap C, respectively. The thickness of the patchlike domains was measured at 2.14 ± 0.51 nm (n = 130). Image size: 6 × 6 μm.
H1 and H2 peptide interaction with DSPC/POPS phospholipid membranes
To further explore effects of H1 and H2 peptides on DSPC/POPS phospholipid membranes, they were used together. Real-time AFM imaging of the DSPC/POPS membrane (10:2.5) was conducted before and after sequentially adding H1 and H2 peptide (Fig. 11). Addition of H1 peptide (9.84 μM) did not cause any topographic changes in the membrane, even though the sample was continuously scanned (Fig.11, B and C). At ∼33 min, H2 peptide (10.02 μM) was added. Not until ∼6 min later, a slight membrane destabilization, in the form of thickness reduction, was observed at some edges of the membrane (Fig. 11 D). Over time, this thinning extended to most membrane edges (Fig. 11, E and F). The line profiles (Fig. 11, G and H), taken from the corresponding height images at the indicated positions (Fig. 11, a and f, black lines), showed that the intact membrane (Fig. 11 G) was resolved into upper and lower layers at its edge (Fig. 11 H) after sequential addition of the H1 and H2 peptides. The thickness of the upper and lower layers was measured at 1.73 ± 0.30 nm and 3.09 ± 0.43 nm (n = 65), respectively. Thus, the extent of membrane thickness reduction induced by combined H1/H2 peptides appeared to be much less than that observed with Sap C (Fig. 3).
FIGURE 11.

Time-sequence of AFM deflection (A–F) and height (a–f) images of DSPC/POPS (molar ratio 10:2.5) phospholipid membranes on mica with sequential addition of H1 and H2 peptides. Images were obtained at (A, a) 0 min, (B, b) 12 min, (C, c) 29 min, (D, d) 39 min, (E, e) 71 min, and (F, f) 92 min. At the end of obtaining image (A, a), 9.84 μM H1 peptide was added and at ∼33 min, 10.02 μM H2 peptide was added. (G and H) Line profiles taken from the positions indicated by the black line in images (a) and (f), respectively. Thickness of the upper and lower layers was measured at 1.73 ± 0.30 nm and 3.09 ± 0.43 nm (n = 65), respectively. Image size: 4 × 4 μm.
Similar real-time experiments were conducted with the DSPC/POPS (10:5) membranes (Fig. 12). Addition of H1 peptide (9.84 μM) induced neither patch formation nor membrane destabilization (Fig. 12 B). When, at ∼34 min, H2 peptide (10.02 μM) was added, there was no immediate effect other than the disappearance of two larger aggregates and a small piece of the second layer (Fig. 12 A, black arrows), which left marks on the surface (Fig. 12 C). Membrane destabilization in a form of thickness reduction began to appear at one edge of the membrane (Fig. 12 D, black arrow). Destabilization did not extend to most of the edges, and narrow cracks throughout the membrane surface were observed (Fig. 12, E and F). In these DSPC/POPS (10:5) membranes, destabilization caused by combined H1/H2 peptides was much less extensive than that induced by Sap C alone, and the lower layer (3.79 ± 0.23 nm) was thicker than the upper one (1.59 ± 0.22 nm). It should be noted that even at this DSPC/POPS molar ratio (10:5), expansion of the patches upon H2 peptide addition appeared to be limited (Fig. 12, E and F). Therefore, unlike Sap C-induced membrane destabilization, that caused by combined H1/H2 peptides did not show a strong dependence on the concentration of POPS.
FIGURE 12.

Time-sequence of AFM deflection (A–F) and height (a–f) images of DSPC/POPS (molar ratio 10:5) phospholipid membranes on mica with sequential addition of H1 and H2 peptides. Images were obtained at (A, a) 0 min, (B, b) 27 min, (C, c) 34 min, (D, d) 42 min, (E, e) 89 min, and (F, f) 119 min, respectively. At the end of obtaining image (A, a), 9.84 μM H1 peptide was added and at ∼34 min, 10.02 μM H2 peptide was added. In A, the black arrows indicate two large and one small piece of vesicle aggregate, which disappeared under continued AFM scanning. The black arrow in D indicates the appearance of membrane destabilization, as two layers appear. G and H Line profiles taken from the positions indicated by the black line in images (a) and (f), respectively. Thickness of the upper and lower layers was measured at 1.59 ± 0.22 nm and 3.79 ± 0.23 nm (n = 110), respectively. Image size: 5 × 5 μm.
Sequentially adding first H1 and then H2 peptide appeared to be important for causing membrane destabilization. In another experiment using a pre-mixed solution of H1 peptide (9.84 μM) and H2 peptide (10.02 μM), no membrane destabilization was observed at the DSPC/POPS (10:2.5 or 10:5) membrane surfaces (data not shown). Furthermore, H5, a synthetic peptide (SPELVCSMLHLCSG) that represents a segment of the C-terminal portion of Sap C including α-helical domain 5 (Fig. 1 A) behaved similar to H1 in that it did not induce any membrane restructuring. However, combined H5 and H2 failed to induce destabilization of DSPC/POPS membranes with molar ratios of either 10:2.5 or 10:5 (data not shown). Thus, H1 and H2 have interactive effects not shared by H5 and H2.
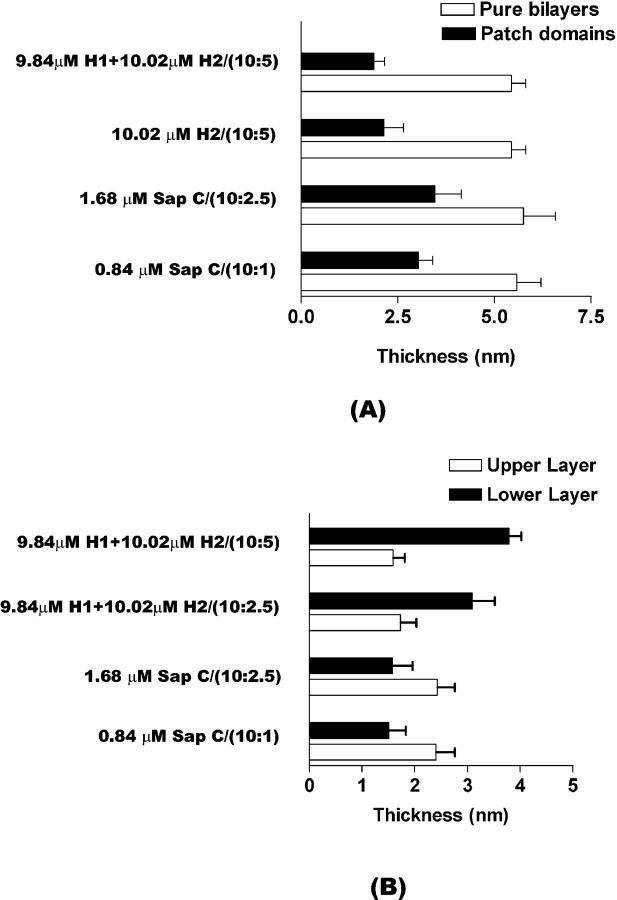
The effects of Sap C and synthetic peptides on DSPC/POPS as well as DSPC-only (10:0) membranes are summarized in Table 1. Thickness of patch-like domains and thickness of the upper and lower layers are shown in Fig. 13 A and B, respectively. Of note, Sap C yields thicker upper layers than lower ones, whereas synthetic peptides result in thinner upper than lower layers (Fig. 13 B).
TABLE 1.
Effects of Sap C and synthetic peptides on DSPC/POPS phospholipid membranes
| DSPC/POPS molar ratio
|
||||||||
|---|---|---|---|---|---|---|---|---|
| Patch formation
|
Membrane destabilization
|
|||||||
| (10:0) | (10:1) | (10:2.5) | (10:5) | (10:0) | (10:1) | (10:2.5) | (10:5) | |
| Sap C | +* | + | + | + | − | − | + | + |
| H1 peptide | − | − | − | − | − | − | − | − |
| H1/Sap C† | +* | + | + | + | − | − | + | + |
| H2 peptide | + | + | + | + | − | − | − | − |
| H2/Sap C† | + | + | + | + | − | − | − | − |
| H1/H2† | ND‡ | ND‡ | +* | + | ND‡ | ND‡ | + | + |
Partial formation with a surface coverage <20%.
Sequential addition.
Not determined.
FIGURE 13.
Thickness of the patchlike domains (A) and thickness of the upper and lower layers (B). (A) The thickness measurements of the patchlike domains (solid bars) were taken from the complete series of AFM images presented in Figs. 2, 3, 10, and 12, respectively. Thickness of pure DSPC/POPS membrane bilayers (open bars) at molar ratios of 10:1, 10:2.5, and 10:5 is also given. (B) The thickness measurements of the upper (open bars) and lower (solid bars) layers were taken from the complete series of AFM images not presented and presented in Figs. 3, 11, and 12, respectively.
AFM imaging artifacts
The loading force in contact-mode AFM could be controlled below ∼1 nN before the addition of Sap C or peptides, and consistent height information of the DSPC/POPS membrane could be obtained. However, after adding Sap C or peptides into the imaging buffer, their interaction with the phospholipid membrane became dynamic. This is evident from the many scratch lines in the height images after the addition of Sap C or peptides. Thus, the loading force could not be readily maintained at the preset level, and might increase substantially during scanning. The membrane could be compressed under such increased loading forces and, as a result, the measured thickness of the membrane was smaller. Hence, the AFM loading force contributes to the height variation observed in the membrane bilayers (Fig. 13 A). Further, the molecular complexes formed by the binding of either Sap C or the peptides to the membrane layers (i.e., Sap C/lipids or peptides/lipids) might affect their elastic responses to the tip compression. This could contribute to further variation in measured thickness of the upper and lower layers (Fig. 13 B). In addition, under the imaging conditions of high loading forces, the kinetics of membrane destabilization or disappearance might be accelerated.
DISCUSSION
In the present study, we have used AFM to investigate the membrane interaction of Sap C and peptides derived from this molecule. With DSPC/POPS membranes, at pH 4.7 (resembling the acidic intralysosomal environment where Sap C is located), we have observed that Sap C can induce two kinds of membrane restructuring: formation of patch-like domains and membrane destabilization. The formation of the patch-like domains is not POPS-dependent, as Sap C binds to the membrane in the presence or the absence of POPS (Table 1). This is in agreement with previous findings (Vaccaro et al., 1995). In contrast, the membrane destabilization process is not only dependent on the presence of POPS but also is strongly influenced by its concentration. It has been reported that a relatively high concentration of PS (∼20%) in the lipid vesicles promotes enzyme association with the membrane surface (Ciaffoni et al., 2001). In our study, membrane destabilization was not observed until the amount of POPS was increased to at least 13%, i.e., at a DSPC/POPS molar ratio of 10:1.5. However, under these conditions, destabilization occurred to a limited extent, confirming the previous finding that the amount of acidic phospholipids regulates the mode of Sap C interaction with the membrane (Ciaffoni et al., 2001).
In our further study of Sap C-induced membrane restructuring, the Sap C-derived peptides (H1 and H2) were applied. We have found that H2 peptide is similar to Sap C in its ability to induce the formation of patch-like domains. H2 was also able to inhibit Sap C-induced membrane destabilization. In contrast, H1 peptide did not induce any structural alterations in the membrane, at least not discernable under the present AFM resolution. In conjunction with H2 peptide, H1 peptide was able to mimic the destabilization effect of Sap C but only when peptides were added sequentially.
Possible mechanism(s) of H1 and H2 peptide interaction with phospholipid membranes
Numerous studies have examined the nature of interaction of membrane-lytic and membrane-fusion peptides, such as viral fusion peptides, antimicrobial peptides, and cytolytic peptides (Epand et al., 1995; Pecheur et al., 1999; Shai, 1999; White, 1999). It has been found that peptide binding to the membrane or peptide insertion into the membrane depends on properties such as peptide charge, hydrophobicity, and helicity. The insertion or binding of amphipathic peptides into the membrane is generally considered a three-step process: 1) adsorption of the unfolded peptides at the membrane surface, 2) peptide interaction with the membrane via either hydrophobic or electrostatic forces, and 3) adoption of an α-helical structure upon peptide insertion into the membrane.
It is expected that the interaction modes of the H1 peptide and the H2 peptide with the DSPC/POPS membrane would be substantially different. Calculated according to the Rose and Roy method (Rose and Roy, 1980), the H1 peptide (mean hydrophobicity 0.92) is more hydrophobic in character than the H2 peptide (mean hydrophobicity 0.60). Also, the net charges of H1 and H2 are different. The H1 peptide has two positively charged Lys residues and four negatively charged residues, whereas the H2 peptide contains four positively charged Lys residues and four negatively charged residues (Fig. 1 B). On the other hand, without the restriction of the disulfide bonds in Sap C, H1 and H2 peptides are free to reorientate themselves in the solution and interact with the membrane in their most favorable way. Therefore, it is expected that the interaction modes of H1 and H2 peptides with DSPC/POPS membrane may be substantially different.
In the previous studies of Sap C interaction with acidic phospholipid-containing membranes (Qi et al., 1996; Qi et al., 1999), the regions that penetrate the lipid membrane have been mapped to amino acids 1–15 and 65–79 within Sap C. These regions are the N- and C-termini of Sap C, respectively (Fig. 1 A). Most recently, the depth of the insertion of the Sap C amphipathic helices 1 and 5 into the outer leaflet of negatively charged phospholipid membranes has been determined to be, at acidic pH, about five carbon-bond lengths (Qi and Grabowski, 2001a). Even though no direct membrane restructuring arising from the H1 peptide addition was discernable under the present resolution of AFM, our observation suggests that H1 has to penetrate the membrane to play a role (Papahadjopoulos et al., 1975; Vaccaro et al., 1995). First, H1 stimulated the Sap C-induced membrane destabilization, i.e., the elimination of the lag time (Fig. 6 B and Fig. 8 B). Furthermore, H1 was able to induce membrane destabilization in combination with H2 peptides (Figs. 11 and 12). The latter was unlikely due to H2 peptide, because H2 by itself did not affect membrane destabilization under the experimental conditions. On the contrary, H2 peptide played a role in patch formation and even inhibited Sap C-induced membrane destabilization, suggesting that H2 peptide binds at the surface of the membrane without penetration.
Effects of Sap C on membrane restructuring
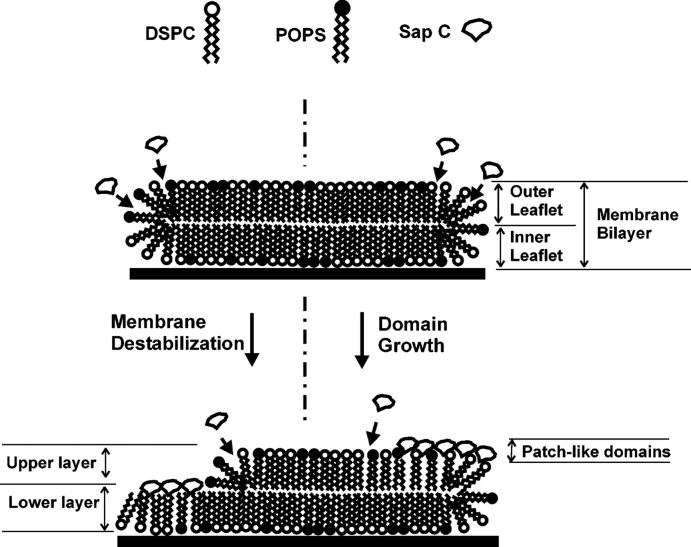
From the above discussion, it is clear that the Sap C-induced membrane restructuring should involve the following steps: 1), binding to the membrane, 2), penetration into the membrane, and 3), progressive recruitment of additional Sap C molecules to continue the process. In the present study, we observed that Sap C-induced membrane restructuring always started at the edges of the membrane. This is probably because the high curvature of the molecular organization of the phospholipids at the membrane edges may facilitate the initial insertion of Sap C into the membrane (Vaccaro et al., 1993; Grandbois et al., 1998; You et al., 2001). Binding of Sap C at the edges causes further structural alteration in the membrane, most likely the curvature, and creates more possible sites for Sap C binding in the surrounding areas (see the model in Fig. 14). In this fashion, Sap C-induced membrane restructuring extends its effect along the membrane surface. The presence of acidic phospholipids, i.e., POPS in our experiments, is believed to help the spreading of patch-like domains along the membrane surface. Even though the initial formation of the patch-like domains is not POPS-dependent, the surface coverage of the patch-like domains is substantially increased when POPS is present (Fig. 6 A and Table 1).
FIGURE 14.
Model for the Sap C-induced membrane restructuring starting at the edge of the membrane defects. As Sap C interacts with the membrane, the outer and inner leaflets in the original membrane bilayer are transformed into two new layers, i.e., the “upper” and “lower” layers.
Sap B was the first saposin found to form a water-soluble complex with lipid substrates (Soeda et al., 1993). However, the capability to form water-soluble complexes with all sphingolipids has been extended to all the saposins (Hiraiwa and Kishimoto, 1996). Sap D has the capability of inducing the breakdown of acidic phospholipid-containing membranes, giving rise to smaller particles with which the protein remained associated (Ciaffoni et al., 2001). These studies confirm our notion of the formation of water-soluble Sap C-POPS complexes.
We believe that only POPS lipids at the outer leaflet are involved in the complex formation with Sap C, considering the configuration of the DSPC/POPS membrane bilayer on mica (Fig. 14). The dissolution of these Sap C-lipid complexes could prompt further lipid loss, as more potential binding sites are exposed to Sap C. With time, this accelerates the destabilization process, leading to the gradual retreat of the upper layer and exposure of inner leaflets. The hydrophobic tails of the inner leaflet, which now face the aqueous medium, cannot remain stable and are probably covered with amphipathic Sap C (Figs. 3 and 5) or the H1/H2 peptides (Figs. 11 and 12). Therefore, the lower layers shown in Figs. 3, 5, 11 and 12 are thought to be a complex of Sap C/lipids or peptides/lipids. However, the lower layers induced by the combined H1/H2 peptides are nearly twice as thick as those induced by Sap C (Fig. 13 B). This remarkable difference cannot have arisen from Sap C's or the peptides' binding to the inner leaflet, even when AFM imaging artifacts are taken into account, because Sap C is almost four times larger in size than the H1 or H2 peptide.
Another possible explanation for the observed membrane destabilization is the formation of bilayer interdigitation. The term “bilayer interdigitation” was originally coined to describe the phenomenon whereby the methyl ends of long fatty acids of pure phosphatidylcholines with intramolecular fatty acid chain length heterogeneity protrude from one leaflet of the bilayer across more than half of the membrane thickness in between the acyl chains of the opposite leaflet (Slater and Huang, 1988). Since then, numerous studies have shown that bilayer interdigitation can be induced by environmental factors (e.g., pressure, temperature, etc.), amphipathic molecules (e.g., short chain alcohols, Tris, tetracaine, polyethylene glycol, etc.), and biomolecules (e.g., toxins and myelin basic protein) (Slater and Huang, 1988). The main characteristic of bilayer interdigitation is the reduction in membrane bilayer thickness. However, methods for direct demonstration of bilayer interdigitation are limited. So far, interdigitated domains induced by alcohol (Mou et al., 1994), high temperature (Fang and Yang, 1997), and a virus-derived peptide (Janshoff et al., 1999) have been visualized using AFM. The reported interdigitated domains appear as depressed domains in the bilayer. Notably, formation of these domains is not site-specific, and most of the interdigitated domains are in contact with bilayer defects (Mou et al., 1994; Fang and Yang, 1997; Janshoff et al., 1999). In contrast, in our experiments, the reduction of membrane thickness occurs locally and, more importantly, starts at specific locations—the edges of the membrane bilayer defects (Figs. 3, 5, 11, and 12).
The reported interdigitated domains are ∼1.5 nm (Janshoff et al., 1999) and 1.9 nm (Mou et al., 1994) in height with a respective noninterdigitated bilayer of 5.5 nm and 5.7 nm. Our results show the interdigitated domains induced by the combined H1/H2 peptides are ∼1.73 nm (Fig. 11) and 1.59 nm (Fig. 12) in height with a respective bilayer of 5.7 nm and 5.4 nm thick (Fig. 13 A). It is known that the formation and extension of interdigitated domains depend on the extent of disruption caused by molecular insertion into the lipid membrane bilayer (Slater and Huang, 1988; Janshoff et al., 1999). Therefore, our observation that with Sap C, the upper layer is thicker than the lower one (Fig. 13 B) suggests that Sap C, when inserting into the bilayer, caused more local disruption to the gel phase bilayer packing and, as a result, a higher degree of interdigitation than the combined H1/H2 peptides. However, probably because of the AFM imaging artifacts, the remaining layer (e.g., 1.38 ± 0.16 nm in Fig. 3 F or 0.7–1.2 nm in Fig. 5 F) on the mica surface seemed thinner than half of the normal bilayer thickness. This makes it difficult to conclude that Sap C induces fully interdigitated bilayers without further experiments.
When interdigitation occurs, the well-defined bilayer midplane originally consisting of the terminal methyl groups of the acyl chains no longer exists (Slater and Huang, 1988). The loss of the bilayer midplane may trigger a conformational transition because the terminal methyl groups have become exposed to the aqueous phase near the headgroups of the opposing monolayer. These energetically unfavorable hydrophobic groups offer potential binding sites for further interaction with amphipathic Sap C or the peptides (Janshoff et al., 1999). The binding of Sap C or the peptides thus stabilizes the phase separation and leads to further interdigitation and to the observed progressive retreat of the upper layers (Figs. 3–5, 11, and 12). The dependence of the membrane destabilization induced by Sap C and the combined H1/H2 peptides on the presence and the concentration of POPS in the bilayer would indicate that POPS plays an important role in the formation of interdigitated bilayers.
CONCLUSIONS
The present study provides for the first time direct evidence of Sap C inducing two types of membrane restructuring at acid pH, i.e., formation of patch-like domains and destabilization of the phospholipid membrane. The synthetic peptides H1 and H2, corresponding, respectively, to the α-helical domains 1 and 2 of Sap C, were used to elucidate the structural basis of Sap C effects. The H2 peptide induced the formation of patch-like domains but not membrane destabilization. The H1 peptide did not induce any membrane structural alteration. However, the H1 peptide was able to mimic the destabilization effect of Sap C in conjunction with the H2 peptide, when the H2 peptide was added after H1. This report offers a new approach for structure-function studies of Sap C with regard to its helical domains involved in the interaction with phospholipid membranes. Further studies with other structurally and functionally specific peptides may provide insight into the nature of Sap C-membrane interactions and help to elucidate the role of Sap C in enzyme stimulation.
Acknowledgments
We thank Drs. Johanna Meij and Judy Strong for critical reading of the manuscript.
This work was supported in part by National Institutes of Health grants DA09444, DA13471, and DA12848 (L.Y.), NS34071 (G.A.G.), and DK57690 (X.Q. ).
References
- Berent, S. L., and N. S. Radin. 1981. Mechanism of activation of glucocerebrosidase by co-beta-glucosidase (glucosidase activator protein). Biochim. Biophys. Acta. 664:572–582. [DOI] [PubMed] [Google Scholar]
- Ciaffoni, F., R. Salvioli, M. Tatti, G. Arancia, P. Crateri, and A. M. Vaccaro. 2001. Saposin D solubilizes anionic phospholipid-containing membranes. J. Biol. Chem. 276:31583–31589. [DOI] [PubMed] [Google Scholar]
- Egas, C., N. Lavoura, R. Resende, R. M. Brito, E. Pires, M. C. de Lima, and C. Faro. 2000. The saposin-like domain of the plant aspartic proteinase precursor is a potent inducer of vesicle leakage. J. Biol. Chem. 275:38190–38196. [DOI] [PubMed] [Google Scholar]
- Epand, R. M., Y. Shai, J. P. Segrest, and G. M. Anantharamaiah. 1995. Mechanisms for the modulation of membrane bilayer properties by amphipathic helical peptides. Biopolymers. 37:319–338. [DOI] [PubMed] [Google Scholar]
- Fang, Y., and J. Yang. 1997. The growth of bilayer defects and the induction of interdigitated domains in the lipid-loss process of supported phospholipid bilayers. Biochim. Biophys. Acta. 1324:309–319. [DOI] [PubMed] [Google Scholar]
- Grabowski, G. A., and M. Horowitz. 1997. Gaucher's disease: molecular, genetic and enzymological aspects. Baillieres Clin. Haematol. 10:635–656. [DOI] [PubMed] [Google Scholar]
- Grandbois, M., H. Clausen-Schaumann, and H. Gaub. 1998. Atomic force microscope imaging of phospholipid bilayer degradation by phospholipase A2. Biophys. J. 74:2398–2404. [DOI] [PMC free article] [PubMed] [Google Scholar]
- Hiraiwa, M., and Y. Kishimoto. 1996. Saposins and their precursor, prosaposin: Multifunctional glycoproteins. Trends Glycosci. Glycotechnol. 8:341–356. [Google Scholar]
- Iyer, S. S., S. L. Berent, and N. S. Radin. 1983. The cohydrolases in human spleen that stimulate glucosyl ceramide beta-glucosidase. Biochim. Biophys. Acta. 748:1–7. [DOI] [PubMed] [Google Scholar]
- Kervinen, J., G. J. Tobin, J. Costa, D. S. Waugh, A. Wlodawer, and A. Zdanov. 1999. Crystal structure of plant aspartic proteinase prophytepsin: inactivation and vacuolar targeting. EMBO J. 18:3947–3955. [DOI] [PMC free article] [PubMed] [Google Scholar]
- Kishimoto, Y., M. Hiraiwa, and J. S. O'Brien. 1992. Saposins: structure, function, distribution, and molecular genetics. J. Lipid Res. 33:1255–1267. [PubMed] [Google Scholar]
- Janshoff, A., D. T. Bong, C. Steinem, J. E. Johnson, and M. R. Ghadiri. 1999. An animal virus-derived peptide switches membrane morphology: possible relevance to nodaviral transfection processes. Biochemistry. 38:5328–5336. [DOI] [PubMed] [Google Scholar]
- Lal, R., and S. A. John. 1994. Biological applications of atomic force microscopy. Am. J. Physiol. 266:C1–C21. [DOI] [PubMed] [Google Scholar]
- Leonova, T., X. Qi, A. Bencosme, E. Ponce, Y. Sun, and G. A. Grabowski. 1996. Proteolytic processing patterns of prosaposin in insect and mammalian cells. J. Biol. Chem. 271:17312–17320. [DOI] [PubMed] [Google Scholar]
- Liepinsh, E., M. Andersson, J. M. Ruysschaert, and G. Otting. 1997. Saposin fold revealed by the NMR structure of NK-lysin. Nat. Struct. Biol. 4:793–795. [DOI] [PubMed] [Google Scholar]
- Mou, J., J. Yang, C.-H. Huang, and Z. Shao. 1994. Alcohol induces interdigitated domains in unilamellar phospholipid bilayers. Biochemistry. 33:9981–9985. [DOI] [PubMed] [Google Scholar]
- Munford, R. S., P. O. Sheppard, and P. J. O'Hara. 1995. Saposin-like proteins (SAPLIP) carry out diverse functions on a common backbone structure. J. Lipid Res. 36:1653–1663. [PubMed] [Google Scholar]
- Papahadjopoulos, D., M. Moscarello, E. H. Eylar, and T. Isac. 1975. Effects of proteins on thermotropic phase transitions of phospholipid membranes. Biochim. Biophys. Acta. 401:317–335. [DOI] [PubMed] [Google Scholar]
- Pecheur, E. I., J. Sainte-Marie, E. A. Bienven, and D. Hoekstra. 1999. Peptides and membrane fusion: towards an understanding of the molecular mechanism of protein-induced fusion. J. Membr. Biol. 167:1–17. [DOI] [PubMed] [Google Scholar]
- Qi, X., T. Leonova, and G. A. Grabowski. 1994. Functional human saposins expressed in Escherichia coli. Evidence for binding and activation properties of saposins C with acid beta-glucosidase. J. Biol. Chem. 269:16746–16753. [PubMed] [Google Scholar]
- Qi, X., W. Qin, Y. Sun, K. Kondoh, and G. A. Grabowski. 1996. Functional organization of saposin C. Definition of the neurotrophic and acid beta-glucosidase activation regions. J. Biol. Chem. 271:6874–6880. [DOI] [PubMed] [Google Scholar]
- Qi, X., and G. A. Grabowski. 1998. Acid beta-glucosidase: intrinsic fluorescence and conformational changes induced by phospholipids and saposin C. Biochemistry. 37:11544–11554. [DOI] [PubMed] [Google Scholar]
- Qi, X., K. Kondoh, D. Krusling, G. J. Kelso, T. Leonova, and G. A. Grabowski. 1999. Conformational and amino acid residue requirements for the saposin C neuritogenic effect. Biochemistry. 38:6284–6291. [DOI] [PubMed] [Google Scholar]
- Qi, X., and G. A. Grabowski. 2001a. Differential membrane interactions of saposins A and C: implications for the functional specificity. J. Biol. Chem. 276:27010–27017. [DOI] [PubMed] [Google Scholar]
- Qi, X., and G. A. Grabowski. 2001b. Molecular and cell biology of acid beta-glucosidase and prosaposin. Prog. Nucleic Acid Res. Mol. Biol. 66:203–239. [DOI] [PubMed] [Google Scholar]
- Rafi, M. A., G. de Gala, X. L. Zhang, and D. A. Wenger. 1993. Mutational analysis in a patient with a variant form of Gaucher disease caused by SAP-2 deficiency. Somat. Cell Mol. Genet. 19:1–7. [DOI] [PubMed] [Google Scholar]
- Rose, G. D., and S. Roy. 1980. Hydrophobic basis of packing in globular proteins. Proc. Natl. Acad. Sci. USA. 77:4643–4647. [DOI] [PMC free article] [PubMed] [Google Scholar]
- Ruysschaert, J. M., E. Goormaghtigh, F. Homble, M. Andersson, E. Liepinsh, and G. Otting. 1998. Lipid membrane binding of NK-lysin. FEBS Lett. 425:341–344. [DOI] [PubMed] [Google Scholar]
- Schnabel, D., M. Schroder, and K. Sandhoff. 1991. Mutation in the sphingolipid activator protein 2 in a patient with a variant of Gaucher disease. FEBS Lett. 284:57–59. [DOI] [PubMed] [Google Scholar]
- Schutte, C. G., B. Pierstorff, S. Huettler, and K. Sandhoff. 2001. Sphingolipid activator proteins: proteins with complex functions in lipid degradation and skin biogenesis. Glycobiology. 11:81R–90R. [DOI] [PubMed] [Google Scholar]
- Shai, Y. 1999. Mechanism of the binding, insertion and destabilization of phospholipid bilayer membranes by alpha-helical antimicrobial and cell non-selective membrane-lytic peptides. Biochim. Biophys. Acta. 1462:55–70. [DOI] [PubMed] [Google Scholar]
- Soeda, S., M. Hiraiwa, J. S. O'Brien, and Y. Kishimoto. 1993. Binding of cerebrosides and sulfatides to saposins A–D. J. Biol. Chem. 268:18519–18523. [PubMed] [Google Scholar]
- Slater, J. L., and C. H. Huang. 1988. Interdigitated bilayer membranes. Prog. Lipid Res. 27:325–359. [DOI] [PubMed] [Google Scholar]
- Tamm, L. K., and H. M. McConnell. 1985. Supported phospholipid bilayers. Biophys. J. 47:105–113. [DOI] [PMC free article] [PubMed] [Google Scholar]
- Vaccaro, A. M., M. Tatti, F. Ciaffoni, R. Salvioli, A. Barca, and P. Roncaioli. 1993. Studies on glucosylceramidase binding to phosphatidylserine liposomes: the role of bilayer curvature. Biochim. Biophys. Acta. 1149:55–62. [DOI] [PubMed] [Google Scholar]
- Vaccaro, A. M., M. Tatti, F. Ciaffoni, R. Salvioli, A. Serafino, and A. Barca. 1994. Saposin C induces pH-dependent destabilization and fusion of phosphatidylserine-containing vesicles. FEBS Lett. 349:181–186. [DOI] [PubMed] [Google Scholar]
- Vaccaro, A. M., F. Ciaffoni, M. Tatti, R. Salvioli, A. Barca, D. Tognozzi, and C. Scerch. 1995. pH-dependent conformational properties of saposins and their interactions with phospholipid membranes. J. Biol. Chem. 270:30576–30580. [DOI] [PubMed] [Google Scholar]
- Vaccaro, A. M., R. Salvioli, M. Tatti, and F. Ciaffoni. 1999. Saposins and their interaction with lipids. Neurochem. Res. 24:307–314. [DOI] [PubMed] [Google Scholar]
- White, S. H. 1999. Membrane protein folding and stability: physical principles. J. Mol. Biol. 290:99–117. [DOI] [PubMed] [Google Scholar]
- Wilkening, G., T. Linke, and K. Sandhoff. 1998. Lysosomal degradation on vesicular membrane surfaces. Enhanced glucosylceramide degradation by lysosomal anionic lipids and activators. J. Biol. Chem. 273:30271–30278. [DOI] [PubMed] [Google Scholar]
- You, H. X., and L. Yu. 1999. Atomic force microscopy imaging of living cells: progress, problems and prospects. Methods Cell Sci. 21:1–17. [DOI] [PubMed] [Google Scholar]
- You, H. X., L. Yu, and X. Qi. 2001. Phospholipid membrane restructuring induced by saposin C: a topographic study using atomic force microscopy. FEBS Lett. 503:97–102. [DOI] [PubMed] [Google Scholar]


