

Abstract
Hippocampal CA1 neurons exposed to zero-[Ca2+] solutions can generate periodic spontaneous synchronized activity in the absence of synaptic function. Experiments using hippocampal slices showed that, after exposure to zero-[Ca2+]0 solution, CA1 pyramidal cells depolarized 5–10 mV and started firing spontaneous action potentials. Spontaneous single neuron activity appeared in singlets or was grouped into bursts of two or three action potentials. A 16-compartment, 23-variable cable model of a CA1 pyramidal neuron was developed to study mechanisms of spontaneous neuronal bursting in a calcium-free extracellular solution. In the model, five active currents (a fast sodium current, a persistent sodium current, an A-type transient potassium current, a delayed rectifier potassium current, and a muscarinic potassium current) are included in the somatic compartment. The model simulates the spontaneous bursting behavior of neurons in calcium-free solutions. The mechanisms underlying several aspects of bursting are studied, including the generation of triplet bursts, spike duration, burst termination, after-depolarization behavior, and the prolonged inactive period between bursts. We show that the small persistent sodium current can play a key role in spontaneous CA1 activity in zero-calcium solutions. In particular, it is necessary for the generation of an after-depolarizing potential and prolongs both individual bursts and the interburst interval.
INTRODUCTION
Extracellular calcium [Ca2+]0 decreases significantly during seizures (Heinemann et al., 1977; Pumain et al., 1985; Heinemann et al., 1986). Animal studies have also shown that infusion of low-calcium solutions into the brains of cats and other laboratory animals will cause seizurelike activity (Kaczmarek and Adey, 1975). Thus [Ca2+]0 reduction in vivo can trigger a seizure, inasmuch as the intense neuronal activity associated with seizures could further decrease [Ca2+]0 in a feed-forward manner. Incubation of hippocampal slices in reduced (<0.2 mM) [Ca2+]0 ACSF blocks synaptic transmission, increases neuronal firing, and leads to the development of spontaneous periodic nonsynaptic epileptiform activity. Thus, the low-Ca2+ in vitro (CA1) model of epileptiform activity provides a powerful tool for both the investigation of the role of extracellular Ca2+ reduction in seizure generation and for the study of nonsynaptic mechanisms (Taylor and Dudek, 1982, 1984; Yaari et al., 1983, 1986; Haas and Jefferys, 1984; Konnerth et al., 1984, 1986; Perez-Velazquez et al., 1994; Jefferys, 1995; Bikson et al., 1999; Lian et al., 2001). Nonsynaptic mechanisms (i.e., osmotic changes, extracellular ionic transients, field effects, gap junctions) play a critical role in modulating all types of seizure (Durand, 1993). However, fundamental questions remain about the role of [Ca2+]0 decreases in facilitating seizures and on how neurons generate synchronized periodic activity in the absence of synaptic transmission. Specifically, the role of intrinsic membrane properties (e.g., burst dynamics) versus network properties has not been analyzed in detail.
In low-Ca2+ ACSF, CA1 HPCs are characterized by increased excitability (Jefferys, 1995) that results from several factors. In low-calcium conditions, recurrent inhibition and intrinsic calcium-dependent currents are reduced. Charge screening effects are also weakened, leading to a depolarization of the membrane and altered channel kinetics (Catterall, 1980; Ulbricht, 1990; Hille, 2001). In addition, incubation in low-calcium solutions increases the persistent sodium current which in turn enhances cell excitability (Azouz et al., 1996, 1997; Jensen et al., 1996; French et al., 1990). The persistent sodium current is further enhanced by elevation of extracellular potassium concentration (Somjen and Muller, 2000). Reduction in extracellular Ca2+ leads to increased neural firing and a transition to burst firing in CA1 HPCs (Su et al., 2001); it has been suggested that burst firing of CA1 HPCs plays a critical role in seizure initiation (Jensen et al., 1996). However, the neuronal dynamics underlying spontaneous HPC bursting in low-Ca2+, and specifically the role of the small persistent sodium current, are still unclear.
Computer simulations of epileptiform activity have provided powerful insight into mechanisms of neuron dynamics (Traub and Llinas, 1979; Traub et al., 1985, 1991; Warman et al., 1994; Pinsky and Rinzel, 1994; Bernard et al., 1997). Based on the available voltage-clamp data and current-clamp data for HPCs in normal solution, isolated or coupled CA1 and CA3 HPCs have previously been simulated in detail. Warman et al. (1994) developed a CA1 model consisting of seven active ionic channels localized in the somatic compartment, with a simple, passive dendritic structure. This model reproduced closely most of the features of the hippocampal CA1 pyramidal cell's electrophysiology, including the initial accommodation concurrent with a slow depolarization potential and spike broadening (Warman et al., 1994).
The mechanisms involved in individual pyramidal cell bursting in low calcium have not previously been modeled. The purpose of this paper is to analyze these mechanisms with a combination of modeling and in vitro recordings of CA1 HPCs under Ca2+-free conditions. Our model was based on the model developed by Warman et al. (1994); the parameters of the model were modified according to the patch clamp recordings and current clamp data in Ca2+-free solution. The ionic current dynamics underlying spontaneous bursting were then analyzed using the CA1 neuronal model. Various behaviors observed in vitro, e.g., the variability of spontaneous firing patterns and long interburst interval, are studied with the model. Our results suggest a critical role for the persistent-sodium current (which is targeted by several anticonvulsant drugs) in the generation of spontaneous bursts and in the after-depolarizing potentials (ADP) (Azouz et al., 1996, 1997) as well as an explanation for the effect of extracellular potassium concentration on HPC/network burst frequency (Yaari et al., 1986).
METHODS
Computational methods
Electrotonic structure
The CA1 HPC morphology is shown in Fig. 1 as a 16-compartment structure including a soma compartment, nine compartments for the apical dendrites, and six compartments for the basal dendrites (Warman et al., 1994). Standard equivalent cylinders are used to represent the dendritic trees. The soma has an area of 995.4 μm2 and is connected axially to the two dendritic cylinders. The dendritic cylinders have a diameter of 5.2 μm and length of 735.3 μm for the apical cylinder, and 490.2 μm for the basal cylinder.
FIGURE 1.

Structure of CA1 pyramidal cell model.
The transmembrane potential (Vi) for each compartment of the model is described by the relationship
 |
(1) |
where Cm,i, Vi, and ITotal,i are the membrane capacitance, transmembrane potential, and the total current of the i-th compartment respectively. In free-[Ca2+]0 solution, the calcium currents and calcium-dependent potassium currents in dendrite are eliminated too. Furthermore, the other active conductances are not included in the dendritic compartments, similar to the model by Warman et al. (1994). For each dendritic compartment, the total current is
 |
(2) |
where gi (i ≠ 6) is the passive conductance and  is the axial conductance between the i-th and (i+1)-th compartments. The last two terms are the axial currents caused by the potential difference between neighboring compartments. The terminal compartments in each dendritic branch have only one axial term corresponding to sealed ends. The transmembrane current
  represents the leak current of the i-th compartment.
Passive HPC membrane properties are set to the following values: somatic membrane resistance  , somatic membrane capacitance
  , dendritic membrane resistance
  , dendritic membrane capacitance
  , and axial (cytoplasmic) resistance
  With these parameters, the electrotonic parameters for each compartment can be determined by cable theory (Durand, 1984), as listed in Table 1.
TABLE 1.
Parameter values used in the model
| Parameter | Symbol | Value |
|---|---|---|
| Capacitance at somatic compartment | C10 | 10−5μF |
| Capacitance at dendritic compartment | C1,⋯,C9,C11,⋯,C16 | 2.5 × 10⁻⁵μF |
| Conductance between soma and dendrite | κ9,10 and κ10,11 | 7.35 × 10⁻⁵ mS |
| Conductance between two dendritic compartments | κ1,2,⋯, κ8,9, κ11,12,⋯,κ15,16 | 4.9 × 10⁻⁵ mS |
| Leakage conductance for dendritic compartment | g1,⋯,g9,g11,⋯,g16 | 0.039 × 10⁻⁵ mS |
| Equilibrium potential for sodium currents | ENa | 65.0 mV |
| Equilibrium potential for potassium currents | EK | −80.0 mV |
| Equilibrium potential for leakage current | EL | −58.0 mV |
| Maximum conductance for somatic current INa | gNa | 18.0 × 10⁻⁵ mS |
| Maximum conductance for somatic current INaP | gNaP | 0.24 × 10⁻⁵ mS |
| Maximum conductance for somatic current IDR | gDR | 12.0 × 10⁻⁵ mS |
| Maximum conductance for somatic current IA | gA | 17.0 × 10⁻⁵ mS |
| Maximum conductance for somatic current IM | gm | 5.9 × 10⁻⁵ mS |
| Leakage conductance for somatic compartment | gL | 1.47 × 10⁻⁵ mS |
Active ionic conductances
In the model, only the somatic compartment has active ionic channels. The stimulus current IStim is also localized to the soma. The total current in the somatic compartment is
 |
(3) |
with i = 6. The terms Iions and IL represent the total active ionic currents and membrane leak current respectively. The CA1 HPC model of Warman et al. (1994) for normal ACSF contains seven active ionic conductances: a fast sodium current INa, a calcium current ICa, and five potassium currents including a delayed rectifier current IDR, an A-type transient current IA, a muscarinic current IM, a short-duration Ca- and voltage-dependent current ICT, and a long-duration Ca-dependent current IAHP. In this model, calcium currents and the potassium currents regulated by calcium concentration (ICa, ICT, and IAHP) are not included. Recent experiments also indicate the presence of a persistent sodium current INaP in CA1 HPCs (Azouz et al., 1996, 1997; French et al., 1990; Li and Hatton, 1996; Su et al., 2001). This current plays an important role in the regulation of burst waveform and ADP for slices in low-calcium solutions. A persistent sodium current is therefore included. The five active currents (i.e., INa, INaP, IDR, IA, and IM) remaining in the somatic compartment are
 |
(4) |
Active currents are implemented using the Hodgkin-Huxley formalism (Hodgkin and Huxley, 1952)
 |
(5a) |
The maximum conductances are gNa = 18.1 mS/cm2, gDR = 12.0 mS/cm2, gA = 17.1 mS/cm2, and gM = 5.9 mS/cm2.
Each gate variable x (i.e., m, h, w, n, a, b, u) depends on its corresponding gate function,
 |
(5b) |
where x∞ = αx/(αx + βx) and τx = 1/(αx + βx). The rate functions (αx, βx) for currents INa, IDR, IA, and IM are based on those of Warman et al. (1994). However, modification of the ionic composition of the bathing medium can effectively change the kinetic properties of ionic channels. Changes in divalent ion concentrations in particular can shift the voltage-dependence of gating processes (Catterall, 1980; Ulbricht, 1990; Hille, 2001). When the solution is changed from normal solution to calcium-free solution, the Ca2+ ions adsorbed on the cell surface are gradually removed. The cation screening effect decreases and I-V curves shift in a negative direction. In the model, a negative shift in the steady-state values for the rate functions of b (with 10 mV), u (with 26.7 mV), and m based on those steady states of Warman et al. (1994). The n gate does not have any potential shift, whereas the h and a gates have complex potential shift. Although the negative shift is assumed for gates b, u, and m, it is not possible to attribute the shift totally to the charge screening effect. This is because the amount of depolarization caused by extracellular calcium decreasing cannot be calculated directly as it depends on the density of charges on the membrane and that number is unknown (Hille, 2001). Moreover, the effects of screening on different ion channels vary significantly. The change of solution may affect the dynamics of ionic channels in a complex way. Compared to the spiking pattern in normal solution, the spike widths increase from ∼2 to 20 ms after perfusion with calcium-free solution. In the simulation the spike width is broadened by increasing the time constants for h, a, n, and u. Further adjustments are then made in the final rate functions to best fit our experimental data (Table 2). Fig. 2 illustrates the standard rate functions used in our simulations. These values are used for all figures unless otherwise specified.
TABLE 2.
Variable rate functions
| Channel/Variable | Rate | Function | ||
|---|---|---|---|---|
 |
|
|
||
 |
|
|
||
 |
|
 |
||
 |
|
|
||
 |
|
|
||
 |
|
|
||
 |
|
|
FIGURE 2.

Steady-state curves (solid line) and time-constant curves (dotted line) for the model ionic channels: gates m and h for INa; a and b for IA; n for IDR; u for IM; and w for INaP.
Several investigators have demonstrated that changes in extracellular potassium concentration have a significant effect on low-calcium-induced epileptiform activity (Konnerth et al., 1986; Yaari et al., 1986; Lian et al., 2001). Changes in extracellular potassium concentration are simulated by shifts in the Nernst potential for potassium currents:
 |
(6) |
Here [K]i and [K]o are intracellular and extracellular potassium concentrations, respectively. Values of T = 20°C, [K]i = 143.7 mM, and [K]o = 6.0 mM are used, so that EK = −80.0 mV unless otherwise specified. The value of EK is shifted in the depolarizing direction to simulate the effect of increases in [K]o (Hahn and Durand, 2001).
The kinetics of INaP were based on the equation of Kay et al. (1998). The basic features of an INaP include persistence during prolonged depolarization, threshold of activation lower than that of INa, and its relatively small size (gNaP is 0.2–2% of the total sodium conductance). In the model, the half-maximal activation potential is set to 50.0 mV (Crill, 1996; French et al., 1990), the maximum conductance is gNaP = 0.24 mS/cm2. A large time constant with τ = 30.0 ms is assumed in the model. The long time constant of INaP plays an important role in ADP generation (see Discussion). The rate functions are shown in Table 2.
Experimental methods
Slice preparation and solutions
All experiments were performed in the CA1 pyramidal cell region of hippocampal brain slices prepared from Sprague-Dawley rats (75–250 g). Rats were anesthetized using ethyl ether, and decapitated. The brain was then rapidly removed and one hemisphere glued to the stage of a Vibroslicer (Vibroslice, Campden). Slicing was carried out in cold (3–4°C), oxygenated sucrose-based artificial cerebrospinal fluid (ACSF) consisting of (in mM): Sucrose 220, KCl 3, NaH2PO4 1.25, MgSO4 2, NaHCO3 26, CaCl2 2, Dextrose 10. Sucrose-based slicing medium has been shown to increase cell viability in vitro (Aghajanian and Rasmussen, 1989). The resulting 350-μm-thick slices were immediately transferred to a holding chamber where they remained submerged in oxygenated “normal” ACSF consisting of (in mM): NaCl 124, KCl 3.75, KH2PO4 1.25, CaCl2 2, MgSO4 2, NaHCO2 26, Dextrose 10. Slices were held at room temperature for ≥60 min before being transferred to the recording chamber where they were perfused with oxygenated normal ACSF (Temperature = 34 ± 2°C). After 10 min slices were perfused with zero-calcium ACSF (zero-Ca+2) with the following composition (in mM): NaCl 123, KCl 4.75, KH2PO4 1.25, MgSO4 1.5, NaHCO2 26, Dextrose 10, EGTA 1.
Intracellular whole cell recordings
Tight seal (4–6 GΩ) current-clamp recordings were made with an Axopatch-1D amplifier (Axon Instruments). Patch pipettes were pulled from 1.5-mm borosilicate filament containing glass tubing (Warner Instrument) using a two-stage process, fire-polished, and coated with Sylgard (Dow-Corning). The pipette was positioned under visual control with differential interference contrast optics and infrared light. No holding current was used during current clamp recordings unless otherwise stated. Data was transferred directly to a computer (DELL XPS H266) using a DigiData 1200 board and pCLAMP software (Axon Instruments). Patch pipettes were filled with internal recording solution consisting of (in mM): KGluconate 140, MgCl2 2, CaCl2 2, Na-ATP 2, Na-GTP 0.2, EGTA 10, Hepes 10.
RESULTS
Spontaneous intracellular burst waveform
After perfusion of hippocampal slices in calcium-free solution, HPCs in CA1 gradually depolarized 5–10 mV from rest. Within 10 min most HPCs began firing spontaneous action potentials. Spontaneous activity appeared as bursts of three or two action potentials riding on a wave of depolarization or as single-action potentials. Fig. 3 A shows a typical intracellular recording of a triplet burst observed in vitro. Using the control parameters given in Table 1, the model reproduces the essential characteristics of the triplet burst (Fig. 3 B). Table 3 presents a detailed comparison of the recorded and simulated bursts. Here the interburst interval is defined as the duration between the last spiking peak in a burst and the first spiking peak in the next burst. A large interburst interval (∼270 ms) is observed for HPCs in zero-calcium solution. The intraburst interval is the duration between the first and last spike peak of a burst. The spiking frequency is calculated as the average spiking rate over time. There is good agreement for many important characteristics of the triplet, e.g., resting potential, interburst interval, and intraburst interval. However, there are several notable differences. First, for the typical triplet in vitro, the average spike half-widths have an approximate ratio of 1:2.5:1.5 for spikes 1, 2, and 3. For the model, the spike half-widths for a triplet have ratio 1.5:1:1. Second, the amplitudes of the second and the third spikes in the model are 30% and 10% less than that generally observed in vitro, respectively. Third, experimental data show that the onset of a spontaneous burst is fast with the intracellular recording voltage rising at a sharp angle. For the model, the initiation of the burst is slower. This last observation results partly from the fact that the model reports true transmembrane potential although the intracellular recordings did not account for changes in the extracellular field. Haas and Jefferys (1984) have shown that a more gradual shift in transmembrane potential during burst onset can be obtained when the extracellular field is subtracted from the intracellular recording.
FIGURE 3.
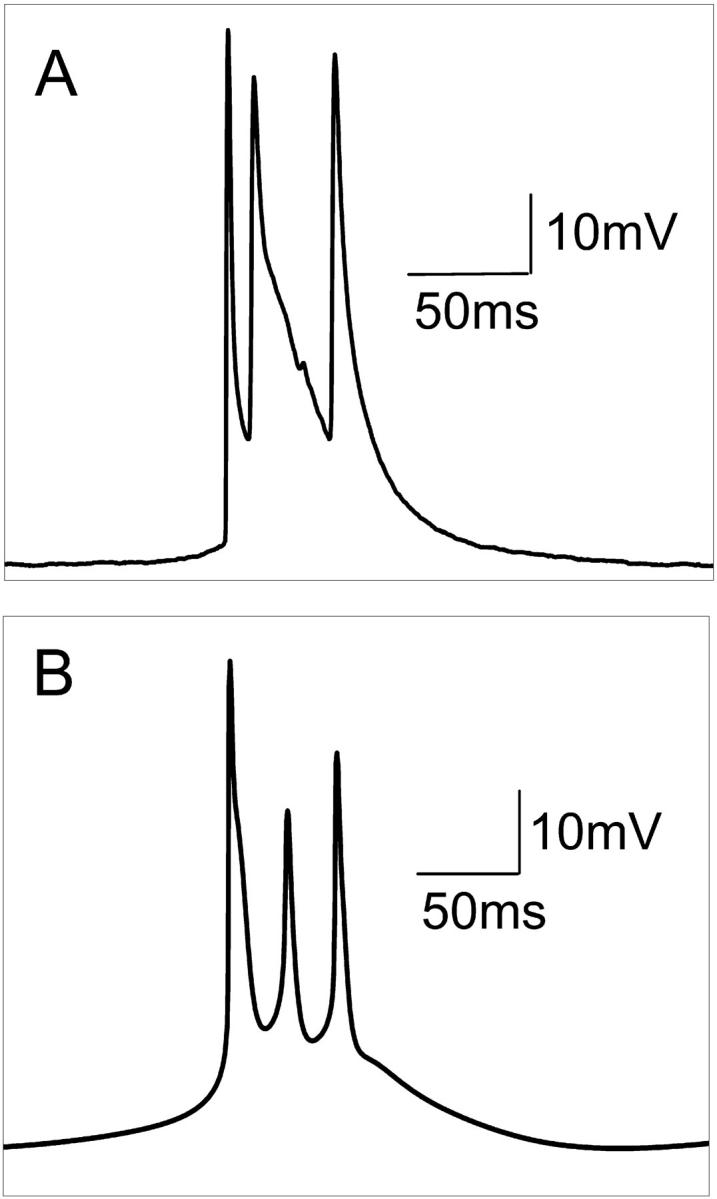
(A) Typical spontaneous intracellular recording of a triplet observed in vitro in zero-calcium conditions, and (B), the triplet action potential generated by the model using parameters (given in Table 1) without any stimulus.
TABLE 3.
Comparison between experimental and model values of the action-potential properties
| Resting potential | Amplitude at first spike (mV) | Interburst interval (ms) | Intraburst interval (ms) | Spiking frequency (Hz) | |
|---|---|---|---|---|---|
| Experiment | (−52, −58) | 67 ± 5 | 268 ± 23 | 49 ± 8 | 9.5 ± 1 |
| Model | −54 | 60 | 274 | 52 | 9.2 |
Values with ± are mean ± variance.
Using the model, it is possible to determine the contribution of each channel type to bursting dynamics. Different currents related to the soma compartment during a burst are plotted in Fig. 4. The soma transmembrane potential (Fig. 4 A) is directly related to the change of total current ITotal in the somatic compartment (Fig. 4 B). Current ITotal consists of six currents shown in Fig. 4, C–F according to Eq. 3. How these various currents affect the dynamics of transmembrane potential will be discussed in the following sections. Fig. 4 shows that INa is the dominant inward current and IA is the dominant outward current in the model (Fig. 4 C). The smallest current is INaP (Fig. 4 D). In each phase of a burst cycle, INaP exhibits a trend that clearly differs from the remaining currents. Except for a small time delay the changes in INa, IDR, IA, and IM (Fig. 4, C and E) closely parallel the change in the membrane potential (Fig. 4 A). But for INaP the maximum point is typically achieved as the membrane potential reaches the low value of −40 mV (Fig. 4 D). As a result, INaP, despite its low peak amplitude, plays a critical role during HPC bursting (see Discussion).
FIGURE 4.

Detailed curves of various currents during a burst for the CA1 model. (Bottom to top) (A) The transmembrane potential in the somatic compartment. (B) The total current ITotal in the somatic compartment. (C) The dominant inward currents INa with dashed line and the dominant outward current IA with solid line. (D) Persistent sodium current INaP. (E) The potassium currents IDR with solid line and IM with dashed line. (F) The axial current ISoma-Den between the somatic compartment and the two neighboring dendritic compartments. Five of six peaks for current ITotal in B are clipped by the frame. The first peak for current ISoma-Den in F is also clipped.
Effect of DC current on neural firing
A depolarizing DC current was applied intracellularly to an HPC in vitro that had been firing spontaneous triplets (Fig. 5 A). The number of spikes per burst decreased from three to two with increasing amplitude of depolarizing current. Further depolarization led to single spiking mode (singlets) activity. Fig. 5 B shows the model with the same parameters as in Fig. 3 can reproduce this effect. For the three-spike burst (triplets) model, the two-spike burst can be observed with a depolarizing DC current of ∼0.07 nA. A 0.02-nA depolarizing DC current results in activity consisting of a three-spike burst followed by a two-spike burst. More complex burst patterns (e.g., a three-spike burst followed by several two-spike bursts or single-spike activity) can be observed for the model with DC current in the range of 0.03 nA to 0.05 nA. An example of nonperiodic activity is shown in Fig. 5 C for 0.04-nA depolarizing DC. Complex activities have also been observed in vitro for different square depolarizing currents (Su et al., 2001). For DC currents larger than 0.06 nA, a doublet activity is observed in the model. Further depolarization (>0.1 nA) leads to singlet activity. The average spiking frequency both in vitro and in the model increases as the DC stimulus is increased (Fig. 5 D). The data for the model matches well the experimental observations. In the upper part of Fig. 5 D, the typical regions of different spiking behavior (i.e., number of spike per burst) are also indicated.
FIGURE 5.
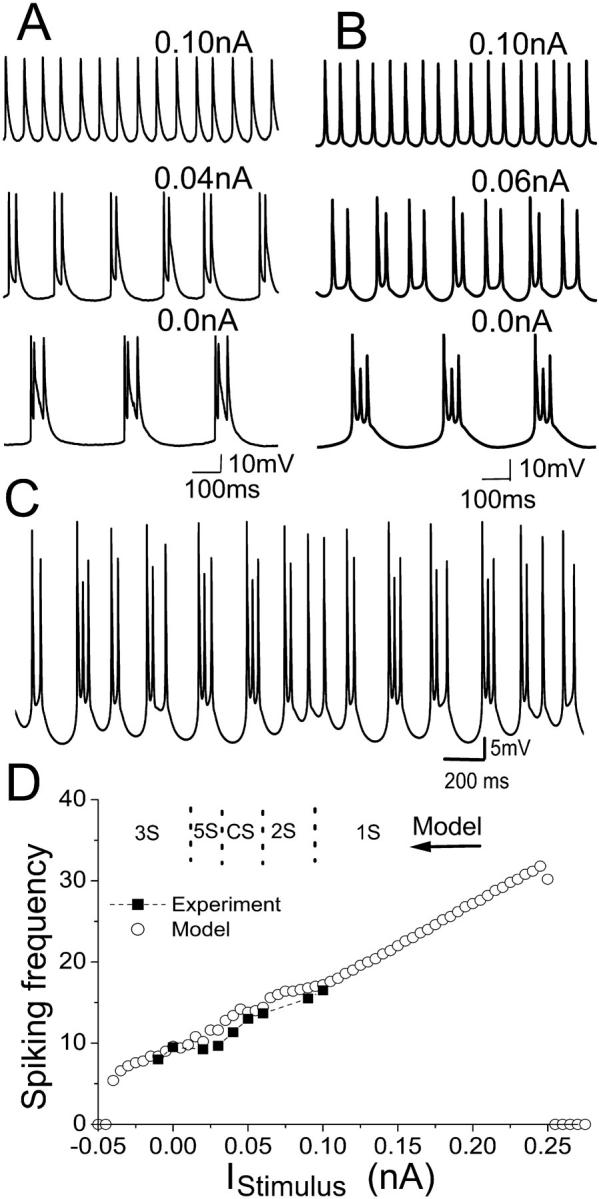
(A) Intracellular recording observed for an HPC in vitro in zero-calcium condition with different depolarizing DC currents applied intracellularly. (B) Model cell behavior at different DC depolarizing currents. Both show that the addition of a depolarizing DC current results in a transition from triplet activity, to doublets and then singlets. (C) A complex activity with varying burst patterns can be observed for the model with 0.04-nA depolarizing DC current. (D) The spiking frequencies both in vitro (square) and in the model (circle) increases as the DC stimulus are increased. The spiking frequency is calculated as the average spiking rate over time. The variance for frequency in vitro is 2; for the model, <0.2. The suppression of spike firing occurs at large enough depolarizing or hyperpolarizing currents. In the upper part of D, the typical regions of different spiking number per burst are also indicated. Here 1S, 2S, and 3S mean singlet, doublet, and triplet modes of activity, respectively. The activity of a two-spike burst followed by a three-spike burst is simply indicated by 5S. CS refers to the complex burst mode.
Effect of persistent sodium conductance on spiking frequency and ADP
Experimental results suggest that the persistent sodium current (INaP) is enhanced during perfusion with low-calcium solution (Li and Hatton, 1996). Furthermore, previous studies in vitro have suggested that this current underlies the pronounced ADP observed during perfusion with reduced Ca2+ solution and thus modulates the bursting behavior of these cells (Azouz et al., 1996, 1997). We therefore investigated the role of INaP in the dynamics of our HPC model, and contrasted its role with that of the fast sodium current.
The spiking frequency in the model is modulated by changes in gNaP (Fig. 6 A). Values for gNaP that are either too small (≤50% control) or too large (≥180% control), block or depress spiking activity. Spiking frequency increases linearly with gNaP up to the point at which activity is blocked. An increase of gNaP by 110% will give a four-spike burst (region 4S in Fig. 6 A). A doublet burst (region 2S in Fig. 6 A) is observed after a 30% gNaP increase. Further increase in gNaP leads to a single spike mode (region 1S in Fig. 6 A) until the activity is blocked. Note that for some transition regions between two regions with simple burst modes (e.g., the transition region between 2S and 3S, or 3S and 4S in Fig. 6 A) one can also observe some complex burst patterns. As gNaP is decreased, spiking frequency decreases and shows three plateau values before activity is blocked. Each plateau corresponds to an activity mode of triplets, doublets, and singlets, respectively. The small region of singlet spiking mode occurs with ∼55% gNaP. It is interesting that doublet and singlet activities are observed for both large and small gNaP, but with different spiking frequencies.
FIGURE 6.
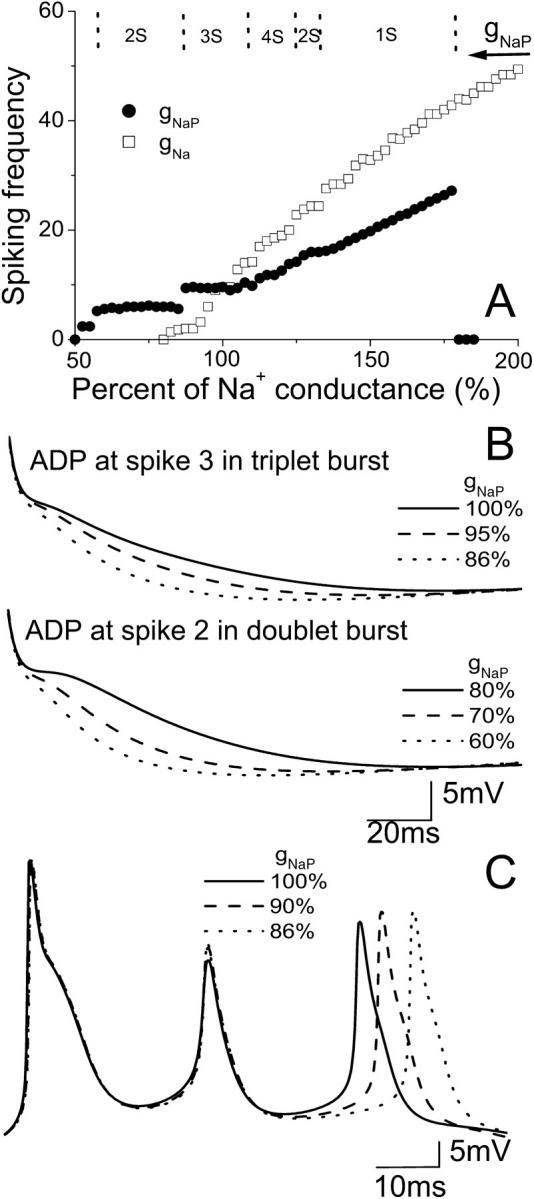
(A) Spiking frequency of the CA1 model with the change in conductance gNaP (circle) and gNa (square). Too large or too small gNaP blocks spiking activity. In the upper part of A, the typical regions of different spiking number per burst are shown for the change of gNaP. (B) A decrease of gNaP results in a reduction of the prolonged ADP after the action potentials in a triplet or doublet burst. (C) A notable delay in the appearance of the third spike for the burst is induced by a decrease of gNaP.
Varying gNaP also changes the ADP observed after a burst (Fig. 6 B). A decrease of gNaP results in a reduction of the ADP after the burst action potential, consistent with in vitro data (Su et al., 2001). Reducing gNaP to 86% of control generates triplet bursts, but the ADP after the third spike is reduced. A decrease in the range of 85–60% results in doublet firing with a further reduced ADP after the second spike. Fig. 6 C shows that the model also predicts a notable delay in the appearance of the last spike after lowering gNaP.
Effect of fast sodium conductance on activity
The fast sodium current (INa) is the dominant inward current in HPCs. Slight changes of gNa have significant effects on action-potential generation. A plot of spiking frequency versus gNa is given in Fig. 6 A. The model also shows that doublet and singlet activity can be observed with a decrease of gNa before block occurs. However, an increase of gNa causes an increase of spiking number for a burst. For example, a six-spike burst can be observed with 130% gNa (Fig. 7 A) and a 12-spike burst can be observed with 200% gNa. Multiple-spike burst activities have been observed in vitro (Su et al., 2001). Fig. 7 B shows that there is an almost linear relationship between the spiking number and the increase of gNa. This result also indicates that the number of spikes in a burst is strongly influenced by the fast sodium conductance. As for gNaP, a small decrease (or increase) of gNa results in ADP reduction (or prolongation), as shown in Fig. 7 C. The final spike, as well as the middle spike of a triplet burst, can also be delayed by a small reduction of gNa (Fig. 7 D).
FIGURE 7.
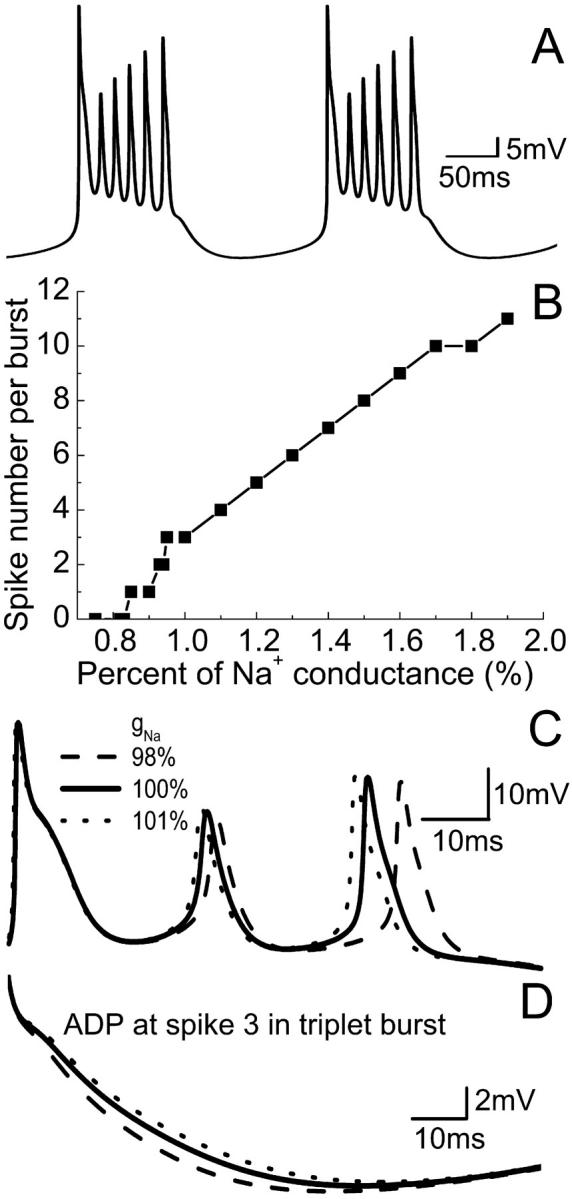
Effect of varying gNa on burst activity for the CA1 model. (A) A periodic six-spike burst can be obtained with 130% gNa. (B) The spiking number per burst increases with the increase of gNa. (C) Decrease or increase of gNa results in ADP reduction or prolongation, and (D), the delay of the final spike in the burst.
Control values of the model parameters have the ratio gNa/gNaP = 75 and in general, INa > INaP at all times. The maximum ratio of the two sodium currents is INa/INaP ≈ 100 and occurs near the peak of the first spike of a burst. If gNaP is set to zero, spontaneous activity is not generated. If, however, gNa is subsequently increased beyond 120% of control, spiking activity is restored. Our simulation results show that in this case, a prolonged ADP no longer occurs. If gNa is reduced to 80% of control, spontaneous activity is not generated, although it can be restored by increasing gNaP. However, reducing gNa below 70% of control eliminates spontaneous spiking regardless of gNaP. These data show that INaP is important for the generation of a prolonged ADP (Azouz et al., 1996, 1997; Jensen et al., 1996; Su et al., 2001), but an increased INa alone can be sufficient to sustain spontaneous bursting.
Effect of [K+]o on activity
Epileptiform bursting in vitro is highly sensitive to changes in [K+]o (Yaari et al., 1986). The effect of increased [K+]o at the single HPC level on spiking frequency is simulated in the model by depolarizing EK, the potassium reversal potential (Fig. 8). Spontaneous bursting is not observed for [K]o < 5.4 mM or [K]o > 9.4 mM (i.e., EK < −82.7 mV and EK > −68.7 mV in our model). Between these two extremes, spiking frequency increases with increasing [K+]o. A doublet burst can be observed with 5.5 mM [K]o. With [K]o = 6.0, a triplet burst is obtained. Further increasing of [K]o leads to a complex burst mode, followed by the doublet burst and single spike mode until firing is suppressed. The typical transmembrane activities for these modes are shown in Fig. 8 A. Regimes with different burst modes are given in the upper part of Fig. 8 B. This result suggests that single-cell dynamics are responsible for the modulation of network epileptiform activity by [K+]o , as observed in vitro (Yaari et al., 1986).
FIGURE 8.
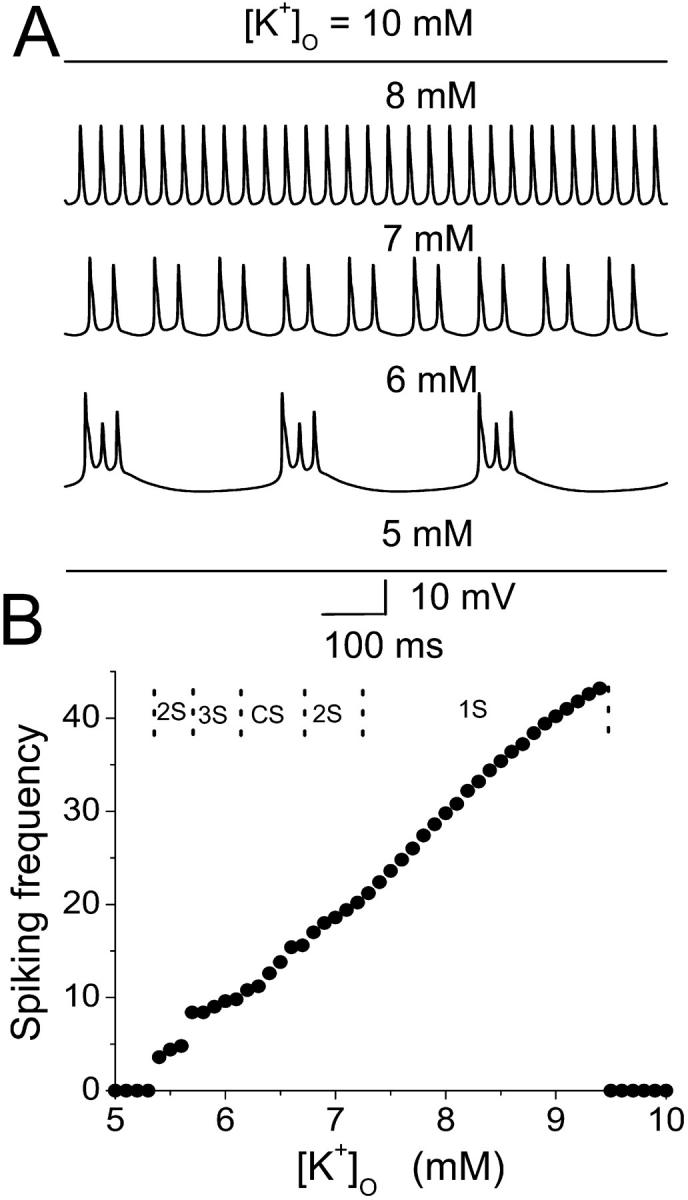
Effect of increased [K+]o on the spiking frequency with the model in the single HPC level. An increase of [K+]o results in an increase of the potassium reversal potential, as well as the potassium currents. (A) The action potential for the model cell with different [K+]o. (B) The average interspike frequencies in the model (circle) increases as [K+]o increases in a certain region. In the upper part of B, typical regimes with different burst modes are indicated.
Effect of potassium conductance on activity
In our model, the A-type transient potassium current (IA) is the predominant outward current. At the peak of an action potential the three potassium currents included in the model typically fit the ratio IA:IDR:IM = 100:7.8:7.6. Reducing the effectiveness of any potassium current is predicted to cause an increase of spiking frequency, as shown in Fig. 9. In Fig. 9, the typical regions for different burst modes are also indicated. Complex bursting activities can be observed between two regions of simple burst modes. Our simulation results (data not shown) also show that an increase of any potassium conductance has the effect of delaying the appearance of the third spike.
FIGURE 9.
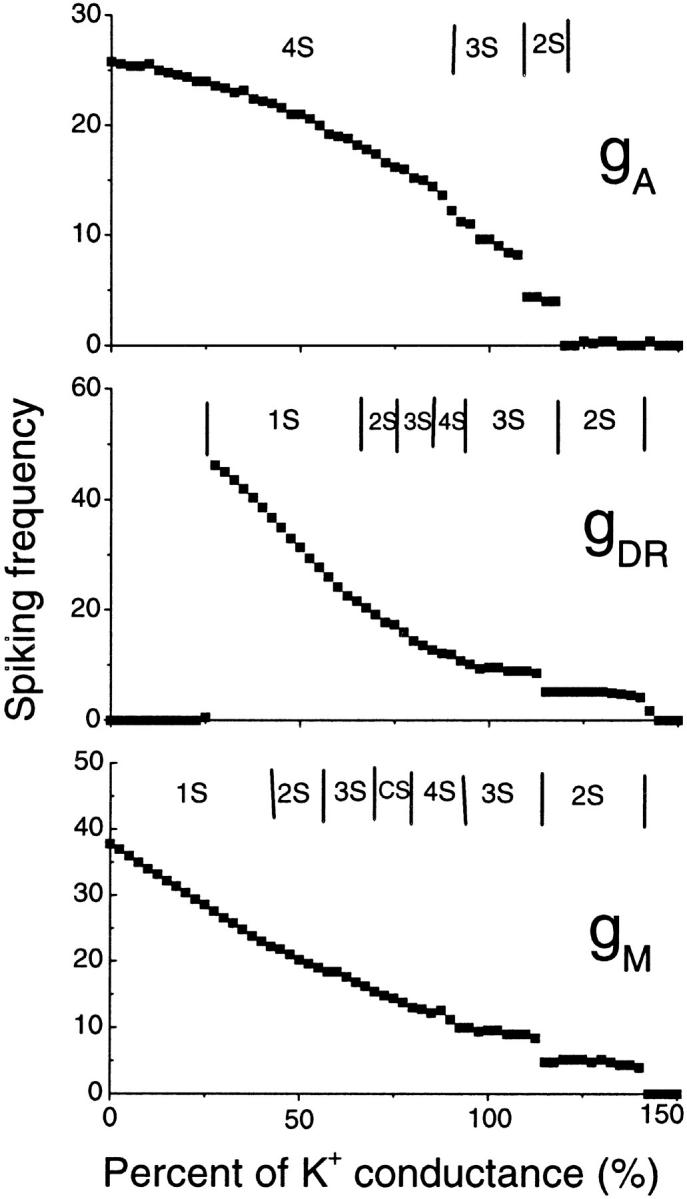
Spiking frequency of the CA1 model with the change in conductance gA, gDR, and gM of potassium currents. A decrease of potassium current conductance results in an increase of the spiking frequency in a certain region. In each figure, the typical regimes with different burst modes are also indicated.
DISCUSSION
A 16-compartment, 23-variable cable model of a CA1 pyramidal neuron in calcium-free extracellular solution is developed to simulate in vitro observations. There are five active currents (INa, INaP, IDR, IA, and IM) present in the somatic compartment. The currents INa and IA are the dominant inward and outward currents in the model (Fig. 4 C). As shown in Figs. 6 and 9, any changes of sodium or potassium current can change the spiking frequency of the model. Typically, an increase of effectiveness of inward sodium currents or a decrease of effectiveness of outward potassium currents results in an increase of spiking frequency. Changes in [K+]o affect spike frequency (Fig. 8) by shifting the Nernst potential for potassium currents. Various burst modes, including complex burst activities, can be observed with the model. The spiking number per burst is strongly influenced by the fast sodium conductance (Fig. 7 B). Although INaP is a small current, it is necessary for the generation of an ADP and prolongs both individual burst duration and the interburst interval (Fig. 6).
In this Discussion, mainly based on Fig. 4, we will discuss how the interactions among the sodium and potassium currents of the CA1 HPC determine the properties of burst generation, spike width, burst termination, ADP size, and interburst interval in zero-calcium conditions. The sensitivity of bursting dynamics to specific parameters is also discussed. The importance of the small persistent sodium current in spontaneous CA1 activity in zero-calcium solutions will be addressed. We will also show that, by itself, INaP is not sufficient to sustain repetitive firing in CA1 HPCs due to its special dynamics. To sustain a spike, a suitable gNaP is typically a relatively small component among active conductances of an excitable neuron.
Variability of spontaneous firing waveform
In vitro recordings show that CA1 HPCs exhibit singlet, doublet, or triplet burst patterns and that depolarization can induce a transition between behaviors (Su et al., 2001). Variability of burst waveform is also demonstrated in our model and accounted for by small changes in several parameters. The parameter values listed in Table 1 result in triplets. Slight changes in specific conductance lead to singlets, doublets, multiple-spike bursts, or to the cessation of spontaneous firing. Some complex firing modes, e.g., a three-spike burst followed by doublet or singlet bursts, can be observed. These complex firing modes are mainly found in the transition region between two regions with simple burst modes. For example, a progressive increase of gDR, gA, gM, or gL, or decrease of gNa or gNaP, results in a change from firing triplets to doublets, singlets, and finally the cessation of spontaneous activity (e.g., Figs. 6 A, 7 B, and 9). Likewise a reduction of gDR, gA, gM, or gL, or increase of gNa or gNaP, leads to more than three spikes per burst (e.g., Fig. 7, A and B). Further increase of gNaP to 130% (or 150%) of the normal value leads to high frequency doublet (or singlet) activity. Multiple spike somatic bursts are sustained with an increase of interburst interval after a decrease in somatic-dendritic coupling (κ9,10 and κ10,11) up to 20% (Data not shown here). Given the sensitivity of burst type (i.e., triplet, doublet, or single) to membrane polarization, axial conductance, potassium concentration, and the peak conductance of several membrane currents, it is not surprising that a range of bursting behaviors is observed in vitro (Su et al., 2001).
Burst generation dynamics
In normal ACSF, CA1 HPCs have a resting potential near −70 mV. At this value, inward and outward membrane current dynamics maintain a stable resting potential. As extracellular calcium ions are washed out, the cation screening effect is reduced (Catterall, 1980; Ulbricht, 1990; Hille, 2001). The I-V curves for active currents are typically shifted to the left (conductance increases occur at more negative levels). This effect has been simulated by a negative shift in the steady-state I-V curves for the m, h, and n gates based on those steady states used in Warman et al. (1994) (see Computational Methods). The resulting increase in inward currents moves the resting potential of the model toward a value of −55 mV, as observed in vitro (Table 3). The fast sodium and persistent sodium currents at this depolarized level increase and exceed outward currents resulting in spontaneous activity.
It is well established that inhibition of the persistent sodium current by antagonists such as phenytoin (Heinemann et al., 1985) suppresses low-Ca2+ field bursts. Furthermore, enhancement of the persistent sodium current in CA1 HPCs plays a key role in nonsynaptic epileptogenesis (Bikson et al., 2001). The results of the present study (Fig. 6) confirm experimental observations regarding the role of the persistent sodium current in facilitating bursting at the single-cell level (Azouz et al., 1996, 1997; Su et al., 2001) and provide a possible mechanism for the facilitation of network epileptiform activity by this current. The specific role of INaP in modulating burst dynamics is further discussed below.
Spike width
The spike width of CA1 HPCs in low calcium is ∼20 ms, compared to 2 ms in normal ACSF (Warman et al., 1994). After removing calcium and calcium-dependent currents from the model, INa and IA are the two dominant currents. Their values are generally ∼10 times larger than each of the remaining active currents, INaP, IDR, and IM during a burst (Fig. 4, C–E). Consequently, spike width is determined mainly by the properties of INa and IA. The maximum conductances used in our model have been lowered from those used in Warman et al. (1994). The overall decrease in current levels throughout a burst results in a slower change in membrane potential and contributes to the larger spike width observed.
Spike width in the model is also related to the rate functions for INa and IA. The maximum time constant for activation gate m of INa is only 0.032 ms, whereas the time constant for inactivation gate h can be as large as 12.5 ms (Fig. 2). At the onset of a burst, INa activates very fast but inactivates slowly, resulting in a rapid and prolonged inward current. The time constant for activation gate a of IA is comparatively large, resulting in a slow onset of the outward current IA. Together, modifications for low calcium made in the model result in long spike widths that are consistent with our experimental data (Table 3).
Burst termination dynamics
The potassium currents IDR and IM increase gradually during a burst (Fig. 4 E). Eventually they reach a level that is high enough to prevent further spikes and the burst is terminated. For the parameters listed in Table 2 this occurs after the third spike. If IDR or IM are decreased to 50% of control in our model, there is insufficient outward current to terminate the spiking state, resulting in a fast, continuous spiking state.
During a spike the persistent sodium current also rises gradually throughout a burst (Fig. 4 D). The slow increase of INaP delays the termination of a burst. During the early spikes of a burst, INaP is too small to have a significant effect on the waveform of the burst. However, by the end of the burst, INaP becomes large enough such that a small decrease of gNaP can cause a noticeable delay in the appearance of the final spike (Fig. 6 C). A further decrease of gNaP results in the disappearance of the final spike (Fig. 6 B), consistent with the experimental observation (Su et al., 2001).
Prolonged ADP behavior
Our model supports the hypothesis that a persistent sodium current is responsible for the ADP observed in CA1 HPCs (Azouz et al., 1996, 1997; Jensen et al., 1996; Su et al., 2001). It is shown that as the transmembrane potential decreases from −6.5 mV just after the peak of the third spike to −41 mV, all currents, with the exception of INaP, rapidly decrease. The persistent sodium current on the other hand shows a large increase during the same period (Fig. 4 D). This is reflected in the ratio INa / INaP that decreases from 36 to 2.5 whereas the transmembrane potential decreases from −6.5 mV to −41 mV. During burst termination INaP continuously increases until the membrane potential has decreased to a value of −46 mV. The model shows that the five active currents (INa, IA, IDR, IM, and INaP) have the same order of magnitudes during burst termination (i.e., ∼−45 mV potential). For example, INaP:INa:IA:IDR:IM = 1:2.1:1.3:1.2:1 at Vsoma = −45.0 mV. In this case, the current INaP can exert a strong influence on the shape of transmembrane potential during the termination stage of a burst. The large time constant for INaP, i.e., 30.0 ms in the model, makes it particularly effective at preventing rapid repolarization at the end of a burst. As a result, a prolonged ADP can be observed.
Dynamics for long interburst interval
An interburst interval of 270 ms can be observed in vitro (Fig. 5 A). Our model suggests that there are two main factors that account for the long interburst interval in the calcium-free solution. A prolonged ADP caused by INaP contributes to the first part of the long duration of the interburst interval. After the ADP, another long interval is observed with a low and almost fixed transmembrane potential (Fig. 4 A). During this interval the potential changes slowly as a result of the near-zero net current (Fig. 4 B). The inward currents at the soma include INa and INaP (Fig. 4, C and D), as well as the axial currents caused by the potential difference between the soma and its neighboring dendritic compartments (Fig. 4 E), as described by Eq. 1. The outward currents at the soma include the three potassium currents (Fig. 4, C and E). Once the transmembrane potential is lower than −50 mV, the inward and outward currents in our model become almost equal to each other and so the net current is always smaller than 0.002 nA. Such a CA1 neuron is in a quasi-equilibrium state. According to Eq. 1, a net current near zero will cause the potential to change slowly. As a result, a long interval is obtained with an almost fixed potential ∼−53 mV. With our model, the transmembrane potential remains below −52 mV (the minimum is ∼−54 mV) for as long as 150 ms.
Such a quasi-equilibrium state cannot be held indefinitely. Inward currents continue to increase during the latter half of the interburst interval. The membrane potential slowly rises as increasing inward currents push the soma toward the burst threshold and the cycle begins again.
Small persistent sodium current
In the model, gNa > gNaP and INa > INaP throughout a burst cycle. During a burst, the ratio INa > INaP varies from 100 at the peak of first spike to 3.0 at the most negative potential reached. During the interburst interval the ratio is typically between 2.0 and 4.0. During the ADP immediately after burst termination the ratio decreases to 1.5 or lower. These data suggest that INaP plays a critical role during repetitive bursting, as suggested by in vitro studies (Azouz et al., 1996, 1997; Jensen et al., 1996; Su et al., 2001). In particular, INaP is necessary for the generation of an ADP and prolongs both individual bursts and the interburst interval.
In each phase of a burst cycle INaP exhibits a clear difference from the other currents. The changes in INa, IDR, IA, and IM (Fig. 4, C and E) closely parallel the change in the membrane potential (Fig. 4 A). But for INaP the maximum point is typically achieved as the membrane potential reaches the value of −40 mV (Fig. 4 D). For INaP the steady-state value for the activation gate w is nearly one for most of the membrane potential values that occur during the course of a burst (i.e., w∞ > 0.99 for Vsoma > −40 mV). In this case one has INaP ≈ gNaP (Vsoma − ENa). As a result, INaP decreases linearly with increasing membrane potential once Vsoma > −40 mV. Fig. 4 D shows that INaP reaches maxima three times during a triplet burst; the largest value is reached during the ADP.
Because of its inactivation at voltage greater than −40 mV and a large time constant, INaP cannot, in the absence of INa, generate action potentials; rather, it plays a pivotal role in established bursting behavior. Due to the same reason, even with a suitable INa given in Tables 1 and 2, a large value of gNaP always prevents the occurrence of such voltage oscillations, as shown in Fig. 6 A. It turns out that a suitable gNaP is typically a relatively small component among active conductances of an excitable neuron, as observed by experiments (Crill, 1996).
Role of extracellular K+ concentration in epileptiform event initiation
Previous in vitro studies have shown that at [K+]o below 5 mM, spontaneous low-Ca2+ epileptiform activity is suppressed in CA1 (Konnerth et al., 1986; Yaari et al., 1986; Bikson et al., 2001). As [K+]o increases gradually from 6 to 9 mM, low-Ca2+ field burst frequency gradually increases. At [K+]o above 9 mM, spontaneous activity is suppressed (Yaari et al., 1986). Our model provides an explanation for the modulation of network epileptiform activity by [K+]o through its effect on single-cell dynamics. The increase of [K+]o increases the Nernst potential for potassium currents (Eq. 6), leading to membrane depolarization and increase of spiking frequency. It has been suggested that an epileptiform burst is generated when a group of local neurons fire at a sufficiently high rate to increase [K+]o above a threshold level. As [K+]o gradually increases, the average spiking rate of HPCs also increases, which, in turn, brings additional K+ ions into the extracellular space. Once [K+]o reaches the threshold, a seizure is initiated. Consistent with this hypothesis, pharmacological perturbations that effect neuronal excitability (e.g., firing rate) specifically modulate epileptiform event frequency (i.e., initiation rate; see Bikson et al., 1999).
Limitations of the model and future work
We have shown that our model with a simple compartmental structure and a reduced set of physiologically realistic active conductances in the soma are sufficient to account for important dynamic behaviors observed in vitro in CA1 HPCs in reduced-calcium solutions. The important contribution of small persistent sodium current, observed in the experiment by Azouz et al. (1996, 1997), Jensen et al. (1996), Li and Hatton (1996), and Su et al. (2001) is confirmed with the model. For simplicity of the model, only five relevant ionic currents are considered in the soma compartment. There are several other small currents that have been described in hippocampal CA1 cells but have not been included in the model (Brown et al., 1990). The incorporation of these small currents may not modify the overall model performance significantly, but could contribute to improve the fit for the action potentials.
Experimental and simulation data indicate that active dendritic conductances can play an important role in transmembrane activities in many aspects (Hoffman et al., 1997; Traub and Llinas, 1979; Traub et al., 1994; Cook and Johnston, 1997). In zero-[Ca2+]0 solution, the calcium currents and calcium-dependent potassium currents both in the soma and the dendrites are eliminated. Furthermore, other active channels are not considered in the dendritic compartments in this simple model. The most important dendritic currents are potassium channels similar to IA and a calcium channel. Clearly, the calcium channels are inactive in free-[Ca2+]0 solution and can be ignored in the present model. The role of the potassium channel is to limit the back-propagation of action potentials in dendrites, and to reduce synaptic events (Hoffman et al., 1997). Clearly this channel is important when describing events taking place in the dendrites. The hallmark of a good model is simplicity to ignore parameters not directly influencing the events to be studied. In our model the dendritic potassium conductances are ignored inasmuch as we are mainly interested in events taking place at the soma and not focusing on dendritic processing. In our model, the apical and basal dendrites are assumed to have the same conducting property. A more realistic CA1 model should consider a dendrite tree with different conducting properties for different branches (Traub et al., 1994; Cook and Johnston, 1997).
The neuron activity changes from firing pattern to bursting pattern during the lowering of [Ca2+]0, in association with a progressive decrease in the fast after-hyperpolarizing potential and an increase in size of the spike ADP (Su et al., 2001). So far, little information is available concerning how the steady-state curves of ionic channels are modified with the change of [Ca2+]0 solution. The CA1 model proposed by Warman et al. (1994) incorporated detailed in vitro voltage-clamp data. Based on this model, perfusion with zero-Ca2+ solution was modeled by elimination of calcium-dependent currents, leftward shifts of some activation curves, and increasing of the persistent sodium current. In our model, to best fit current clamp recording in reduced-Ca2+ solution, specific changes were further made for some current conductances (e.g., gNa, gA) and channel electric properties (e.g., h and a gates). A large time constant for persistent sodium current is predicted from our modeling results. Patch-clamp experiments should be able to test these predictions.
In low-calcium solution, activity in the CA1 region can synchronize and spread (Haas and Jefferys, 1984; Konnerth et al., 1984; Durand, 1993). In vitro, each low-Ca2+ epileptiform field burst is characterized by a large transient increase in extracellular potassium and a correlated tonic depolarization of the cell membrane lasting 2–15 s. How these extracellular potassium transients are initially generated, how they affect single-cell dynamics in a feed-forward manner, and how the electric fields generated by the nearby spiking neurons affects each single neuron's dynamics cannot be determined from a single-cell model. Both the electrophysiological measurement and the modeling results indicate that the intrinsic properties of the cells are sufficient to explain bursting and periodic activity in individual neurons. Network properties (gap junctions, electric fields, potassium diffusion) are not necessary to explain these behaviors, but are likely to be responsible for the synchronization and the propagation of the (nonsynaptic) activity at the network level.
Acknowledgments
The authors thank William C. Stacey for helpful discussions.
This work is supported by the Whitaker Foundation.
References
- Aghajanian, G. K., and K. Rasmussen. 1989. Intracellular studies in the facial nucleus illustrating a simple new method for obtaining viable motoneurons in adult-rat brain-slices. Synapse. 3:331–338. [DOI] [PubMed] [Google Scholar]
- Azouz, R., G. Alroy, and Y. Yaari. 1997. Modulation of endogenous firing patterns by osmolarity in rat hippocampal neurons. J. Physiol. 502:175–187. [DOI] [PMC free article] [PubMed] [Google Scholar]
- Azouz, R., M. S. Jensen, and Y. Yaari. 1996. Ionic basis of spike after-depolarization and burst generation in adult rat hippocampal CA1 pyramidal cells. J. Physiol. 492:211–223. [DOI] [PMC free article] [PubMed] [Google Scholar]
- Bernard, C., R. C. Cannon, Y. B. Ari, and H. V. Wheal. 1997. Model of septio-temporal propagation of action potentials in the Schaffer collateral pathway of the CA1 area of the rat hippocampus. Hippocampus. 7:58–72. [DOI] [PubMed] [Google Scholar]
- Bikson, M., R. S. Ghai, S. C. Baraban, and D. M. Durand. 1999. Modulation of burst frequency, duration, and amplitude in the zero-Ca2+ model of epileptiform activity. J. Neurophys. 82:2262–2270. [DOI] [PubMed] [Google Scholar]
- Bikson, M., J. Lian, P. J. Hahn, W. C. Stacey, C. Sciortino, and D. M. Durand. 2001. Suppression of epileptiform activity by high frequency sinusoidal fields in rat hippocampal slices. J. Physiol. 531:181–191. [DOI] [PMC free article] [PubMed] [Google Scholar]
- Brown, D. A., B. H. Gahwiler, W. H. Griffith, and J. A. Halliwell. 1990. Membrane currents in hippocampal neurons. Prog. Brain Res. 83:141–160. [DOI] [PubMed] [Google Scholar]
- Catterall, W. A. 1980. Neurotoxins that act on voltage-sensitive sodium channels in excitable membranes. Annu. Rev. Pharmacol. Toxicol. 20:15–43. [DOI] [PubMed] [Google Scholar]
- Cook, E. P., and D. Johnston. 1997. Active dendrites reduce location-dependent variability of synaptic input trains. J. Neurophysiol. 78:2116–2128. [DOI] [PubMed] [Google Scholar]
- Crill, W. E. 1996. Persistent sodium current in mammalian central neurons. Annu. Rev. Physiol. 58:349–362. [DOI] [PubMed] [Google Scholar]
- Durand, D. 1984. The somatic shunt cable model for neurons. Biophys. J. 46:645–653. [DOI] [PMC free article] [PubMed] [Google Scholar]
- Durand, D. 1993. Ictal patterns in experimental models of epilepsy. J. Clin. Neurophysiol. 10:281–297. [DOI] [PubMed] [Google Scholar]
- French, C. R., P. Sah, K. J. Buckett, and P. W. Gage. 1990. A voltage-dependent persistent sodium current in mammalian hippocampal neurons. J. Gen. Physiol. 95:1139–1157. [DOI] [PMC free article] [PubMed] [Google Scholar]
- Haas, H. L., and J. G. R. Jefferys. 1984. Low-calcium field burst discharges of CA1 pyramidal neurones in rat hippocampal slices. J. Physiol. 354:135–201. [DOI] [PMC free article] [PubMed] [Google Scholar]
- Hahn, P. J., and D. M. Durand. 2001. Bistable dynamics in simulations of neural activity in high extracellular potassium conditions. J. Comp. Neuro. 11:5–19. [DOI] [PubMed] [Google Scholar]
- Heinemann, U., S. Franceschetti, B. Hamon, A. Konnerth, and Y. Yaari. 1985. Effects of anticonvulsants on spontaneous epileptiform activity which develops in the absence of chemical synaptic transmission in hippocampal slices. Brain Res. 325:349–352. [DOI] [PubMed] [Google Scholar]
- Heinemann, U., A. Konnereth, R. Pumain, and W. J. Wadman. 1986. Extracellular calcium and potassium changes in chronic epileptic brain tissue. Adv. Neurol. 44:641–661. [PubMed] [Google Scholar]
- Heinemann, U., H. D. Lux, and M. J. Gutnick. 1977. Extracellular free calcium and potassium during paroxysmal activity in the cerebral cortex of the cat. Exp. Brain Res. 27:237–243. [DOI] [PubMed] [Google Scholar]
- Hille, B. 2001. Chapter 17. In Ionic Channels of Excitable Membranes. Sinauer Associates, Sunderland, MA.
- Hodgkin, A. L., and A. F. Huxley. 1952. A quantitative description of membrane current and its application to conduction and excitation in nerve. J. Physiol. 117:500–544. [DOI] [PMC free article] [PubMed] [Google Scholar]
- Hoffman, D. A., J. C. Magee, C. M. Colbert, and D. Johnston. 1997. K+ channel regulation of signal propagation in dendrites of hippocampal pyramidal neurons. Nature. 389:869–875. [DOI] [PubMed] [Google Scholar]
- Jefferys, J. G. R. 1995. Nonsynaptic modulation of neuronal activity in the brain: electric currents and extracellular ions. Physiol. Rev. 75:689–723. [DOI] [PubMed] [Google Scholar]
- Jensen, M. S., R. Azouz, and Y. Yaari. 1996. Spike after-depolarization and burst generation in adult rat hippocampal CA1 pyramidal cells. J. Physiol. 492:199–210. [DOI] [PMC free article] [PubMed] [Google Scholar]
- Kaczmarek, L. K., and W. R. Adey. 1975. Extracellular release of cerebral macromolecules during potassium- and low-calcium-induced seizures. Epilepsia. 16:91–97. [DOI] [PubMed] [Google Scholar]
- Kay, A. R., M. Sugimori, and R. Llinas. 1998. Kinetic and stochastic properties of a persistent sodium current in mature guinea pig cerebellar Purkinje cells. J. Neurophysiol. 80:1167–1179. [DOI] [PubMed] [Google Scholar]
- Konnerth, A., U. Heinemann, and Y. Yaari. 1984. Slow transmission of neural activity in hippocampal area CA1 in absence of active chemical synapses. Nature. 307:69–71. [DOI] [PubMed] [Google Scholar]
- Konnerth, A., U. Heinemann, and Y. Yaari. 1986. Nonsynaptic epileptogenesis in the mammalian hippocampus in vitro. I. Development of seizurelike activity in low extracellular calcium. J. Neurophysiol. 56:409–422. [DOI] [PubMed] [Google Scholar]
- Li, Z., and G. I. Hatton. 1996. Oscillatory bursting of phasically firing rat supraoptic neurons in low-Ca2+ medium: Na+ influx, cytosolic Ca2+ and gap junctions. J. Physiol. 496:379–394. [DOI] [PMC free article] [PubMed] [Google Scholar]
- Lian, J., M. Bikson, J. W. Shuai, and D. M. Durand. 2001. Propagation of nonsynaptic epileptiform activity across lesion in rat hippocampal slices. J. Physiol. 537:191–199. [DOI] [PMC free article] [PubMed] [Google Scholar]
- Perez-Velazquez, J. L., T. A. Valiante, and P. L. Carlen. 1994. Modulation of gap junctional mechanisms during calcium-free induced field burst activity: a possible role for electrotonic coupling in epileptogenesis. J. Neurosci. 14:4308–4317. [DOI] [PMC free article] [PubMed] [Google Scholar]
- Pinsky, P. F., and J. Rinzel. 1994. Intrinsic and network rhythmogenesis in a reduced Traub model for CA3 neurons. J. Comput. Neurosci. 1: 39–60. [DOI] [PubMed] [Google Scholar]
- Pumain, R., C. Menini, U. Heinemann, J. Louvel, and C. Silva-Barrat. 1985. Chemical synaptic transmission is not necessary for epileptic seizures to persist in the baboon Papio papio. Exp. Neurol. 89:250–258. [DOI] [PubMed] [Google Scholar]
- Somjen, G. G., and M. Muller. 2000. Potassium-induced enhancement of persistent inward current in hippocampal neurons in isolation and in tissue slices. Brain Res. 885:94–101. [DOI] [PubMed] [Google Scholar]
- Su, H., G. Alroy, E. D. Kirson, and Y. Yaari. 2001. Entracellular calcium modulates persistent sodium current-dependent burst-firing in hippocampal pyramidal neurons. J. Neurosci. 21:4173–4182. [DOI] [PMC free article] [PubMed] [Google Scholar]
- Taylor, C. P., and F. E. Dudek. 1982. Synchronous neural after discharges in rat hippocampal slices without chemical synapses. Science. 218:810–812. [DOI] [PubMed] [Google Scholar]
- Taylor, C. P., and F. E. Dudek. 1984. Synchronization without active chemical synapses during hippocampal after discharges. J. Neurophysiol. 52:143–155. [DOI] [PubMed] [Google Scholar]
- Traub, R. D., and R. Llinas. 1979. Hippocampal pyramidal cells: significance of dendritic ionic conductances for neuronal function and epileptogenesis. J. Neurophysiol. 42:476–496. [DOI] [PubMed] [Google Scholar]
- Traub, R. D., F. E. Dudek, C. P. Taylor, and W. D. Knowles. 1985. Simulation of hippocampal after discharges synchronized by electrical interactions. Neuroscience. 14:1033–1038. [DOI] [PubMed] [Google Scholar]
- Traub, R. D., R. K. S. Wong, R. Miles, and H. Michelson. 1991. A model of a CA3 hippocampal pyramidal neuron incorporating voltage-clamp data on intrinsic conductances. J. Neurophysiol. 66:635–650. [DOI] [PubMed] [Google Scholar]
- Traub, R. D., J. G. R. Jefferys, R. Miles, M. A. Whittington, and K. Toth. 1994. A branching dendritic model of a rodent CA3 pyramidal neuron. J. Physiology. 481:79–95. [DOI] [PMC free article] [PubMed] [Google Scholar]
- Ulbricht, W. 1990. The inactivation of sodium channels in the node of Ranvier and its chemical modification (Ch. 4). In Ion Channels, Vol. 2. T. Narahashi, editor. Plenum, New York. pp123–168. [DOI] [PubMed]
- Warman, E. N., D. M. Durand, and G. L. E. Yuen. 1994. Reconstruction of hippocampal CA1 pyramidal cell electrophysiology by computer simulation. J. Neurophysiol. 71:2033–2045. [DOI] [PubMed] [Google Scholar]
- Yaari, Y., A. Konnerth, and U. Heinemann. 1983. Spontaneous epileptiform activity of CA1 hippocampal neurons in low extracellular calcium solutions. Exp. Brain Res. 51:153–156. [DOI] [PubMed] [Google Scholar]
- Yaari, Y., A. Konnerth, and U. Heinemann. 1986. Nonsynaptic epileptogenesis in the mammalian hippocampus in vitro. II. Role of extracellular potassium. J. Neurophysiol. 56:424–438. [DOI] [PubMed] [Google Scholar]