

Abstract
The cell soma of primary sensory neurons is electrically excitable, and is invaded by action potentials as they pass from the peripheral nerve, past the dorsal root ganglion (DRG) and toward the spinal cord. However, there are virtually no synapses in the DRG, and no signal processing is known to occur there. Why, then, are DRG cell somata excitable? We have constructed and validated an explicit model of the primary sensory neuron and used it to explore the role of electrical excitability of the cell soma in afferent signaling. Reduction and even elimination of soma excitability proved to have no detectable effect on the reliability of spike conduction past the DRG and into the spinal cord. Through-conduction is affected, however, by major changes in neuronal geometry in the region of the t-junction. In contrast to through-conduction, excitability of the soma and initial segment is essential for the invasion of afferent spikes into the cell soma. This implies that soma invasion has a previously unrecognized role in the physiology of afferent neurons, perhaps in the realm of metabolic coupling of the biosynthesis of signaling molecules required at the axon ends to functional demand, or in cell-cell interaction within sensory ganglia. Spike invasion of the soma in central nervous system neurons may play similar roles.
INTRODUCTION
The cell soma of primary sensory neurons resides paraspinally in the dorsal root ganglion (DRG), and is attached midway along the conducting axon by a short stem axon. The resulting t-shaped bifurcation (“t-junction”) and “pseudounipolar” geometry creates a potential biophysical stumbling block for propagation of impulses from the periphery, past the DRG, and into the spinal cord, and hence constitutes a threat to veridical sensory signaling (Dun, 1955; Ito and Saiga, 1959; Luscher et al., 1994; Stoney, 1990). In this article, we consider the functional consequences of this peculiar pseudounipolar geometry (Fig. 1).
FIGURE 1.

Schematic diagram of our cell model. Normal internodes are indicated in black. Internodes close to the t-junction, that had tapering axon diameter and other abnormalities, are crosshatched (for details, see Methods). The first internode on the stem axon is barely visible due to its thin myelin sheath (Table 1). Note that axonal length and diameter are drawn using different calibrations scales. The soma is round.
The stem axon and t-junction appears to be a design meant to distance the (large) cell soma electrically from the axon, and hence to reduce the risk of propagation failure due to impedance mismatch and capacitative loading as the advancing spike traverses the DRG (Luscher et al., 1994; Zhou and Chiu, 2001). Indeed, several additional structural peculiarities in the t-junction area also serve to increase the safety factor of through-conduction. These include reduced axonal diameter near the bifurcation, the presence of short internodes and hence closely spaced nodes of Ranvier on the peripheral (nerve) and dorsal root (DR) axons on either side of the t-junction, and an extraordinarily large node at the t-junction itself (Ha, 1970; Spencer et al., 1973).
Because of the t-junction, the DRG cell soma does not participate directly in spike through-conduction. Moreover, synapses are virtually absent from the DRG and no synaptic processing occurs here. Classically, the soma is thought to serve exclusively as a metabolic depot supporting the conducting axon (Lieberman, 1976). Nonetheless, the soma membrane is in fact electrically excitable, and spikes propagating centrally are known to enter the stem axon and to invade the soma. These facts imply that spike invasion must confer a significant functional benefit(s) to the sensory neuron, as soma excitability carries significant metabolic costs. For example, soma invasion requires the synthesis and trafficking of voltage-sensitive ion channels, and extra ion pumping is required to maintain a stable transmembrane potential, even though these large round neurons have a relatively small surface-to-volume ratio. Furthermore, soma excitability permits some DRG neurons to fire spontaneously (Wall and Devor, 1983), a condition that surely degrades sensory signaling. Indeed, in the event of nerve injury, the barrage of ectopic impulses generated in the DRG may become massive, inducing sensory distortion and chronic neuropathic pain (Wall and Devor, 1983; Burchiel, 1984; Kajander et al., 1992). Also, there is good reason to believe that ectopic hyperexcitability in the DRG may be the main culprit in certain common clinical pain syndromes such as sciatica (Nordin et al., 1984; Kuslich et al., 1991). But if soma excitability does, in fact, provide an important functional benefit for DRG neurons, what is the nature of this benefit?
We are aware of only one hypothesis that has been put forward to date regarding this question. In 1984, Devor and Obermayer argued that excitability of afferent somata may constitute yet another specialization of the DRG for securing reliable spike propagation past the t-junction and into the spinal cord. They proposed that the inward current generated in the stem-axon and soma summates with the longitudinal intracytoplasmic current in the propagating axon, enhancing the reliability of through-conduction. However, as originally presented, Devor and Obermayer's (1984) conjecture was based mostly on intuition. In the present study we have used computational tools to explicitly test the hypothesis, and in general, to explore the role of electrical excitability of DRG neuronal somata in afferent signaling. Specifically, we developed a numerical model of the vertebrate primary sensory A-neuron, and used it to simulate the propagation of impulses from the periphery into the DR and the soma in the presence and absence of electrical excitability in the soma and stem axon.
MATERIALS AND METHODS
Results are based on numerical computations performed using the simulation environment NEURON (ver. 3.2.1b and 4.2.1; Hines and Carnevale, 1997; http://neuron.yale.edu).
Morphological parameters used in the model
Morphological parameters used are based primarily on Ito and Takahashi's detailed description of large diameter DRG neurons of the toad (Ito and Takahashi, 1960). Although most of the parameters required by NEURON were provided by these authors, some had to be obtained by extrapolation and a few details were based on studies of others (see below and Table 1). DRG neurons are pseudounipolar. That is, the soma gives rise to a stem axon, which bifurcates at the t-junction into peripheral (nerve) and central (DR) branches (Fig. 1). In our model the initial segment of the stem axon was unmyelinated, and this was followed by four short myelinated internodes (the first barely visible in Fig. 1) ending at the t-junction. Distal to the t-junction, along both the peripheral and central axon branches, the first three internodes were short, and these were followed by 30 consecutive internodes of “normal” length for a total of 33 internodes (Table 1).
TABLE 1.
Basic parameters used in the DRG model; morphological and electrophysiological
| Section of cell | Soma/Axon diameter (μm) | Length (μm) | Gm (μS/cm2) | Cm (μF/cm2) | No. of myelin wraps |
|---|---|---|---|---|---|
| Soma | 80 | 80 | Modified F&H | 1 | 0 |
| Stem axon | |||||
| Initial segment | 5 | 200 | Modified F&H | 1 | 0 |
| 1st heminode | 5 | 1.5 | F&H | 1 | 0 |
| 1st internode | 8 | 85 | 104.6 | 0.08 | 11 |
| 2nd node | 8 | 1.5 | F&H | 1 | 0 |
| 2nd internode | 8 | 130 | 17.9 | 0.014 | 69 |
| 3rd node | 8 | 1.5 | F&H | 1 | 0 |
| 3rd internode | 8 | 168 | 13.3 | 0.011 | 94 |
| 4th node | 8 | 1.5 | F&H | 1 | 0 |
| 4th internode | 8 | 201 | 8.8 | 0.007 | 142 |
| 5th node (at t-jct) | 8 | 1.5 | F&H | 1 | 0 |
| Central axonal branch | |||||
| 1st node (at t-jct) | 1.6 | 1.5 | F&H | 1 | 0 |
| 1st internode | 6.5 | 358 | 12.5 | 0.01 | 100 |
| 2nd node | 6.5 | 1.5 | F&H | 1 | 0 |
| 2nd internode | 6.7 | 780 | 13.1 | 0.01 | 95 |
| 3rd node | 6.7 | 1.5 | F&H | 1 | 0 |
| 3rd internode | 7.6 | 1170 | 12.5 | 0.01 | 100 |
| 4th node | 7.6 | 1.5 | F&H | 1 | 0 |
| 4th–33rd internode | 9.3* | 1450 | 11.2 | 0.009 | 111 |
| 5th–34th nodes | 9.3 | 1.5 | F&H | 1 | 0 |
| Peripheral axonal branch | |||||
| 1st node (at t-jct) | 2.6 | 1.5 | F&H | 1 | 0 |
| 1st internode | 8 | 461 | 9.2 | 0.007 | 136 |
| 2nd node | 8 | 1.5 | F&H | 1 | 0 |
| 2nd internode | 8.7 | 670 | 9.4 | 0.007 | 133 |
| 3rd node | 8.7 | 1.5 | F&H | 1 | 0 |
| 3rd internode | 10.1 | 1119 | 9.2 | 0.007 | 136 |
| 4th node | 10.1 | 1.5 | F&H | 1 | 0 |
| 4th–33rd internode | 12.5† | 1567 | 8.5 | 0.007 | 147 |
| 5th–34th nodes | 12.5 | 1.5 | F&H | 1 | 0 |
Gm, specific conductance of the myelin sheath. Cm, specific membrane capacitance. F&H, Frankenhaeuser and Huxley (1964).
Fiber diameter (including myelin), 13.3 μm.
Fiber diameter (including myelin), 17.8 μm.
In constructing the DRG model, parameters not provided explicitly by Ito and Takahashi (1960) were derived from their data as follows: Diameter of the central and peripheral axons was given only for the first internode (closest to the t-junction). Axon diameter of subsequent internodes was extrapolated based on the ratio of axon to fiber diameter, where fiber diameter includes the thickness of the myelin. This ratio was 0.64 for the first central internode, and 0.62 for the first peripheral internode. “Normal” internodes have an axon/fiber diameter ratio of 0.7 (Friede, 1972). The fourth internode along the central branch (counting from the t-junction) was explicitly described by Ito and Takahashi (1960) as having a fiber diameter of 13.3 μm and a length of 1450 μm. A “normal” DR (central branch) internode 1450 μm in length has an axon diameter of 9.3 μm (Berthold and Rydmark, 1995). Using 9.3 μm for axon diameter, and the fiber diameter provided (13.3 μm), the axon/fiber diameter ratio for the fourth internode is 0.70. This justifies our assumption that the fourth internode of Ito and Takahashi (1960) was in fact “normal,” and that its axon diameter was 9.3 μm. Accordingly, the remaining 29 “normal” internodes along the DR were assigned this same axon diameter. A similar approach was used to calculate axonal diameter of the 30 “normal” internodes of the peripheral nerve (Table 1). For both central and peripheral axon branches, axon diameter of the second and third internodes was derived from that of the first and fourth by linear interpolation.
The initial segment axon was thin (5 μm; Ito, 1959), and widened to 8 μm from the first internode to the t-junction (Ito and Takahashi, 1960; Spencer et al., 1973). The first heminode was set at 5 μm or ≅ 0.6 × the axon diameter of first internode (Ha, 1970; Spencer et al., 1973).
All regular nodes were 1.5 μm long, regardless of fiber diameter (Berthold and Rydmark, 1995), although the diameter of the node varied (Table 1). The t-junction itself resembles a large node of Ranvier (Ha, 1970). Its diameter connecting to the stem axon was the same as the stem axon. Connecting to the central axon branch, diameter was set at 0.25 × the axon diameter of the first internode of the central axonal branch (Ha, 1970). Connecting to the peripheral axon branch, diameter was set at 0.33 × the axon diameter of the first internode on the peripheral axonal branch (Ha, 1970). Values are given in Table 1.
Physiological parameters used in the model
NEURON requires both passive and active membrane parameters. These are given in Table 1. Data for nodes, and equations for the nodal action potential, are based on measurements from toad peripheral myelinated axons (Xenopus laevis) by Frankenhaeuser and Huxley (1964) as provided in the fh.mod file in the “Examples” directory of NEURON. These parameters were also adopted for modeling the soma, with some modifications as follows: the maximal Na+ ion permeability constant (pNamax+) used was 8 × 10⁻⁵ cm/s, two orders-of-magnitude less than at the node of Ranvier (Conti et al., 1976; Carbone and Lux, 1986; Campbell, 1992). This translates to an Na+ channel density of ∼10 channels/μm2 based on an estimated 1000 channels/μm2 in nodal membrane (Caffrey et al., 1992). pKmax+ was set to 3.5 × 10⁻⁵ cm/s, a value that produces a midrange of postspike after hyperpolarization amplitude derived from propagated spikes of toad DRG neurons (Ito, 1957). ppmax was set to zero. Finally, the leak conductance (gL) used was 0.0002 Mho/cm2, a value extracted from the linear I-V relation from toad DRG neurons during the injection of hyperpolarizing current (Ito, 1957). The membrane of the initial segment of the stem axon was assigned characteristics identical to that of the soma (Caffrey et al., 1992).
For all three myelinated axonal branches, stem, peripheral, and central, we assumed a passive internodal membrane and an active nodal membrane (Table 1). Specific membrane capacitance (Cm) of nonmyelinated segments (soma, initial segment, and nodes) was set at 1 μF/cm2 (Ito, 1957; Campbell, 1992). For myelinated axonal segments (internodes), Cm was calculated using the method of Moore et al. (1978) as: Cm = 1/(number of myelin wraps +1). Myelin thickness (i.e., the number of myelin wraps) was estimated as: N wraps = (fiber diameter − axon diameter)/(2 × thickness of each wrap), where wrap thickness was taken as 18 nm (Berthold and Rydmark, 1995). For example, for normal central internodes we calculated there to be 111 wraps, and for normal peripheral internodes 147 wraps (Table 1; Moore et al., 1978; Ritchie, 1984). These values are biologically appropriate (Berthold, 1978).
The specific conductance of the myelin sheath (Gm) of normal peripheral internodes was set at 8.5 μS/cm2 based on parameters provided by Ritchie (1984). For axonal segments with myelin thinner than in normal peripheral internodes (Table 1) Gm was proportionately larger by the factor: (147 + 1)/(actual number of wraps + 1). The values of Cm and Gm calculated for normal internodes were similar to those measured directly in amphibians (Stampfli and Hille, 1976). Specific resistance of the axoplasm (Ra) was set at 110 Ωcm for all neuronal compartments (Ito, 1959; Stampfli and Hille, 1976). Simulations were run at T = 20°C, except where otherwise noted.
Simulation procedures
We tested the effect of jointly changing soma and initial segment pNamax+ values on centripetally propagated spikes. Two stimulus pulses were applied to the peripheral axonal branch at the 20th node (see Fig. 1). Stimulus intensity for the first pulse was 2 × threshold. For the second pulse it was 2.5 × threshold, as this was the optimal intensity for evoking a second spike. Stimulus width was 0.2 ms. The time interval between the two pulses was varied systematically (see Results).
Stimuli were delivered under current clamp conditions. We used the Crank-Nicholson second order accuracy method for integration (dt = 0.01 ms). Finally, for calculation accuracy, we followed the rule of thumb that the number of segments (computational compartments) in each cell section (e.g., soma, initial segment, node, internode) be ≥section length/0.05λ (Luscher et al., 1994; Segev and Burke, 1998). Overall, our cell model was constructed of ∼500 computational compartments.
Recordings of impulses invading the soma, and traversing the axon en passant, were made at five points (R1–5 in Fig. 1), each providing particular information. The signal at R1 was used to confirm impulse initiation and to assess spike propagation along the peripheral branch; R2 assessed propagation past the t-junction and into the DR; R3 tracked spike propagation into the stem axon; R4 tracked invasion of the cell soma, and R5 confirmed spike arrival at the end of the central (DR) branch. Progress of the first spike of the pair gave a gross indication of the reliability of conduction. The second spike provided more subtle information on propagation security, and is particularly relevant to the normal mode of impulse commerce in primary sensory neurons, which is carried by repetitive impulse trains.
RESULTS
Validation of the model
We validated our model by comparing its output with previously published experimental and simulation data, mostly based on amphibians (especially toad) DRG neurons. Modules were tested (nodes and axon segments) as well as the entire cell model. Specific parameters of the model, notably temperature, were adjusted to match those used in the experiments.
Nodes of Ranvier
Bromm and Frankenhaeuser (1972) reported some characteristics of space clamped nodal membrane in a computational model based, like ours, on the equations and experimental constants from Frankenhaeuser and Huxley (1964). For comparison, we tested isolated nodes in our model. Results were fully compatible with those of Bromm and Frankenhaeuser (1972), including spike shape, threshold parameters, and firing frequencies during prolonged step stimuli (Table 2).
TABLE 2.
Nodal membrane parameters: comparison of present data with previously reported simulation data
| Parameter | Present study* | B&F | Difference (%) |
|---|---|---|---|
| Threshold for single spikes (current density, mA/cm2) | 0.3351 | 0.3422 | 2.1 |
| Threshold for spike doublets (mA/cm2) | 0.5374 | 0.55 | 2.3 |
| Threshold for sustained firing (mA/cm2) | 0.5754 | 0.58 | 0.8 |
Nodal diameter, 12.5 μm; and nodal length, 1.5 μm. In both studies T = 20°C, and prolonged current steps were used to find threshold.
Axon
A segment of peripheral myelinated axon from our model, consisting of internodes 4–33 (nodes 5–34, Table 1) was tested in isolation. Results are given in Table 3. Briefly, resting potential, spike parameters, conduction velocity and absolute refractory period (ARP) were similar to those recorded from myelinated axons. Rheobase for large mammalian myelinated axons is ∼0.75 nA at 37°C (Bostock et al., 1983). Running our model at 37°C, and reducing axon diameter to 6.7 μm to better approximate mammalian axons (Berthold and Rydmark, 1995), we obtained an identical value for rheobase. We are not aware of comparable data for amphibian axons.
TABLE 3.
Axonal membrane parameters: comparison of computed and experimentally measured values
| Parameter | Present study* | Experimental data, source, and species (mean ± SD) | Comparison |
|---|---|---|---|
| Resting potential (mV) | −69.82 | −64.61 ± 5.6 (H&S; F; frog) | p > 0.2 t-test |
| Spike amplitude (mV) | 106.27 | 109.72 ± 11.21 (H&S, F; frog) | p > 0.2 t-test |
| Spike threshold (mV depolarization) | 23.82 | 20.50 ± 5.0 (F; frog) | p > 0.2 t-test |
| Conduction velocity (m/s) | 19.61 | 2.55 to 35.19 (Wang et al., 1993); toad | Within range |
| ARP at 19°C (ms) | 2.47 | ∼2.4 (Tasaki, 1949); toad | Within range |
Modeled at 20°C to match experimental conditions except where indicated.
Entire cell model
Output of the full model was compared with published biological data obtained from toad DRG neurons. Results are given in Table 4. To summarize, spike shape and other parameters in our model resembled those reported by Ito (1957, 1959). The soma spike (recorded at R4) consisted of three components, named for their site of origin (Ito, 1957; see also Fig. 2). The M-spike originates in nodes of the myelinated segment of the t-stem axon, the NM-spike originates in the nonmyelinated segment of the t-stem axon (“initial segment”), and the S-spike is generated in the soma membrane. Consistent with experimental data (20°C; Stoney, 1990), the M-spike in our model merged with the rising phase of the NM-spike, and was hardly visible. Likewise, both in live cells (Ito, 1957), and in the simulation, when temperature is decreased the M-spike gradually separates from the NM-spike.
TABLE 4.
Soma membrane parameters: comparison of computed and experimentally measured values
| Parameter | Present study* | Experimental data species, T = °C (mean and/or range)† | Comparison |
|---|---|---|---|
| Resting potential (mV) | −69.86 (at 14.5°C) | −50 to −80 (toad, 9–20°C) | Within range |
| Spike amplitude (from baseline, mV) | 95.29 (14.5°C) | 80–125 (toad, 9–20°C) | Within range |
| Spike duration (at baseline, ms) | 4.07 (17.5°C) | 2.8 (1.2–4.1) (toad, 15–20°C) | Above mean, but within range |
| Spike dV/dt (rising phase, V/s) | 192.01 (17.5°C) | 319 (170–455) (toad, 15–20°C) | Below mean, but within range |
| Spike dv/dt (falling phase, V/s) | 71.62 (17.5°C) | 161 (58–275) (toad, 15–20°C) | Below mean, but within range |
| Rheobase (nA) | 1.28 (13.5°C) | 1.2 (0.6–2.2) (toad, 9–18°C) | Above mean, but within range |
| Spike threshold (mV depolarization) | 17.45‡ (13.5°C) | 17 (13.7–23) (toad, 9–18°C) | Near mean, within range |
| AHP amplitude (mV) | 3.61 (13.5°C) | 1–6 (toad, 9–18°C) | Within range |
| AHP duration (ms) | 20.03 (13.5°C) | 5–22 (toad, 9–18°C) | Within range |
| AHP time to peak (ms) | 1.68 (13.5°C) | 0.2–4 (toad, 9–18°C) | Within range |
| ARP on peripheral branch stimulation site (ms) | 5.3 (13.5°C) | 3.9 (2–6) (toad, 10–16°C) (Ito and Saiga, 1959) | Above mean, but within range |
FIGURE 2.

Soma-spike components. A stimulus pulse delivered to the 20th peripheral node (5 nA, 0.2 ms) evoked a full S-spike in the soma. Reducing pNamax+ in the soma and initial segment from 8 × 10⁻⁵ to 4 × 10⁻⁵ cm/s led to failure of spike invasion, leaving only an NM-spike residue. Note the inflection on the rising phase of the S-spike (arrow) which illustrates the NM component of the S-spike.
A spike was considered to have invaded the soma only when an S-spike was seen at R4. We defined the absolute refractory period (ARP) as the minimum interval between stimulus pulses (interpulse interval, IPI) at which the second spike continued to appear. Accordingly, we used the shortest interstimulus interval that evoked a second S-spike as the soma's ARP. The least conduction interval (LCI) was the interspike interval at the ARP, measured peak-to-peak (Ito and Saiga, 1959; Stoney, 1985, 1990). Both ARP and LCI were determined to 0.01-ms accuracy.
On pulse-pair stimulation of the peripheral axon branch, the soma response to the second spike became insecure when IPI became short (Ito and Saiga, 1959; Stoney, 1990). Both ARP and LCI values in the model agreed with the experimental data. For example, at 10–16°C, when the IPI was reduced to 2–6 ms, invasion of the S-spike evoked by the second stimulus failed suddenly, leaving a small residual NM- or M-spike. Failure occurred at this same IPI in the model (13.5°C, IPI = 5.2 ms, 22 mV NM-spike residue). Different results were obtained when stimuli were applied to the central (DR) branch. Here, when the S-spike abruptly failed, so did the NM- (and M-) spike (Ito and Saiga, 1959). This difference between the peripheral and central axon branches was also seen in the model. Finally, in the model as in live ganglia, the spike evoked by the first stimulus always successfully invaded the soma.
Effects of soma and initial segment excitability on spike through-conduction
Varying pNamax+ of the soma and initial segment did not have any noticeable effect on propagation of the first or the second spike into the central (DR) axon branch or on the ARP (R2 or R5 in Figs. 3 and 5), and had only minimal effects on the LCI at the t-stem and the central axonal branch (Figs. 3 and 5). This was so even when pNamax+ was set to zero. Correspondingly, there was no effect on ARP and LCI values in the peripheral axon branch (R1 in Figs. 3 and 5). As a result, ARP values were identical at R1, R2, R3, and R5, no matter what the value of pNamax+ in the soma and initial segment.
FIGURE 3.

Changing pNamax+ in the soma and initial segment does not affect spike propagation past the t-junction. A stimulus pulse pair was applied to the 20th peripheral node (first pulse marked with an arrow; IPI, 2.26 ms). Recordings were at R1, R2, and R5 (see Fig. 1). pNamax+ was 40 × 10−5 cm/s (A, “high”) or 0 cm/s (B). The hump on the falling phase of the second spike recorded at R2 (arrowhead in A) results from the associated soma spike, which was delayed in the case of the second stimulus pulse (also see Fig. 4). In B no soma spike was evoked by either stimulus pulse, and therefore no hump occurred.
FIGURE 5.
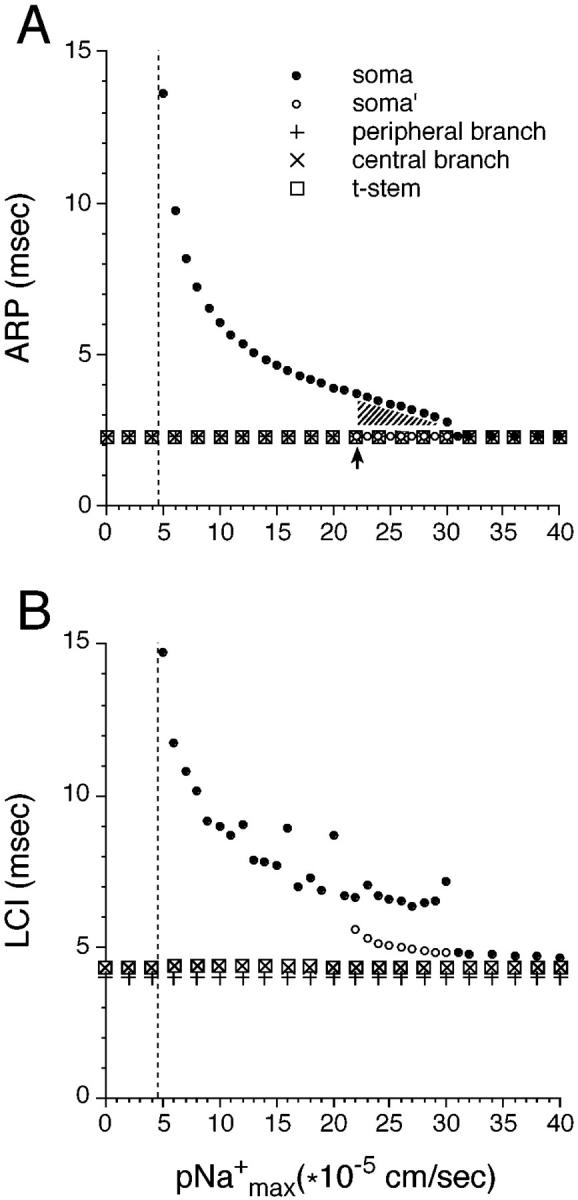
The effect of pNamax+ in the soma and initial segment on the absolute refractory period (ARP, A) and the corresponding least conduction interval (LCI, B) recorded in the soma (R4), peripheral axon branch (R1), central axon branch (R2) and the t-stem axon (R3). A stimulus pulse pair was applied to the 20th peripheral node. A), Except in the cell soma, ARP remained identical over the entire range of pNamax+ values. When pNamax+ was ≥22 × 10−5 cm/s ARP for the soma took this same value. The arrow indicates a discontinuity in the soma's ARP function (see Results). For pNamax+ ≤4.5 × 10⁻⁵ cm/s spikes failed to invade the soma (dashed line). B), As expected, the LCI followed the same general pattern as the ARP as pNamax+ was varied, but for soma spikes some values of LCI were chaotic. The physiological value of pNamax+ is ∼8 × 10⁻⁵ cm/s.
The central branch and t-stem had almost identical LCI values whatever value was used for pNamax+ in the soma and initial segment (Figs. 3 and 5). These were slightly increased compared to LCI values in the peripheral axon branch (R1). The difference was essentially unaffected by pNamax+ and presumably reflects the geometry of the t-junction area.
Effect of soma and initial segment excitability on spike invasion of the soma
Unlike through-conduction, spike invasion of the soma was considerably affected by changing somatic and initial segment pNamax+. This was reflected in changes of both ARP and LCI (Figs. 4 and 5). At high values of pNamax+ the second spike reliably invaded the soma with an ARP similar to that of the peripheral and central axon. However, when pNamax+ was reduced, the S-spike began to fail, leaving an NM-spike (R4 in Figs. 4 and 5). Spike invasion was restored only when the IPI was increased. This is illustrated in Fig. 5. The physiological value of pNamax+ is ∼8 × 10⁻⁵ cm/s (derived from Conti et al., 1976; Carbone and Lux, 1986; Campbell, 1992). When pNamax+ was reduced below this value ARP values rose sharply, reaching an asymptote at pNamax+ = 4.5 × 10⁻⁵ cm/s. This means that using pNamax+ = 4.5 × 10⁻⁵ cm/s or less, the second spike did not invade the soma no matter what the IPI. Naturally, this was also the value at which the first spike (or spikes evoked by individual stimulus pulses rather than pulse pairs) failed to invade the soma.
FIGURE 4.

Changing pNamax+ in the soma and initial segment dramatically affects spike invasion into the soma. A stimulus pulse pair was applied to the 20th peripheral node (IPI, 2.26 ms) and recordings were made near the t-junction (R2 and R3 in Fig. 1) and in the soma (R4 in Fig. 1). The first stimulus pulse is marked with an arrow in bottom trace. The ability of the spike to invade the soma (R4) is compromised as pNamax+ is reduced. At intermediate values of pNamax+ the first spike invaded the soma, but the second spike failed to invade. At lower values, even the first spike failed to invade. Arrowheads in traces R2 and R3 indicate a decremental signal, originating in the soma spike, that is still visible at these recording points near the t-junction. This signal is subthreshold for spike propagation, however, and was not recorded at R1 or R5 (Fig.1, data not shown). Note that using other parameters, the soma spike can generate a back-propagating “extra spike” as shown in Fig. 6. pNamax+ values are: low, 4 × 10⁻⁵ cm/s; medium, 8 × 10⁻⁵ cm/s; high, 24 × 10−5 cm/s.
Interestingly, increasing pNamax+ from 21 × 10−5 to 22 × 10−5 cm/s produced a stepwise change in the ARP function (arrow in Fig. 5 A), reflecting a true discontinuity as determined using tiny (0.01 cm/s) increments in pNamax+. The reason for the discontinuity is instructive. Using pNamax+ = 21.11 × 10⁻⁵ cm/s and IPI = 3.76 ms or larger, the spike successfully invaded the soma (R4 in Fig. 6). When pNamax+ was very slightly increased (to 21.12 × 10⁻⁵ cm/s), invasion of the soma (using IPI = 3.76 or larger) was basically unchanged. However, soma invasion now also occurred at IPI = 2.26 ms, which is the ARP of the axonal membrane (arrow in Fig. 5, dashed line in R4 of Fig. 6). Remarkably, however, using IPI between these two values (i.e., between 3.76 and 2.26 ms), the second spike failed to invade the soma (dash-dot line in R4 in Fig. 6). A further increase in the value of pNamax+ continued to yield two IPI domains that supported spike invasion: 1), a high ARP value that continued to decline from 3.76 ms (less a small decrement, Fig. 5 A, soma, solid circles), and 2), a lower ARP value, of 2.26 plus a small increment (Fig. 5 A, soma′, open circles). Invasion failure occurred between these domains (region marked with crosshatching in Fig. 5 A).
FIGURE 6.

Events underlying the discontinuity (arrow and crosshatched zone in Fig. 5), in the ARP for spike invasion of the soma. Two stimulus pulses were applied to the peripheral axon (see Fig. 1) and recordings were made from R1 and R4 (Fig. 1). Arrows indicate the time of the first stimulus pulse. Propagation velocity along the axon (R1), and the success of spike invasion into the soma (R4) depended on both pNamax+ and the IPI. Arrowheads in upper panel indicate “extra spikes” evoked by reflection (back-propagation) of the soma spike into the peripheral axon (Tagini and Camino, 1973). An extra spike also entered the central axon.
The explanation of this peculiar behavior is to be found at the stimulation site on the axon (R1 in Fig. 6). Increasing IPI slightly above 2.26 ms caused the second spike to propagate centrally along the axon more quickly than at IPI = 2.26 ms, due to the longer recovery time available to the axonal membrane. As a result, when the second spike reached the t-junction, it fell within the ARP for invasion of the soma, precluding spike invasion. To overcome this effect, it was necessary to significantly increase IPI to as much as 3.76 ms, or to materially increase pNamax+. For pNamax+ 31 × 10−5 cm/s these two domains fused at ARP = 2.26 ms. LCI recorded at the soma also increased with decreasing pNamax+, with values varying chaotically at pNamax+ values below 22 × 10−5 cm/s (Fig. 5 B). Unlike ARP, LCI in the soma was greater than that of the axon even at high values of pNamax+.
Sensitivity of spike through-conduction to other biophysical parameters of the model
Primary afferent neurons are functionally heterogeneous, and vary in their geometry as well as in their physiological properties. To test how sensitive our calculations are to the specific parameters used in the simulations, we varied several additional parameters of the cell model and tested for effects on through-conduction from the peripheral into the central axon branch. The main conclusions proved to be robust.
Soma and initial segment geometry
We systematically changed the geometry of the soma and of the initial segment within a wide range of values. Varying soma diameter from 5 μm to 200 μm, varying initial segment length from 1 μm to 2000 μm, or varying initial segment diameter from 1 μm to 20 μm (all without changing parameters of the stem axon, etc.), did not have any effect on the ARP for conduction past the t-junction, and only slightly increased the LCI. In each case, through-conduction and ARP remained unaffected when pNamax+ at the soma and initial segment was set to zero. Moreover, when values of these parameters that individually yielded the highest LCIs were combined (soma diameter = 90 μm; initial segment length = 1 μm, and initial segment diameter = 20 μm), through-conduction still occurred reliably both when pNamax+ was set at physiological levels and when it was set to zero.
Number of internodes in the stem axon
Another geometric parameter tested was length of the t-stem axon. We began by eliminating one internode, the fourth internode (the one closest to the t-junction), leaving other parameters unchanged. Through-conduction was not materially affected. We then eliminated two internodes (fourth and third) and finally three (fourth, third, and second), leaving only the shortest and thinnest internode (the one closest to the soma). Shortening the t-stem axon to two internodes did not have any effect on ARP, but it slightly increased LCI. Only when the stem axon was reduced to a single internode (the first) was there a significant increase in the ARP required for successful propagation of spikes past the t-junction (from 2.26 ms to 3.83 ms). Reducing the number of t-stem internodes places soma and initial segment impedance and capacitative loads, as well as their Na+ conductances, closer to the t-junction, a change that is expected to enhance their effects on through-conduction. Nonetheless, through-conduction and ARP were practically unaffected, even when pNamax+ was zeroed.
Temperature
All conductances in the model have nonzero temperature coefficients, and hence electrogenic parameters were sensitive to simulation temperature. Increasing temperature from 20°C to 40°C, or decreasing it to 5°C, altered both ARP and LCI in all three axonal branches. However, at each of these temperatures, setting pNamax+ of the soma and initial segment to zero did not prevent reliable through-conduction from the peripheral to the central axon branch, nor did it change ARP.
Simulating mammalian conditions
Our model was based on DRG neurons of the toad, rather than mammals, due to the availability of the biological parameters needed. A potentially critical difference between the two is the absence of voltage-sensitive K+ channels at mammalian nodes of Ranvier (Chiu et al., 1979; Brismar, 1980). To more closely approximate conditions in mammals, we set nodal pKmax+ to zero. This increased ARP from 2.26 ms to 3.80 ms. However, under these conditions, zeroing pNamax+ of the soma and initial segment still did not prevent reliable through-conduction, nor did it cause any further change in ARP. Continuing along these lines, we additionally set temperature in the model to 37°C. This also did not compromise through-conduction whether pNamax+ was set to physiological values, or to zero.
Adopting mammalian values for nodal gK+ and temperature (pKmax+ = 0, T = 37°C) we proceeded to set soma and initial segment geometrical parameters to the most stringent values identified above, based on maximal LCI (soma diameter = 90 μm; initial segment length = 1 μm; initial segment diameter = 20 μm). Reliable through-conduction persisted, with no effect on ARP, both before and after zeroing pNamax+. Even combining these parameters with a foreshortened stem axon did not substantially increase the sensitivity of through-conduction to reduced somatic and initial segment pNamax+. Specifically, in simulations using either three or two stem axon internodes, zeroing pNamax+ had essentially no effect on through-conduction, or on ARP (to an accuracy of 0.01 ms). Effects began to appear only when the stem axon was shortened to one internode. Using one internode (the first), increasing soma diameter to 90 μm was tolerated, even after zeroing pNamax+. However, large changes in initial segment length or diameter led to a block of spike propagation past the t-junction, even at physiological values of pNamax+ and using single stimulus pulses. Through-conduction appears to be more sensitive to neuronal geometry than it is to soma and initial segment excitability.
This is in sharp contrast to soma invasion. In all of the simulations noted above, zeroing pNamax+ of the soma and initial segment prevented spike invasion of the soma, even for single-pulse stimuli.
DISCUSSION
We developed a computational model of the vertebrate DRG A-neuron and used it to examine a series of specific questions concerning sensory signaling in the peripheral nervous system (PNS), questions that are basically inapproachable using electrophysiological recording from live tissue. In the simulation we attempted to capture as closely as possible the detailed geometry of the cell soma, the stem axon, the t-junction bifurcation, and both the peripheral (nerve) and the central (DR) axonal segments. The assembled model was tested for its ability to produce outputs that matched published biological data on the behavior of the neurons modeled. In fact, it reproduced in considerable quantitative detail key electrophysiological parameters of live DRG neurons. This gives us confidence that it also reliably simulates conditions not accessible experimentally. Finally, the model was used to simulate propagation of impulses from the periphery into the DR and the cell soma. We were particularly interested in whether spike through-conduction from the periphery to the central nervous system (CNS) is sensitive to alterations in the electrical excitability of the soma and initial segment axon.
Although some of the elements of our model, including myelinated axons and bifurcations, have been the subject of earlier simulation studies (e.g., Barrett and Barrett, 1982; Goldman and Albus, 1968; Moore et al., 1978; Hines and Shrager, 1991; Luscher et al., 1994; Parnas, 1979; Villiere and McLachlan, 1996; Zhou and Chiu, 2001), we are not aware of any other detailed models of an entire (myelinated) DRG neuron. Our model was based on morphological and electrical data derived from the toad by Ito and Takahashi (1960) and Frankenhaeuser and Huxley (1964), with certain extensions. Amphibian, rather than mammalian, neurons were modeled due to the availability of the requisite biological parameters. However, we showed that the basic outcomes remained unchanged when key parameters corresponding to mammalian DRG neurons were substituted for those of the toad. Channels under the compact myelin were not considered as they are effectively sealed by paranodal loops except under extreme regimens of activity that are not relevant to the current simulations. Finally, our model refers to DRG neurons with myelinated axons. Results might be different in unmyelinated, or demyelinated, neurons.
Spike through-conduction, and spike invasion of the soma
Two specific questions were asked in this study. The first was whether the safety of impulse conduction from the peripheral nerve, past the DRG, and into the DR and spinal cord is materially affected by the degree of electrical excitability of the cell soma and initial axon segment. The answer was unequivocally no. This outcome undermines the hypothesis of Devor and Obermayer (1984) that somatic excitability is a design compromise required to ensure reliable afferent spike propagation past the DRG. We note that our conclusion does not depend on the specific combination of Na+ channel subtypes normally present in the neuron because through-conduction was preserved even when somatic Na+ conductance was eliminated completely. When the length of the stem axon was considerably shortened, bringing the electrical load of the soma close to the t-junction, the effects of this load on through-conduction did begin to be felt. However, even under these conditions the reliability of propagation past the t-junction was essentially unaffected by the value of pNamax+ in the soma and initial segment.
This answer to the first question led directly to the second question: is excitability of the soma and initial segment essential for spike invasion of the DRG cell soma itself? Here, the answer was unequivocally yes. Reducing excitability (pNamax+) first degraded spike invasion as indicated by an increase in the ARP for spike pairs. In vivo, this is expected to reduce the frequency-following ability of the soma, and under certain conditions to introduce extra, ectopic, spikes (Tagini and Camino, 1973; Amir and Devor, 2003). Ultimately, soma invasion of individual spikes was also blocked. Spike invasion proved to be dependent on excitability of the soma and initial segment under a variety of biophysical perturbations. We did not comprehensively test the robustness of soma spike invasion in the face of geometric and temperature changes using a range of intermediate values for soma excitability, as reliable invasion is a biological fact, in vivo, in DRG neurons of all types.
Soma and initial segment excitability may be a default condition of the neuronal membrane with no specific functional role. We note, however, that there are at least two associated costs. There is a metabolic cost, the need to synthesize and insert appropriate voltage-sensitive channels and to maintain the resting membrane potential in face of ion flows that occur during soma spiking. There is also a cost in terms of signal degradation due to ectopic spiking. Moreover, neurons are generally well capable of regional control over their membrane excitability. The default argument, that DRG neurons cannot do any better, is a weak one a priori. These considerations make it rational to speculate about nonclassical benefits that the neuron may derive from spike invasion of the soma (Devor, 1999).
Functional contributions of spike invasion of the soma
In the intact DRG, primary sensory neurons need to closely regulate the sensitivity of their peripheral sensory ending. Large diameter (A-) neurons, of the type considered here, must maintain stable low-threshold mechanoreceptor properties at their sensory transducer endings in the periphery. Likewise, nonmyelinated C-neurons must maintain the transduction sensitivity of their nociceptive ends. Faulty regulation of receptor excitability undermines the stimulus selectivity of the afferent, and hence the signaling role of the afferent system as a whole.
The transduction and impulse encoding properties of the neuron depend on precise control of the type and density of specific macromolecules present in the neuronal membrane at the sensory ending. The macromolecules involved, transducer proteins, receptors, and voltage-sensitive ion channels, are all large polypeptides that are synthesized in the DRG cell soma and transported down to the end of the axon in vesicular vectors in the axoplasmic freight. Moreover, the creation of the transduction/encoding apparatus at the sensory axon end is not a one-time event. Each of the proteins involved has a limited half-life (usually hours or days), and undergoes continual turnover. Membrane Na+ channels, for example, are thought to be replaced about every three days, on average (Schmidt and Catterall, 1986). This means that their rate of synthesis, transport, and incorporation into the membrane at the sensory ending, and their ultimate reuptake, must be precisely regulated on an ongoing basis. An excess or deficit in the supply of one of these molecules would alter the sensory coding properties of the afferent, and hence alter sensory signaling.
It is unlikely that the regulation of sensory ending excitability is accomplished in an open-loop mode, that is, without feedback about the ongoing level of excitability. The reason is that stability of the transduction/encoding process must be maintained over very long periods of time (a lifetime) under conditions where numerous associated factors are in constant flux. For example, minor inflammation in the skin triggers increased expression and retrograde transport of neurotrophic factors including nerve growth factor. Nerve growth factor, in turn, is known to upregulate the synthesis of Na+ channels in DRG neurons (e.g., Gould et al., 1998; Tanaka et al., 1998). In all instances where biological parameters are homeostatically regulated, some sort of feedback signal is available that tells the synthetic machinery when its product is needed in greater abundance and when delivery can be reduced.
We suggest that for afferent A-neurons, the regulatory feedback signal might be provided by ongoing sensory impulse traffic. For this to work, however, the spike would have to propagate along the t-stem axon and into the cell soma. If a neuron fired more over a particular integration epoch than mandated by an intrinsic setpoint, for example, the soma would reduce the sensitivity of the sensory ending by modulating the synthesis and transport of those transducer and voltage-sensitive channel proteins that determine afferent excitability. Likewise, if spike activity integrated over this time window were low, the cell would respond by increasing the excitability of the sensory ending. There are a number of examples in which impulse traffic during development has been shown to exert metabolic control on neurons, including sensory afferents (Fields, 1996; Hyman, 1996). Our simulation results support the inference that this principle extends to the ongoing regulation of afferent excitability in adulthood. Electrical excitability of the soma and initial segment, by this line of reasoning, is a crucial necessity in such a feedback mechanism and hence, an essential component of the functioning of the sensory neuron as a whole.
A second possible role of spike invasion of afferent somata is DRG cross-excitation. Although there are virtually no synapses in the DRG, DRG neurons are nonetheless functionally linked to one another. Specifically, activity in some neurons in the ganglion depolarizes and excites passive neighbors (Utzschneider et al., 1992; Devor and Wall, 1990; Amir and Devor, 1996). The coupling is mediated by a novel mechanism whereby a still unidentified neurotransmitter substance(s) is released nonsynaptically into the bulk extracellular space. Elevated [K+]o may also contribute. The role of cross-excitation in the DRG is unknown, although one speculation is that this type of neuron-to-neuron coupling might be needed for feedback regulation of receptor excitability in afferent nociceptors (Devor, 1999). Nociceptors, particularly those innervating deep tissues and viscera, may not fire at all for very long periods of time. However, they must nonetheless regulate their excitability so that they can reliably respond to rare, noxious stimuli. Whatever the functional role of cross-excitation within DRGs, spike invasion of the cell soma is obviously an essential prerequisite.
Finally, the functional role of somatic excitability in DRG neurons may relate to intraganglionic spike initiation (electrogenesis) rather than to response to impulse traffic generated at peripheral sensory endings. DRG neurons are essentially devoid of synaptic inputs. However, their membrane bears a rich variety of molecular receptors, and they can respond with a locally generated impulse discharge to a variety of substances injected into the systemic circulation (e.g., Amir and Devor, 1996). Most remarkably, unlike the rest of the PNS, the DRG is not protected by a blood-nerve barrier (see Devor, 1999). In the CNS, windows in the blood-brain-barrier are thought to serve a chemosensory function. By analogy, the excitability of DRG neurons may reflect a previously unsuspected chemosensory or paracrine role played by sensory ganglia.
Significance for other types of neurons
Our study was motivated by the observation that the peculiar geometry of DRG neurons might undermine their functional role as reliable sensory communication channels. Physiological intuition led to the suggestion that nature overcomes the risk of conduction block at the t-junction by making the soma and initial segment electrically excitable (Devor and Obermayer, 1984). However, as shown here, this idea does not hold up in light of quantitative modeling of the neurons in question. Electrical excitability of the soma and initial segment is not necessary for through-conduction. Rather, we found that it makes a very different contribution: promotion of spike invasion into the cell soma. This result, which derives from strictly biophysical considerations, constitutes a challenge to biologists. It is necessary now to discover the functional role of spike invasion, a fundamental question in sensory physiology that, to the best of our knowledge, has never been addressed.
The DRG neuron is a convenient testbed for this and related questions because of its characteristic geometry and lack of synaptic input. We note, however, that if spike invasion of somata in the DRG has a significant functional (metabolic?) role in the normal physiology of the neuron, somatic invasion may well play a similar role in the biology of the numerous other neuronal types in the PNS and the CNS which support soma spikes. Soma spiking and associated back-propagation into the dendritic tree has been discussed extensively in recent years in the context of cortical signal processing (e.g., Stuart et al., 1997). This idea may not capture its full importance.
Acknowledgments
This work was supported by grants from the German-Israel Foundation for Research and Development, the Charles Smith Family National Institute for Psychobiology in Israel, and the Hebrew University Center for Research on Pain.
References
- Amir, R., and M. Devor. 2003. Extra spike formation in sensory neurons and the disruption of afferent spike patterning. Biophys. J. 84:2700–2708. [DOI] [PMC free article] [PubMed] [Google Scholar]
- Amir, R., and M. Devor. 1996. Chemically-mediated cross-excitation in rat dorsal root ganglia. J. Neurosci. 16:473–474. [DOI] [PMC free article] [PubMed] [Google Scholar]
- Barrett, E. F., and J. N. Barrett. 1982. Intracellular recording from vertebrate myelinated axons: mechanism of the depolarizing afterpotential. J. Physiol. (Lond.). 323:117–144. [DOI] [PMC free article] [PubMed] [Google Scholar]
- Berthold, C.-H. 1978. Morphology of normal peripheral axons. In Physiology and Pathobiology of Axons. S. G. Waxman, editor. Raven Press, New York. pp. 3–63.
- Berthold, C.-H., and M. Rydmark. 1995. Morphology of normal peripheral axons. In The Axon. S. G. Waxman, J. D. Kocsis, and P. K. Stys, editors. Oxford University Press, London. pp. 13–48.
- Bostock, H., T. A. Sears, and R. M. Sherratt. 1983. The spatial distribution of excitability and membrane current in normal and demyelinated mammalian nerve fibers. J. Physiol. (Lond.). 341:41–58. [DOI] [PMC free article] [PubMed] [Google Scholar]
- Brismar, T. 1980. Potential clamp analysis of membrane currents in rat myelinated nerve fibers. J. Physiol. (Lond.). 298:171–184. [DOI] [PMC free article] [PubMed] [Google Scholar]
- Bromm, B., and B. Frankenhaeuser. 1972. Repetitive discharge of the excitable membrane computed on the basis of voltage clamp data for the node of Ranvier. Pflugers Arch. 332:21–27. [PubMed] [Google Scholar]
- Burchiel, K. J. 1984. Effects of electrical and mechanical stimulation on two foci of spontaneous activity which develop in primary afferent neurons after peripheral axotomy. Pain. 18:249–265. [DOI] [PubMed] [Google Scholar]
- Caffrey, J. M., D. L. Eng, J. A. Black, S. G. Waxman, and J. D. Kocsis. 1992. Three types of sodium channels in adult rat dorsal root ganglion neurons. Brain Res. 592:283–297. [DOI] [PubMed] [Google Scholar]
- Campbell, D. T. 1992. Large and small vertebrate sensory neurons express different Na and K channel subtypes. Proc. Natl. Acad. Sci. USA. 89:9569–9573. [DOI] [PMC free article] [PubMed] [Google Scholar]
- Carbone, E., and H. D. Lux. 1986. Sodium channels in cultured chick dorsal root ganglion neurons. Eur. Biophys. J. 13:259–271. [Google Scholar]
- Chiu, S. Y., J. M. Ritchie, R. B. Rogart, and D. Stagg. 1979. A quantitative description of membrane currents in rabbit myelinated nerve. J. Physiol. (Lond.). 292:149–166. [DOI] [PMC free article] [PubMed] [Google Scholar]
- Conti, F., B. Hille, B. Neumcke, W. Wonner, and R. Stampfli. 1976. Conductance of the sodium channel in myelinated nerve fibers with modified sodium inactivation. J. Physiol. (Lond.). 262:729–742. [DOI] [PMC free article] [PubMed] [Google Scholar]
- Devor, M. 1999. Unexplained peculiarities of the dorsal root ganglion. Pain. (Suppl. 6):S27–S35. [DOI] [PubMed] [Google Scholar]
- Devor, M., and M.-L. Obermayer. 1984. Membrane differentiation in rat dorsal root ganglia and possible consequences for back pain. Neurosci. Lett. 51:341–346. [DOI] [PubMed] [Google Scholar]
- Devor, M., and P. D. Wall. 1990. Cross excitation among dorsal root ganglion neurons in nerve injured and intact rats. J. Neurophysiol. 64:1733–1746. [DOI] [PubMed] [Google Scholar]
- Dun, F. T. 1955. The delay and blockage of sensory impulses in the dorsal root ganglion. J. Physiol. (Lond.). 127:252–264. [DOI] [PMC free article] [PubMed] [Google Scholar]
- Fields, R. D. 1996. Signaling from neural impulses to genes. Neuroscientist. 2:315–325. [PMC free article] [PubMed] [Google Scholar]
- Frankenhaeuser, B. 1957. A method for recording resting and action potentials in the isolated myelinated nerve fibre of the frog. J. Physiol. (Lond.). 135:550–559. [DOI] [PMC free article] [PubMed] [Google Scholar]
- Frankenhaeuser, B., and A. F. Huxley. 1964. The action potential in the myelinated nerve fiber of Xenopus laevis as computed on the basis of voltage clamp data. J. Physiol. (Lond.). 171:302–315. [DOI] [PMC free article] [PubMed] [Google Scholar]
- Friede, R. L. 1972. Control of myelin formation by axon caliber (with a model of the control mechanism). J. Comp. Neurol. 144:233–252. [DOI] [PubMed] [Google Scholar]
- Goldman, L., and J. S. Albus. 1968. Computation of impulse conduction in myelinated fibers: theoretical basis of the velocity-diameter relation. Biophys. J. 8:596–607. [DOI] [PMC free article] [PubMed] [Google Scholar]
- Gould, H., Jr., J. D. England, Z. P. Liu, and S. R. Levinson. 1998. Rapid sodium channel augmentation in response to inflammation induced by complete Freund's adjuvant. Brain Res. 802:69–74. [DOI] [PubMed] [Google Scholar]
- Ha, H. 1970. Axonal bifurcation in the dorsal root ganglion of the cat: a light and electron microscopic study. J. Comp. Neurol. 140:227–240. [DOI] [PubMed] [Google Scholar]
- Hines, M. L., and N. T. Carnevale. 1997. The NEURON simulation environment. Neural Comput. 9:1179–1209. [DOI] [PubMed] [Google Scholar]
- Hines, M., and P. Shrager. 1991. A computational test of the requirements for conduction in demyelinated axons. Restorative Neurol. Neurosci. 3:81–93. [DOI] [PubMed] [Google Scholar]
- Huxley, A. F., and R. Stampfli. 1951. Direct determination of membrane resting potential and action potential in single myelinated nerve fibers. J. Physiol. (Lond.). 112:476–495. [DOI] [PMC free article] [PubMed] [Google Scholar]
- Hyman, S. E. 1996. Regulation of gene expression by neural signals. Neuroscientist. 2:217–224. [Google Scholar]
- Ito, M. 1957. The electrical activity of spinal ganglion cells investigated with intracellular microelectrodes. Jap. J. Physiol. 7:297–323. [DOI] [PubMed] [Google Scholar]
- Ito, M. 1959. An analysis of potentials recorded intracellularly from the spinal ganglion cell. Jap. J. Physiol. 9:20–32. [DOI] [PubMed] [Google Scholar]
- Ito, M., and M. Saiga. 1959. The mode of impulse conduction through the spinal ganglion. Jap. J. Physiol. 9:33–42. [DOI] [PubMed] [Google Scholar]
- Ito, M., and I. Takahashi. 1960. Impulse conduction through spinal ganglion. In Electrical Activity of Single Cells. Y. Katsuki, editor. Igakushoin, Tokyo. pp. 159–179.
- Kajander, K. C., S. Wakisaka, and G. J. Bennett. 1992. Spontaneous discharge originates in the dorsal root ganglion at the onset of a painful peripheral neuropathy in the rat. Neurosci. Lett. 138:225–228. [DOI] [PubMed] [Google Scholar]
- Kuslich, S. D., C. L. Ulstrom, and C. J. Michael. 1991. The tissue origin of low back pain and sciatica. Orth. Clin. N.A. 22:181–187. [PubMed] [Google Scholar]
- Lieberman, A. R. 1976. Sensory ganglia. In The Peripheral Nerve. D. N. Landon, editor. Chapman and Hall, London. pp. 188–278.
- Luscher, C., J. Streit, R. Quadroni, and H.-R. Luscher. 1994. Action potential propagation through embryonic dorsal root ganglion cells in culture. I. Influence of cell morphology on propagation properties. J. Neurophysiol. 72:622–633. [DOI] [PubMed] [Google Scholar]
- Moore, J. W., R. W. Joyner, M. H. Brill, S. D. Waxman, and M. Najar-Joa. 1978. Simulation of conduction in uniform myelinated fibers. Biophys. J. 21:147–160. [DOI] [PMC free article] [PubMed] [Google Scholar]
- Nordin, M., B. Nystrom, U. Wallin, and K.-E. Hagbarth. 1984. Ectopic sensory discharges and paresthesiae in patients with disorders of peripheral nerves, dorsal roots and dorsal columns. Pain. 20:231–245. [DOI] [PubMed] [Google Scholar]
- Parnas, I. 1979. Propagation in nonuniform neurites: form and function in axons. In The Neurosciences. F. D. Schmitt, and F. G. Worden, editors. MIT Press, Boston, MA. pp. 499–512.
- Ritchie, J. M. 1984. Physiological basis of conduction in myelinated nerve fibers. In Myelin. P. Morrel, editor. Plenum Press, New York. pp. 117–145.
- Schmidt, J. W., and W. A. Catterall. 1986. Biosynthesis and processing of the IL-50.82 IR-50.82 SZ-10 subunit of the voltage-sensitive sodium channel in rat brain IL-0 IR-0 neurons. Cell. 46:437–445. [DOI] [PubMed] [Google Scholar]
- Segev, I., and R. E. Burke. 1998. Compartmental models of complex neurons. In Methods in Neuronal Modeling: From Ions to Networks. C. Koch, and I. Segev, editors. MIT Press, London. pp. 93–136.
- Spencer, P., C. S. Raine, and H. Wisniewski. 1973. Axon diameter and myelin thickness—unusual relationship in dorsal root ganglia. Anat. Rec. 176:225–244. [DOI] [PubMed] [Google Scholar]
- Stampfli, R., and B. Hille. 1976. Electrophysiology of the peripheral myelinated nerve. In Frog Neurobiology. R. Llinas, and W. Precht, editors. Springer Verlag, Berlin. pp. 3–32.
- Stoney, S. D. 1985. Unequal branch point filtering action in different types of dorsal root ganglion neurons of frogs. Neurosci. Lett. 59:15–20. [DOI] [PubMed] [Google Scholar]
- Stoney, S. D. 1990. Limitation on impulse conduction at the branch point of afferent axons in frog dorsal root ganglion. Exp. Brain Res. 80:512–524. [DOI] [PubMed] [Google Scholar]
- Stuart, G., J. Schiller, and B. J. Sakmann. 1997. Action potential initiation and propagation in rat neocortical pyramidal neurons. J. Physiol. (Lond.). 505:617–632. [DOI] [PMC free article] [PubMed] [Google Scholar]
- Tagini, G., and E. Camino. 1973. T-shaped cells of dorsal ganglia can influence the pattern of afferent discharge. Pflugers Arch. 344:339–347. [DOI] [PubMed] [Google Scholar]
- Tanaka, M., T. R. Cummins, K. Ishikawa, S. D. Dib-Hajj, J. A. Black, and S. Waxman. 1998. SNS Na+ channel expression increases in dorsal root ganglion neurons in the carrageenan inflammatory pain model. Neuroreport. 9:967–972. [DOI] [PubMed] [Google Scholar]
- Tasaki, I. 1949. The excitatory and recovery processes in the nerve fibre as modified by temperature changes. Biochim. Biophys. Acta. 3:498–509. [Google Scholar]
- Utzschneider, D., J. Kocsis, and M. Devor. 1992. Mutual excitation among dorsal root ganglion neurons in the rat. Neurosci. Lett. 146:53–56. [DOI] [PubMed] [Google Scholar]
- Villiere, V., and E. M. McLachlan. 1996. Electrophysiological properties of neurons in intact rat dorsal root ganglia classified by conduction velocity and action potential duration. J. Neurophysiol. 76:1924–1941. [DOI] [PubMed] [Google Scholar]
- Wall, P. D., and M. Devor. 1983. Sensory afferent impulses originate from dorsal root ganglia as well as from the periphery in normal and nerve injured rats. Pain. 17:321–339. [DOI] [PubMed] [Google Scholar]
- Wang, G. D., Q. P. Pan, and Z. W. Li. 1993. Electrophysiological and relevant morphological properties of neurons in toad dorsal root ganglion. J. Tongji Med. Univ. 13:93–99. [DOI] [PubMed] [Google Scholar]
- Zhou, L., and S. Y. Chiu. 2001. Computer model for action potential propagation through branch point in myelinated nerves. J. Neurophysiol. 85:197–210. [DOI] [PubMed] [Google Scholar]