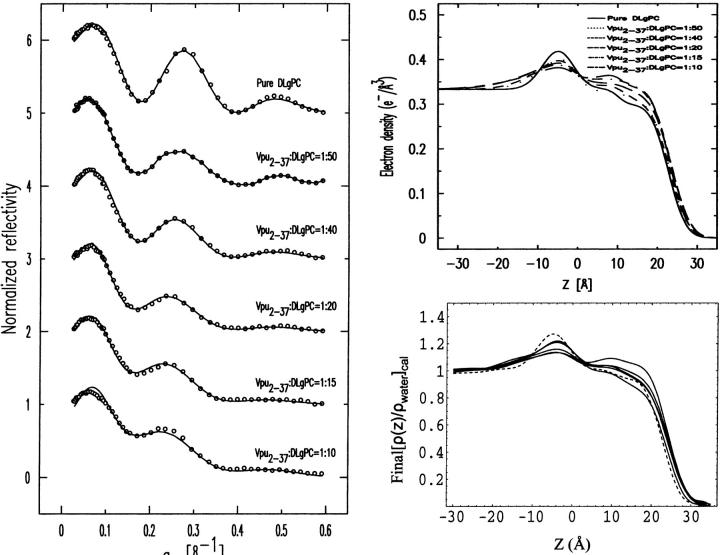
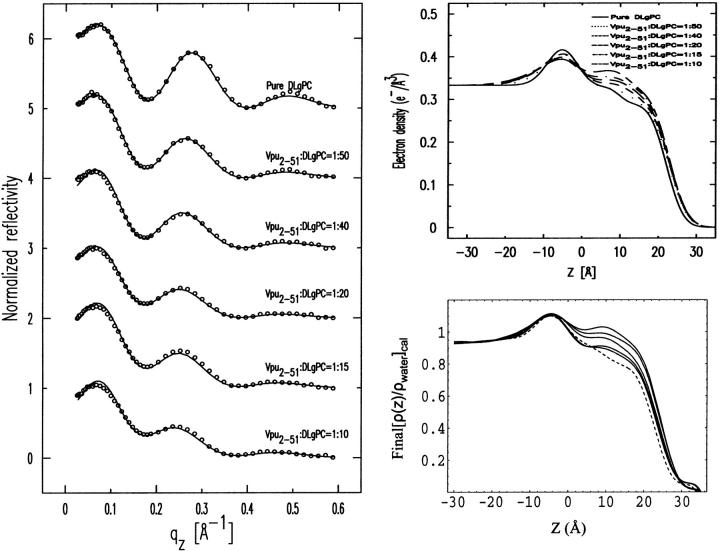
Abstract
Vpu is an 81-residue HIV-1 accessory protein, its transmembrane and cytoplasmic domains each responsible for one of its two functions. Langmuir monolayers of phospholipid incorporating a membrane protein with a unidirectional vectorial orientation, on a semiinfinite aqueous subphase, provide one “membranelike” environment for the protein. The cytoplasmic domain's interaction with the surface of the phospholipid monolayer in determining the tertiary structure of the peptide within the monolayer was investigated, employing a comparative structural study of Vpu with its submolecular fragments Tm and TmCy truncated to different extents in the cytoplasmic domain, via synchrotron x-ray scattering utilizing a new method of analysis. Localizations of the transmembrane and cytoplasmic domains within the monolayer profile structure were similar for all three proteins, the hydrophobic transmembrane helix within the hydrocarbon chain region tilted with respect to the monolayer plane and the helices of the cytoplasmic domains lying on the surface of the headgroups parallel to the monolayer plane. The thickness of the hydrocarbon chain region, determined by the tilt of the hydrocarbon chains and transmembrane domain with respect to the monolayer plane, was slightly different for Tm, TmCy, and Vpu systematically with protein/lipid mole ratio. Localization of the helices in the cytoplasmic domains of the three proteins relative to the headgroups depends on their extents and amphipathicities. Thus, the interaction of the cytoplasmic domain of Vpu on the surface may affect the tilt of the transmembrane helix within the hydrocarbon chain region in determining its tertiary structure in the membrane.
INTRODUCTION
The human immunodeficiency virus type 1 (HIV-1) genome encodes six accessory proteins (Emerman and Malim, 1998). Vpu, one of those accessory proteins, is an 81-amino acid phosphoprotein with an N-terminal extremely hydrophobic domain containing 27 residues, and a C-terminal hydrophilic domain containing 51 residues with a high number of charged polar amino acids. The hydrophobic domain is mostly a single 23-residue α-helix (Schubert et al., 1996), whereas a minimum of 20 residues and a maximum of 32 residues in the cytoplasmic domain occur within a well-ordered α-helical form comprising two to three separate amphipathic helices, depending on the experimental conditions (Wray et al., 1995; Federau et al., 1996; Willbold et al., 1997). Vpu1–81 is phosphorylated by endogenous casein kinase-2 at residues Ser52 and Ser56 within its hydrophilic domain in HIV-1 infected cells (Schubert and Strebel, 1994).
Vpu has two different activities, namely the enhancement of the release of virus from the infected cell surface (Schubert et al., 1996) and the degradation of the CD4 molecule in the endoplasmic reticulum (ER) (Willey et al., 1992; Schubert and Strebel, 1994). Vpu's hydrophobic domain exhibits nonspecific cation channel activity (Ewart et al., 1996), presumably requiring an oligomeric form (Maldarelli et al., 1993). Since Vpu is synthesized from bicistronic mRNA and cotranslationally inserted into membrane of the ER, it is most desirable to determine Vpu's structure within a membranelike environment. Langmuir monolayers of phospholipid at the water/air interface incorporating Vpu protein represent one such model system. This system has the two distinct advantages: the water subphase is effectively infinite in extent beneath the phospholipid headgroups, and the protein is unidirectionally incorporated into the monolayer, thereby providing a good approximation to the surface of an intracellular membrane, especially for the protein's cytoplasmic domain. The only disadvantage is that the transmembrane domain of the protein is solvated by the hydrocarbon chains of a single phospholipid monolayer, instead of by those of a bilayer. However, unidirectional incorporation of the protein into phospholipid bilayer model systems, including unilamellar vesicles and multilayers, is generally difficult to achieve and the water spaces within even fully hydrated multilayers is limited (Marassi et al., 1999). Such unidirectional incorporation may be essential to structural studies of the oligomerization of the transmembrane domain necessary for its cation channel activity. Another advantage of this system is the ability to investigate systematically the structural nature of the interaction of Vpu with the other membrane proteins, or submolecular domains thereof, essential to its function in HIV infection (Schubert et al., 1996; Willey et al., 1992; Schubert and Strebel, 1994).
Previously, we have used this model system for investigating the contribution of a recombinant Vpu (Vpu2–81) to the profile structure of the host phospholipid monolayer as a function of Vpu/lipid mole ratio. This study demonstrated that the transmembrane α-helix is localized in the hydrocarbon chain layer of the host phospholipid monolayer and amphipathic α-helices of cytoplasmic domain lie on the surface of the phospholipid headgroups in the water subphase at higher surface pressures (Zheng et al., 2001).
Although the recombinant Vpu's submolecular fragments Tm (Vpu2–37) and TmCy (Vpu2–51) have been truncated into shorter sequences, namely 36 residues for Tm and 50 residues for TmCy, respectively, all three proteins possess identical transmembrane domains. In phospholipid micellar and multilayer environments, the cytoplasmic domain of Vpu (Vpu2–81) contains an amphipathic-helix-loop-amphipathic-helix secondary structure, whereas Tm (Vpu2–37) contains only a very short portion of the first amphipathic helix and TmCy (Vpu2–51) contains the entire first amphipathic helix of Vpu's cytoplasmic domain. Thus, a comparative study of Vpu with its submolecular fragments Tm and TmCy is an effective way to investigate the possible effects of the interactions of the cytoplasmic domain with the surface of the host phospholipid monolayer and the transmembrane domain in determining the tertiary structure of the peptide within the monolayer.
Here, we present an analysis of x-ray reflectivity data from mixed Langmuir monolayers of Vpu and its two submolecular fragments Tm and TmCy with a long-chain, diacylphosphatidylcholine DLgPC, performed independently for each protein over the same range of six different lipid/protein mole ratios, all at a constant, relatively high surface pressure of 45 mN/m. The gradients of the electron density profiles, and their analytic integration to the absolute electron density profiles, have been derived employing the model-independent Box Refinement method from the Fresnel normalized x-ray reflectivity data for each of the mixed protein/DLgPC monolayers. This approach was necessary to obtain objective experimental measures of the thicknesses and the essential features of both the hydrocarbon chain region and the polar headgroup region within the absolute electron density profile structures for each of the 18 mixed monolayers. Construction of simple slab models for the contributions of the protein's transmembrane domain, and the lipid hydrocarbon chains to the hydrocarbon chain region of the mixed monolayer electron density profiles as a function of protein/DLgPC mole ratio for the three proteins compared with their experimental counterparts, established the structural localization of the transmembrane domain within the hydrocarbon chains in mixed protein/DLgPC monolayers, including the estimated tilt of the hydrophobic helix relative to the monolayer surface normal. Structural parameters obtained from objectively fitting general Gaussian function models representing the lipid polar headgroups and the cytoplasmic domains of the three proteins within the headgroup region of the experimentally determined absolute electron density profiles as functions of the protein/DLgPC mole ratio established that the α-helical portions of the cytoplasmic domains of Vpu and its submolecular fragments Tm and TmCy lie parallel to, but at significantly different distances from, the polar headgroups on the surface of the host phospholipid monolayer. Moreover, the extents of the helices within the cytoplasmic domains of the three proteins were found to be consistent with their otherwise known secondary structures. Overall, the structural similarities for the localization of the cytoplasmic and transmembrane domains of these three proteins within the phospholipid monolayer is consistent with both structural studies of these proteins in other model membrane systems via NMR spectroscopy and functional channel activity studies (Marassi et al., 1999; Ma et al., 2001). However, the quantitative modeling of the monolayer electron density profiles further demonstrates that the localization of the amphipathic helices of the protein's cytoplasmic domain with respect to the polar headgroups within the profile structure of the host phospholipid monolayer is dependent on their lengths and amphipathicities. These different localizations, arising from the differing interactions, are presumably responsible for the slightly different tilt behavior of the transmembrane helix with respect to the monolayer surface normal, systematic as a function of lipid/protein mole ratio. Finally, we present models describing the localization of Tm, TmCy, and Vpu within the phospholipid monolayer environment at the water/helium interface that are fully consistent with the electron density profiles derived from the x-ray reflectivity data from 18 different mixed monolayers, assuming no interrelationships among the data sets.
MATERIALS AND METHODS
Purification of Vpu (Vpu2–81) and its submolecular fragments Tm (Vpu2–37) and TmCy (Vpu2–51)
The detailed procedure for the cloning, expression, and purification of Vpu has been published in other papers (Marassi et al., 1999; Ma et al., 2001). Briefly, Escherichia coli strain BL21 (DE3) cells were transformed with the vectors carrying the Vpu gene and grown in minimal media. Nickel affinity chromatography (His•Bind Resin, Novagen) enabled the purification of the His-tagged fusion protein from other proteins in cell lysate. Cyanogen bromide was used to cleave Vpu from the fusion partner (Gross and Witkop, 1961). To facilitate this cleavage, the two Met residues in the Vpu sequence were mutated to Leu. Reverse-phase HPLC was subsequently used to purify Vpu. The purity and integrity of Vpu was confirmed by mass spectrometry. The biological activity of the double mutant protein was similar to that of authentic Vpu (Ma et al., 2001). The sequence of cleaved recombinant Vpu polypeptide is QPIQIAIVAL VVAIIIAIVV WSIVIIEYRK ILRQRKIDRL IDRLIERAED SGNESEGEIS ALVELGVELG HHAPWDVDDL and the sequences of Tm and TmCy are QPIQIAIVAL VVAIIIAIVV WSIVIIEYRK ILRQRK and QPIQIAIVAL VVAIIIAIVV WSIVIIEYRK ILRQRKIDRL IDRLIERAED, respectively.
Choice of phospholipid
The phospholipid used in these studies was 1,2-Dilignoceroyl-sn-Glycero-3-Phosphocholine (abbreviated herein as DLgPC, chromatographically pure, from Avanti Polar Lipids) which has C24-saturated hydrocarbon chains, the longest chain length commercially available. Since the length of Vpu's hydrophobic α-helix is 34.5 Å containing 23 residues (Willbold et al., 1997), the use of DLgPC provides a nonpolar core for the host phospholipid monolayer whose maximal thickness (29.4 Å for untilted fully extended all trans chains) roughly matches the length of Vpu's hydrophobic α-helix, although the N-terminus of the transmembrane helix would be only in a moist helium environment in the Langmuir monolayer instead of that provided by phospholipid headgroups and water in a bilayer. In addition, the glycero-phosphorylcholine headgroup is generally the predominant species in biological membranes (Yu et al., 1983). The fact that the diacyl hydrocarbon chains are saturated for DLgPC is mitigated for the higher protein/lipid mole ratios employed in this study, which preclude the formation of the gel phase, as first described in our earlier work (Zheng et al., 2001) and more extensively here. Each of the three proteins and the DLgPC lipid were dissolved in a 3:1 chloroform:methanol solution to obtain the desired lipid/protein mole ratio. Monolayers were prepared by spreading the chloroform/methanol solutions of either pure phospholipid or the mixtures of each of the three proteins with DLgPC onto a Millipore-filtered water subphase. The monolayers were kept at a constant temperature of 20°C during the x-ray reflectivity measurements.
Langmuir trough
A custom-built Langmuir trough, fabricated from a copper block and coated with Teflon, contained the water subphase and the spread monolayer. The temperature of the water subphase was controlled by cooled water circulation in the copper block and was measured with a resistance thermometer probe. Surface pressure was measured by a Wilhelmy plate and controlled by a movable barrier with feedback. Inasmuch as high quality x-ray reflectivity data can only be obtained from Langmuir monolayers when the aqueous subphase surface is relatively smooth, the Langmuir trough sat on a vibration isolation stage in the liquid surface spectrometer described below, a delay time of several seconds was employed between any motion of the spectrometer and data collection, and a flat, smooth silicon block was also submerged slightly below the water surface to dampen long wavelength excitations in the local height of the water surface. This resulted in reflectivity data collected (as described below) from a clean water surface which typically exhibited a minimal surface roughness of ∼3 Å; this was regularly ascertained for each experimental setup utilized over the course of this work. During the x-ray reflectivity measurements, moist helium gas was circulated inside the trough to replace the air, thereby reducing the x-ray background scattering.
Liquid-surface spectrometer
The x-ray reflectivity and grazing incidence diffraction (GID) experiments were performed mostly on beamline X-22B at the National Synchrotron Light Source at Brookhaven National Laboratory (Upton, New York), although some of the work was performed on entirely analogous instrumentation at the Complex Materials Consortium, Sector 09 at the Advanced Photon Source, Argonne National Laboratory (Argonne, Illinois). Details of the liquid surface spectrometer have been reported elsewhere (Als-Nielsen and Pershan, 1983; Braslau et al., 1988; Ocko et al., 1997). Here we give only a brief description. The synchrotron x-ray source was a bending magnet in the electron storage ring operating at an energy of 2.8 GeV and currents of 150–250 mA. Monochromatic x-rays were obtained via a horizontally reflecting Si (111) crystal monochromator to provide a wavelength λ = 1.546 Å. X-rays were reflected downward onto the horizontal liquid surface via a Ge (111) crystal to provide an angle of incidence, α. Incident beam slits were set to collect the full horizontal beamwidth and vertically to limit the beam footprint on the liquid surface. A scintillation detector recorded the scattering from a thin Kapton film in the incident beam to provide an incident beam flux monitor. The specularly reflected beam from the liquid surface was measured at an angle β with respect to the liquid surface with another scintillation detector for α = β in the vertical scattering plane at 2θxy = 0°. Scattered beam slits were set to accept the full specularly reflected beam. Off-specular background was measured at α = β with 2θxy = ±0.3°. The difference (specular minus off-specular background) provided the reflectivity R(qz) for photon momentum transfer qz perpendicular to the liquid surface with qz = (4π/λ)sinα. We collected grazing incidence x-ray diffraction using a one-dimensional position-sensitive detector (Brookhaven National Laboratory) and evacuated Soller slits (JJ X-Ray, Denmark) that provided large vertical acceptance (qz ≤ 0.8 Å−1) and fine horizontal resolution (Δ2θ = 1.4 mrad, Δqxy = 0.006 Å−1). Both the total counts integrated over the length of the detector (i.e., qz-integrated) and the counts as a function of channel number (17 channels/degree; i.e., qz-resolved) were recorded. The direct beam full width at half maximum (FWHM) measured 0.14° horizontally and <0.12° (two channels) vertically. For GID, the incident angle was α = 0.12° (i.e., 0.8 αc where αc is the critical angle for the water subphase), and the angle of the detector arm with respect to the surface was typically β = 0° (accessing the qz-range 0.0 Å−1 ≤ qz ≤ 0.8 Å−1), although in some cases we scanned to larger qz (0.4 Å−1 ≤ qz ≤ 1.2 Å−1) by setting β = 6°. To ensure that the monolayers were unaffected by radiation damage, we scanned regions of 2θxy four times with 5 seconds per 2θxy-value and averaged the four scans together after verifying that they were all similar to within counting statistics.
DATA ANALYSIS
The normalized reflectivity R(qz)/RF(qz) from a liquid surface arises from, in the first Born approximation, the modulus square of the Fourier transform of the gradient dρ(z)/dz of the electron density profile ρ(z) across the air-water interface averaged over the in-plane coherence length of the incident x-rays (Als-Nielsen and Pershan, 1983; Helm et al., 1991), namely
 |
(1) |
where R(qz) is the experimental reflectivity (normalized only by the incident beam flux), RF(qz) is Fresnel reflectivity from a single infinitely sharp (ideal) interface, the electron density of the semiinfinite bulk subphase is ρ∞, and qc is qz at the critical angle for the subphase αc. This expression, Eq. 1, becomes progressively less valid as qz approaches qc, which is mitigated to a large extent by the use of q′z, via the distorted-wave Born approximation (Zhou, 1995), where (q′z)2 = [(qz)2 − (qc)2] (also Lösche et al., 1993).
Given the potential complexity of the mixed monolayers studied here, the complexity increasing for the proteins from Tm to TmCy to Vpu, the so-called slab model refinement method traditionally employed for the analysis of reflectivity data from more simple systems might be viewed as less than totally objective. This is because initial models for the electron density profile of the monolayer using this method must be constructed based on one's physical-chemical knowledge of the system of interest, the model then refined against the normalized reflectivity data via Eq. 1, and the method necessarily refines to the profile structure for the monolayer most similar to the initial model, as fully described in our earlier publication (Zheng et al., 2001). Thus, we have utilized the model-independent Box Refinement method, also described in our earlier publications (Strzalka et al., 2000, Zheng et al., 2001), to derive, with no a priori assumptions, the gradient of the monolayer electron density profiles from the experimental normalized reflectivity data via Eq. 1, independently, for each of the three proteins at each of the six different lipid/protein mole ratios investigated, namely pure DLgPC and DLgPC/protein of 50:1, 40:1, 20:1, 15:1, and 10:1, all at the same constant surface pressure of 45 mN/m and a temperature of 20°C. These gradients of the monolayer electron density profiles dρ(z)/dz were then integrated, both numerically and (with greater precision) analytically, to provide the electron density profiles for each of the monolayers. This model-independent approach with no a priori assumptions thereby provided for the subsequent objective extraction of the relevant structural parameters of these mixed monolayer systems of increasing structural complexity for the three proteins Tm to TmCy to Vpu.
RESULTS
Isotherm data
Monolayers of pure DLgPC and its mixtures with each of the proteins Tm (Vpu2–37), TmCy (Vpu2–51), and Vpu (Vpu2–81) were spread from 3:1 chloroform-methanol solutions on a pure water subphase at 20°C. Surface pressure-area (π-A) isotherms for pure DLgPC and the mixtures of Tm/DLgPC, TmCy/DLgPC, and Vpu/DLgPC are shown in Fig. 1, A, B, and C, respectively. The area of the mixed monolayers is described in terms of the area per average molecule, the average molecule here defined to include one DLgPC lipid molecule of area AL and a fractional protein molecule of area AP, the fractional contribution determined by NP/NL denoting the mole ratio of spread protein and DLgPC molecules:
 |
(2) |
The monolayer can be thus considered to consist of a known large number of the average [DLgPC + (NP/NL)protein] molecules. For the range of mole ratios employed in this study, this description of the monolayer area is a very close approximation to the more usual definition of the average molecule in terms of the mole fractions of each component, i.e., NP/NT and NL/NT for NT = NP + NL.
 |
(3) |
Surface pressure isotherms of Tm/DLgPC mixtures (Fig. 1 A) are shifted systematically to larger mean areas per molecule with increasing Tm/DLgPC mole ratio with characteristic shape otherwise similar to that of the pure DLgPC. This systematic increase implies that the Tm molecules compete with the phospholipids for area at the water/air interface over the full range of Tm/DLgPC mole ratios investigated. This is not unexpected due to the highly hydrophobic nature of the Tm protein dominated by the transmembrane helix of Vpu. Compared with the Tm/DLgPC mixtures, surface-pressure area isotherms for both TmCy/DLgPC mixtures (Fig. 1 B) and Vpu/DLgPC mixtures (Fig. 1 C) exhibit an additional plateaulike feature for surface pressures in the range of 18 mN/m ∼25 mN/m which extends to progressively larger areas per average molecule with increasing protein content. One might expect that this additional plateaulike feature is due to the helices of the cytoplasmic domain competing with the DLgPC molecule for area at the water/air interface due to their amphipathic nature, instead of simply dissolving into water subphase below the phospholipid headgroups at these relatively lower surface pressures of <25 mN/m. Quantitative comparison of the areas per average molecule for the TmCy/DLgPC and Vpu/DLgPC mixtures at, for example, the lower surface pressures of 10 mN/m and 25 mN/m (see Table 1) with those for the Vpu/DLgPC mixture indicates that the magnitude of the area increase for Vpu/DLgPC is larger than that for TmCy/DLgPC. This further supports the interpretation that the cytoplasmic domains of proteins give rise to the plateaulike feature in the isotherms because the cytoplasmic domain of Vpu containing 51 residues is substantially larger than that of TmCy containing 21 residues. At higher surface pressures above 25 mN/m, the area per average molecule for TmCy/DLgPC mixtures and Vpu/DLgPC mixtures decreases sharply with the same characteristic shape as that of Tm/DLgPC mixtures. This suggests that a majority of cytoplasmic domains of TmCy/DLgPC and Vpu/DLgPC mixtures have been squeezed out of the water/air interface. However, quantitative comparison of the areas per average molecule at, for example, a higher surface pressure of 45 mN/m as listed in Table 1 shows that Vpu, with its relatively longer cytoplasmic domain, still occupies greater area per average molecule than does TmCy with its shorter cytoplasmic domain, whereas the area per average molecule for the latter TmCy is comparable to that of Tm. This result suggests that the longer cytoplasmic domain of Vpu is substantially more effective in competing with phospholipid for area at the water/air interface than the shorter cytoplasmic domain of TmCy.
FIGURE 1.
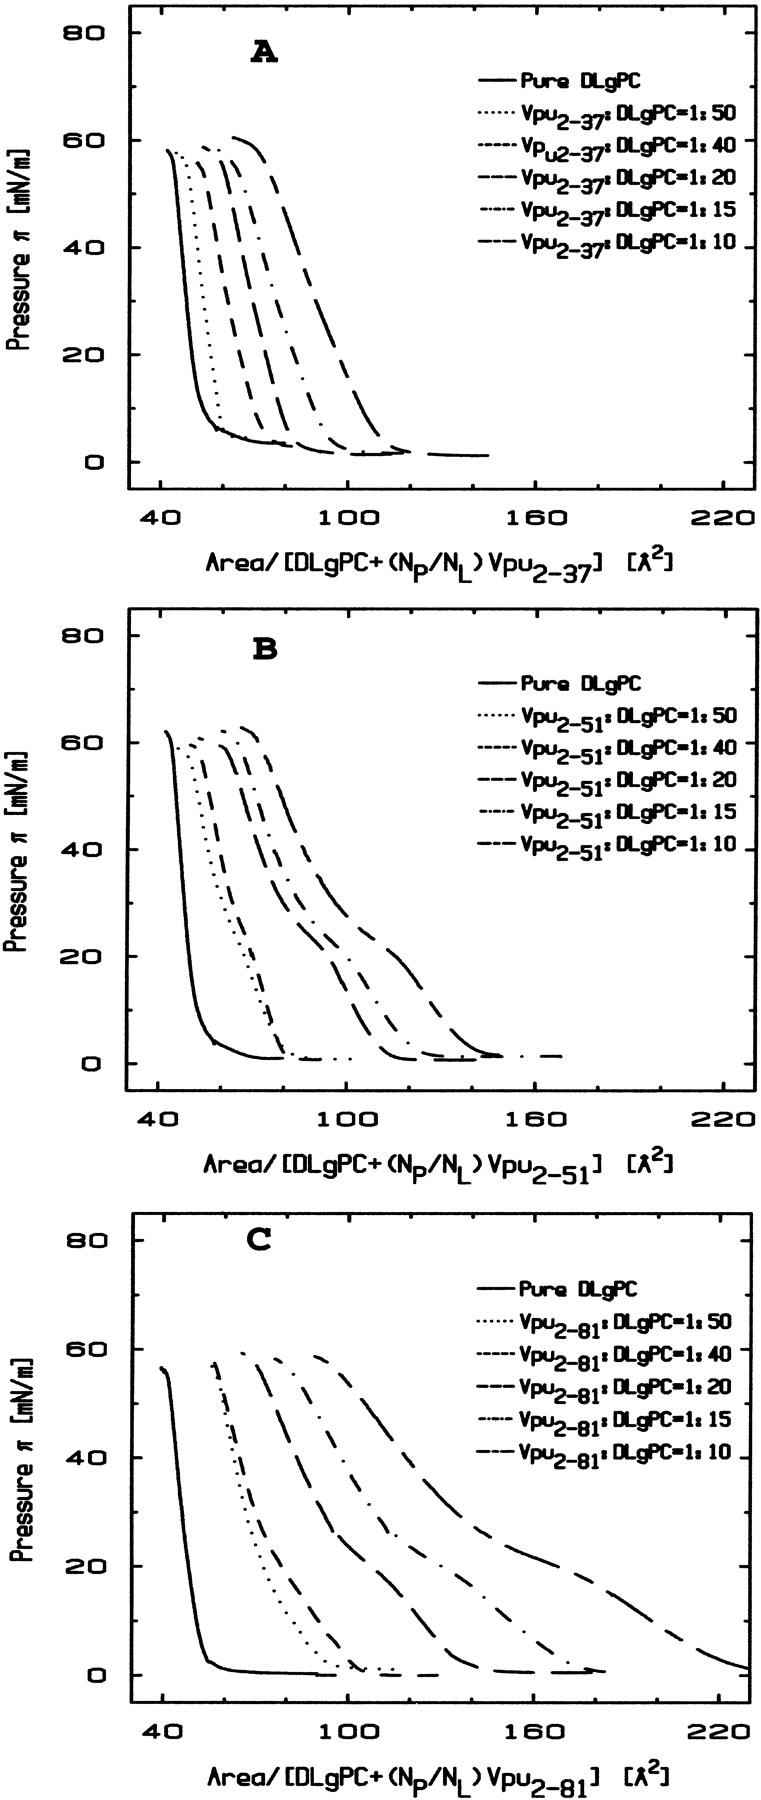
Surface pressure area isotherms of pure DLgPC and mixed protein/DLgPC monolayers for the various mole ratios indicated on a pure water subphase at T = 20°C. (A) The isotherms for the Tm/DLgPC mixtures at various mole ratios. (B) The isotherms for the TmCy/DLgPC mixtures at various mole ratios. (C) The isotherms for the Vpu/DLgPC mixtures at various mole ratios. The abscissa is defined here in terms of the area-per-average-molecule according to Eq. 2, in which the average molecule includes one DLgPC molecule and a fractional protein molecule, the fraction defined by NP/NL denoting the mole ratio of spread protein and DLgPC molecules.
TABLE 1.
| Vpu2–37
|
Vpu2–51
|
Vpu2–81
|
||||||||
|---|---|---|---|---|---|---|---|---|---|---|
| Protein pressure (mN/m) | 45 | 25 | 10 | 45 | 25 | 10 | 45 | 25 | 10 | |
| AM | (p = 1:50, Å) | 51 | 55 | 58 | 53 | 63 | 74 | 61 | 70 | 82 |
| AM | (p = 1:40, Å) | 56 | 64 | 70 | 57 | 67 | 75 | 63 | 75 | 90 |
| AM | (p = 1:20, Å) | 64 | 72 | 78 | 68 | 86 | 102 | 70 | 98 | 124 |
| AM | (p = 1:15, Å) | 69 | 78 | 96 | 73 | 92 | 111 | 91 | 116 | 154 |
| AM | (p = 1:10, Å) | 81 | 93 | 104 | 82 | 105 | 128 | 112 | 149 | 198 |
Average area per molecule defined as 〈Amolecule〉 data for mixed Tm/DLgPC, TmCy/DLgPC, and Vpu/DLgPC monolayers calculated via Eq. 2 as a function of increasing protein/DLgPC mole ratio (p = NP/NL) at various surface pressures of 10 mN/m, 25 mN/m, 45 mN/m, and T = 20°C.
However, it is not possible to simply utilize Eqs. 2 or 3 to obtain less qualitative information without knowledge of the localization of the cytoplasmic and transmembrane domains of Tm, TmCy, and Vpu within the profile structure of the host phospholipid monolayer as a function of surface pressure. This is because the three proteins of interest here, Tm, TmCy, and Vpu, can compete with the phospholipid for area within the plane of the monolayer within three different regions of the monolayer profile structure depending on these localizations. (For example, within the lipid hydrocarbon chain region of the host phospholipid profile structure, the hydrophobic helix of the transmembrane domain and the amphipathic helices of the cytoplasmic domain can compete with the chains, the competition from the amphipathic helices anticipated to depend on surface pressure; within the polar headgroup region, the amphipathic helices of the cytoplasmic domain and water can compete with the headgroups for area in the monolayer plane, again, the competition from the amphipathic helices anticipated to depend on surface pressure; and below the headgroups in the subphase, the amphipathic helices of the cytoplasmic domain and water can compete for area within the monolayer plane, which again, may be dependent on surface pressure.)
In addition, interactions between the protein and lipid components in the monolayer within these three different regions of its profile structure may render the areas per lipid AL and protein AP within each of these regions dependent on lipid/protein mole ratio, even when the pressure area isotherms for the pure lipid and protein components are known experimentally, as is the case here. As a result of these considerations, the x-ray reflectivity from the same Langmuir monolayer systems was systematically investigated.
Grazing incidence diffraction data
Fig. 2 A shows two-dimensional grazing incidence x-ray diffraction (GID) data as a function of (qxy, qz) from a DLgPC monolayer at 45 mN/m and 20°C. It is characterized by an intense maximum at qxy = 1.429 Å−1, qz = 0 Å−1 and a less intense maximum at qxy = 1.383 Å−1, qz = 0.8 Å−1, as defined in both qz-integrated and qz-resolved scans obtained with β = 0° and β = 6°, respectively, in Fig. 2, g–j. These features are indicative of a distorted hexagonal in-plane packing of all trans hydrocarbon chains tilted in the nearest neighbor direction 35°–36° with respect to the normal to the plane of the monolayer, as characteristic of a gel phase for a saturated diacylphospholipid. The former diffraction maximum centered at qz = 0 Å−1 appears as a sharp peak along qxy somewhat broader than the Δqxy-resolution, whereas the latter appears as a broader maximum along qxy, in the qz-integrated scans for β = 0°. Both are characterized by Lorentzian line shapes characteristic of disordered chain-to-chain in-plane correlations decaying exponentially with distance, as opposed to a Gaussian line shape characteristic of well-ordered domains of finite in-plane size (Helm et al., 1991). Allowing for the experimental Δqxy-resolution (via deconvolution of the incident beam line shape), the correlation lengths are ∼275 Å in the next nearest neighbor direction and only ∼33 Å in the nearest neighbor direction.
FIGURE 2.
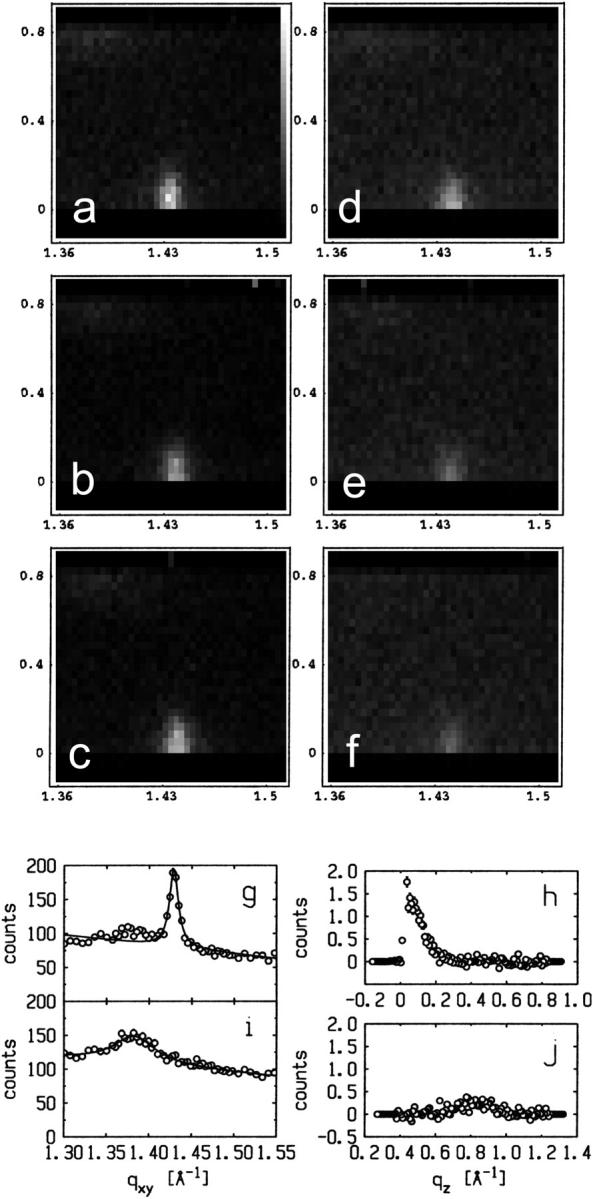
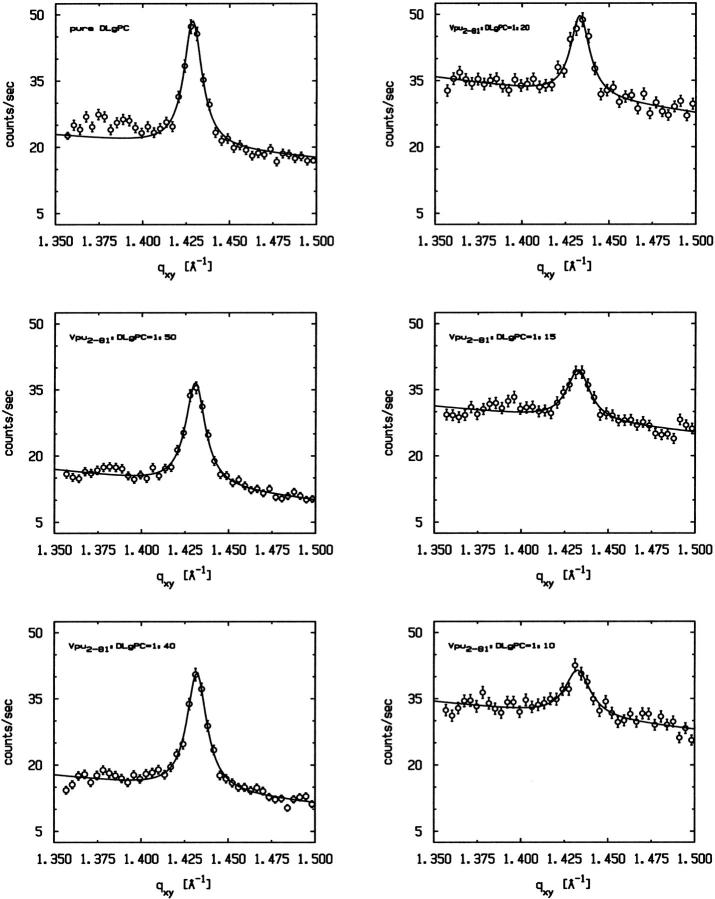
Grazing incidence x-ray diffraction data (GID) from monolayers of pure DLgPC and its binary mixtures with Vpu at π = 45 mN/m and T = 20°C. (a) GID for pure DLgPC, shown here in two dimensions from qz-resolved scans in a gray-scale representation as a function of qxy, qz over the ranges indicated. (b–f) GID for DLgPC/Vpu mixtures at mole ratios 50:1, 40:1, 20:1, 15:1, and 10:1, shown here in two dimensions from qz-resolved scans in a gray-scale representation as a function of qxy, qz over the ranges indicated. (g) GID shown here as a qz-integrated (0.0 Å−1 ≤ qz ≤ 0.8 Å−1) scan at β = 0° as a function of qxy over the range indicated. (h) qz-resolved GID data over the range 0.0 Å−1 ≤ qz ≤ 0.8 Å−1 centered on the maximum at qxy = 1.429 Å−1. (i) GID shown here as a qz-integrated (0.4 Å−1 ≤ qz ≤ 1.2 Å−1) scan at β = 6° as a function of qxy over the range 0.4 Å−1 ≤ qz ≤ 1.2 Å−1. (j) qz-resolved GID data over the range 0.4 Å−1 ≤ qz ≤ 1.2 Å−1 centered on the maximum at qxy = 1.383 Å−1.
As the protein mole fraction in mixed monolayers increases at 45 mN/m and 20°C, as was similarly observed for both Vpu (Vpu2–81) and Tm (Vpu2–37), the more intense sharp peak diminishes in amplitude and broadens in qxy whereas the less intense maximum disappears, shown in Fig. 2, b–f as two-dimensional grazing incidence x-ray diffraction data, and in Fig. 3 as qz-integrated scans with β = 0°, for the Vpu case. Although roughly similar, these data in Fig. 3 are considerably superior in signal/noise to those shown in our earlier work (Zheng et al., 2001) for only the Vpu case due to the utilization here of the linear position-sensitive detector and Soller slits for GID acquisition in the qz-integrated mode. The solid lines in Fig. 3 are the best fits of a Lorentzian line shape to the qz-integrated GID data. The fitting parameters (amplitude, halfwidth, constant background) have very small uncertainties, namely ∼0.002–0.003. The increasing halfwidth and dramatically decreasing amplitude (peak signal/background, or S/B) derived from the Lorentzian fits for the Vpu/DLgPC are shown in Fig. 4, A and B. These results strongly suggest that the in-plane hexagonal ordering of the hydrocarbon chains for the gel phase of DLgPC is being progressively destroyed with increasing mole fraction of Vpu in the monolayer, given the extended range of qz accessed (0.0 Å−1 ≤ qz ≤ 0.8 Å−1) in both the qz-integrated and qz-resolved modes with β = 0°. (Conversely, if instead the protein incorporation induced a new gel phase, it could not be characterized by a nearest neighbor tilt direction—which would require a diffraction maximum along qxy at qz = 0 Å−1) and if by a non-nearest neighbor tilt direction—for example, next nearest neighbor—then the unlikely chain tilt of >52° (i.e., > × 30°) with respect to the normal to the plane of the monolayer would be required which would not be consistent with the monolayer electron density profiles described below.) Taking into account both the decreasing amplitude and increasing width indicates that over 72% of the DLgPC present no longer occurs in a lattice and that the remainder occurs in an increasingly disordered lattice as the highest mole fraction of peptide in the mixed monolayers is approached. This is most likely due to the transmembrane hydrophobic helix because of the identical nature of the GID data for Tm versus Vpu.
FIGURE 3.
Grazing incidence x-ray diffraction (GID) from the monolayers of pure DLgPC and mixtures of Vpu/DLgPC for various mole ratios, all at a surface pressure of π = 45 mN/m and T = 20°C, shown here as qz-integrated (0.0 Å−1 ≤ qz ≤ 0.8 Å−1) scans at β = 0° as a function of qxy over the range indicated. Solid lines are the best fits of Lorentzian line shapes to the GID data characteristic of exponentially decaying in-plane interchain correlations.
FIGURE 4.
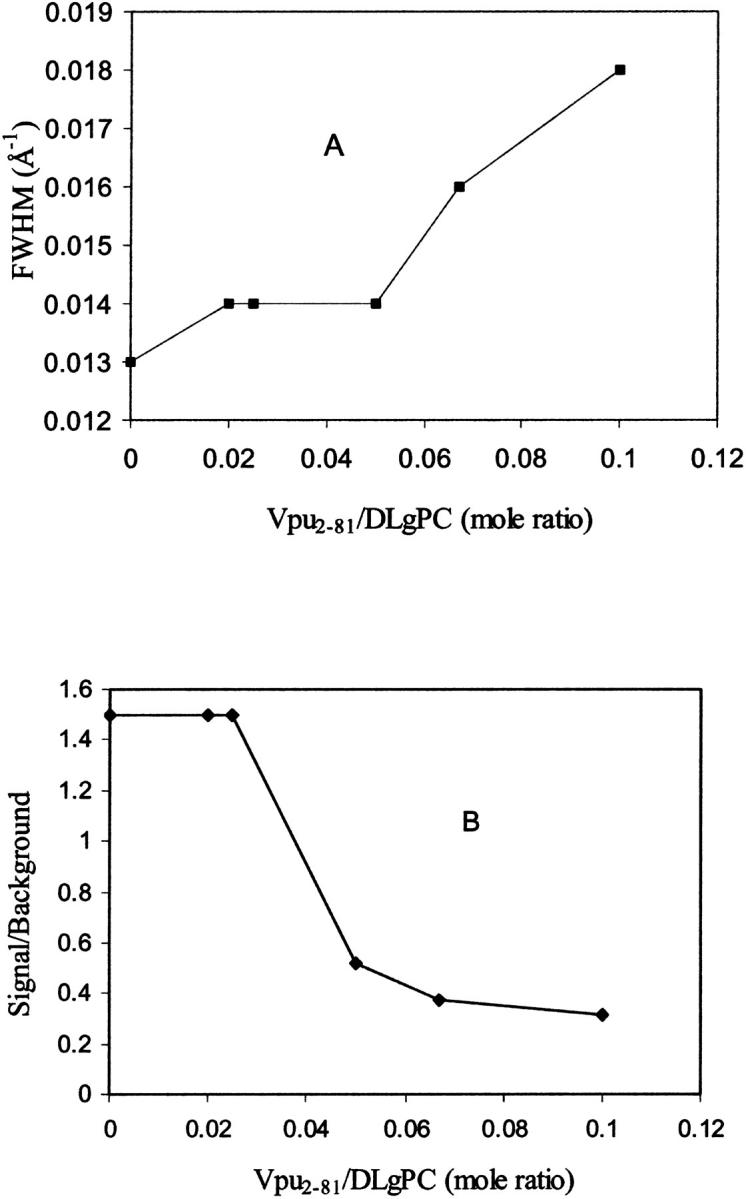
Halfwidths (A) and amplitudes, expressed as signal/background ratios (B), extracted from the best fits of the Lorentzian line shapes to the GID data shown in Fig. 3 for various Vpu/DLgPC mole ratios. Note that the range of values for these two parameters shown on the respective ordinates in these plots does not include zero. Entirely similar results were also obtained for Tm/DLgPC mixed monolayers over the same range of mole ratios (not shown).
Normalized reflectivity data
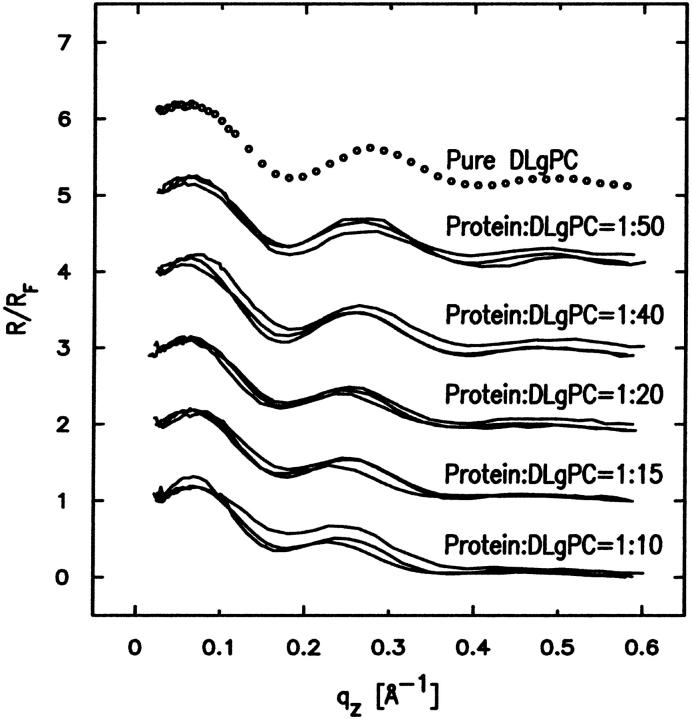
Fig. 5 shows the Fresnel normalized x-ray reflectivity R(qz)/RF(qz) data for pure DLgPC monolayer (open circles) and the comparison of such data from the monolayers for mixed TmCy/DLgPC (solid line), for mixed Tm/DLgPC (solid line), and for mixed Vpu/DLgPC (solid line) at each of the mole ratios of 1:50, 1:40, 1:20, 1:15, and 1:10, all at a surface pressure of 45 mN/m. All data sets have similar errors (counting statistics), being smaller that the circles shown for pure DLgPC. Since these errors in the data shown in Fig. 5 are so small, the differences between the data sets in each portion of the figure at the same mole ratio of protein/DLgPC are due to the different proteins incorporated into the DLgPC monolayers, which is one purpose of this Figure. Additionally, all mixed monolayers show a systematic decrease in the period of the oscillation in R(qz)/RF(qz) with increasing mole ratio of protein/DLgPC. Qualitatively, this systematic decrease in the period of the oscillation in the R(qz)/RF(qz) with increasing mole ratio simply indicates an increase in the overall thickness of monolayer due to the profile structure of mixed Tm/DLgPC, TmCy/DLgPC, and Vpu/DLgPC monolayers, namely the projection of their three-dimensional structures in the monolayer onto the normal to the plane of the monolayer.
FIGURE 5.
Fresnel normalized reflectivity R(qz)/RF(qz) data for pure DLgPC (open circles) and comparisons of such data for the three proteins Tm, TmCy, and Vpu within mixed protein/DLgPC monolayers as a function of photon momentum transfer qz at each of the various mole ratios investigated, all at a surface pressure of π = 45 mN/m and T = 20°C. Data sets for different mole ratios have been offset for clarity and the counting statistics errors are smaller than the circles describing the data for pure DLgPC.
More importantly, the systematic decrease in the period of the oscillation in R(qz)/RF(qz) with increasing mole ratio also indicates that lateral inhomogeneities in the mixed monolayers are smaller than the lateral coherence length ∼104 Å of the synchrotron x-rays (Helm et al., 1991). Thus, the protein and lipid components are mixing in the plane of the monolayer on this length-scale over the range of mole ratios investigated (see Zheng et al., 2001, for further details) and the normalized reflectivity data can be considered to arise from the profile structure of a single thermodynamic phase of the monolayer. This is consistent with the behavior of the GID data shown previously in Figs. 2 and 3, arising from the packing of lipid hydrocarbon chains in the plane of the monolayer, with increasing mole fraction of protein in the monolayer.
Functions derived directly from the normalized reflectivity data
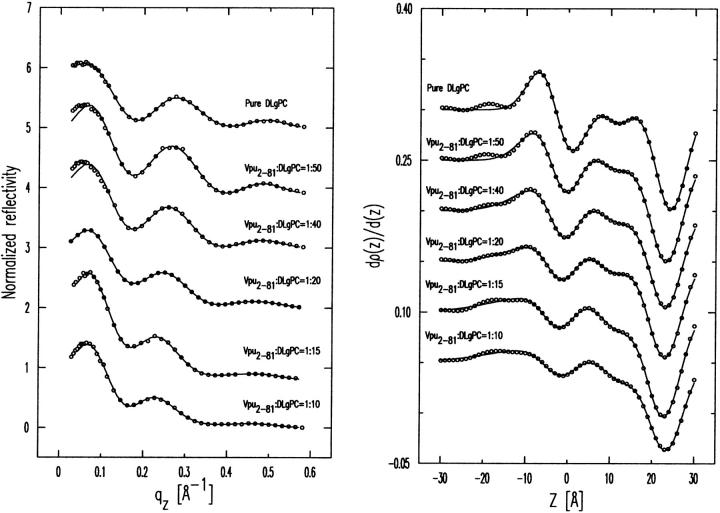
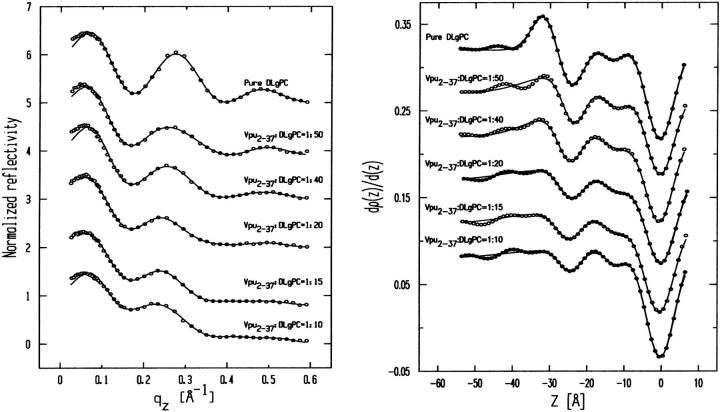
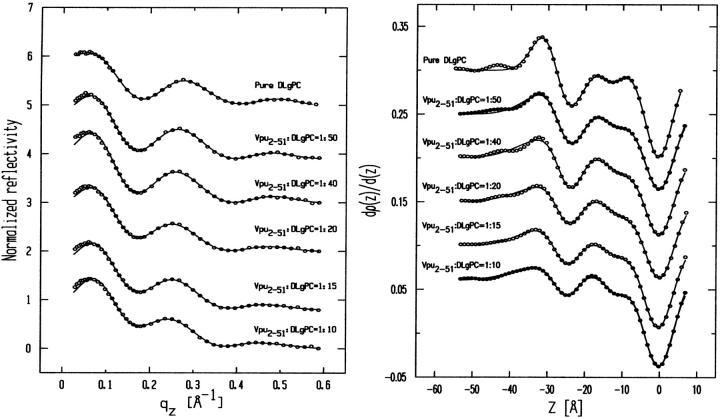
The gradients of the monolayer electron density profiles dρ(z)/dz derived from the experimental normalized reflectivity data with no a priori assumptions via the model-independent Box Refinement method (Stroud and Agard, 1979; Makowski, 1981), exactly as described in detail in our earlier publication (Zheng et al., 2001) and therefore not repeated here, are shown on the right side (circles) of Fig. 6 for the case of Vpu at DLgPC/Vpu mole ratios of ∞, 50:1, 40:1, 20:1, 15:1, and 10:1. These gradient profiles are fully consistent with the normalized reflectivity data from which they were derived, as shown in the left side of Fig. 6. The corresponding figures for the proteins Tm and TmCy are shown in Appendix A. (Although not shown here, it may be noted that the gradient profiles reported here are either unique, or in effect unique, solutions to the phase problem as obtained via Box Refinement. This is because all of phase space within the bounds of ±π over the accessed range of momentum transfer was systematically explored. Only one other solution was occasionally found for these data sets—and only for the larger lipid/protein mole ratios—which was less consistent with normalized reflectivity data by a factor of two or more, using standard least-squares residuals criteria, and therefore rejected.
FIGURE 6.
Gradients of the monolayer electron density profiles dρ(z)/dz derived directly from the experimental normalized reflectivity data via the model-independent Box Refinement method, exactly as described in detail in our earlier publication (Zheng et al., 2001), are shown on the right side (circles) for the case of Vpu at DLgPC/Vpu mole ratios of ∞, 50:1, 40:1, 20:1, 15:1, and 10:1. The hydrocarbon/helium interface is defined here as the z = 0 Å origin, which is of no other consequence in these studies. These gradient profiles are fully consistent with the normalized reflectivity data from which they were derived, as shown in the left side, where the experimental R(qz)/RF(qz) data are shown as circles and the |F(q′z)|2 calculated via Eq. 1 as solid lines. The best nonlinear least-squares fits of the sum of four Gaussian functions to the gradients of the monolayer electron density profiles dρ(z)/dz from Box Refinement, the minimum number of Gaussians required in the sum based on matching criteria (a) and (b) described in the text and Fig. 7, are shown as the solid lines on the right side. The corresponding figures for the proteins Tm and TmCy are shown in Appendix A.
If one considers the electron density profile structure of the monolayer ρ(z) to consist of layers (or slabs) of average electron density  bounded by the two interfaces zj and zj+1 of widths (or roughnesses) σj and σj+1, just as in the traditional slab model refinement method, it can be conveniently described by a sum of analytic error functions completely defined by these parameters (see Als-Nielsen et al., 1994). As a result, the corresponding derivative or gradient profile dρ(z)/dz can be described by a sum of analytic Gaussian functions for each interface completely defined by the change in average electron density across the interface Δρj,j+1, its position in the profile zj and its width (or roughness) σj. Thus, the gradient profiles dρ(z)/dz determined directly, utilizing the Box Refinement method to solve the phase problem in the distorted-wave Born approximation, can be considered to contain a sum of Gaussian functions uniquely defining the positions of the interfaces zj in the monolayer profile structure. (The gradient profiles dρ(z)/dz determined directly via the Box Refinement method necessarily exhibit the effects of Fourier transform truncation, namely they contain a low amplitude, minimum wavelength component throughout determined completely by the largest value of qz to which significant specular reflectivity data is observed (see Zheng et al., 2001). Clearly the larger maxima and minima in these gradient profiles arise from the positions of the dominant interfaces in the monolayer profile structure. One can find the positions of these maxima and minima by simply differentiating the gradient profile and solving for the z-positions of the zeros. We note that these positions obtained with this approach are not exactly the same as those found via the fitting of a sum of Gaussian functions to the gradient profile because the positions of neighboring Gaussians can be affected by their respective widths relative to their separation. However, the resulting so-fitted sum of Gaussian functions to the gradient profile is appealing because it allows for its analytic integration to accurately provide the monolayer absolute electron density profile ρ(z) itself. These monolayer electron density profiles so-obtained contain inherently the constant of integration and are also not subject to the errors normally associated with numerical integration algorithms which would otherwise be required.)
We then fit a sum of Gaussian functions to the so-determined gradient profiles dρ(z)/dz using an objective nonlinear least-squares fitting procedure employing a chi-squared criteria for the goodness of fit. (We have utilized both the method of steepest descents and the Levenberg-Marquardt algorithm to effect the nonlinear least squares fitting, as provided for example in Mathematica. As is generally the case, given the large number of parameters required to describe even a small number of interfaces at three per interface, we found it necessary to perform a so-called grid search for some of the parameters and floated the remainder to best minimize the goodness of fit when fitting the sum of only four Gaussians to the gradient profiles. Whereas four Gaussians were just barely sufficient to provide acceptable fits, as best seen via criteria (a) where the counting statistics errors in the normalized reflectivity data are clearly evident, five Gaussians can provide essentially perfect fits over the entire range of momentum transfer accessed. However, since the nonlinear least squares fitting algorithms employed cannot converge treating the resulting fifteen parameters independently, three to four Gaussians were fit to different overlapping regions within each gradient profile. The resulting best fits were then combined, which required small adjustments in the parameters of the Gaussians within the overlapped portions, to produce the best five-Gaussian fits over the full range of the gradient profile. These small adjustments may render the combining process somewhat less objective and these results are therefore not shown here.) A minimum number of such Gaussian functions was sought to represent the gradient profile dρ(z)/dz sufficient to make a), the modulus square of its Fourier transform match the experimental normalized reflectivity data via Eq. 1; and b), the analytic integration of the sum of Gaussian functions fit to the gradient profile dρ(z)/dz match the absolute electron density profile ρ(z) obtained by numerical integration of the gradient profile dρ(z)/dz. For all 18 different mixed monolayers studied, it was thereby determined that four interfaces described by 12 parameters (three each) were the minimum necessary, provided that two layers (or slabs) described the hydrocarbon chain region and one layer (or slab) described the polar headgroup region of the monolayer electron density profile, with reference to the profile structure of the host DLgPC monolayer. Employing two layers in the headgroup region and only one layer in the hydrocarbon chain provided substantially poorer matches via both criteria a) and b), above.
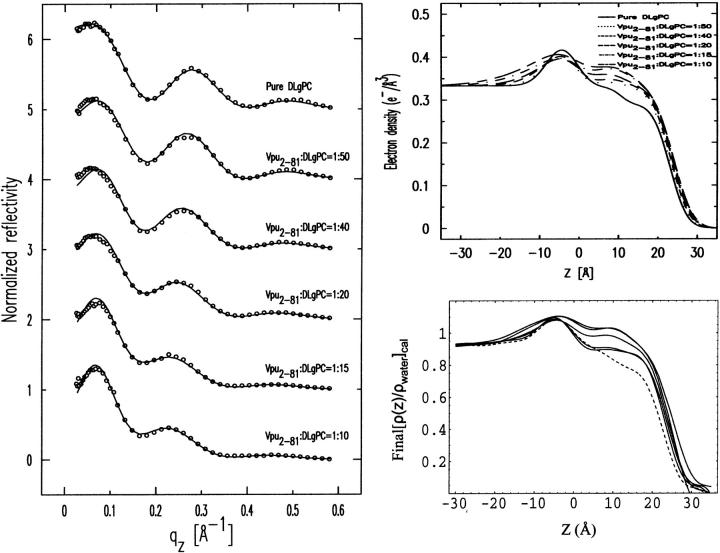
The fitting of a sum of four Gaussian functions to the gradient profiles dρ(z)/dz for the Vpu case at six DLgPC/Vpu mole ratios is shown in the right side (solid lines) of Fig. 6. The matching criteria a) and b) for the Vpu case at the six DLgPC/Vpu mole ratios are shown in Fig. 7. The corresponding figures for the proteins Tm and TmCy are shown in Appendix B. Table 2 contains the best fit parameters for all three proteins at the six different lipid/protein ratios. Finally, a comparison of the absolute electron density profiles, as obtained by analytic integration as described above, for the three proteins of increasing structural complexity Tm, TmCy, and Vpu, each at the six lipid/protein mole ratios studied, are shown in Fig. 8.
FIGURE 7.
(Left side, criteria a) Experimental R(qz)/RF(qz) data are shown as circles for the case of Vpu at DLgPC/Vpu mole ratios of ∞, 50:1, 40:1, 20:1, 15:1, and 10:1.and the |F(q′z)|2, calculated via Eq. 1 for the best nonlinear least-squares fits of the sum of four Gaussian functions to the gradients of the monolayer electron density profiles dρ(z)/dz from Box Refinement, are shown as the solid lines. (Right side, criteria b) The top half shows the absolute electron density ρ(z) profiles calculated by analytic integration of the best nonlinear least-squares fits of the sum of four Gaussian functions to the gradients of the monolayer electron density profiles dρ(z)/dz from Box Refinement for the case of Vpu at DLgPC/Vpu mole ratios of ∞, 50:1, 40:1, 20:1, 15:1, and 10:1. The bottom half shows the absolute electron density ρ(z) profiles calculated by numerical integration of the gradients of the monolayer electron density profiles dρ(z)/dz from Box Refinement for this case. The corresponding figures for the proteins Tm and TmCy are shown in Appendix B.
TABLE 2.
| Ratio | L2(Å) | L3(Å) | L2 + L3(Å) | θtilt(°) |
|---|---|---|---|---|
| Vpu2–37/DLgPC | ||||
| 1:∞ | 12.96 | 12.64 | 25.60 | 29.4 |
| 1:50 | 11.14 | 12.60 | 23.74 | 36.8 |
| 1:40 | 12.33 | 11.60 | 23.90 | 36.3 |
| 1:20 | 13.10 | 11.07 | 24.17 | 36.0 |
| 1:15 | 13.65 | 10.96 | 24.61 | 34.9 |
| 1:10 | 12.44 | 11.97 | 24.41 | 36.2 |
| Vpu2–51/DLgPC | ||||
| 1:∞ | 13.10 | 12.37 | 25.50 | 29.9 |
| 1:50 | 13.39 | 10.52 | 23.91 | 36.2 |
| 1:40 | 13.88 | 10.07 | 23.95 | 36.1 |
| 1:20 | 14.48 | 9.88 | 24.36 | 35.3 |
| 1:15 | 13.93 | 10.72 | 24.65 | 34.7 |
| 1:10 | 13.91 | 10.94 | 24.85 | 34.8 |
| Vpu2–81/DLgPC | ||||
| 1:∞ | 13.10 | 12.37 | 25.50 | 29.9 |
| 1:50 | 10.80 | 13.30 | 24.10 | 35.5 |
| 1:40 | 11.86 | 12.24 | 24.10 | 35.6 |
| 1:20 | 12.04 | 12.40 | 24.40 | 35.2 |
| 1:15 | 13.38 | 11.03 | 24.86 | 34.0 |
| 1:10 | 14.07 | 10.80 | 24.87 | 34.7 |
 |
FIGURE 8.
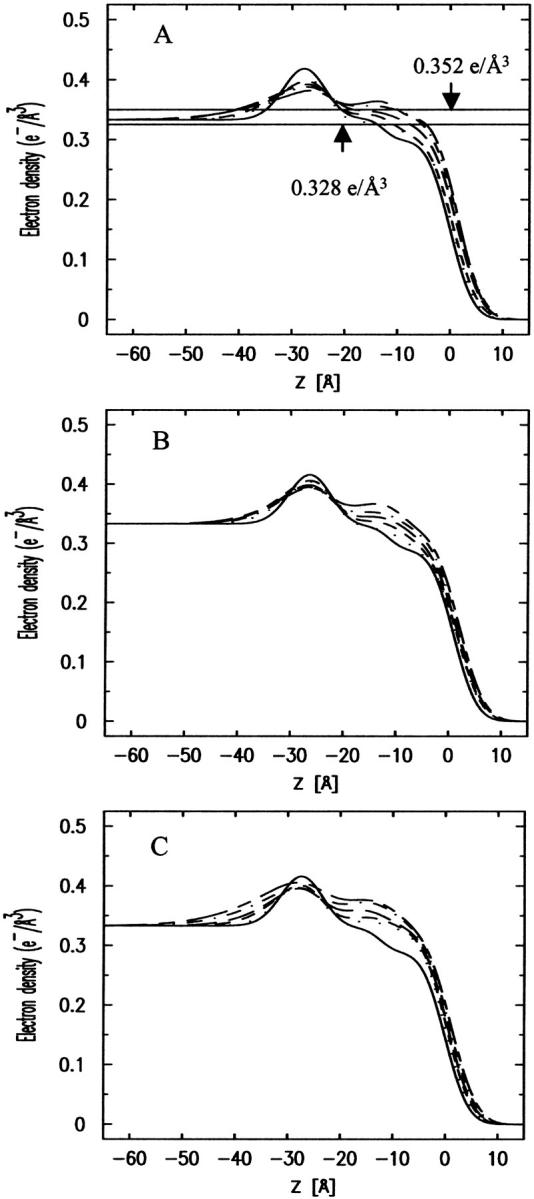
Comparison of the absolute electron density profiles ρ(z) calculated by analytic integration of the best nonlinear least-squares fits of the sum of four Gaussian functions to the gradients of the monolayer electron density profiles dρ(z)/dz from Box Refinement for (A) mixed Tm/DLgPC monolayers, (B) mixed TmCy/DLgPC monolayers, and (C) mixed Vpu/DLgPC monolayers, all as a function of the same six increasing protein/DLgPC mole ratios at a surface pressure of 45 mN/m and T = 20°C. The profiles are rigorously aligned via their z = 0 Å origin, chosen here as the hydrocarbon/helium interface (as identified in Fig. 6). The range of average electron densities calculated for the hydrocarbon chain region of these absolute electron density profiles for the range of mole ratios investigated, based on the modeling of that region, is indicated for the Vpu case by the two horizontal lines (at 0.328 e/Å3 and 0.352 e/Å3) and is identical for the TmCy and Tm cases.
At this point, we can consider the positions of the interfaces within the monolayer profile structure (via the gradient profiles dρ(z)/dz) and the absolute electron density profiles ρ(z) for the mixed monolayers, both within the polar headgroup and hydrocarbon chain regions with respect to the host phospholipid monolayer (via analytic integration of the gradient profiles), to have been obtained directly with no a priori assumptions and independently for each of the three proteins at the same six lipid/protein ratios. Figure 8 illustrates that for the mixtures of each particular protein Tm, TmCy, and Vpu with the DLgPC phospholipid, there are significant systematic differences among the electron density profiles depending on the lipid/protein mole ratio. In this figure, the z = 0 Å choice of origin for the z-axis was chosen to be the hydrocarbon chain/helium interface predominant in the monolayer profile structures, as objectively determined from the nonlinear least-squares fitting of a sum of Gaussian functions to the gradient profiles dρ(z)/dz as described above. None of the results in this work are in any way dependent on this choice. Thus, these variations in the profiles with lipid/protein mole ratio are most similar within the hydrocarbon chain region (approximately −20 Å < z < 10 Å), and most different within the polar headgroup region (approximately −40 Å < z < −20 Å), for these three proteins as anticipated given their respective compositions. These similarities and differences must arise directly from the significant differences in their corresponding normalized x-ray reflectivity data shown in Fig. 5. Within the hydrocarbon core region of the profiles shown in Fig. 8, it can be seen that for pure DLgPC, the electron density profile within the hydrocarbon chain region is not uniform as expected for a well-ordered gel phase of saturated diacylphospholipids, although its average electron density level is comparable to that for the gel phase. It can also readily be seen that both the electron density and thickness of the hydrocarbon chain region of the monolayer profiles increase similarly for all three proteins with increasing protein/DLgPC mole ratio from 1:∞ up to 1:10. Note that numerical values for one objective measure of the thicknesses of the hydrocarbon core regions are given directly in Table 2 (as L2 + L3). These thicknesses are not very dependent on the utilization of two layers (“slabs”) bounded by three interfaces, namely nearly identical results are obtained using only one layer bounded by two interfaces. (Given the approach described above for the fitting of Gaussian functions to the gradient profiles dρ(z)/dz to objectively determine the positions of the interfaces in the monolayer profile structure, it should be readily apparent that interjecting a third Gaussian of small amplitude between the two Gaussians at either edge of the hydrocarbon core region would have little to no effect on their positions, given the distances involved relative to the spatial resolution in the gradient profiles. Nevertheless, this was indeed checked employing only a single layer bounded by two interfaces to represent the hydrocarbon core region, yielding very similar thicknesses and their variation with lipid/protein mole ratio as reported in Table 2.) The behavior of the thickness of the hydrocarbon core region with increasing protein content, although generally similar for the three proteins, is in fact slightly different and systematically so for the three proteins over the range of lipid/protein mole ratios investigated for either objective measure (please see earlier comments relating to gradient profiles) as further exemplified in Fig. 9. Within the polar headgroup region of the profiles shown in Fig. 8, it can be seen that for pure DLgPC, the symmetric shape, width, and maximum electron density of the polar headgroup feature in the profile is as expected for a diacylphosphatidylcholine (at this spatial resolution of ∼10 Å). It can also be readily seen that the maximum electron density, thickness, and asymmetry in the shape of the electron density profiles within the polar headgroup region depend strongly on both the lipid/protein mole ratio for all three proteins, and in particular, the different compositions of the cytoplasmic domains for each protein. To better understand the structural origin of these similarities and differences, we have subjected the profiles to modeling based on the monolayer compositions within these two regions of the monolayer profiles.
FIGURE 9.
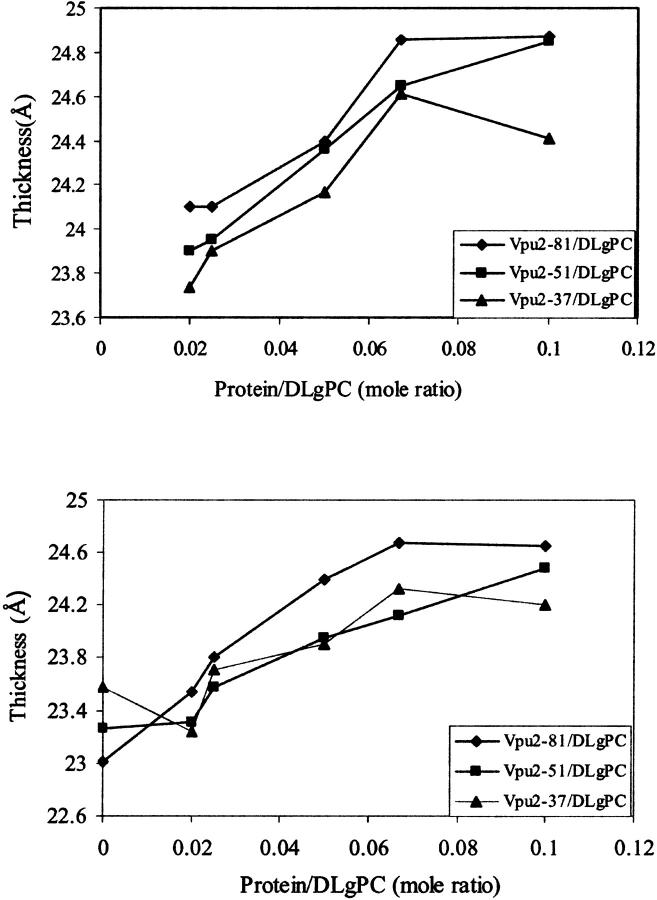
Two measures of the thicknesses of the hydrocarbon core region of the monolayer electron density profiles, as determined objectively from the gradients of the monolayer electron density profiles dρ(z)/dz from Box Refinement, for Tm, TmCy, and Vpu as a function of increasing mole fraction of protein in the mixed monolayers. (Top) Thicknesses as determined by fitting a sum of four Gaussian functions to the gradients of the monolayer electron density profiles dρ(z)/dz, namely L2 + L3 from Table 2. The estimated errors in these thicknesses (see legend for Table 2) are only ±0.1 Å. (Bottom) Thicknesses as determined via the separation of the positions of the minima representing the hydrocarbon/helium and headgroup/hydrocarbon interfaces in the gradients of the monolayer electron density profiles dρ(z)/dz. These positions (see Fig. 6) were determined by the zeros of the derivative of the gradient profiles. The estimated errors in these thicknesses are again only ±0.1 Å.
Modeling the hydrocarbon chain region of the mixed monolayer profiles
The thickness of the hydrocarbon chain region of the electron density profile for pure DLgPC at 45 mN/m and 20°C is 23.5 ± 0.25 Å based on the objective measure of the separations of the minima in the gradient profiles. Although the electron density profile of the hydrocarbon core region is not entirely uniform, the average electron density of ∼0.32 e/Å3 is comparable to that of the gel phase consistent with the GID. For all trans hydrocarbon chains, the thickness of the hydrocarbon chain region implies a chain tilt of ∼35° with respect to the normal to the monolayer plane, reasonably consistent with that of 35°–36° from the GID data. The nonuniformity of the hydrocarbon core region suggests some disorder in the average hydrocarbon chain configuration, particularly nearer the methyl endgroups, which would shorten the average chain length and correspondingly, decrease the chain tilt angle to somewhat less than ∼35°. Upon incorporation of the transmembrane domain common to all three proteins studied, the average electron density of the hydrocarbon chain region of the monolayer profiles increase similarly with increasing protein/DLgPC mole ratio from 1:∞ up to 1:10, as the in-plane ordering of the gel phase of DLgPC is progressively destroyed based on the GID data. Simultaneously, the average thickness of this region increases steadily for all three proteins between the mole ratios of 1:∞ and 1:10, based on the objective measure of the separations of the minima in the gradient profiles (please see earlier comments relating to gradient profiles) (see Figs. 6 and 9) arising from the headgroup/hydrocarbon and hydrocarbon/helium interfaces which correspond to the inflection points in the absolute electron density profiles (see Fig. 8). Similarly, the average thickness of this region for all three proteins, based on the L2 + L3 parameters from the fitting of a sum of Gaussian functions to the gradient profiles, also increases steadily for the mole ratios of 1:50 up to 1:10 (see Fig. 9). The average thickness of this region is slightly, but significantly greater for Vpu, as compared with TmCy and Tm, by either measure over the range of mole ratios investigated. The average thickness of this region for TmCy appears to be somewhat intermediate between that for Tm and Vpu over the range by the objective measure L2 + L3, whereas for the objective measure of the separations of the minima in the gradient profiles, the average thickness of TmCy appears to be more similar to that of Tm. Conversely, pure diacyl phospholipids can only exhibit an increase in electron density of the hydrocarbon core region with a corresponding decrease in the thickness of that region, due to an increased tilt angle of the hydrocarbon chains relative to the normal to the monolayer plane.
Since the electron density and thickness obtained from the electron density profiles in the hydrocarbon chain region contain contributions from both the lipid hydrocarbon chains and the transmembrane helix and because the profiles are derived from x-ray reflectivity data sensitive to the monolayer composition averaged over an area whose lateral extent is defined by the coherence length ∼104 Å of the synchrotron x-rays, the average electron density of that particular region within the monolayer profile structure at a particular protein/DLgPC mole ratio is given by
 |
(4) |
Similarly, the average thickness of that particular region within the monolayer profile structure at a particular protein/DLgPC mole ratio is given by
 |
(5) |
where NL/NP is the lipid/protein mole ratio, ρHC is the electron density and tHC is the profile thickness of the hydrocarbon chains of DLgPC, ρTH is the electron density and tTH is the profile thickness of Vpu's transmembrane helix, AL is the area per DLgPC molecule and ATH is the area per transmembrane domain. (“Profile thickness” here refers to the thickness of the hydrocarbon chains or transmembrane helix, respectively, as projected onto the profile axis normal to the plane of the monolayer.) The minimum area/molecule of the pure DLgPC at 45 mN/m is ∼45 Å2, based on the pressure/area isotherm and the GID data, and the average electron density of all trans hydrocarbon chains at ∼22 Å2/chain is ∼0.320 e/Å3. The minimum cross-sectional area of an α-helix ∼10 Å in diameter is ∼80 Å2 and the average electron density of the hydrophobic transmembrane helix common to the three proteins is ∼0.490 e/Å3. (Pressure area isotherms for the pure proteins have been determined and x-ray reflectivity data has been collected and similarly analyzed for Tm as a function of surface pressure. At higher surface pressures of ∼45 mN/m, the area/molecule approaches ∼200 Å2 whereas the thickness of the monolayer profile approaches ∼35 Å consistent with the 23-residue length of its hydrophobic helix at 1.5 Å/residue. Nevertheless, it is unreasonable to expect the average area/molecule calculated from the isotherm to approach the value of ∼100 Å2 as calculated for the minimum cross-sectional area of the helix (e.g., for helices 10 Å in diameter hexagonally close-packed in the plane perpendicular to their long axis, the average area per helix becomes ∼90 Å2, because of both the nonzero temperature, 293 K, and that the helices would have to exhibit in-plane hexagonal close-packing with long-range order over the entire area of the spread monolayer.) Assuming the most simple situation of no interactions between these two components within the hydrocarbon chain region, Eq. 4 was used to estimate the average electron density of the hydrocarbon core region with increasing mole fraction of the transmembrane helix. The range of these values (0.328 e/Å3 ≤  ≤ 0.352 e/Å3) for mole ratios 1:50 up to 1:10, respectively, is shown in Fig. 8 and the average electron densities of the hydrocarbon chain regions of these profiles for the three proteins with increasing mole fraction of protein are thereby seen to be physically reasonable. In addition, Eq. 5, together with the 23-residue length of the hydrophobic transmembrane helix, was used to estimate the average thickness of the hydrocarbon core region, assuming a tilt of the helices and hydrocarbon chains relative to the normal to the monolayer plane sufficient to match the experimentally determined values L2 + L3 from Table 2. The resulting estimated tilt angles shown in Table 3 and their dependence on the particular protein and the lipid/protein mole ratio thus necessarily follow the same trends as exhibited by the thickness of the hydrocarbon core region (Fig. 8), the thicknesses and tilt angles being inversely related.
TABLE 3.
| Ratio | AT | ρc−w | δc−w | ρH−w | δH−w | tCH−HG | N |
|---|---|---|---|---|---|---|---|
| Vpu2–37/DLgPC | |||||||
| 1:50 | 2553 | 0.337 ± 0.0002 | 4.4 ± 0.03 | 0.396 ± 0.0005 | 4.8 ± 0.01 | 9.2 ± 0.36 | 7.0 |
| 1:40 | 2103 | 0.338 ± 0.0003 | 4.5 ± 0.03 | 0.392 ± 0.0004 | 4.8 ± 0.02 | 9.4 ± 0.47 | 7.2 |
| 1:20 | 1273 | 0.341 ± 0.0002 | 4.2 ± 0.02 | 0.383 ± 0.0002 | 5.2 ± 0.02 | 9.0 ± 0.13 | 6.9 |
| 1:15 | 1030 | 0.343 ± 0.0005 | 5.0 ± 0.05 | 0.380 ± 0.0004 | 5.2 ± 0.01 | 9.4 ± 0.20 | 7.0 |
| 1:10 | 806 | 0.345 ± 0.0007 | 5.0 ± 0.06 | 0.374 ± 0.0007 | 5.7 ± 0.01 | 9.0 ± 0.12 | 6.6 |
| Vpu2–51/DLgPC | |||||||
| 1:50 | 2636 | 0.341 ± 0.0003 | 4.5 ± 0.03 | 0.405 ± 0.0005 | 4.1 ± 0.01 | 8.7 ± 0.25 | 14.5 |
| 1:40 | 2290 | 0.343 ± 0.0002 | 4.4 ± 0.01 | 0.404 ± 0.0003 | 4.1 ± 0.01 | 8.4 ± 0.17 | 15.7 |
| 1:20 | 1363 | 0.349 ± 0.0003 | 4.5 ± 0.04 | 0.397 ± 0.0005 | 4.1 ± 0.02 | 8.3 ± 0.14 | 14.9 |
| 1:15 | 1099 | 0.352 ± 0.0007 | 4.5 ± 0.09 | 0.394 ± 0.0003 | 4.0 ± 0.02 | 8.1 ± 0.09 | 14.3 |
| 1:10 | 818 | 0.358 ± 0.0012 | 4.6 ± 0.15 | 0.393 ± 0.0010 | 4.5 ± 0.01 | 8.4 ± 0.36 | 14.0 |
| Vpu2–81/DLgPC | |||||||
| 1:50 | 3045 | 0.343 ± 0.0000 | 5.0 ± 0.05 | 0.401 ± 0.0002 | 4.0 ± 0.01 | 7.1 ± 0.11 | 24.5 |
| 1:40 | 2509 | 0.353 ± 0.0003 | 4.5 ± 0.05 | 0.396 ± 0.0008 | 4.1 ± 0.01 | 6.9 ± 0.20 | 24.4 |
| 1:20 | 1563 | 0.358 ± 0.0007 | 5.0 ± 0.13 | 0.394 ± 0.0002 | 4.1 ± 0.01 | 6.9 ± 0.41 | 24.8 |
| 1:15 | 1369 | 0.353 ± 0.0007 | 7.1 ± 0.06 | 0.395 ± 0.0005 | 7.3 ± 0.03 | 7.2 ± 0.30 | 26.1 |
| 1:10 | 1118 | 0.353 ± 0.0005 | 7.5 ± 0.05 | 0.395 ± 0.0003 | 7.6 ± 0.01 | 7.2 ± 0.20 | 25.7 |
Structural data obtained from fitting Eq. 6, the sum of two completely general Gaussian functions, to the excess electron density within the asymmetric polar headgroup region of the absolute electron density profiles for mixed Tm/DLgPC, TmCy/DLgPC, and Vpu/DLgPC monolayers as a function of increasing protein/DLgPC mole ratio at surface pressure of 45 mN/m and T = 20°C. AT is the total area in the plane of the monolayer available to the cytoplasmic domain and water below the lipid polar headgroups, ρC−W is the peak electron density of the Gaussian function representing the hydrated cytoplasmic domain (ρC−W + ρH2O) as identified in the text, ρH−W is the peak electron density of the Gaussian function representing the hydrated lipid polar headgroups (ρH−W + ρH2O) as identified in the text, 2δC−W is the 2σ-width of the Gaussian function representing the cytoplasmic domain which was found to be consistent with the cross-sectional electron density profile of an α-helix, tCH−HG is the separation in the monolayer profile of the center of masses of the two Gaussian functions representing the cytoplasmic domain and the lipid polar headgroups, and N is the estimated number of residues in well-ordered α-helical secondary structures within each protein's cytoplasmic domain.
Modeling the polar headgroup region of the mixed monolayer profiles
The symmetric shape, width (8–9 Å FWHM) and maximum electron density (0.420 e/Å3) of the polar headgroup feature in the profile is as expected for a diacylphosphatidylcholine at this spatial resolution of ∼10 Å (Helm et al., 1991). It can also be readily seen that the maximum electron density, thickness and asymmetry in the shape of the electron density profiles within the polar headgroup region depend strongly on both the lipid/protein mole ratio for all three proteins, and in particular, the different compositions of the cytoplasmic domains for each protein. In particular, the varying degree of asymmetry in the shape of the polar headgroup region of the monolayer electron density profiles depending on the composition of the protein's cytoplasmic domain and its mole fraction in the mixed monolayer strongly suggests a minimum of two contributions to this asymmetric shape, here for example, the polar headgroups of DLgPC and the respective cytoplasmic domains of the three proteins, Tm, TmCy, and Vpu.
Therefore, a model for the electron density in excess of that of pure water within the polar headgroup region of the absolute electron density profiles for the mixed monolayers was constructed based on two Gaussian functions representing the electron density profiles of the lipid polar headgroups and the respective cytoplasmic domains of the proteins. This anticipates some amount of water (see below) within both the headgroup layer and the cytoplasmic domain layer, given by
 |
(6) |
where ρh−w is excess electron density of the lipid headgroup layer including water, ρc−w is the excess electron density of cytoplasmic domain layer including water, μh−w is the center of the distribution of electron density of the headgroups, μc−w is center of the distribution of electron density of the cytoplasmic domain's helices, δh−w is the halfwidth of distribution of the headgroups, and the δc−w is the halfwidth of distribution of the cytoplasmic domain's helices. Note that these Gaussian functions, and thus the model, are completely general in that no restrictions were placed on their amplitudes, widths, or positions.
A nonlinear least-squares procedure was then used to fit Eq. 6 to the polar headgroup region within the absolute electron density profiles derived from the normalized reflectivity from the various monolayers. The goodness of fit was tested using the standard R-factor, or integral of the residuals defined as
 |
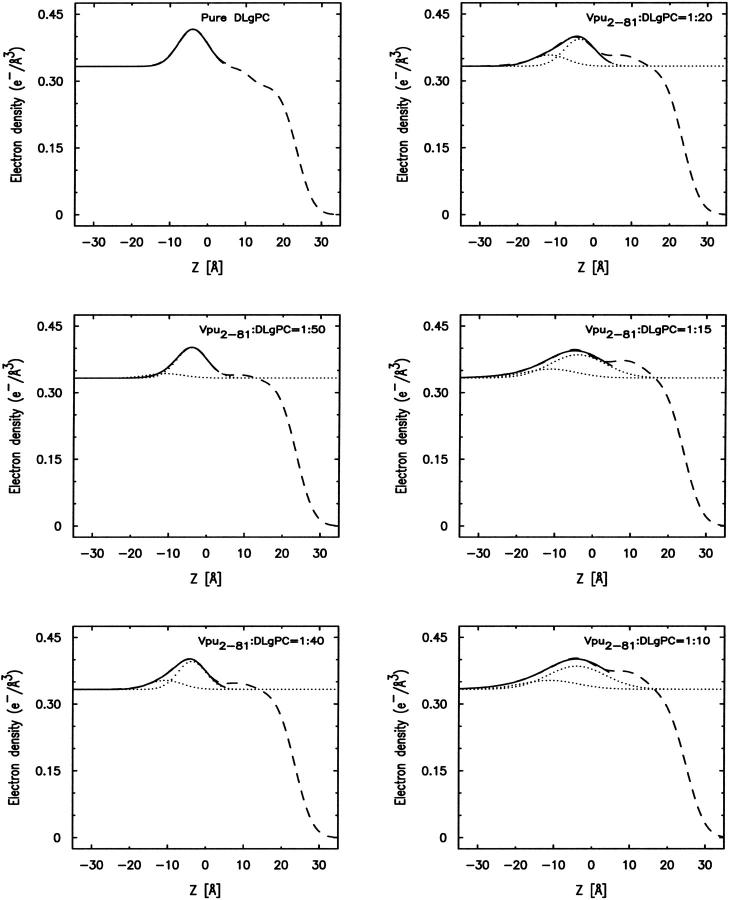
The R-factors attained were in the range of 0.02 ∼ 0.06 in all cases demonstrating that two Gaussian functions in the model were sufficient. The results are shown in Fig. 10 for Vpu/DLgPC mixed monolayers, for example, and all results are listed in Table 3. From Table 3, it can readily be seen that the widths of the Gaussian representing the phospholipid headgroups (identified as that closest to the hydrocarbon chain region and decreasing in amplitude with increasing mole fraction of protein in the mixed monolayer) are generally in the range of 4–5 Å, consistent with that for a diacylphosphatidylcholine at ∼10 Å resolution. More importantly and also readily seen from Table 3 is that the widths of the Gaussian representing the cytoplasmic domain (identified as that farthest from the hydrocarbon chain region and increasing in amplitude with increasing mole fraction of protein in the mixed monolayer) are relatively constant with δc−w ∼ 4 Å, except for a significant increase for only the Vpu case at the higher two protein/lipid mole ratios. This width is fully consistent only with the profile of an α-helix lying parallel to the monolayer plane (and certainly not that of a helix lying perpendicular to this plane, especially given the anticipated lengths of the helices in the cytoplasmic domains of TmCy and Vpu), both as calculated from the known structure of α-helices and as experimentally determined via analogous x-ray reflectivity studies for Langmuir monolayers of both synthetic amphipathic helices (Strzalka et al., 2000) and the amphipathic helices of Vpu's cytoplasmic domain (Zheng et al., 2001) at relatively low surface pressures. Furthermore, the separation between the centers of the distributions of the cytoplasmic domain's helices and the lipid polar headgroups tCH−HG depends more strongly on the particular Vpu protein, but otherwise not so strongly on the lipid/protein mole ratio, with the exception of only the Vpu case at the higher two protein/lipid mole ratios.
FIGURE 10.
Best nonlinear least-squares fits of two Gaussian functions, representing the protein's cytoplasmic domain and the phospholipid headgroups, to the excess electron density within the asymmetric polar headgroup region of the absolute electron density profiles ρ(z) obtained via analytic integration as described in the text, for the mixed Vpu/DLgPC monolayers as a function of increasing Vpu/DLgPC mole ratio at a surface pressure of 45 mN/m and T = 20°C.
Given the separations noted in Table 3 between the centers of the distributions of the cytoplasmic domain's helices and the lipid polar headgroups tCH−HG , the cytoplasmic domain layer includes only the cytoplasmic domain and water molecules in the mixed monolayers at the higher surface pressures, e.g., 45 mN/m, and the total area AT in the monolayer plane for this layer is then given by
 |
(7) |
where the AC is the area occupied by the cytoplasmic domain, the Aw is the area occupied by water molecules. AT can be obtained from surface pressure isotherms for the Vpu proteins, utilizing AT = (NL/NP)AM, AM for area per molecule in isotherms as shown in Fig. 1 and listed in Table 1. The electron density ρC+W of the cytoplasmic domain layer is given by
 |
(8) |
where the ρC is the electron density of a hydrated hydrophilic α-helix, namely ρC ∼0.43 e/Å3, ρW is the electron density of water molecules, namely ρW ∼0.333 e/Å3. Since the excess ρc−w is provided directly from the nonlinear least-squares fitting procedure, the area occupied by the amphipathic helices of the cytoplasmic domain of the various Vpu values becomes the only unknown parameter in Eq. 6. Using this area AC so determined by solving Eq. 6 and assuming that only the α-helical portions (as opposed to the hydrophilic loop regions) of the cytoplasmic domain oriented with their long-axis parallel to the monolayer plane can increase the electron density in the polar headgroup region of the profiles above that of water for the lipid/protein mole ratios investigated, the number of residues in the helical secondary structure for the cytoplasmic domain of a particular Vpu can be calculated according to Ac = Nresidue × Aresidue, where Aresidue is the area per residue, which is 15 Å2 for a helix diameter of ∼10 Å and 1.5 Å/residue along the helix axis. The so-calculated values of Nresidue are also listed in Table 3 and are seen to be strongly dependent of the particular Vpu protein as would be expected, but not its lipid/protein mole ratio in the mixed monolayer (again with the only exception being the Vpu case at the two higher protein mole fractions).
It should be noted that the modeling described in this section has been applied to 18 independent data sets (three different proteins, each at the same set of six different lipid/protein mole ratios) employing the gradient electron density profile dρ(z)/dz and absolute electron density profile ρ(z) functions which were derived directly from the experimental normalized x-ray reflectivity data with no assumed interrelationships between them (either in terms of the values of the lipid/protein mole ratios employed or the compositional differences among the proteins' cytoplasmic domains). Thus, the fact that the structural parameters determined by the modeling have been subsequently found to be fully consistent with the known values of the lipid/protein mole ratios employed and the compositional similarities and differences among these three proteins is of particular significance.
DISCUSSION
In this work, we have utilized a substantially improved methodology for the model-independent analysis of x-ray reflectivity data from Langmuir monolayers containing various mixtures of a phospholipid with three proteins of systematically differing compositions. This is significant for two reasons, namely: 1), the physical science community which provided this experimental approach (i.e., x-ray/neutron reflectivity and GID) is generally unaware that the phase problem in scattering theory needs to be and can now be solved (Tostmann et al., 2000) to provide the gradient and absolute electron density profiles, dρ(z)/dz and ρ(z), for the monolayers; and 2), the mixed monolayer system studied presents a level of complexity requiring a minimization of assumptions employed in both the analysis of the experimental data and the subsequent modeling of these profiles to provide pertinent structural information concerning the monolayer's components.
The gel phase of the long-chain DLgPC at 45 mN/m and 20°C is somewhat atypical of the gel phase of shorter chain saturated diacylphospholipids. This is most evident by the fact that the electron density profile of the hydrocarbon chain region of the monolayer profile structure is not entirely uniform over its extent in the profile, although its average electron density is typical of gel phase hydrocarbon chains. The nature of this nonuniformity (higher density nearer the headgroups, slightly lower density near the methyl endgroups) is suggestive of some disorder in the average chain configuration nearer the methyl endgroups somewhat reminiscent of that for the electron density profile of the Lα phase of diacyl phospholipids, in which the in-plane packing of the hydrocarbon chains is only very short-range liquidlike order, but to a much lesser extent. This is consistent with the GID results, namely that the in-plane distorted hexagonal packing of the chains is only short range in the nearest neighbor direction, as opposed to that in the next nearest neighbor direction. The first results from molecular dynamics computer simulations of this monolayer system from this laboratory (Sun, 2002) are consistent with such an increased level of disorder for this long-chain diacyl phospholipid, but the relatively small size of the ensemble and relatively short time of the trajectory would not be expected to produce the degree of disorder evident in this experimental work (Lindahl and Edhom, 2000). Despite this somewhat disordered gel phase for DLgPC, the profile length of the hydrocarbon chain region requires an average tilt of the hydrocarbon chains, for all trans configurations, reasonably consistent with that determined directly from the GID results. This is important for this study because as the hydrophobic helix comprising the transmembrane domain of each of the three proteins is incorporated into progressively increasing mole fractions within the hydrocarbon chain region of the profile structures of the mixed monolayers, the hexagonal in-plane packing of the gel phase hydrocarbon chains of DLgPC is progressively destroyed. Thus, the only measure of the average tilt of the hydrocarbon chains and the hydrophobic helix with respect to the normal to the monolayer plane becomes the average thickness of the hydrocarbon chain region in the monolayer profile structures, namely that thickness described by Eq. 5.
More importantly, this study of these two submolecular fragments of Vpu, namely Tm (Vpu2–37) and TmCy (Vpu2–51) in comparison to Vpu itself (Vpu2–81), indicates that the average thickness of the hydrocarbon chain region of the monolayer profile structure, most likely determined by the tilt of the lipid hydrocarbon chains and hydrophobic transmembrane helix with respect to the normal to the monolayer plane, is dependent to a small, but significant extent, on the length of the protein's cytoplasmic domain and this dependence is systematic with variation of the mole fraction of protein in the mixed monolayer. This dependence arises, presumably, from the differing interactions of the different cytoplasmic domains of the three proteins with the surface of the host phospholipid monolayer, as described below, and may be effected through the short, potentially restrictive three-residue loop connecting the hydrophobic transmembrane helix to the first amphipathic helix of the cytoplasmic domain.
In addition, this study indicates that the interactions of the cytoplasmic domains of these three different Vpu molecules, all possessing the same hydrophobic transmembrane helix and hydrophilic three-residue loop connecting to the first seven residues of the first amphipathic helix of Vpu's cytoplasmic domain, with the host phospholipid monolayer surface, are significantly different. In particular, the very short seven-residue helix of Tm's cytoplasmic domain appears least interactive, being easily displaced from the polar headgroup layer at the higher surface pressure of 45 mN/m, as indicated by its largest separation (∼9.2 ± 0.2 Å) from the headgroups in the monolayer profile structure. The first full amphipathic helix of TmCy's cytoplasmic domain containing ∼21 residues appears more interactive lying closer (∼8.4 × 0.3 Å) to the headgroups in the monolayer profile structure, again at the higher surface pressure of 45 mN/m. The presence of both amphipathic helices of Vpu's cytoplasmic domain (a total of ∼51 residues) appears most interactive lying even closer (∼7.1 ± 0.2 Å) to the headgroups in the monolayer profile structure, again at the higher surface pressure of 45 mN/m. The width of the Gaussian function representing the respective cytoplasmic domains of these three proteins was found to be ∼4.5–5.0 Å as expected for the cross-section of an α-helix (Strzalka et al., 2000) lying parallel to the monolayer plane, except for Vpu at the two higher protein/lipid mole ratios where it increases to ∼7–8 Å. This increase may indicate that the two amphipathic helices of Vpu's cytoplasmic domain do not lie in exactly the same plane on the surface of the polar headgroups at the higher protein/lipid mole ratios where the area available on the surface of the headgroups becomes limiting. These results are easily rationalized in terms of the primary and secondary structures of the three proteins. In Fig. 11, the nonpolar side chains are colored blue and labeled with their three-letter acronym whereas the polar residues are colored red. The very short helix in the cytoplasmic domain of Tm is quite hydrophilic whereas the much longer helices in the cytoplasmic domains of TmCy and Vpu itself are clearly amphipathic, the second helix present only in Vpu being more so. Thus, it is not surprising that the separation between the helices of the cytoplasmic domains for the three proteins from the polar headgroups (and hence the hydrocarbon chains) of the host phospholipid within the monolayer profile structure decreases from Tm to TmCy to Vpu. The larger the relative number of nonpolar side chains in the amphipathic helices, the more closely they approach the hydrocarbon chain region based on more favorable enthalpic and entropic effects. This effect would, of course, be expected to depend upon the monolayer surface pressure being relatively high at 45 mN/m in this work relative to the range of that for the corresponding lipid bilayer case (Nagle and Tristram-Nagle, 2000). In our models for the three monolayer systems based on these results shown in Fig. 12, the highly hydrophilic loop connecting the two amphipathic helices of Vpu2–81's cytoplasmic domain has been considered to be disordered extending away from the polar headgroup region of the monolayer profile structure and thereby not contributing significantly to the electron density in that region over the range of lipid/protein mole ratios investigated.
FIGURE 11.
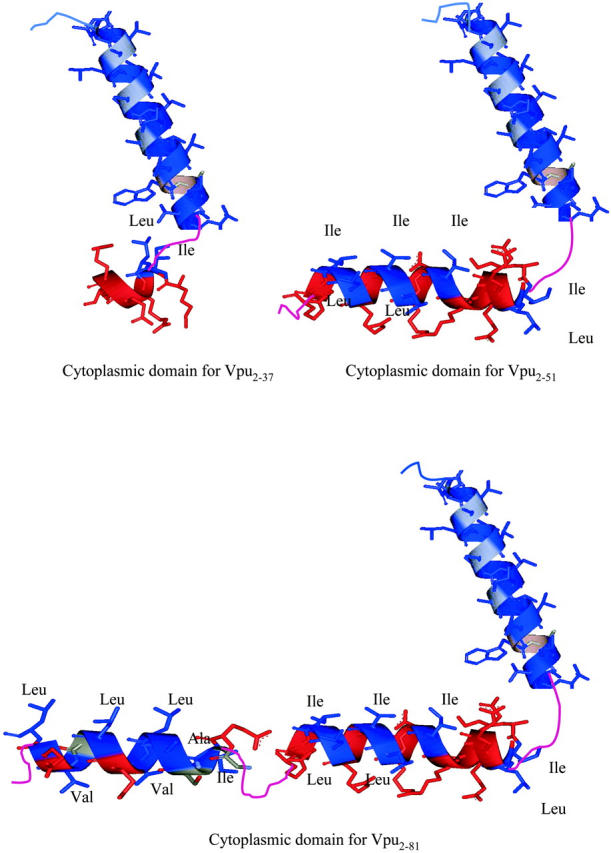
Representations of the primary/secondary structures Tm, TmCy, and Vpu, as determined by NMR for these three proteins in a membranelike environment (Ma et al., 2001), with the nonpolar side chains colored blue and labeled with their three-letter acronym and the polar residues colored red.
FIGURE 12.
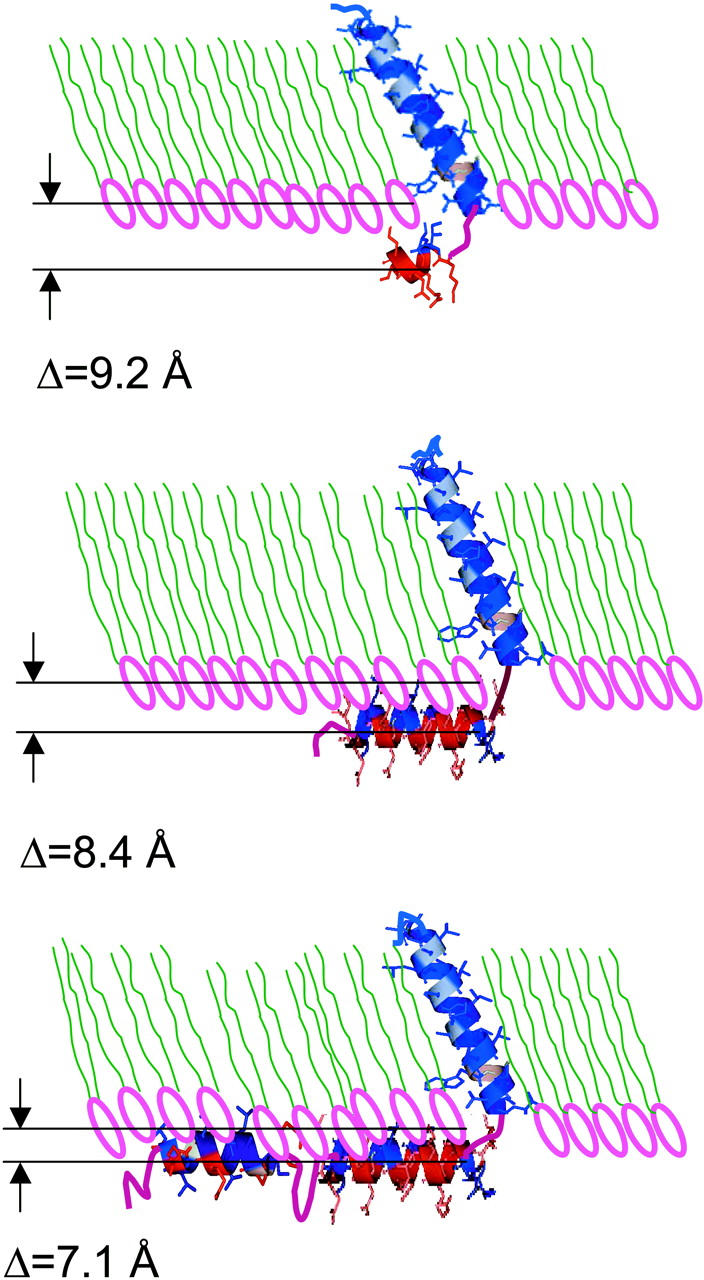
Schematic showing the known secondary structures of Tm (Vpu2–37), TmCy (Vpu2–51), and Vpu (Vpu2–81), incorporated into the host DLgPC monolayer fully consistent with the quantitative analysis of the polar headgroup region in the electron density profiles for the various mixed monolayers over the range of protein/lipid mole ratios of 1:∞, 1:50, 1:40, 1:20, 1:15, and 1:10 at a surface pressure of 45 mN/m and T = 20°C.
Given the relatively short and potentially restrictive three-residue loop EYR connecting the transmembrane hydrophobic helix to the respective cytoplasmic domains of Tm, TmCy, and Vpu, the observed linkage of the differing interactions of their cytoplasmic domains with the surface of the host phospholipid monolayer with the differing thicknesses of the hydrocarbon chain region of the mixed monolayer profiles, most likely determined by the tilt of the lipid hydrocarbon chains and hydrophobic transmembrane helix with respect to the normal to the monolayer plane, is probably not surprising. However, we note that the general magnitude of the estimated tilt angles for all three proteins, as opposed to the small systematic differences in those angles for the three different proteins, is likely be strongly dependent on the particular monolayer system studied here. Specifically, this dependence may arise from the fact that the phospholipid's saturated hydrocarbon chains within a single monolayer solvate the hydrophobic transmembrane helix of the three proteins and that the all trans length of the C24 chain does not exactly match that of the hydrophobic helix. Nevertheless, the cytoplasmic domains of the three proteins were interacting with only a single layer of phospholipid headgroups on a semiinfinite bulk water subphase and the three proteins were each incorporated into the phospholipid monolayer with a unidirectional vectorial orientation, both desirable attributes of a membranelike environment.
The well-ordered α-helical content of the cytoplasmic domain of Vpu, namely ∼23–24 residues, obtained in this work is in good agreement with earlier NMR studies of just its cytoplasmic domain in differing solvent environments (Wray et al., 1995; Federau et al., 1996). Substantially more relevant, the results from this work are also in good agreement with NMR studies of Tm (Vpu2–37), TmCy (Vpu2–51), and Vpu (Vpu2–81) in both phospholipid micellar and multibilayer membranelike environments with regard to both the orientations of the cytoplasmic domain's amphipathic helices with respect to the membrane plane and their respective extents. With regard to the orientation of the hydrophobic transmembrane helix with respect to the plane of the monolayer, our results are in agreement with the NMR results (Marassi et al., 1999; Opella, 2002; personal communication) in one respect, namely that the average tilt angles of the hydrophobic helix are similar for all three proteins. In such NMR studies employing multibilayer membranelike environments, it was found that the tilt of the transmembrane helix with respect to the normal to the membrane plane was similar for all three proteins based on one-dimensional spectra, whereas that for Vpu and Tm was again similar, namely 10–15°, based on more definitive two-dimensional spectra. In the Langmuir monolayers, the estimated tilt angles of the hydrophobic helix of Tm and TmCy were slightly greater than that for Vpu systematically for all lipid/protein mole ratios studied, but the estimated tilt angles in all cases were generally substantially larger than for the multibilayers studied by NMR at much lower protein content. The absence of such small differences among the three proteins may be the result of the limited interbilayer water space in the multibilayers studied by NMR substantially affecting the interaction of the proteins' cytoplasmic domains with the host bilayer (specifically the fact that the respective cytoplasmic domains are interacting with two layers of headgroups from the apposed surfaces of adjacent bilayers in the multibilayer) whereas the hydrophobic thickness of the particular bilayer employed in the NMR studies most likely plays a predominant effect in determining the general magnitude of the tilt angle via so-called hydrophobic matching. Thus, none of these three membranelike environments is ideal, as stated in the Introduction, although each has its desirable attributes. Unfortunately, such detailed structural studies of membrane proteins as provided by NMR spectroscopic and x-ray and neutron scattering methods cannot be applied at present to the most membranelike environment, namely a single lipid bilayer hydrated on both surfaces by semiinfinite bulk water phases containing the protein of interested incorporated with a unidirectional vectorial orientation.
Finally, the channel activities of Tm, TmCy, and Vpu, measured in single bilayers separating two semi-infinite bulk water phases, are qualitatively similar as expected since all three proteins possess the hydrophobic transmembrane helix, but they do differ in detail, whereas the cytoplasmic domain alone exhibits no such channel activity (Ma et al., 2001). Since an oligomeric bundle of some number of these helices would be required for Vpu's cation channel activity, the bundle needing to occur only transiently for such activity, and such bundles generally requiring a “coiled-coil” quaternary structure in which the individual helices are tilted with respect to the bundle axis, achieving the proper tilt of the hydrophobic transmembrane helix may be an important precursor to bundle formation and channel activity.
CONCLUSIONS
Synchrotron radiation-based x-ray reflectivity and GID techniques have been utilized in a comparative study of full-length Vpu (Vpu2–81) and its submolecular fragments Tm (Vpu2–37) and TmCy (Vpu2–51), the latter two proteins possessing differently truncated cytoplasmic domains, each vectorially oriented within long-chain diacyl phospholipid DLgPC monolayers at the water/helium interface as a function of the same six different protein/DLgPC mole ratios at a constant, relatively high surface pressure. Utilizing a significantly improved methodology, the gradient and absolute electron density profiles, dρ(z)/dz and ρ(z) respectively, were derived directly from the reflectivity data, utilizing the model-independent Box Refinement method requiring no a priori assumptions, independently for each of the 18 mixed Tm/DLgPC, TmCy/DLgPC, and Vpu/DLgPC monolayers. The quantitative modeling of these profiles established the localizations of the intramolecular domains of each of the three proteins within the host phospholipid monolayer and confirms an earlier structural study of only Vpu itself. In general, the hydrophobic α-helix of these three proteins is localized within the phospholipid hydrocarbon chain layer of the monolayer profile structure, and the amphipathic α-helices of their cytoplastic domains lie on the surface of the phospholipid headgroups without extending further into the bulk water subphase at this surface pressure. In detail, the larger the extent of the cytoplasmic domain's helices together with their degree of amphipathicity, the stronger their interaction with the surface of the host phospholipid monolayer, resulting in a closer approach to the hydrocarbon chain region in the monolayer's profile structure. This interaction is then observed to have a small, but systematic effect on the average thickness of the hydrocarbon chain region of the monolayer profile structure, dominated presumably by the tilt of the hydrophobic transmembrane helix and the lipid hydrocarbon chains with respect to the normal to the monolayer plane, the effect increasing with increasing extent of the protein's cytoplasmic helices. Further studies employing neutron reflectivity experiments (Blasie and Timmins, 1999), coupled with the isomorphous deuterium labeling of selected sets of hydrogen-rich residues in the transmembrane domain and the cytoplasmic domains, now made possible by the availability of Vpu and its submolecular fragments Tm and TmCy via solid-phase chemical synthesis, will be used to investigate more directly the average tilt of the hydrophobic transmembrane helix with respect to the normal to the monolayer plane and in more detail, the interactions of selected portions of the cytoplasmic domain with the host phospholipid monolayer as a function of surface pressure. Surface pressures in the range of 30–45 mN/m are thought to be most relevant for the comparison of such Langmuir monolayers of phospholipids to their bilayer counterparts (Nagle and Tristram-Nagle, 2000), the x-ray reflectivity studies reported here being at the upper end of that range.
Acknowledgments
We thank Elaine DiMasi and Scott Coburn for assistance with instrument alignment on beamline X22B at NSLS; Elaine Dimasi and Thomas Gog for assistance with instrument alignment on the Sector 09-ID beamline at APS; Ben Ocko for useful discussion; and Andrey Tronin and Shixin Ye for assistance with data collection.
This research was supported by National Institute of General Medical Science Program Project grant PO1 GM56538.
APPENDIX A
In Figs. A1 and A2, gradients of the monolayer electron density profiles dρ(z)/dz derived directly from the experimental normalized reflectivity data via the model-independent Box Refinement method, exactly as described in detail in our earlier publication (Zheng et al., 2001), are shown on the right side (circles) of each figure for the case of Tm and TmCy, respectively, at DLgPC/peptide mole ratios of ∞, 50:1, 40:1, 20:1, 15:1, and 10:1. The hydrocarbon/helium interface is defined here as the z = 0 Å origin which is of no other consequence in these studies. These gradient profiles are fully consistent with the normalized reflectivity data from which they were derived, as shown in the left side of each figure, where the experimental R(qz)/RF(qz) data are shown as circles and the |F(q′z)|2 calculated via Eq. 1 as solid lines. The best nonlinear least-squares fits of the sum of four Gaussian functions to the gradients of the monolayer electron density profiles dρ(z)/dz from Box Refinement, this minimum number of Gaussians required in the sum based on matching criteria (a) and (b) described in the text and Figs. B1 and B2, are shown as the solid lines on the right side of each figure.
FIGURE A1.
As in Fig. 6, expect for different mixtures of Vpu2–37/DLgPC instead of mixtures of Vpu2–81/DLgPC. See details in Appendix A.
FIGURE A2.
As in Fig. 6, expect for different mixtures of Vpu2–51/DLgPC instead of mixtures of Vpu2–81/DLgPC. See details in Appendix A.
FIGURE B1.
As in Fig. 7, expect for different mixtures of Vpu2–37/DLgPC instead of mixtures of Vpu2–81/DLgPC. See details in Appendix B.
FIGURE B2.
As in Fig. 7, expect for different mixtures of Vpu2–51/DLgPC instead of mixtures of Vpu2–81/DLgPC, See details in Appendix B.
APPENDIX B
In Figs. B1 and B2 (left side of each figure, criteria a), Experimental R(qz)/RF(qz) data are shown as circles for the case of Tm and TmCy, respectively, at DLgPC/peptide mole ratios of ∞, 50:1, 40:1, 20:1, 15:1, and 10:1.and the |F(q′z)|2, calculated via Eq. 1 for the best nonlinear least-squares fits of the sum of four Gaussian functions to the gradients of the monolayer electron density profiles dρ(z)/dz from Box Refinement, are shown as the solid lines. (Right side of each figure, criteria b) The top half shows the absolute electron density ρ(z) profiles calculated by analytic integration of the best nonlinear least-squares fits of the sum of four Gaussian functions to the gradients of the monolayer electron density profiles dρ(z)/dz from Box Refinement for the case of Tm and TmCy, respectively, at DLgPC/peptide mole ratios of ∞, 50:1, 40:1, 20:1, 15:1, and 10:1. The bottom half shows the absolute electron density ρ(z) profiles calculated by numerical integration of the gradients of the monolayer electron density profiles dρ(z)/dz from Box Refinement for this case.
References
- Als-Nielsen, J., D. Jacquemain, K. Kjaer, F. Leveiller, M. Lahov, and L. Leiserowitz. 1994. Principles and applications of grazing-incidence x-ray and neutron scattering from ordered molecular layers at the air-water interface. Phys. Reports. 246:251–313. [Google Scholar]
- Als-Nielsen, J., and P. S. Pershan. 1983. Synchrotron x-ray diffraction study of liquid surface. Nucl. Instrum. Methods. 208:545–548. [Google Scholar]
- Blasie, J. K., and P. Timmins. 1999. Neutron scattering in structural biology and biomolecular materials. MRS Bull. 24:40–47. [Google Scholar]
- Braslau, A., P. S. Pershan, G. Swislow, B. M. Ocko, and J. Als-Nielsen. 1988. Capillary waves on the surface of simple liquids measured by x-ray reflectivity. Phys. Rev. A. 38:2457–2470. [DOI] [PubMed] [Google Scholar]
- Emerman, M., and H. M. Malim. 1998. HIV-1 regulatory/accessory genes:keys to unraveling viral and host cell biology. Science. 280:1880–1884. [DOI] [PubMed] [Google Scholar]
- Ewart, G. D., T. Sutherland, P. W. Gage, and G. B. Cox. 1996. The Vpu protein of human immunodeficiency virus type 1 forms cation-selective ion channels. J. Virol. 70:7108–7115. [DOI] [PMC free article] [PubMed] [Google Scholar]
- Gross, E., and B. Witkop. 1961. Selective cleavage of methionyl peptide bonds in ribonuclease with cyanogen bromide. J. Am. Chem. Soc. 83:1822–1832. [Google Scholar]
- Federau, T., U. Schubert, J. Flobdorf, P. Henklein, D Schomburg, and V. Wray. 1996. Solution structure of the cytoplasmic domin of the human immunodeficiency virus type 1 encoded virus protein U (Vpu). Int. J. Peptide Protein Res. 47:297–310. [DOI] [PubMed] [Google Scholar]
- Helm, C. A., P. Tippmann-Krayer, H. Möhwald, J. Als-Nielsen, and K. Kjaer. 1991. Phases of phosphatidyl ethanolamine monolayers studied by synchrotron x-ray scattering. Biophys. J. 60:1457–1476. [DOI] [PMC free article] [PubMed] [Google Scholar]
- Nagle, J. F., and S. Tristram-Nagle. 2000. Structure of lipid bilayers. Biochim. Biophys. Acta. 1469:159–195. [DOI] [PMC free article] [PubMed] [Google Scholar]
- Lindahl, E., and O. Edhom. 2000. Mesoscopic undulations and thickness fluctuations in lipid bilayers from molecular dynamics simulations. Biophys. J. 79:426–433. [DOI] [PMC free article] [PubMed] [Google Scholar]
- Lösche, M., M. Piepenstock, A. Diedrich, T. Grünewald, K. Kjaer, and D. Vaknin. 1993. Influence of surface chemistry on the structural organization of macromolecular protein layers adsorbed to functionalized aqueous interfaces. Biophys. J. 65:2160–2177. [DOI] [PMC free article] [PubMed] [Google Scholar]
- Ma, C., F. M. Marassi, D. H. Jones, S. K. Straus, S. Bour, K. Strebel, U. Schubert, M. Oblatt-Montal, M. Montal, and S. J. Opella. 2001. Expression, purification, and activities of full-length and truncated version of the integral membrane protein Vpu from HIV-1. Protein Sci. 11:546–557. [DOI] [PMC free article] [PubMed] [Google Scholar]
- Makowski, L. 1981. The use of continuous diffraction data as a phase constraint. I. One-dimensional theory. J. Appl. Crystallogr. 14:160–168. [Google Scholar]
- Maldarelli, F., M. Chen, R. L. Willey, and K. Strebel. 1993. Human immunodeficiency virus type 1 Vpu protein is an oligomeric type I integral membrane protein. J. Virol. 67:5056–5061. [DOI] [PMC free article] [PubMed] [Google Scholar]
- Marassi, F. M., C. Ma, H. Gratkowski, S. K. Straus, K. Strebel, M. Oblatt-Montal, M. Montal, and S. J. Opella. 1999. Correlation of the structural and functional domains in the membrane protein Vpu from HIV-1. Proc. Natl. Acad. Sci. USA. 96:14336–14341. [DOI] [PMC free article] [PubMed] [Google Scholar]
- Ocko, B. M., X. Z. Wu, E. B. Sirota, S. K. Sinha, O. Gang, and M. Deutsh. 1997. Surface freezing in chain molecule: normal alkanes. Phys. Rev. E. 55:3164–3182. [Google Scholar]
- Schubert, U., S. Bour, A. V. Ferrer-Montiel, M. Montal, F. Maldarelli, and K. Strebel. 1996. The two biological activities of human immunodeficiency virus type 1 Vpu protein involve two separable structure domains. J. Virol. 70:809–819. [DOI] [PMC free article] [PubMed] [Google Scholar]
- Schubert, U., and K. Strebel. 1994. Differential activities of the human immunodeficiency virus type 1-encoded Vpu protein are regulated by phosphorylation and occur in different cellular compartments. J. Virol. 68:2260–2271. [DOI] [PMC free article] [PubMed] [Google Scholar]
- Stroud, R. M., and D. A. Agard. 1979. Structure determination of asymmetric membrane profiles using an iterative Fourier method. Biophys. J. 25:495–512. [DOI] [PMC free article] [PubMed] [Google Scholar]
- Strzalka, J., X. Chen, C. C. Moser, P. L. Dutton, B. M. Ocko, and J. K. Blasie. 2000. X-ray scattering studies of maquette peptide monolayer. 1. Reflectivity and grazing incidence diffraction at the air/water interface. Langmuir. 16:10404–10418. [Google Scholar]
- Sun, F. 2002. Constant normal pressure, constant surface tension, and constant temperature molecular dynamics simulation of a hydrated 1,2-dilignoceroylphosphatidylcholine monolayer. Biophys. J. 82:2511–2519. [DOI] [PMC free article] [PubMed] [Google Scholar]
- Tostmann, H., E. DiMasi, O. G. Shpyrko, P. S. Pershan, B. M. Ocko, and M. Deutsch. 2000. Microscopic structure of the wetting film at the surface of liquid Ga-Bi alloys. Phys. Rev. Lett. 84:4385–4388. [DOI] [PubMed] [Google Scholar]
- Willey, R. L., F. Maldarelli, M. Martin, and K. Strebel. 1992. Human immunodeficiency virus type 1 Vpu protein induces rapid degradation of CD4. J. Virol. 66:7193–7200. [DOI] [PMC free article] [PubMed] [Google Scholar]
- Willbold, D., S. Hoffmann, and P. Rösch. 1997. Secondary structure and tertiary fold of the human immunodeficiency virus protein U (Vpu) cytoplasmic domain in solution. Eur. J. Biochem. 245:581–588. [DOI] [PubMed] [Google Scholar]
- Wray, V., T. Federau, P. Henklein, S. Klabunde, O. Kunert, D. Schomburg, and U. Schubert. 1995. Solution structure of the hydrophilic region of HIV-1 encoded virus protein U (Vpu) by CD and 1H NMR spectroscopy. Int. J. Peptide Protein Res. 45:35–43. [DOI] [PubMed] [Google Scholar]
- Yu, S., N. Smith, P. G. Harding, and F. Possmayer. 1983. Bovine pulmonary surfactant: chemical composition and physical properties. Lipids. 18:522–529. [DOI] [PubMed] [Google Scholar]
- Zheng, S., J. Strzalka, C. Ma, S. J. Opella, B. M. Ocko, and J. K. Blasie. 2001. Structural studies of the HIV-1 accessory protein Vpu in Langmuir monolayers: synchrotron x-ray reflectivity. Biophys. J. 80:1837–1850. [DOI] [PMC free article] [PubMed] [Google Scholar]
- Zhou, X. L. 1995. Quantitative analysis of the nonlinear relationship between neutron or x-ray reflectance and the scattering density profile. Phys. Rev. E52:1938–1952. [DOI] [PubMed] [Google Scholar]


