

Abstract
The analysis of peptide and protein partitioning in lipid membranes is of high relevance for the understanding of biomembrane function. We used statistical thermodynamics analysis to demonstrate the effect of peptide mixing behavior on heat capacity profiles of lipid membranes with the aim to predict peptide aggregation from cP-profiles. This analysis was applied to interpret calorimetric data on the interaction of the antibiotic peptide gramicidin A with lipid membranes. The shape of the heat capacity profiles was found to be consistent with peptide clustering in both gel and fluid phase. Applying atomic force microscopy, we found gramicidin A aggregates and established a close link between thermodynamics data and microscopic imaging. On the basis of these findings we described the effect of proteins on local fluctuations. It is shown that the elastic properties of the membrane are influenced in the peptide environment.
INTRODUCTION
Lipid membranes mainly occur in two different phases. In the solid-ordered low temperature phase (gel phase) the lipid chains display a triangular crystalline arrangement (Janiak et al., 1979), and the hydrocarbon chains are ordered. In the liquid-unordered high temperature phase (fluid phase), hydrocarbon chain states are unordered and degenerate, and the crystalline order is lost. The melting transition between these phases occurs in a biologically relevant temperature regime (from −20°C to +60°C). Lung surfactant (Ebel et al., 2001) and the plasma membranes of Escherichia coli (Baldassare and Silbert, 1976; unpublished results from our group) display pronounced melting peaks slightly below body temperature.
Proteins and small polypeptides may insert into lipid membranes. It is known from calorimetry that peptides and proteins influence the chain melting transition of lipid membranes. Usually, transition profiles are broadened and/or shifted to either lower or higher temperatures. The integral band 3 protein of erythrocytes leads to a pronounced broadening of the heat capacity profiles, accompanied by a shift of the cP-profiles to higher temperatures (Morrow et al., 1986). The small cyclic peptide gramicidin S, on the other hand, induces a shift of the heat capacity events to lower temperatures (Prenner et al., 1999). Cytochrome c, when adsorbed to charged lipid membranes, shifts melting events to higher temperatures, probably due to electrostatic interactions (Heimburg and Biltonen, 1996). The shape of the heat capacity profiles contains thermodynamic information on the modes of interaction between peptides and lipids (Heimburg and Biltonen, 1996; Heimburg and Marsh, 1996; Ivanova and Heimburg, 2001), for example about their spatial organization. For integral peptides it has been demonstrated that the effect of peptides on the chain melting profile is highly dependent on the chain length of the lipids (Zhang et al., 1995). This can be understood in terms of the “hydrophobic matching” concept, which implies that the interaction between integral proteins and lipids depends on the relative length of their hydrophobic cores (Sperotto and Mouritsen, 1991; Mouritsen and Sperotto, 1992; Dumas et al., 1999). It has been proposed theoretically that the hydrophobic matching controls peptide partitioning in lipid membranes via lipid mediated forces (Sperotto, 1997; Gil et al., 1997, 1998; Mouritsen, 1998). Phase diagrams of lipid-peptide mixtures can be calculated using lattice models (Zhang et al., 1993) and heat capacity profiles can be obtained (Zhang et al., 1993; Heimburg and Biltonen, 1996; Ivanova and Heimburg, 2001).
The phase behavior of lipid mixtures and lipid-peptide complexes can be analyzed with mean field models (Lee, 1977; Johann et al., 1996) or with lattice simulations (Ipsen et al., 1989; Cruzeiro-Hansson et al., 1990; Mouritsen and Sperotto, 1992; Mouritsen et al., 1995). Whereas mean-field models make no statements on local states of organization, lattice models predict limited size domains, local aggregation of membrane components, and compositional fluctuations (Mouritsen and Jorgensen, 1995; Mouritsen, 1998).
Since the finding of domains in biological membranes, often called rafts (Simons and Ikonen, 1997; Brown and London, 1998; Harder et al., 1998; Rietveld and Simons, 1998; Bagnat et al., 2000), it became increasingly clear that the understanding of the partitioning of peptides and proteins in lipid membranes is of major importance for understanding signaling pathways in biological systems. The understanding of peptide aggregation processes in membranes may also be of relevance to optimize conditions for two-dimensional crystal formation of membrane proteins. The problems associated with creating crystals of membrane proteins leads to a lack of detailed membrane protein structures (Rigaud et al., 2000; Rosenbusch, 2001).
Along with the theoretical predictions of protein clustering, one has to find experimental tools how these processes can be investigated. One of the most suitable methods to study protein aggregation processes is AFM because of its high spatial resolution. In several recent AFM studies, peptide aggregation in membranes has been studied. In gel phases, line-shaped peptide aggregates were identified (Mou et al., 1996; Tamm et al., 1996; Leonenko et al., 2000) that may arrange into ordered patterns (Rinia et al., 2000). Recently, clustering of gramicidin A in monolayers was also reported (Diociaiuti et al., 2002). In a further recent study, it has been shown by fluorescence microscopy that gramicidin A alters the phase behavior of binary lipid mixtures (Fahsel et al., 2002).
The lipid membrane changes its thickness by ∼13% in the chain melting transition (Heimburg, 1998). Thus, mixing behavior of peptides in the two lipid phases is expected to alter upon lipid chain melting in a manner that depends on size and shape of the peptide and of the lipid chain length (Zhang et al., 1995). The intention of the present study is to put peptide aggregation close to the chain melting temperature into a thermodynamics context. Using MC simulations to analyze heat capacity profiles of lipid-peptide mixtures, criteria are defined about when to expect peptide clustering. The resulting predictions are tested on gramicidin A-phospholipid membranes, using AFM. The results of the thermodynamic modeling are then discussed with respect to the influence of the peptides on the elastic properties of their lipid environment.
MATERIALS AND METHODS
Lipids were purchased from Avanti Polar Lipids (Birmingham, AL) and gramicidin A from Fluka (Buchs, Switzerland). Lipids and gramicidin were mixed in organic solvent and dried in a desiccator. Multilamellar vesicles were prepared by dissolving and vortexing dry samples in a 5 mM Hepes, 1 mM EDTA buffer at pH 7.5. LUV were prepared from the MLV dispersions using an extruder (Avestin, Ottawa, Canada) with a filter pore size of ∼100 nm. Heat capacity profiles have been obtained using a MicroCal VP calorimeter at scan rates of 1–5 deg/h. To prepare samples for AFM, lipid dispersions containing gramicidin A were sonicated using a Model W185 sonifier from Heat System-Ultrasonics (Plainview, NY). The resulting small unilamellar vesicles were exposed to a clean mica surface where they fused to form a single bilayer film. The excess vesicles were washed away from the membrane surface using a moderate salt solution (150 mM NaCl). The mica surface may in principle hinder the equilibration of the lipid system. We assumed, however, that the gramicidin bilayers are equilibrated as vesicles in solution before they are exposed to the mica. The samples were imaged in buffer with a Nanoscope III atomic force microscope (Digital Instruments, Santa Barbara, CA). Cantilevers with nominal spring constants between 0.06 and 0.32 N/m and oxide-sharpened silicon nitride tips (Digital Instruments) were used in contact mode. Line scan frequencies were between 2 and 8 Hz. The images are unfiltered except for slope removal along each scan line to level the image. All experiments were repeated several times and found to be reproducible.
Simulations on lipid peptide systems have been performed using a histogram technique, which is based on extensive MC sampling. This technique allows calculation of smooth heat capacity profiles quasianalytically (see Theory section). The calculation of this histogram followed the description given by Ivanova and Heimburg (2001) for two-dimensional histograms, which was used to describe melting profiles in the absence of peptides. The degeneracy of states, Ω(nf, ngf, ngp, nfp) was generated by sampling the four-dimensional probability distribution, P(nf, ngf, ngp, nfp) into a histogram with 100 × 50 × 60 × 60 = 18 · 106 bins (bin width was 0.01 × 0.02 × 0.01 × 0.01, given in units of fluid fraction, and as average number of contacts per lipid). For symmetry reasons (exchanging gel and fluid lipids) the effective histogram size is only 9 · 106 bins. To obtain the histograms, ∼3000 independent MC simulations on a 31 × 31 matrix with 105 cycles each were performed (one cycle corresponding to 31 × 31 attempts to change a lipid state and to move a peptide. Diffusion was modeled by nearest neighbor exchange). The values of the parameters ωgf, ωgp, and ωfp and the temperature, T, were varied between the individual simulations in the following parameter range: 300 cal/mol ≤ ωgf ≤ 330 cal/mol, 0 cal/mol ≤ ωgp ≤ 900 cal/mol, 0 cal/mol ≤ ωfp ≤ 900 cal/mol, 300 K ≤ T ≤ 330 K. Calculations of heat capacity curves, using the histogram technique, are meaningful within this parameter range. The melting enthalpy (ΔH = 36.4 kJ), the melting entropy (ΔS = ΔH/310.3 K) and the peptide fraction were kept constant. Due to limited computer time, the individual histograms do not cover the complete phase space but only finite regions, depending on the parameter set. Thus they are not complete. To obtain one universal histogram that covers the whole phase space, one has to recalculate the individual histograms into histograms that correspond to the same set of parameters (in our case we used ΔH = 36.4 kJ/mol, ΔS = 117.3 J/mol · K, ωgf = ωgp = ωfp = 1.26 kJ/mol and T = 310.3 K). This can be done using the algorithms developed by Ferrenberg and Swendsen (1988). All histograms now have the same shape, but they contain values only in limited but partially overlapping regions of the phase space. Since the individual histograms are incomplete, they cannot be normalized correctly. However, they can all be merged into one big histogram. The individual histograms are matched to the same amplitude in the regions where they overlap (Bowen et al., 1989; Ivanova and Heimburg, 2001). After matching all 3000 histograms (we used an automized computer procedure), one obtains one four-dimensional histogram that covers the whole accessible phase space, which can now be normalized such that the sum of all probabilities is unity. This histogram can be used to calculate heat capacity values for all sets of parameters (ΔH, ΔS, ωgf, ωfp, ωgp, and T) using the Ferrenberg/Swendsen approach. We tested the quality of the histogram by comparing the heat capacity profile from the histogram calculation with MC simulations using a defined set of parameters. The curves from the two different simulations were exactly superimposible. However, a cP-profile can be obtained from the histogram technique within a minute, whereas it takes about a day using a plain MC simulation (on a 1-GHz Pentium processor). For the pure lipid system without peptides (two-dimensional histogram all steps in this calculation are shown in Ivanova and Heimburg (2001), we created one histogram for 5% and one histogram for 10% of all lattice sites being occupied by peptides.
In one simulation, we used peptides that occupy four lattice sites instead of one site. For this problem we did not create a histogram. Diffusion of the four-site peptides was performed by moving the peptide in one of six possible directions, and by moving the lipids from one side to the opposite side of the peptide.
THEORY
Model
In the literature, the chain melting transition has been analyzed theoretically using lattice models of various complexity, ranging from two-state Isinglike models (Sugar et al., 1994; Ivanova and Heimburg, 2001) to the 10-state Pink model (Pink et al., 1980; Mouritsen et al., 1983; Mouritsen, 1990). In some studies, such models have been applied to lipid protein mixtures to calculate phase diagrams (Sperotto et al., 1989; Zhang et al., 1993) and heat capacity profiles (Heimburg and Biltonen, 1996; Ivanova and Heimburg, 2001). Doniach (1978) found that the melting behavior is well described using a modified Ising model, one state representing a gel state lipid and the other one a fluid lipid. Models using more states do not significantly alter the overall physical picture (Mouritsen et al., 1983). This is due to the fact the these models are well suited to describe the cooperative properties of chain melting on length scales larger than the molecular size of a lipid. Therefore, the molecular modeling of a lipid is not a critical factor. It is also not crucial whether lipids are located on triangular lattices (Sugar et al., 1994; Heimburg and Biltonen, 1996) or whether lipid chains are located on such lattices (Sugar et al., 1999) as found in experiments on gel phase lipids (Janiak et al., 1979). Two-state models, however, have the advantage that they contain only very few parameters, all of which are accessible from the calorimetric experiments (Ivanova and Heimburg, 2001).
For a pure lipid system, the Hamiltonian of a two-state model can be written as (Sugar et al., 1994; Ivanova and Heimburg, 2001)
 |
(1) |
where nf is the number of fluid lipids, ΔE is the energy difference of fluid and gel membranes (per lipid), and ngf is the number of gel-fluid lipid contacts in the lipid matrix. The cooperativity parameter ωgf is defined as ωgf = ɛgf − (ɛgg + ɛff)/2, where the ɛij are the contact energies between molecule i and j. This definition of ωgf is analogous to that used in regular solution theory (Lee, 1977; Johann et al., 1996). A Gibbs free energy of a microconfiguration can be defined by (Sugar et al., 1994; Ivanova and Heimburg, 2001)
 |
(2) |
where the enthalpy increment is given by ΔH = ΔE + p ΔV. This equation contains three parameters, ΔH, ΔS, and the cooperativity parameter ωgf, which are related to experimental values, namely to the melting enthalpy, the melting entropy or the melting point Tm (=ΔH/ΔS), and to the transition halfwidth, respectively.
During MC simulation, the enthalpy of the lipid matrix fluctuates around a mean value. The mean-square deviations are proportional to the heat capacity:  . Therefore the heat capacity can be obtained during a simulation.
The concepts outlined above can be extended to systems with several components (Sugar et al., 1999; Ivanova and Heimburg, 2001). Let us assume that the lipid matrix additionally contains np peptides that occupy one lattice site each. The Gibbs free energy of a microconfiguration is now given by
 |
(3) |
where ngp and nfp are the number of contacts between gel and fluid lipids and peptides, respectively. ωgp and ωfp are the associated contact parameters ωij = ɛij − (ɛii + ɛjj)/2, where ɛij again is the contact energy between molecules in state i and j). If either ωgp or ωfp is zero, peptides will mix ideally with the respective lipid phase.
Monte Carlo simulations and large histograms
For a given set of parameters (ΔH, ΔS, ωgf, ωgp, ωfp, T), the probability that the system is found in a state of defined configurational free energy is given by
 |
(4) |
where Ω(nf, ngf, ngp, nfp) is defined as the degeneracy of states (or density of states) with the free energy ΔG(nf, ngf, ngp, nfp). In contrast to ΔG, the degeneracy Ω is independent of the thermodynamic parameters (ΔH, ΔS, ωgf, ωgp, ωfp) and the temperature. No analytical solution for this degeneracy is known for the two-dimensional system. It can, however, be obtained in statistical thermodynamics (MC) computer simulations. Once Ω is known for the whole phase space, it can be used to generate solutions for all sets of parameters without redoing the MC simulations (Ferrenberg and Swendsen, 1988). Practically, this is done in a histogram technique described in the Materials and Methods section (see also Ivanova, 2000; Ivanova and Heimburg, 2001). Briefly, we simulated the lipid peptide mixing behavior at different temperatures and at different values for the nearest neighbor interactions parameters (ωgf, ωgp, ωfp). The protein concentration was fixed. For each set of parameters, we counted how often a state within a small interval (bin) of the number of nearest neighbor interactions ((nf, nf + Δnf), (ngf, ngf + Δngf), (ngp, ngp + Δngp), (nfp, nfp + Δnfp)) was found. The four-dimensional matrix of bins is called a histogram. Each histogram contains the information about the degeneracy of states, Ω, in a small part of the phase space. We simulated several thousand histograms for all relevant sets of parameters and merged them into one big histogram that contains the information of the whole accessible phase space (for details see Ivanova and Heimburg (2001) and the Materials and Methods sections).
This procedure allows us to generate smooth heat capacity profiles for a given set of parameters within a few seconds without redoing the computer simulation. The advantage of this is that one can fit experimental heat capacity profiles, which would be very time consuming in a simulation. Furthermore, the heat capacity profiles can be generated without the usual statistical noise of simulations, since it is based on the collective information of thousands of independent simulations.
For this work, we generated three histograms, with 0%, 5%, and 10% of all matrix sites being occupied by peptides. All smooth heat capacity simulations in the absence of lipids and with one-site peptides in the following have been obtained with this method.
RESULTS AND DISCUSSION
Monte Carlo simulations of limiting cases
Even though the lipid-peptide interaction parameters may assume arbitrary values, depending on the nature of the peptide and the lipid, it is useful to discuss some simple limiting cases of peptide mixing behavior on the heat capacities, which demonstrate the effect of the parameter changes on the heat capacity profiles.
We described lipid peptide systems with MC simulations (Sugar et al., 1994, 1999; Heimburg and Biltonen, 1996; Heimburg and Marsh, 1996; Ivanova and Heimburg, 2001) using a planar, triangular lattice (applying standard Glauber/Kawasaki algorithms for changing states and for diffusion in a canonical ensemble). Values for ΔH, ΔS, and the cooperativity parameter ωgf were obtained by fitting calculated heat capacity profiles to experimental curves (Ivanova and Heimburg, 2001). For unilamellar DPPC vesicles, these parameters amount to ΔH = 36.4 kJ/mol, ΔS = 115.87 J/mol · K, and ωgf ≈ 1326 J/mol (depending on sample preparation). Thus, the only free parameters in Eq. 3 are the nearest neighbor contact parameters ωgp and ωfp of the peptide with the two lipid states.
As one limiting case, let us now assume that the hydrophobic matching plays an important role for the nearest neighbor interactions. If the hydrophobic core of the peptide has a similar length as the thickness of a fluid lipid membrane (ωfp = 0), good mixing of the peptide in this phase will be the result, and it can usually be expected that the contact parameter between gel lipids and peptides is unfavorable (ωgp > 0). Upon addition of 5% or 10% of an integral peptide (a peptide that inserts into the membrane, occupying one lattice site each), melting profiles shift to lower temperatures with an extended wing at the low temperature end (Fig. 1 a, left), accompanied by an accumulation of the peptide in the remaining fluid phase domains (MC snapshots in Fig. 1 a). The shift to lower temperatures is a consequence of the higher peptide-lipid interfacial energy in the gel phase. The asymmetry of the profiles results from the change in mixing behavior. A comparable case is a peptide with a length identical to that of a gel membrane (ωgp = 0, ωfp > 0, Fig. 1 b). Under these circumstances, melting profiles shift to higher temperatures and display a wing at the high temperature end. Experimental examples for either behavior can be found in the literature (Morrow et al., 1986; Zhang et al., 1995; Prenner et al., 1999). The limiting cases in Fig. 1, a and b, were already discussed previously in a simpler but similar case (where ωgp = ωgf and ωfp = 0, or ωfp = ωgf and ωgp = 0 (Heimburg and Biltonen, 1996; Ivanova and Heimburg, 2001)).
FIGURE 1.

Calculated heat capacity profiles (left panels), and Monte Carlo snapshots of lipid membranes in the melting regime with 10% inserted peptides at temperatures below and above the heat capacity maximum (right panels) in the absence (dark line) and the presence (gray line) of peptides. The solid lines are the result of the Monte Carlo simulations (for details, see Ivanova and Heimburg (2001)). Light blue dots represent fluid lipids, dark blue dots are gel lipids, and red dots are peptides. Periodic boundary conditions were used. Simulation parameters were ΔH = 36.4 kJ/mol, Tm = 314.2 K and ωgf = 1326 J/mol. Four limiting cases are shown: (a) Peptides mix ideally with the fluid phase (ωfp = 0 J/mol), but accumulate at low temperatures in the remaining fluid domains (ωgp = 1674 J/mol). Upon addition of peptides, the heat capacity profiles shift to lower temperatures and display a pronounced shoulder at the low temperature end. (b) Peptides mix ideally with the gel phase (ωgp = 0 J/mol), but accumulate at low temperatures in the remaining fluid domains (ωfp = 400 cal/mol). Upon addition of peptides the heat capacity profiles shift to higher temperatures and display a pronounced shoulder at the high temperature end. (c) Peptides mix ideally with both gel and fluid membrane (ωgp = ωfp = 0 J/mol), leading to a symmetric broadening of the heat capacity profile in the presence of proteins. (d) Nonideal mixing in both gel and fluid phase (ωfp = 2029 J/mol, ωgp = 2029 J/mol). Peptide aggregation occurs in both lipid phases. The heat capacity profiles are only slightly affected upon peptide insertion and are not very dependent on peptide concentration.
Even simpler is the case where ideal mixing of peptides in both lipid phases is assumed (ωgp = ωfp = 0). The effect of the addition of 10% of peptide on the heat capacity profiles is a symmetric broadening of the heat capacity profiles (Fig. 1 c). This is due to the fact that peptides located between gel and fluid domains lower the overall line tension and thus the cooperativity of the melting transition.
A further limiting case arises when peptides do not mix well with both phases (ωgp, ωfp > 0). The peptides aggregate into clusters at all temperatures (Fig. 1 d). The effect on the melting profiles is relatively small because the peptides have a reduced interface with the lipids due to aggregation and consequently have a small effect on lipid melting.
Calorimetric results of membranes containing gramicidin A
Gramicidin A is a small peptide forming a head-to-head dimer (Andersen et al., 1999a), which acts as an antibiotic. It has been proposed that depending on the bilayer thickness, it may exist in equilibrium with a monomeric fraction (Andersen et al., 1999b). It has furthermore been suggested that the hydrophobic matching of gramicidin A with lipid membranes is important for its function (Harroun et al., 1999a,b). The gramicidin A dimer (Fig. 2 a, NMR structure in DMPC by Ketchem et al. (1993)) is relatively short (2.6 nm). In particular, it is shorter than both gel and fluid phases of DMPC and DPPC membranes (between 3.5 and 4.8 nm). Therefore, it may be expected that this peptide resembles the case simulated in Fig. 1 d. However, since fluid lipids are shorter than gel lipids, one may expect a better matching of fluid lipids with gramicidin A, and therefore a shift of the cP-profiles to lower temperatures. Upon incorporation of gramicidin A into DMPC and DPPC multilamellar vesicles, it is indeed found in calorimetric experiments that the heat capacity profiles are only very slightly shifted to lower temperatures with a small asymmetry at the low temperature end. Larger amounts of peptide do not alter this behavior very significantly (Fig. 2, b and c). Thus, the lipid melting behavior of DMPC and DPPC membranes containing gramicidin A is very similar to that expected for a peptide that aggregates in both gel and fluid phase, with a slight preference for the fluid phase. The modeling suggests that the heat capacity profiles of lipid melting contain information about the states of mixing of the components in the pure phases, despite the simplicity of the model introduced in the previous paragraph and the fact that gramicidin rather occupies four lattice sites, such that the entropy of mixing is overestimated in the calculation (see paragraphs below). From the analysis, aggregation of gramicidin A is predicted in both lipid phases of DMPC and DPPC. A shoulder at the low temperature end of the heat capacity profile indicates unfavorable partitioning in the low temperature phase. The calorimetric data therefore indicate that mixing of gramicidin A is less favorable in the gel phase of DPPC than in the gel phase of DMPC, because the shoulder is more pronounced. This is reasonable because the difference of the hydrophobic cores of gramicidin and DPPC bilayers is larger than the difference between gramicidin and DMPC. Our data therefore support the hydrophobic matching concept (Mouritsen and Sperotto, 1992; Dumas et al., 1999).
FIGURE 2.

Gramicidin A in zwitterionic lipid membranes. (a) Gramicidin A (NMR structure (Ketchem et al., 1993)) in gel phase DMPC lipids. The peptide is significantly shorter than the thickness of the gel membrane and unfavorable peptide mixing can be expected. (b) Experimental heat capacity profiles of gramicidin A in DMPC multilamellar vesicles with 0, 1, and 2 mol% peptide corresponding to ∼0, 4, and 8 area%. (c) Experimental heat capacity profiles of gramicidin A in DPPC multilamellar vesicles with 0, 1, and 2 mol% peptide, corresponding to ∼0, 4, and 8 area%. In all examples, addition of gramicidin A results in a minor shift to lower temperatures with a small asymmetry at the low temperature side.
Simulation of experimental heat capacities of gramicidin containing membranes
One site per peptide
We took the calorimetric profiles of gramicidin A in large unilamellar DPPC vesicles, and selected an optimized set of parameters to describe the shape of the cP-curves (Fig. 3). First, we fitted the calorimetric profile of DPPC LUV in the absence of peptide, using the experimental values for ΔH = 36.4 kJ/mol and the melting temperature Tm = 314.2 K (Fig. 3, left (top trace)). The transition width was best described using a nearest neighbor (gel-fluid) interaction parameter of ωgf = 1326 J/mol. MC snapshots at three different temperatures below Tm, in the melting regime, and above Tm are shown on the right- hand side of Fig. 3 (top row). We did not attempt to fit the cP-profiles of the MLV preparations shown in Fig. 2. Due to interbilayer interactions, it is difficult to fit the pure lipid heat capacity trace (Heimburg, 2000a; Ivanova and Heimburg, 2001). Our minimal model, however, does not include such interactions and is rather applicable for unilamellar systems. It should, however, be noted that unilamellar and multilamellar systems behave qualitatively similar.
FIGURE 3.

Gramicidin A in DPPC LUV: Experiment and simulations in the case of one-site peptides and four-site peptides. (Left) Heat capacity traces of DPPC LUV in the absence (top traces) and in the presence of 1.25 mol% gramicidin A (center and bottom traces). The red solid lines represent calorimetric curves and the dashed/dotted lines represent theoretical profiles from the simulations described in the text. The theoretical profiles, which best described the experimental profiles, are given as black dashed lines. The heat capacity simulations of the center trace was simulated using a model where each peptide occupies one lattice site and 5% of all lattice sites are occupied by peptides (corresponding to the overall area occupied by gramicidin in the experiments). To demonstrate the uniqueness of the best theoretical profile, two more profiles with an identical shift of the cP-maximum but different absolute values for ωgp and ωfp are also given (blue and green dashed/dotted lines). The bottom trace was simulated assuming a peptide that occupies four lattice sites each (see cross section through one peptide in the figure) and 5% of all lattice sites were occupied by peptides (corresponding to 1.25 mol% of the peptide). The best theoretical profile is again given by the black dashed line. Following simulation parameters were used for best agreement with the calorimetric data: ΔH = 36.4 kJ/mol, Tm = 314.2 K, and ωgf = 1326 J/mol, and in the presence of 5 mol% one-site peptides ωfp = 1464 J/mol, ωgp = 1778 J/mol (left, center trace, and center row of the MC snapshots) and in the presence of 1.25 mol% four-site peptides ωfp = 628 J/mol, ωgp = 1674 J/mol (left, bottom trace, and bottom row of the MC snapshots). (Right) Monte Carlo snapshots of the simulations for the three different cases at three different temperatures, below Tm, in the melting regime, and above Tm, respectively. The three snapshots at the top correspond to the simulation of DPPC LUV in the absence of peptides, the center three snapshots to the simulation with 10% peptides occupying one lattice site each. The three snapshots at the bottom correspond to the simulation with 2.5 mol% of peptides occupying four lattice sites each.
The above three parameters were also used for describing profiles of DPPC LUV in the presence of gramicidin A. Since in our simple model each peptide occupies one lattice site, whereas the physical size of gramicidin A corresponds to ∼4 lattice sites, we occupied the lattice with 5% peptides to describe membranes containing 1.25 mol% gramicidin A. We found that the calorimetric profile could be reasonably well described using a parameter set with ωgf = 1326 J/mol, ωfp = 1464 J/mol, and ωgp = 1778 J/mol. The slight difference in ωgp and ωfp leads to the slight downward shift of the cP maximum (cf. Fig. 3, left (center trace)). To demonstrate the uniqueness of the best theoretical profile, we also show two simulations with different lipid-peptide interaction parameters, (ωfp = 0 J/mol; ωgp = 314 J/mol) and (ωfp = 2029 J/mol; ωgp = 2928 J/mol), given as green and blue dotted lines, respectively. The parameter sets were chosen such that the shift of the cP-maximum is maintained. However, one of the profiles is broader and the other one narrower than the best theoretical fit. Thus, the degree of broadening and the shift of the maximum of the experimental profile require a simulation with unique values for ωfp and ωgp. On the right-hand side of Fig. 3 (center row) we show the MC snapshots of membranes containing 10 mol% peptides at three different temperatures, below, at and above the heat capacity maximum. The snapshots suggest that gramicidin A forms aggregates in both gel and fluid phase. The cluster sizes are predicted to be larger in the gel than in the fluid phase. Actually, with the parameters used by us, the peptide aggregates in the fluid phase correspond to several tens of molecules. Also, close to peptide aggregates, an increased probability of the lipids to be in the fluid phase can be observed. This is a consequence of ωgp being larger than ωfp.
More realistic case: four sites per peptide
The simulations in the previous paragraph have the disadvantage that we took four peptides occupying one lattice site each instead of one peptide occupying four lattice sites, as it is the case for gramicidin A. This simplification leads to an overestimation of the mixing entropy of the peptides, i.e., to an underestimation of the tendency to aggregate. To explore the influence of this simplification, we also simulated the case with peptides occupying four lattice sites. The results are shown in Fig. 3 (left and right, bottom). It can be seen that for an optimal fit, we had to modify the set of nearest neighbor interaction parameters to ωgf = 1326 J/mol, ωfp = 628 J/mol, and ωgp = 1673 J/mol. We again compared the best theoretical profile with simulations using different lipid-peptide interaction parameters, (ωfp = 0 J/mol; ωgp = 1046 J/mol) and (ωfp = 753 J/mol; ωgp = 2928 J/mol), given as green and blue dotted lines, respectively. Thus, the degree of broadening and the shift of the experimental profile require a simulation with unique values for ωfp and ωgp. The simulated heat capacity profiles and aggregation patterns are quite similar for the one-site peptides and the four-site peptides. However, the interaction parameters for fluid-peptide interactions and gel-peptide interaction parameters, ωfp and ωgp, respectively, are quantitatively different from the one-site peptide case. This implies that the heat capacity profiles are not so much dominated by the exact values of the interaction parameters but rather by the nature of the mixing behavior. For this reason, for both cases, the one-site and the four-site peptide, we obtained similar MC snapshots and similar degrees of aggregation, using parameters that described the calorimetric profiles reasonably.
Independent of the fine details of the simulation, aggregation of gramicidin A in both lipid phases is predicted from the heat capacity analysis, with a stronger tendency to phase separate in the gel phase.
Atomic force microscopy
We used AFM to search for such peptide aggregates. Membrane suspensions in the presence and the absence of gramicidin A were sonicated and brought into contact with a mica surface where membrane fragments adsorb predominantly as single bilayers. We investigated samples of DMPC (fluid phase) and DPPC (gel phase) between 25°C and 30°C, both in the presence and the absence of gramicidin A. We used two different lipids, because we did not have a stable temperature control available and decided to measure slightly above 25°C for both lipids. DPPC at those temperatures is in the gel phase, whereas DMPC is in the fluid phase.
Some representative results are shown in Figs. 4 and 5. Fig. 4, a1 and a2, are height and deflection images, respectively, of DPPC-membrane fragments in the gel phase in the presence of 1 mol% of gramicidin A. Dark regions in Fig. 4 a1 correspond to the mica surface. The thickness of the membrane was measured as d ≈ 4.7 nm with a statistical error of ∼0.5 nm (Fig. 5 a).
FIGURE 4.
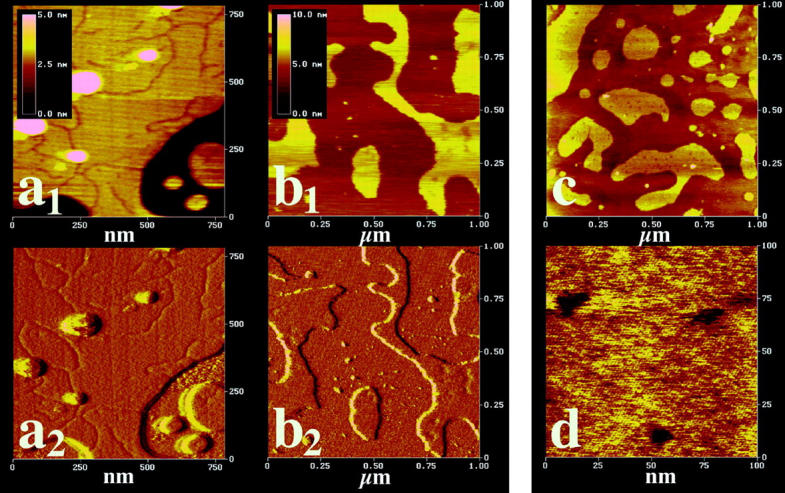
Atomic force micrographs of lipid membranes deposited on mica in the presence of gramicidin A. (a1) Height image of 1 mol% gramicidin A in DPPC membranes in the gel state at 25–30°C. The dark region represents the mica surface, and the bright regions represent DPPC membrane segments. Linelike depressions can be seen, which scale in length with the peptide content. (a2) Deflection image of panel a1. (b1) Height image of 2 mol% gramicidin A in DMPC membranes in the fluid state at 25–30°C. The dark region represents the mica surface, and the bright regions represent DMPC membrane segments. Small, dotlike spherical depressions can be seen, which scale with the peptide content. (b2) Deflection image of panel a1. (c) Same conditions as in image of panel b1, but different sample. (d) Selected section of the same sample than in panel c, with a 10 times smaller scan range. The spherical depressions can be clearly seen. They correspond in area to ∼50–100 gramicidin dimers.
FIGURE 5.
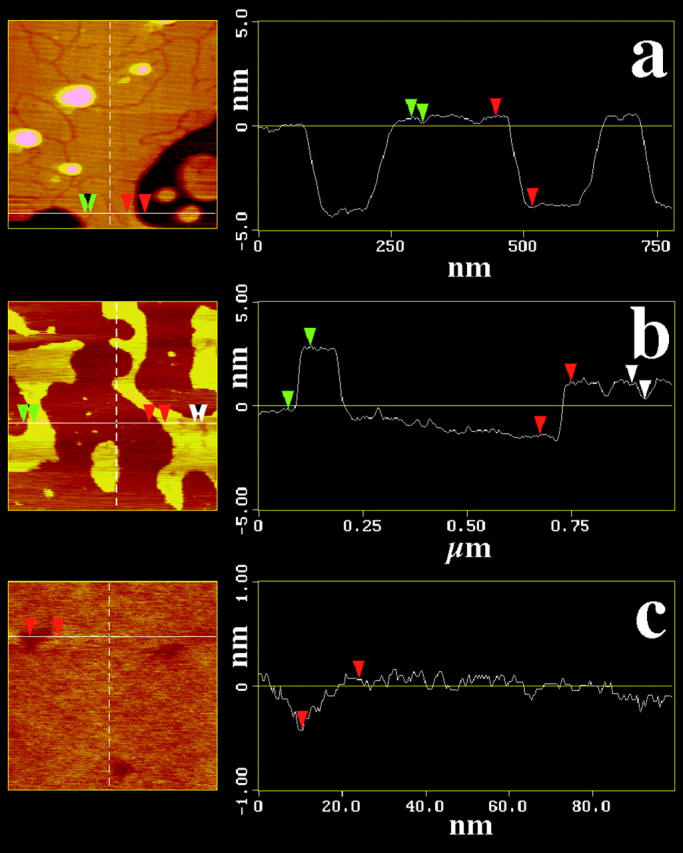
Height profiles of cross sections through the AFM images in Fig. 4. (a) Height profile through the DPPC membrane in the gel state in Fig.4 a1 along the horizontal line shown on the left-hand side. Red arrows indicate the step height corresponding to the gel membrane thickness. Green arrows indicate the height difference due the linelike peptide inclusions. (b) Height profile through the DMPC membrane in the fluid state in Fig. 4 b1 along the horizontal line shown on the left-hand side. Red and green arrows indicate the step height corresponding to the fluid membrane thickness. White arrows indicate the height difference due the sphericallike peptide inclusions. (c) Height profile through the DMPC membrane in the fluid state in Fig. 4 c along the horizontal line shown on the left-hand side. The red arrows indicate the step height difference due the sphericallike peptide inclusions. Note the difference in the scaling of the axes.
Line-shaped depressions can be seen that did not show in the absence of gramicidin A. The cumulative length of those lines scales with the molar ratio of gramicidin A. The height difference with respect to the surrounding matrix (≈0.4 ± 0.1 nm per monolayer) is close to what is expected from the known values of DPPC bilayers (thickness 4.8 nm) in the gel phase and gramicidin A (∼2.6 nm for the dimer). Such line-shaped structures have been observed before by other authors for peptides in lipid gel phases (e.g., Mou et al. (1996)).
Fig. 4, b1 and b2, show height and deflection images of DMPC membranes in the fluid phase, with a peptide content of 2 mol%. Dark regions in Fig. 4 b1 correspond to the mica surface. Fig. 4 c shows a height image of a different sample under similar conditions. Fig. 4 d is a 10-fold magnification of a selected spot of the sample shown in Fig. 4 c. The fluid membrane thickness was found to be ∼3 ± 1 nm, strongly dependent on the imaging force (Fig. 5 b. The literature value is 3.5 nm). In Fig. 4, b1, b2, and c, circular depressions were found that scale in number with the peptide content. Fig. 4 d represents a 10-fold magnification of Fig. 4 c, and the circular depressions, which resemble small dots Fig. 4, b1, b2, and c, are clearly visible. Such depressions were found in all samples of fluid membranes that contained peptides. No depressions were found in the absence of peptide. Therefore we identified the depressions as peptide aggregates. The height difference of the membrane and the gramicidin inclusions was ∼0.5 ± 0.2 nm per monolayer (Fig. 5, b and c), again close to what is expected for fluid DMPC and gramicidin A. One should, however, not overinterpret the absolute value of the depressions in the lipid matrix, since the size of the peptide aggregates is in the range of the AFM tip size. The measured value for the depressions is subject to a considerable statistical variance between different samples and different spots in the same sample, especially in the fluid lipid matrix. The area of the spherical aggregates in the fluid phase corresponds to ∼50–100 gramicidin molecules.
Thus, the prediction from calorimetry that gramicidin A aggregates in both lipid phases is supported by AFM. The state of aggregation observed by the AFM differs in the two phases in contrast to the simulations, being line-shaped in the gel phase and being circular in the fluid phase. This is probably caused by the fact that gel phases are two-dimensional crystals (Janiak et al., 1979) and peptide aggregates may rather form at grain boundaries. The fluid phase is rather unordered and no grain boundaries exist. Thus, aggregation into circular aggregates is likely to be favorable. The possibility of grain boundaries, however, was not implemented into the simulation.
It should be added that our experiments were performed in contact mode where it was found that the images for fluid membranes were dependent on imaging force. In tapping mode, the lateral scanning force is significantly reduced, often making this mode preferable for imaging of soft biological samples. The usual tradeoff is a reduced resolution. For a lipid bilayer, however, contact mode is possible since the bilayer is flat enough so that the lateral forces don't damage the bilayer. The amount by which the bilayer is indented is determined by the vertical imaging force. The effect of tapping mode on the vertical imaging force is not completely resolved yet, but it does not seem to reduce the vertical imaging force by much. Therefore, sample indentation would be observed in tapping mode just as well. In principle, apparent depressions on a flat compressible surface could be areas of increased compressibility. But in our case, such local variations don't occur in the pure bilayer (as deduced from a control with no gramicidin). So the depressions must be gramicidin molecules, and they are lower than the bilayer surface.
Simulation of local fluctuations
The heat capacity is proportional to the fluctuations of the whole matrix (see Theory section), as are other response functions as the isothermal compressibility (Heimburg, 1998; Ebel et al., 2001), the bending elasticity (Heimburg, 1998, 2000b) and the relaxation times after small temperature or volume perturbations (Grabitz et al., 2002). The heat capacity can be derived from the enthalpy fluctuations  and the isothermal compressibility from the volume fluctuations
  .
.
Since the lipid and peptide distribution, according to the MC snapshots and the AFM images (Figs. 1 and 3–5), is obviously not uniform, one may ask the question whether the response properties of a membrane are uniform, or whether they, in contrast, reflect the domain structure of the lipid-peptide matrix. To address this question we calculated local fluctuations for each lattice site (each lipid) in the MC calculations (one site per peptide). We equilibrated the membrane for several thousand MC cycles (including lipid state changes and diffusion steps) and then switched off the Kawasaki diffusion. Now we continued the simulation in a given lipid-peptide arrangement. Each lipid can be in either gel or fluid state. Assigning the value Sij = 0 to the gel state and the value Sij = 1 to the fluid state (the indices denoting the coordinates of the lipid in the matrix), one can calculate the mean probability of a lipid to be in a fluid state  and the fluctuations around this average. The fluctuations are maximum at the melting point with equal probability to be in gel and fluid state
  and
and  . We define
 |
(5) |
We can now display the local fluctuations as a function of the lateral coordinates. For the case of gramicidin containing membranes, this is done in Fig. 6, using the fitting parameters for the experimental heat capacity profiles in Fig. 3 (one-site peptides). Displayed are representative MC snapshots (Si,j, left column), the averaged lipid state ( , center column), and the local fluctuation profile (
 , right column) at four different temperatures, from below Tm to above Tm. It can be seen that the fluctuations as defined above are largely altered close to peptide in a manner strongly dependent on temperature. Gramicidin A slightly shifts the melting temperature to lower values, meaning that the probability to find a fluid lipid close to a peptide is altered (Fig. 6, center column). Therefore, the temperature of maximum fluctuations is different close to the peptide than far away. Although the fact that the heat capacity events are shifted to lower temperatures already implies a different temperature dependence of the fluctuations, this is no trivial statement because we now also can resolve the complex spatial distribution of those fluctuations.
FIGURE 6.
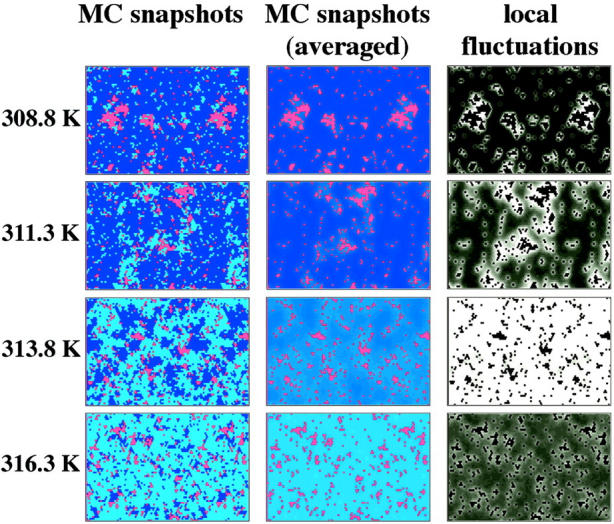
Monte Carlo snapshots, averaged Monte Carlo snapshots (with peptide diffusion switched off after equilibration), and the corresponding local fluctuations (as defined in the text) for a DPPC-gramicidin A system with 10 mol% peptide at four different temperatures. (Left column) Monte Carlo snapshots of the simulations in Fig. 3 for the case of one-site peptides using identical simulation parameters (ωgf = 1326 J/mol, ωfp = 1464 J/mol, ωgp = 1778 J/mol). Gel lipids are shown in dark blue, fluid lipids in light blue, and peptides in red. (Center column) Same as left column, but now averaged over several thousand MC cycles  . The lipid states can now vary continuously between gel and fluid state. The average lipid state is different close to large protein clusters than in the bulk lipid phase. (Right column) Local fluctuations
  during the simulation, as defined in the text. Brighter shades denote larger fluctuations. The color scale varies between 0 (black) and 0.25 (white). The peptide aggregates can be recognized as black areas; size peptides do not display fluctuations in state. It can be seen that the fluctuations close to the peptides are largely altered. This has an immediate impact on the elastic constants close to the peptides.
As mentioned above, the fluctuations are coupled to the response functions, and it must be concluded that compressibility, bending elasticity (or bending stiffness), as well as the relaxation behavior, may be strongly altered close to peptides. Summarizing, we arrive at following conclusions:
The “local heat capacity” = “local fluctuations” is influenced close to peptides and is increased in the gramicidin case at temperatures lower than the melting temperature of the pure lipid.
Therefore, compressibility, elasticity, and other elastic constants must be altered close to the peptide clusters, because they are related to the magnitude of the fluctuations.
Relaxation behavior is also influenced, being slower close to the peptides.
A further likely effect of high fluctuations close to peptides lies in an increased permeability of the membrane, because the likelihood of spontaneous pore formation should be linked to the lateral compressibility.
Thus, the peptides can, dependent on the overall state of the membrane, locally strongly affect the state of the system, making membranes soft and response to distortions slow. This effect should be investigated experimentally in more detail, because it may turn out to be an important factor in biological control. It is putatively of very high relevance in biological membranes, which are often close to melting events (Baldassare and Silbert, 1976; Ebel et al., 2001). The local change in the elastic constants may also affect fusion events of membranes (Kozlovsky and Kozlov, 2002). Many proteins are known that enhance fusion probabilities of lipid vesicles. Snare proteins in endo- and exocytosis are required for membrane fusion (Jahn and Südhof, 1999). A further very interesting observation in this respect is that the formation of cholesterol-rich domains (rafts) is required for endocytosis (Lang et al., 2001). The local variation of the response functions close to biological active sites thus may be a very sensitive physical switch.
DISCUSSION AND CONCLUSIONS
The key issue of this paper is to relate thermodynamics data, especially calorimetric data, of peptide-containing membranes to the aggregation of the peptides. Our method should serve as a guide to analyze heat capacity traces of lipid-peptide mixtures. Peptide clustering is likely to play a key role in signaling pathways of biological systems. The model presented here strongly suggests that the mixing properties can be deduced from the analysis of calorimetric heat capacity data. It should be applicable to integral peptides and proteins. The addition of melittin or alamethicin displays similar effects on the heat capacity profiles as does gramicidin A. A very nice example for the effect of the chain length on heat capacity profiles of a mixture of lipids with an integral peptide was given by Zhang et al. (1995) and it should be possible to describe such systems with our model. The use of MC simulations provides an advantage over previous mean-field approaches to calculate heat capacity profiles. Models based on regular solution theory (Lee, 1977; Johann et al., 1996) intrinsically assume that mixing in each phase is homogeneous, and that gel and fluid phases are macroscopically separated. They basically neglect the existence of phase or domain boundaries. These models, therefore, do not allow the prediction of finite size aggregates. Furthermore, such models do not allow for fluctuations in concentration and state. In the framework of mean-field models, it is therefore impossible to make statements about the elastic constants close to phase boundaries.
Our coarse grain model is based on only two lipid states. It is especially suited for cooperative events with long range correlations. Due to its simplicity, it also has some limitations. One should not expect to obtain information on the molecular scale, e.g., order parameters. In principle, lipids close to peptides may assume chain order states that are not assumed in the fluid or gel matrix. This effect is hidden in the lipid-peptide interaction parameters. One simplification of the model is the assumption of a triangular lattice, which is not found in fluid membranes. This affects the shape of domains. Since grain boundaries are not considered, the phase separation of gramicidin A into line-shaped aggregates was not correctly predicted in this work. Off-lattice models are available in the literature, but they require more parameters and are very time consuming (Nielsen et al., 1999). Our model, in contrast, requires only five parameters, all of which have a direct experimental equivalent (melting enthalpy, melting temperature, transition halfwidth in the absence and the presence of peptides, and the cP-shift induced by the peptides).
Some antibiotic peptides bind to membranes in an equilibrium between surface adsorbed and inserted states (Zuckermann and Heimburg, 2001). It may be difficult to interpret the heat capacity profiles of lipid-peptide mixtures if it is not known whether there is a surface adsorbed peptide species.
Our approach may serve as a valuable tool for predicting peptide aggregation and to design microscopic experiments in the search for protein complexes (Rigaud et al., 2000; Rosenbusch, 2001). Furthermore, this analysis may help to find favorable conditions for the two-dimensional crystallization of membrane proteins, since interaction parameters can be estimated for different lipid systems from heat capacity profiles. The case described in Fig. 1 a, for instance, leads to slow accumulation of peptides upon cooling. The choice of a suitable lipid matrix thus may provide a better control of crystallization kinetics. Furthermore, we showed that peptides may locally influence the elastic properties of the membrane. Thus, the role of proteins is not exclusively defined by their intrinsic function but also by their influence on the physical properties of their immediate environment.
Acknowledgments
We are grateful to Dr. H. Grubmüller for critical comments.
T.H. and V.P.I. were supported by Deutsche Forschungsgemeinschaft grants HE1829/6-1 and HE1829/8-1.
Abbreviations used: cP, excess heat capacity; DMPC, dimyristoyl phosphatidylcholine; DPPC, dipalmitoyl phosphatidylcholine; MLV, multilamellar vesicles; LUV, unilamellar vesicles; AFM, atomic force microscopy; MC, Monte Carlo.
References
- Andersen, O. S., H.-J. Apell, E. Bamberg, D. D. Busath, R. E. Koeppe 2nd, F. J. Sigworth, G. Szabo, D. W. Urry, and A. Wooley. 1999a. Gramicidin channel controversy—the structure in a lipid environment. Nat. Struct. Biol. 6:609. [DOI] [PubMed] [Google Scholar]
- Andersen, O. S., C. Nielsen, A. M. Maer, J. A. Lundbaek, M. Goulian, and R. E. Koeppe 2nd. 1999b. Ion channels as tools to monitor lipid bilayer-membrane protein interactions: gramicidin channels as molecular force transducers. Methods Enzymol. 294:208–224. [DOI] [PubMed] [Google Scholar]
- Bagnat, M., S. Keranen, A. Shevchenko, and K. Simons. 2000. Lipid rafts function in biosynthetic delivery of proteins to the cell surface in yeast. Proc. Natl. Acad. Sci. USA. 97:3254–3259. [DOI] [PMC free article] [PubMed] [Google Scholar]
- Baldassare, J. J., K. B. Rhinehart, and D. F. Silbert. 1976. Modification of membrane lipid: physical properties in relation to fatty acid structure. Biochemistry. 15:2986–2994. [DOI] [PubMed] [Google Scholar]
- Bowen, P. B., J. L. Burke, P. G. Corsten, K. J. Crowell, K. L. Farrell, J. C. MacDonald, R. P. MacDonald, A. B. MacIsaac, P. H. Poole, and N. Jan. 1989. Improved Monte Carlo distribution. Phys. Rev. B. 40:7439–7442. [DOI] [PubMed] [Google Scholar]
- Brown, D. A., and E. London. 1998. Functions of lipid rafts in biological membranes. Annu. Rev. Cell Dev. Biol. 14:111–136. [DOI] [PubMed] [Google Scholar]
- Cruzeiro-Hansson, L., J. H. Ipsen, and O. G. Mouritsen. 1990. Intrinsic molecules in lipid membranes change the lipid-domain interfacial area: cholesterol at domain interfaces. Biochim. Biophys. Acta. 979:166–176. [DOI] [PubMed] [Google Scholar]
- Diociaiuti, M., F. Bordi, A. Motta, A. Carosi, A. Molinari, G. Arancia, and C. Coluzza. 2002. Aggregation of gramicidin A in phospholipid Langmuir-Blodgett monolayers. Biophys. J. 82:3198–3206. [DOI] [PMC free article] [PubMed] [Google Scholar]
- Doniach, S. 1978. Thermodynamic fluctuations in phospholipid bilayers. J. Chem. Phys. 68:4912–4916. [Google Scholar]
- Dumas, F., M. C. Lebrun, and J. F. Tocanne. 1999. Is the protein/lipid hydrophobic matching principle relevant to membrane organization and functions? FEBS Lett. 458:271–277. [DOI] [PubMed] [Google Scholar]
- Ebel, H., P. Grabitz, and T. Heimburg. 2001. Enthalpy and volume changes in lipid membranes. I. The proportionality of heat and volume changes in the lipid melting transition and its implication for the elastic constants. J. Phys. Chem. B. 105:7353–7360. [Google Scholar]
- Fahsel, S., E.-M. Pospiech, M. Zein, T. L. Hazlet, E. Gratton, and R. Winter. 2002. Modulation of concentration fluctuations in phase-separated lipid membranes by polypeptide insertion. Biophys. J. 83:334–344. [DOI] [PMC free article] [PubMed] [Google Scholar]
- Ferrenberg, A. M., and R. H. Swendsen. 1988. New Monte Carlo technique for studying phase transitions. Phys. Rev. Lett. 61:2635–2638. [DOI] [PubMed] [Google Scholar]
- Gil, T., J. H. Ipsen, O. G. Mouritsen, M. C. Sabra, M. M. Sperotto, and M. J. Zuckermann. 1998. Theoretical analysis of protein organization in lipid membranes. Biochim. Biophys. Acta. 1376:245–266. [DOI] [PubMed] [Google Scholar]
- Gil, T., M. C. Sabra, J. H. Ipsen, and O. G. Mouritsen. 1997. Wetting and capillary condensation as means of protein organization in membranes. Biophys. J. 73:1728–1741. [DOI] [PMC free article] [PubMed] [Google Scholar]
- Grabitz, P., V. P. Ivanova, and T. Heimburg. 2002. Relaxation kinetics of lipid membranes and its relation to the heat capacity. Biophys. J. 82:299–309. [DOI] [PMC free article] [PubMed] [Google Scholar]
- Harder, T., P. Scheiffele, P. Verkade, and K. Simons. 1998. Lipid domain structure of the plasma membrane revealed by patching of membrane components. J. Cell Biol. 141:929–942. [DOI] [PMC free article] [PubMed] [Google Scholar]
- Harroun, T. A., W. T. Heller, T. M. Weiss, L. Yang, and H. H. Huang. 1999a. Experimental evidence for hydrophobic matching and membrane-mediated interactions in lipid bilayers containing gramicidin. Biophys. J. 76:937–945. [DOI] [PMC free article] [PubMed] [Google Scholar]
- Harroun, T. A., W. T. Heller, T. M. Weiss, L. Yang, and H. H. Huang. 1999b. Theoretical analysis of hydrophobic matching and membrane-mediated interactions in lipid bilayers containing gramicidin. Biophys. J. 76:3176–3185. [DOI] [PMC free article] [PubMed] [Google Scholar]
- Heimburg, T. 1998. Mechanical aspects of membrane thermodynamics. Estimation of the mechanical properties of lipid membranes close to the chain melting transition from calorimetry. Biochim. Biophys. Acta. 1415:147–162. [DOI] [PubMed] [Google Scholar]
- Heimburg, T. 2000a. A model for the lipid pretransition: coupling of ripple formation with the chain-melting transition. Biophys. J. 78:1154–1165. [DOI] [PMC free article] [PubMed] [Google Scholar]
- Heimburg, T. 2000b. Monte Carlo simulations of lipid bilayers and lipid protein interactions in the light of recent experiment. Curr. Opin. Colloid Interface Sci. 5:224–231. [Google Scholar]
- Heimburg, T., and R. L. Biltonen. 1996. A Monte Carlo simulation study of protein-induced heat capacity changes. Biophys. J. 70:84–96. [DOI] [PMC free article] [PubMed] [Google Scholar]
- Heimburg, T., and D. Marsh. 1996. Thermodynamics of the interaction of proteins with lipid membranes. In Biological Membranes: A Molecular Perspective from Computation and Experiment. K. M. Merz and B. Roux, editors. Birkhäuser, Boston. 405–462.
- Ipsen, J. H., O. G. Mouritsen, and M. J. Zuckermann. 1989. Theory of thermal anomalies in the specific heat of lipid bilayers containing cholesterol. Biophys. J. 56:661–667. [DOI] [PMC free article] [PubMed] [Google Scholar]
- Ivanova, V. P. 2000. Theoretical and experimental study of protein-lipid interactions. PhD thesis. University of Göttingen, Göttingen, Germany. The thesis can be downloaded from the web site of the corresponding author, www.gwdg.de/∼theimbu.
- Ivanova, V. P., and T. Heimburg. 2001. A histogram method to obtain heat capacities in lipid monolayers, curved bilayers and membranes containing peptides. Phys. Rev. E. 63:1914–1925. [DOI] [PubMed] [Google Scholar]
- Jahn, R., and T. C. Südhof. 1999. Membrane fusion and exocytosis. Annu. Rev. Biochem. 68:863–911. [DOI] [PubMed] [Google Scholar]
- Janiak, M. J., D. M. Small, and G. G. Shipley. 1979. Temperature and compositional dependence of the structure of hydrated dimyristoyl lecithin. J. Biol. Chem. 254:6068–6078. [PubMed] [Google Scholar]
- Johann, C., P. Garidel, L. Mennicke, and A. Blume. 1996. New approaches to the simulation of heat-capacity curves and phase diagrams of pseudobinary phospholipid mixtures. Biophys. J. 71:3215–3228. [DOI] [PMC free article] [PubMed] [Google Scholar]
- Ketchem, R. R., W. Hu, and T. A. Cross. 1993. High-resolution conformation of gramicidin A in a lipid bilayer by solid-state NMR. Science. 261:1457–1460. [DOI] [PubMed] [Google Scholar]
- Kozlovsky, Y., and M. M. Kozlov. 2002. Stalk model of membrane fusion: solution of energy crisis. Biophys. J. 82:882–895. [DOI] [PMC free article] [PubMed] [Google Scholar]
- Lang, T., D. Bruns, D. Wenzel, D. Riedel, P. Holroyd, C. Thiele, and R. Jahn. 2001. Snares are concentrated in cholesterol-dependent clusters that define docking and fusion sites for exocytosis. EMBO J. 20:2202–2213. [DOI] [PMC free article] [PubMed] [Google Scholar]
- Lee, A. G. 1977. Lipid phase transitions and phase diagrams. II. Mixtures involving lipids. Biochim. Biophys. Acta. 472:285–344. [DOI] [PubMed] [Google Scholar]
- Leonenko, Z. V., A. Carnini, and D. T. Cramb. 2000. Supported planar bilayer formation by vesicle fusion: the interaction of phospholipid vesicles with surfaces and the effect of gramicidin on bilayer properties using atomic force microscopy. Biochim. Biophys. Acta. 1509:131–147. [DOI] [PubMed] [Google Scholar]
- Morrow, M. R., J. H. Davis, F. J. Sharom, and M. P. Lamb. 1986. Studies of the interaction of human erythrocyte band 3 with membrane lipids using deuterium nuclear magnetic resonance and differential scanning calorimetry. Biochim. Biophys. Acta. 858:13–20. [DOI] [PubMed] [Google Scholar]
- Mou, J. X., D. M. Czajkowsky, and Z. F. Shao. 1996. Gramicidin A aggregation in supported gel state phosphatidylcholine bilayers. Biochemistry. 35:3222–3226. [DOI] [PubMed] [Google Scholar]
- Mouritsen, O. G. 1990. Computer simulation of cooperative phenomena in lipid membranes. In Molecular Description of Biological Membrane Components by Computer-Aided Conformational Analysis. R. Brasseur, editor. CRC Press, Boca Raton, FL. 3–83.
- Mouritsen, O. G. 1998. Self-assembly and organization of lipid-protein membranes. Curr. Opin. Colloid Interface Sci. 3:78–87. [Google Scholar]
- Mouritsen, O. G., A. Boothroyd, R. Harris, N. Jan, T. Lookman, L. MacDonald, D. A. Pink, and M. J. Zuckermann. 1983. Computer simulation of the main gel-fluid phase transition of lipid bilayers. J. Chem. Phys. 79:2027–2041. [Google Scholar]
- Mouritsen, O. G., and K. Jorgensen. 1995. Micro-, nano- and meso-scale heterogeneity of lipid bilayers and its influence on macroscopic membrane properties. Mol. Membr. Biol. 12:15–20. [DOI] [PubMed] [Google Scholar]
- Mouritsen, O. G., and M. M. Sperotto. 1992. Thermodynamics of lipid-protein interactions in lipid membranes: The hydrophobic matching condition. In Thermodynamics of Cell Surface Receptors. M. Jackson, editor. CRC Press, Boca Raton, FL. 127–181.
- Mouritsen, O. G., M. M. Sperotto, J. Risbo, Z. Zhang, and M. J. Zuckermann. 1995. Computational approach to lipid-protein interactions in membranes. In Advances in Computational Biology. H. Villar, editor. JAI Press, Greenwich, CT. 15–64.
- Nielsen, M., L. Miao, J. H. Ipsen, M. J. Zuckermann, and O. G. Mouritsen. 1999. Off-lattice model for the phase behavior of lipid-cholesterol bilayers. Phys. Rev. E. 59:5790–5803. [DOI] [PubMed] [Google Scholar]
- Pink, D. A., T. Y. Green and D. Chapman. 1980. Raman scattering in bilayers of saturated phasphatidylcholines. Experiment and theory. Biochemistry 19:349–356. [DOI] [PubMed] [Google Scholar]
- Prenner, E. J., R. N. A. H. Lewis, L. H. Kondejewski, R. S. Hodges, and R. N. McElhaney. 1999. Differential scanning calorimetric study of the effect of the antimicrobial peptide gramicidin S on the thermotropic phase behavior of phosphatidylcholine, phosphatidylethanolamine and phosphatidylglycerol lipid bilayer membranes. Biochim. Biophys. Acta. 1417:211–223. [DOI] [PubMed] [Google Scholar]
- Rietveld, A., and K. Simons. 1998. The differential miscibility of lipids as the basis for the formation of functional membrane rafts. Biochim. Biophys. Acta. 1376:467–479. [DOI] [PubMed] [Google Scholar]
- Rigaud, J.-L., M. Chami, O. Lambert, D. Levy, and J.-L. Ranck. 2000. Use of detergents in two-dimensional crystallization of membrane proteins. Biochim. Biophys. Acta. 1508:112–128. [DOI] [PubMed] [Google Scholar]
- Rinia, H. A., R. A. Kik, R. A. Demel, M. M. E. Snel, J. A. Killian, J. P. J. M. Eerden, and B. de Kruijff. 2000. Visualization of highly ordered striated domains induced by transmembrane peptides in supported phosphatidylcholine bilayers. Biochemistry. 39:5852–5858. [DOI] [PubMed] [Google Scholar]
- Rosenbusch, J. P. 2001. Stability of membrane proteins: relevance for the selection of appropriate methods for high-resolution structure determination. J. Struct. Biol. 136:144–157. [DOI] [PubMed] [Google Scholar]
- Simons, K., and E. Ikonen. 1997. Functional rafts in cell membranes. Nature. 387:569–572. [DOI] [PubMed] [Google Scholar]
- Sperotto, M. M. 1997. A theoretical model for the association of amphiphilic transmembrane peptides in lipid bilayers. Europ. Biophys. J. 26:405–416. [Google Scholar]
- Sperotto, M. M., J. H. Ipsen, and O. G. Mouritsen. 1989. Theory of protein-induced lateral phase separation in lipid membranes. Cell Biophys. 14:79–95. [DOI] [PubMed] [Google Scholar]
- Sperotto, M. M., and O. G. Mouritsen. 1991. Monte Carlo simulation studies of lipid order parameter profiles near integral membrane proteins. Biophys. J. 59:261–270. [DOI] [PMC free article] [PubMed] [Google Scholar]
- Sugar, I. P., R. L. Biltonen, and N. Mitchard. 1994. Monte Carlo simulations of membranes: phase transition of small unilamellar dipalmitoylphosphatidylcholine vesicles. Methods Enzymol. 240:569–593. [DOI] [PubMed] [Google Scholar]
- Sugar, I. P., T. E. Thompson, and R. L. Biltonen. 1999. Monte Carlo simulation of two-component bilayers: DMPC/DSPC mixtures. Biophys. J. 76:2099–2110. [DOI] [PMC free article] [PubMed] [Google Scholar]
- Tamm, L. K., C. Bohm, J. Yang, Z. F. Shao, J. Hwang, M. Edidin, and E. Betzig. 1996. Nanostructure of supported phospholipid monolayers and bilayers by scanning probe microscopy. Thin Solid Films. 285:813–816. [Google Scholar]
- Zhang, Y.-P., R. N. A. H. Lewis, R. S. Hodges, and R. N. McElhaney. 1995. Peptide models of helical hydrophobic transmembrane segments of membrane proteins. 2. Differential scanning calorimetry and FTIR spectroscopic studies of the interaction of Ac-K2-(LA) 12-K2-amide with phosphatidylcholine membranes. Biochemistry. 34:2362–2371. [DOI] [PubMed] [Google Scholar]
- Zhang, Z., M. M. Sperotto, M. J. Zuckermann, and O. G. Mouritsen. 1993. A microscopic model for lipid/protein bilayers with critical mixing. Biochim. Biophys. Acta. 1147:154–160. [DOI] [PubMed] [Google Scholar]
- Zuckermann, M. J., and T. Heimburg. 2001. Insertion and pore formation driven by adsorption of proteins onto lipid bilayer membrane-water interfaces. Biophys. J. 81:2458–2472. [DOI] [PMC free article] [PubMed] [Google Scholar]