Abstract
Muscle contraction results from rotation of actin-bound myosin crossbridges. Crossbridges consist of the globular N-terminal catalytic domain and the α-helical C-terminal regulatory domain containing the essential and regulatory light chains. The essential light chain exists in two isoforms, of which the larger one has a 41-amino acid extension piece added at the N-terminus. The catalytic domain is responsible for binding to actin and for setting the stage for the main force-generating event, which is a “swing” of the regulatory domain. We measured the kinetics of the swing associated with the turnover of a single molecule of ATP. Muscle was labeled at the regulatory domain by replacing native essential or regulatory light chain with fluorescent adducts. The rotations were measured by the anisotropy of fluorescence originating from ∼400 crossbridges residing in a small volume defined by a confocal aperture of a microscope. The crossbridges were synchronized by rapid photogeneration of a stoichiometric amount of ATP. The rotations reflected dissociation from thin filaments followed by a slow reattachment. The dissociation was the same for each light chain (halftime ∼120 ms) but the rate of reattachment depended on the type of light chain. The halftimes were 920 ± 50 ms and 660 ± 100 ms for isoforms 1 and 3 of the essential light chain, respectively. The reason that the lifetimes were so long was creation of a small amount of ATP, enough only for a single turnover of crossbridges. A model was constructed that quantitized this effect. After accounting for the slowdown, the halftimes of dissociation and attachment were 34 and 200 ms, respectively.
INTRODUCTION
Myosin subfragment-1 (S1) consists of the N-terminal, globular catalytic domain, and the C-terminal, α-helical regulatory domain. The catalytic domain is responsible for binding to actin and hydrolysis of ATP. The α-helical regulatory domain is stabilized by the essential (ELC) and regulatory (RLC) light chains. Recent evidence confirmed early suggestions that catalytic domain does not rotate during contraction (Dos Remedios et al., 1972). A consensus has emerged that rotation of the regulatory domain around a pivot at Gly 699 (Burghardt et al., 1998) is responsible for muscle contraction (Highsmith and Eden, 1993; Rayment et al., 1993; Dominguez et al., 1998; Houdusse et al., 1999; Uyeda et al., 1996; Warshaw et al., 2000; Cooke, 1997; Goldman, 1998).
In this article we measured the rates of rotation of the regulatory domain of crossbridges containing fluorescently labeled light chains. The rotations were measured by following the time course of anisotropy of emission dipoles of dyes attached to ELC or RLC. The introduction of extremely small observational volumes defined by diffraction-limited laser beams and confocal detection (Eigen and Rigler, 1994) made it possible to limit the number of crossbridges contributing to the signal to less than 400. It was expected that by limiting the number of observed molecules, the crossbridges would rotate in synchrony over at least few detachment-attachment cycles, i.e., that the measurements could be made during the beginning of the steady state (isometric contraction). However, this expectation was not met. The synchrony was lost already after 1–2 rotational cycles. The rotational motions of crossbridges were thus synchronized by rapid photogeneration of ATP. The amount of ATP produced was designed to induce a single dissociation-association cycle.
The orientational changes associated with hydrolysis consisted of dissociation of crossbridges followed by rebinding. We were interested to find out whether the rates of orientational changes depended on the type of light chain used as indicator of rotation of the regulatory domain. We have shown previously that the initial rotation of the regulatory light chain was similar to the initial rotation of the larger of the two isoforms of the essential light chain 1 (LC1) (Borejdo et al., 2002). This light chain is expressed only in vertebrate striated muscles, and has a 41-amino acid extension piece added at the N-terminus. This extension is absent in invertebrate ELCs and in the majority of vertebrate smooth and nonmuscle myosins. Studies with in vitro motility assays (Lowey et al., 1993) and with permeabilized skeletal muscle fibers (Sweeney, 1995) have revealed the correlation between increased maximal velocity of sliding and the presence of the smaller isoform lacking the N-terminal extension (LC3). This suggested that the charge interactions between the N-terminus of LC1 and negatively charged amino acids on the surface of actin caused slowing of filament sliding. The present results confirmed earlier work (Borejdo et al., 2002) that the crossbridges containing LC1 and RLC detached from actin filaments with the same rate and showed that LC1 and LC3 detached from actin at the same rate. The rate of reattachment depended on the type of ELC isoform and was 920 ± 50 ms and 660 ± 100 ms for isoforms 1 and 3, respectively.
Confocal detection was used before to measure rotations of crossbridges (Borejdo et al., 2002). The present work differs from the earlier one in two important aspects. Firstly, in the earlier work the laser beam was scanned to avoid photobleaching. This reduced photobleaching by decreasing the amount of time the laser beam dwelled on a given spot, but caused different crossbridges to be illuminated at different times. In the present work this problem was eliminated by disabling the scan altogether. The laser beam was focused on a single diffraction-limited spot throughout the entire experiment. Photobleaching was reduced by attenuating the laser beam. Secondly, in the earlier work it was necessary to photogenerate ATP throughout the experiment because different crossbridge populations were observed at each time and each population needed to be activated separately. The absence of scanning made it possible to activate the crossbridges by a single pulse of the UV light to photogenerate ATP from a caged precursor.
OUTLINE OF METHODS
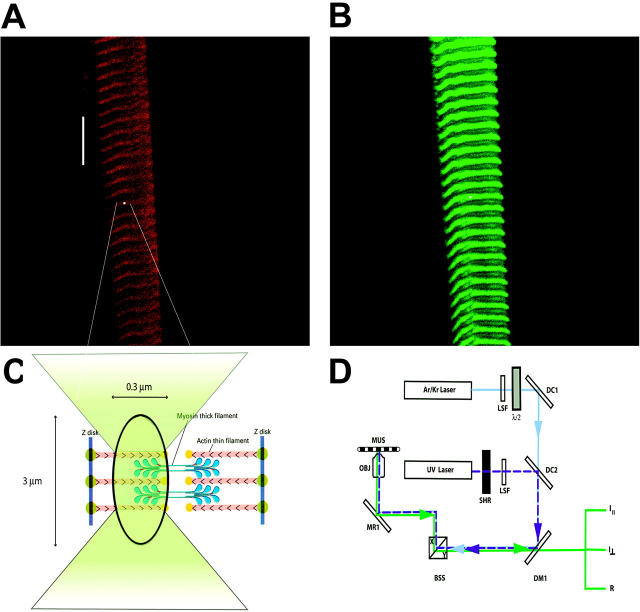
The rationale was to observe a small population of crossbridges, to synchronize them by rapid application of ATP, and to follow the orientation changes associated with binding and hydrolysis of a single molecule of ATP. Muscle was labeled at the regulatory domain by replacing native essential or regulatory light chain with fluorescent adducts. The rotations were measured by the anisotropy of fluorescence originating from a small number of crossbridges residing in a femtoliter volume defined by a confocal aperture of a microscope. Muscle fiber is placed on a stage of a confocal microscope and observed through either rhodamine (Fig. 1 A) or fluorescein (Fig. 1 B) filters, depending whether ELC or RLC is studied. The objective focuses visible laser light onto the A-band (white spot in Fig. 1 A). The beam is not scanned, i.e., the same crossbridges are observed throughout the experiment. The width and depth of the spot are approximately equal to the diffraction limit (∼0.3 μm). The height is limited by the confocal aperture (1.35 Airy units) to ∼3 μm (Fig. 1 C). The concentration of myosin in muscle is 120 μM (Bagshaw, 1982), giving ∼2 × 10⁴ myosin molecules in the observed volume of ∼0.3 μm3. Inasmuch as only ∼1–2% of crossbridges contain labeled light chains, less than 400 crossbridges contribute to the observed signal. Unfortunately, even such a small number of crossbridges do not rotate in synchrony (see below). The rotations had to be synchronized by sudden photogeneration of ATP from caged precursor. A 10-ms pulse of UV light produces 2 mM ATP in the illuminated volume. The diffusion coefficient of ATP is so large that all the nucleotide diffuses away from this volume in less than 300 μs. The only nucleotide present is the one bound to myosin, and the anisotropy change reflects the rotation associated with turnover of a single molecule of ATP.
FIGURE 1.
Method of measuring anisotropy of fluorescence. Approximately 1% of myosin in a fiber is labeled with LC1-IATR, LC3-IATR, or RLC-Alexa488. (A) Fiber viewed through rhodamine filter set (long pass λ > 590 nm). The white spot indicates the position of the laser beam. Bar, 10 μm. (B) The same fiber viewed through fluorescein filter set (band pass 515 < λ < 565 nm). (C) Magnified view of the focused laser spot shown in A. (D) Simplified schematic diagram of the experimental setup. 568-nm light from Ar/Kr laser (Series 34, Omnichrome, Chino, CA) is selected by the line selection filter (LSF) to excite rhodamine. Polarization of the laser beam is rotated by λ/2 plate (mica retarder, model WRM 021, Melles Griot, Irvine, CA) and directed by the dichroic mirror DM1 and mirror MR1 onto an objective (OBJ). The UV beam of an argon laser (Enterprise, Coherent, Palo Alto, CA) operating at 364 nm (dark blue dashed line) is used to photolyze caged nucleotide. The UV light is admitted by the shutter (SHR) (Vincent Associates, Uniblitz T132, Rochester, NY). Dichroic combiner 2 (DC2) merges the UV and visible beams. Objective (OBJ, 40×, NA 1.2, water immersion) focuses the exciting light on the muscle (MUS) mounted on a stage of a microscope (Axiovert 135, Zeiss, Thornwood, NY). The objective collects fluorescent light and projects it to the photomultipliers. Mirrors of the beam scanner (BSS) are kept fixed at X = 0, Y = 0 position.
The details of the experimental arrangement are given elsewhere (Borejdo et al., 2002). Briefly: the linearly polarized 568 nm light from the laser is selected by the line selection filter and passed to the halfwave plate to select the direction of excitation polarization (Fig. 1 D). The UV beam is provided by the argon laser operating at 364 nm (dark blue dashed line) to photolyze caged nucleotide. The dichroic combiners 1 and 2 merge visible and UV beams. The mechanical shutter admits the UV beam. The dichroic mirror 1 directs the beam onto the beam scan system and the objective projects it onto a muscle fiber mounted on the stage of the microscope. The emitted light (green) is collected by the objective and is projected onto the confocal pinhole through orthogonal analyzers. Photodetectors 1 and 2 record perpendicular (I⊥) and parallel (I‖) components of polarized fluorescence, respectively. The anisotropy R is calculated in real time and deposited in channel 3.
MATERIALS AND METHODS
Chemicals
Standard chemicals were from Sigma (St. Louis, MO). 5′-iodo-acetamido-tetramethyl-rhodamine (5′-IATR) and 5-dimethyoxy-2-nitrobenzyl-caged ATP (DMNPE-caged ATP) were from Molecular Probes (Eugene, OR).
Preparation of essential light chains
The pQE60 vector and Escherichia coli M15[pREP4] cells (QIAGEN) were used for the cloning and expression of the essential light chain 3 (LC3). The human fast skeletal muscle ELC was subcloned into the pQE60 vector using DNA polymerase chain reaction with the 3′-primer containing a tag of six histidines. The presence of the his-tag at the N-terminus of ELC was confirmed by DNA sequencing. The expressed recombinant proteins were purified on the Ni-NTA-agarose columns (QIAGEN).
Labeling and exchange of ELCs
Isolated muscle fibers were prepared from glycerinated rabbit psoas muscle bundles as described before (Borejdo et al., 2002). Light chains were labeled by incubation with five molar excess of 5′-IATR for 4 h in 50 mM KCl, 10 mM phosphate buffer pH 7.0 at 4°C. Free dye was removed by Sephadex 50 column followed by dialysis against relaxing solution. The degree of labeling was typically 30%. Labeled ELCs were exchanged with endogenous light chains of myosin in muscle fibers at 30°C using the exchange solution as described before (Borejdo et al., 2001). The degree of exchange was estimated by comparing the intensity of fluorescence of fibers exchanged with light chains with the intensity of known concentration of solution of LCs. Approximately 1%–2% of crossbridges were labeled. Confocal microscope had no trouble detecting such lightly labeled fibers. Exchange had no effect on unloaded speed of shortening and insignificant effect on tension. We recognize the fact that the lack of effect is unreliable because only a small fraction of ELCs is labeled. However, there are three reasons why the exchange of ELC produces active crossbridges. First, we have shown that LC1 behaves in the same manner as RLC (Borejdo et al., 2002), and exchange of RLC is known to have no effect on fiber mechanics (Irving et al., 1995; Allen et al., 1996; Ling et al., 1996; Sabido-David et al., 1998a,b). Second, the fluorescence originates only from ELCs, and so the very fact that the anisotropy changes suggests that crossbridges carrying these ELCs are active. The kinetics of anisotropy decrease is comparable to the kinetics reported for RLC exchanged fiber (e.g., Allen et al., 1996). Third, we have evidence that the harsh conditions used to exchange ELC do not affect the orientation of the regulatory domain (Borejdo et al., 2001). Polarization of fluorescence of RLC on the regulatory domain gave P⊥= 0.315 ± 0.034, P‖ = 0.275 ± 0.025 at 30°C, not statistically different from polarization measured at 20°C. Similarly, exchange at 37°C in the presence of 0.1 mM TFP gave statistically the same values as the exchange at 37°C alone (P⊥ = 0.402 ± 0.012, P‖ = 0.298 ± 0.036).
Measuring anisotropy
Static anisotropy was measured using low aperture lens (10×, NA = 0.22) as explained before (Borejdo et al., 2002). The perpendicular and parallel anisotropies are R⊥ = (⊥I⊥/C⊥−⊥I‖)/(⊥I⊥/C⊥ + 2⊥I‖), R‖ = (‖I‖/C‖ − ‖I⊥)/(‖I‖/C‖ + 2‖I⊥) where the subscript before the measured intensity denotes the direction of polarization of incident beam relative to fiber axis, subscript after the intensity indicates the direction of polarization of emitted beam, and C's are the correction factors. The intensities recorded by PM1 and PM2 are measured from the same region by Image Plus (Media Cybernetics, Silver Spring, MD). Anisotropy transients were measured using high aperture lens (C-Apo, 40×, NA = 1.2). Before focusing the laser beam on the A-band, it is attenuated 300–1000 times. 262,144 (512 × 512) measurements are taken every 25 μs for a total of 6.55 s. The video card (Matrox Imaging Series, Dorval, Canada) calculates in real time the perpendicular and parallel “anisotropy” functions R⊥(t) = [(⊥I⊥(t) − ⊥I‖(t))/(⊥I⊥(t) + 2⊥I‖(t))] × 256 + 128, R‖(t) = [(‖I⊥(t) − ‖I‖(t))/(‖I⊥(t) + 2‖I‖(t))] × 256 + 128, where ⊥I⊥(t), ⊥I‖(t), ‖I⊥(t), and ‖I‖(t)) are the instantaneous fluorescence intensities. At time t ∼ 3–3.5 s after the beginning of experiment, the shutter admitting the UV light is opened for exactly 10 ms. The UV laser provides 16 mW = 32 mJ/s of continuous power. Only 0.24 mJ/s is incident on the muscle, because of the clipping of the enlarged laser beam by the entrance aperture of the objective, loss at the mirror DM1 and loss due to absorption by glass in the objective. The area illuminated by UV is 0.04 μm2. The energy flux at the illuminated area is 0.24 mJ/(s × 0.042 μm2) = 6.0 mJ/(s × μm2). The ATP stays in the experimental volume on the average for 300 μsec. The energy flux through the illuminated area during this time is 18 × 10−4 mJ/μm2. This is similar to the energy flux obtainable with frequency-doubled ruby laser (∼3 × 10⁻⁵ mJ/μm2) (Goldman et al., 1984).
RESULTS
Photobleaching
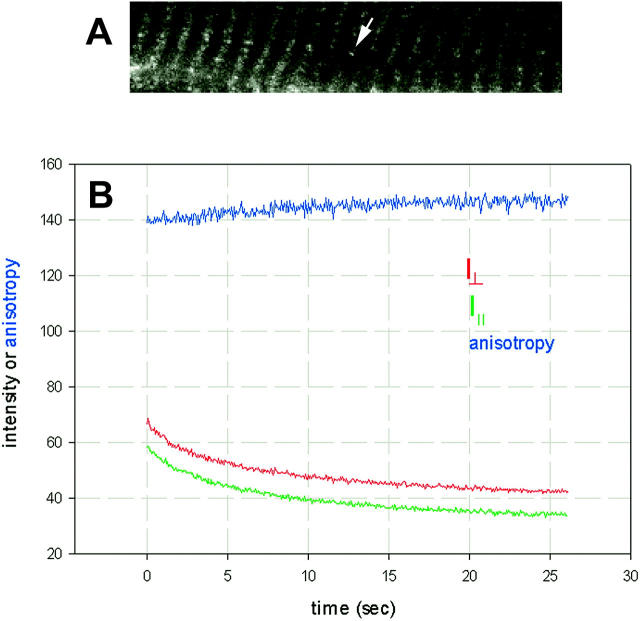
In a typical experiment 262,144 (512 × 512) measurements are taken from the selected spot on muscle fiber every 25 μs for total of 6.55 s. This can cause considerable photobleaching because all the laser power is concentrated on a single spot. The problem is aggravated by the fact that the same fluorophores remain in the beam throughout the entire time, i.e., they do not get replenished as in the case of free diffusion. In the past, this problem was eliminated by scanning the laser beam along a line (Borejdo et al., 2002). Here, the photobleaching is minimized by decreasing the laser power and maximizing photomultiplier gain. Unless otherwise indicated, the laser power incident on a sample was attenuated 1000 times (to 2.3 μW) and the brightness and contrast settings were 1.0 and ∼0.5 of the maximum. Typical experiment illustrated in Fig. 2 shows that under those conditions, photobleaching was manageable. After 6.55 s illumination with 2.3 μW of 568 nm light, the intensity of the A-band indicated by the arrow in Fig. 2 A was little decreased. Analysis reveals that 64% and 61% of the original intensities of the perpendicular and parallel components of fluorescence remained (Fig. 2 B). The anisotropy changed by less than 5%.
FIGURE 2.
Photobleaching of muscle. (A) Fluorescence image of muscle fiber exchanged with LC3. The region pointed to by an arrow has been illuminated for 6.7 s with 2.3 μW 568-nm laser beam focused by 40×, NA 1.2 water immersion objective. (B) Photobleaching of intensities polarized perpendicular (red) and parallel (green) to muscle axis. Perpendicular anisotropy R⊥(t) = [(⊥I⊥(t) − ⊥I‖(t))/(⊥I⊥(t) + 2⊥I‖(t))] × 256 + 128 is in blue. R is an approximation to steady-state anisotropy because it is not corrected for depolarization by dichroic mirrors, fluorescence of background, and for different sensitivities of photomultipliers (PMs). Moreover, the experiments are done using high NA objective which further depolarizes the light (Axelrod, 1979). The two intensities do not bleach at exactly the same rate because of the nonisotropic distribution of the dipoles (Selvin et al., 1990).
Steady-state experiments
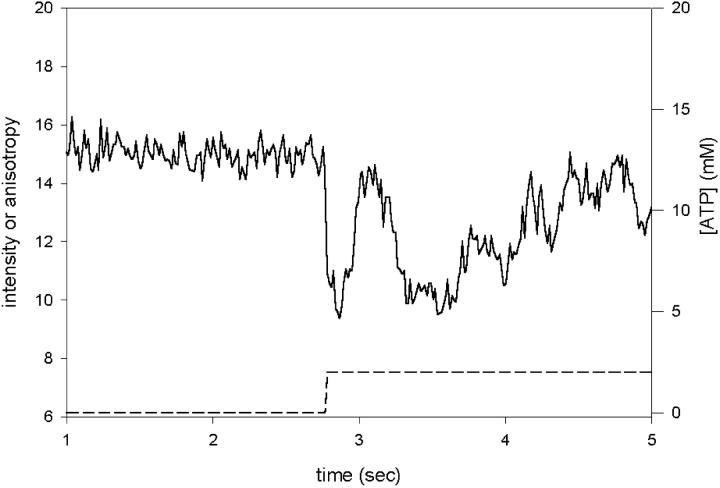
Inasmuch as the data is collected from a small volume containing ∼400 molecules, it was hoped that the crossbridges would remain synchronized long enough to allow measurements of the ON and OFF rates during steady-state contraction. Orientational changes during steady state are expected to be different than changes during transient contraction. During steady state, elastic elements of muscle are already fully stretched and observed crossbridges rotate against maximum force. During transient contraction, on the other hand, the elastic elements are initially relaxed and crossbridges rotate against small resistive force. Unfortunately, when suddenly exposed to constant concentration of ATP, the crossbridges rapidly lose synchrony. This is illustrated in Fig. 3, which shows the experiment in which constant concentration of ATP was photogenerated beginning at 2.75 s (dashed line, right axis) by continuous illumination by the UV light. The changes in anisotropy become progressively smaller already after a single cycle. This suggests that the rates of rotations which follow the first cycle are affected by the loss of synchrony and that it is impossible to measure kinetics during steady-state contraction. To induce synchrony, we photogenerated ATP from caged precursor by rapid flash of the UV light.
FIGURE 3.
Oscillations in crossbridge orientation after rapid photogeneration of ATP. 2 mM ATP was generated at 2.75 s (dashed line, right scale) by continuous illumination of the fiber with the UV light. Anisotropy (solid line) was measured every 14.25 ms.
Despite the loss of synchrony, the overall cycling rate could be estimated from four steady-state experiments as 3.8 ± 0.3 s−1. This is similar to the isometric ATPase (He et al., 1997).
Single-turnover experiments
Anisotropy transient is observed after application of 10 ms UV-light pulse to produce ATP. All caged ATP is converted to ATP (Borejdo et al., 2002). The diffusion coefficient of ATP is 3.7 × 10⁻⁶ cm2/s (Hubley et al., 1996). Therefore the root-mean-square velocity of diffusion of ATP is ∼1 μm/ms (Borejdo et al., 2002) and it diffuses away from the experimental volume in ∼300 μs. Thus soon after application of a pulse there is practically no free nucleotide in the experimental volume. The sole nucleotide remaining in the volume is the one bound to the crossbridges and the anisotropy change after the pulse reflects the rotation induced by a turnover of this molecule of ATP. In a typical experiment, muscle is incubated in Ca2+-rigor solution containing 2 mM caged ATP. The 10 ms pulse of UV light is applied 2–4 s after the beginning of the experiment. Fig. 4 A is a plot of orthogonal intensities and of anisotropy changes recorded every 14.25 ms in the absence (red curve) and in the presence (blue curve) of 2 mM caged ATP. Anisotropy changes consist of a fast decrease followed by a slow increase. The anisotropy changes of myosin exchanged with RLC were similar (not shown). We discuss decrease and increase of anisotropy in turn.
FIGURE 4.
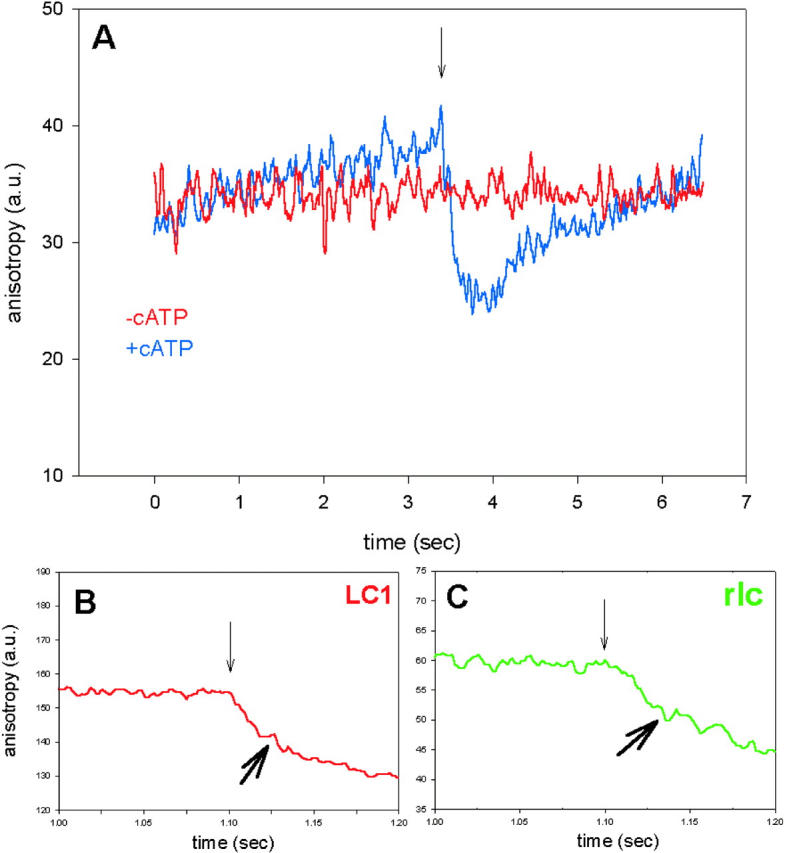
Anisotropy change during a single turnover of ATP. A muscle fiber containing fluorescently labeled LC3 (A), LC1 (B), or RLC (C) in Ca2+-rigor solution was illuminated (at the time indicated by downpointing arrows) with the 10-ms pulse of the UV light. (A) Anisotropy in the absence (red curve) and presence (blue curve) of 2 mM caged ATP. (B) Anisotropy of LC1 on myosin (heavy arrow indicates the inflection). (C) Anisotropy of RLC on myosin (heavy arrow indicates the inflection). Perpendicular anisotropy R⊥(t) = [(⊥I⊥(t) − ⊥I‖(t))/(⊥I⊥(t) + 2⊥I‖(t))] × 256 + 128.
Anisotropy decrease
The most likely reason for the decrease is dissociation of S1 from actin (Allen et al., 1996; Borejdo et al., 2002). The fact that the rate of the dissociation depended on [ATP] in a second-order fashion (Allen et al., 1996; Borejdo et al., 2002) supports this conclusion.
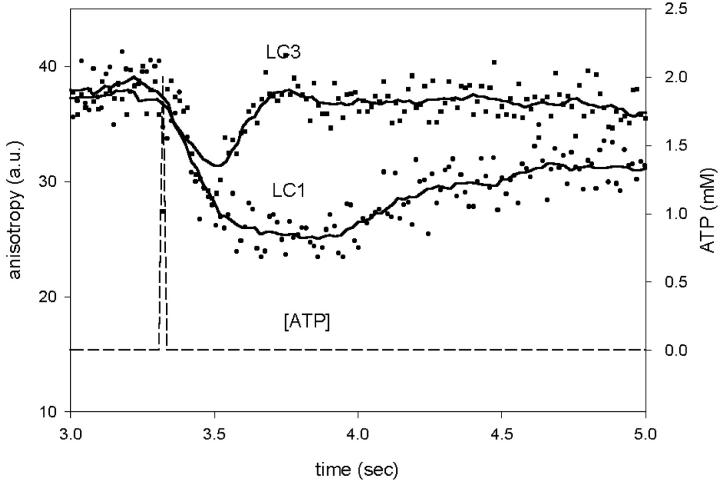
The rates of anisotropy decrease were similar for all light chains (Fig. 5). In 10 experiments using ELC, the average half times were 120 ± 10 ms and 130 ± 20 ms for LC1, LC3, respectively. This difference was not statistically significant (paired Student's t-test, t = −0.45, P = 0.66). In eight experiments using RLC, the average half time was 105 ± 13 ms, not statistically different from the rates for LC1 and LC3.
FIGURE 5.
Comparison of time courses of anisotropy change of muscle containing two isoforms of ELC after photogeneration of ATP. (Squares), Myosin containing LC3. (Circles), Myosin containing LC1. (Dashed line), The concentration of ATP in the observed volume (scale at right).
The drop of anisotropy was often interrupted by a sudden decrease of the rate, giving an appearance of the inflection. The modeling (see Discussion) suggests that this inflection is a result of the fact that fraction of heads undergoing disordering (i.e., dissociation) during time increment is very large at first. This is because, originally, all the crossbridges are attached, and the probability of detachment is large. There comes a time, however, when the fraction undergoing dissociation during each time increment decreases sharply because a significant number of heads is already dissociated. This leads to the establishment of quasi-equilibrium between attached and detached crossbridges. The inflection was present when myosin was labeled at LC1 (Fig. 4 B), RLC (Fig. 4 C), and LC3 (not shown).
The rates observed here are slower than the rates of change of fluorescence polarization (Allen et al., 1996) that are associated with dissociation. Therefore, in the present experiments slow processes must slow down the dissociation. There are two such processes. One is the diffusion of ATP away from the experimental volume. The other is most likely the displacement of caged ATP previously bound to myosin. To model it was necessary to increase the time resolution of the experiment. Previously, time resolution was purposely decreased to keep the data files to manageable size (e.g., 570 data points were pooled in Figs. 4 and 5 giving the time resolution 570 × 25 μs = 14.25 ms). Here, to increase the time resolution, the data were not pooled. The anisotropy was displayed as an 8-bit pixel on the computer screen, beginning at the upper left corner and ending at the bottom right corner of the monitor. Each horizontal line consists of 512 pixels and represents signal during 512 × 25 μs = 12.8 ms. The whole screen is filled in 6.55 s. The time resolution is 25 μs. Fig. 6 A shows the changes in horizontal intensity. The UV pulse is a bright horizontal line, whose beginning and end are indicated by single and double arrows. The line is visible because the filters do not exclude the UV light perfectly. The off-equatorial scan of the intensity, starting after the UV pulse is completed (double arrow), has the time resolution of 25 μs (Fig. 6 B). A simple interpretation of these high resolution data is given in the Discussion.
FIGURE 6.
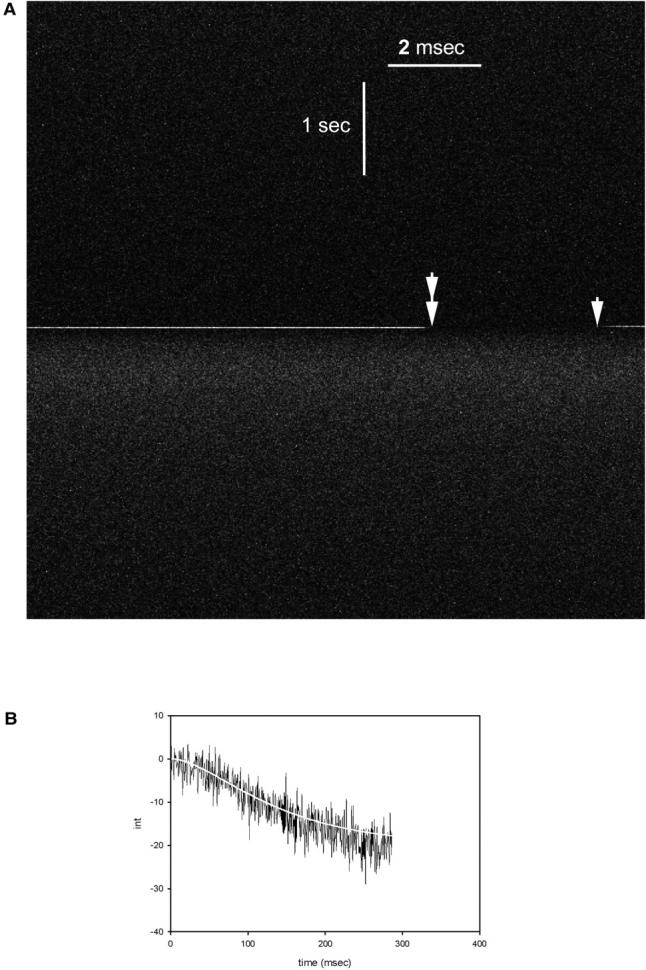
(A) Changes in the horizontal intensity of fluorescence. The beginning and end of the UV pulse are indicated by single and double arrows. (B) The horizontal scan of intensity. Scan was begun when the light was turned off (double arrow). 11,444 data points were collected every 25 μs. (White line) The fit to the equation Mf = Mco[1 + (1/(kc − kdiss)(kdisse−kc×t − kce−kdiss×t)].
Anisotropy increase
The increase of anisotropy seen in Fig. 4 A probably reflects binding to actin; i.e., the imposition of orientation on the crossbridges as they transit from the dissociated state to the bound state. Horiuti (Horiuti et al., 2001) also observed slow changes in the intensity of x-ray reflections after single turnover of ATP. The rate of this process is much slower than the rate of binding of S1 to actin in solution (a second-order rate constant 20 × 104 M−1s−1 (White and Taylor, 1976). The model (see Discussion) explains why the rate of reordering in single-turnover experiments is slower than in steady state. In a single-turnover experiment, a crossbridge detaches and reattaches only once; i.e., after reattaching the probability of detachment becomes 0. A crossbridge that finished a turnover cycle acts as a load for crossbridges that still did not complete the cycle. This load slows down the contraction, and decreases the rate of anisotropy rise as illustrated in Fig. 7. This explanation is more fully explored below.
FIGURE 7.
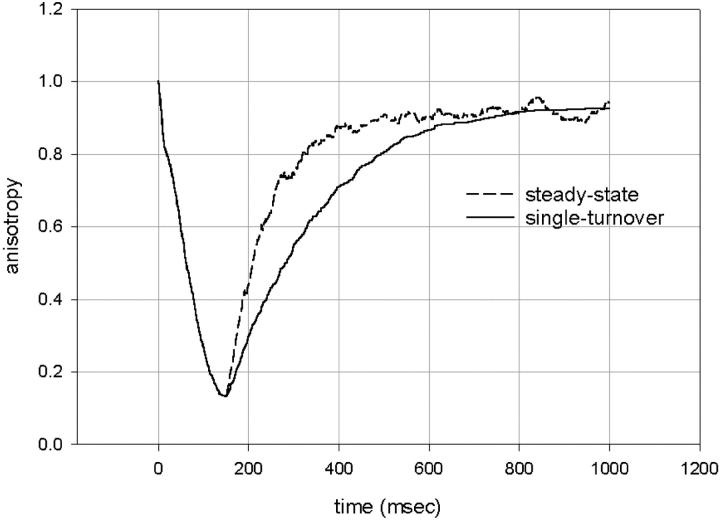
The anisotropy increases more slowly in a single-turnover (solid line) than in a steady-state (dashed line) experiment. The changes are slower because crossbridges that have a finished turnover cycle act as a load for active heads. In this example the halftimes are 160 (solid curve) and 60 ms (dashed curve). Number of crossbridges, 1000.
DISCUSSION
The anisotropy changes observed here report directly on the rates of dissociation and association of crossbridges in contracting muscle. The advantage of the method is that only ∼400 crossbridges are observed, because the volume of muscle from which the data is recorded is made very small by narrowing the confocal aperture. The activity of myosins carrying substituted light chains have not been tested in the present experiments, but similar replacements have worked in the past (Borejdo et al., 2002). It is impossible that the observed changes reflect temperature rise caused by the UV illumination (estimated as 2°C). Firstly, caged EDTA (DMNP-EDTA), which has the same UV absorption as caged ATP, caused no change of anisotropy whatsoever. Secondly, there is no anisotropy change in denatured fibers (left for 24 h at room temperature). Finally, fibers labeled with fluorescent phalloidin and devoid of myosin did not give any anisotropy change upon stimulation by caged ATP (not shown).
As mentioned earlier, the dissociation in a single-turnover experiment is slowed down by the diffusion of ATP and by the competition between incoming photocreated ATP and caged ATP previously bound to crossbridges. To estimate the delay in dissociation caused by the competition effect, we model change in anisotropy as a result of two consecutive reactions. The first reaction is a displacement of previously bound caged ATP (or ADP) from myosin characterized by the rate constant kc. In single-turnover experiments this rate is slow because local concentration of photocreated ATP decreases quickly as a result of its rapid diffusion. This is followed by the second reaction—a rapid binding of photogenerated ATP to a newly empty enzymatic site and a dissociation of crossbridges from actin characterized by the rate of dissociation kdiss. Let the concentration of crossbridges containing bound caged ATP and concentration of crossbridges dissociated from actin be Mc and Mf, respectively. Adapting kinetics of consecutive reactions (Amdur and Hammes, 1966), it can be shown that the concentration of crossbridges dissociated from actin is Mf = Mco[1 + (1/(kc − kdiss)(kdisse−kc×t − kce−kdiss×t)]. Fig. 6 B shows that the changes have the expected sigmoidal shape. The fit to the experiment by the equation above (white line) yields kc = 10 s−1 and kdiss = 20 s−1; i.e., the halftime 0.693/kdiss = 34 ms. This time is likely to be decreased further by the diffusion of ATP. This decrease has not been accounted for here.
After dissociating, crossbridges rebind to actin. The rate of this process is also different in single turnover then in steady-state experiments. To estimate the size of this effect, we constructed a stochastic model of muscle. In this model the array [nstat(n)] represents the state of crossbridges at any time. The n-th element of the array is either 0, representing a detached crossbridge, or 1, representing an attached one. There are N-crossbridges. Each crossbridge has an x-coordinate associated with it; x- is the distance from the crossbridge to the nearest binding site on actin. The x-value can be calculated for each crossbridge given myosin and actin periodicities (42.9 and 37.5 nm, respectively). Each crossbridge has an associated probability of attachment and detachment that depends on its x-value. These probabilities depend on the rates of crossbridge attachment and detachment, f(x) and g(x) (Huxley, 1957). As pointed out by Hill (Hill et al., 1975), for thermodynamic reasons one must also define reverse rates f′(x) and g′(x). The probabilities of detachment (p1 and p2) and attachment (p3 and p4) are calculated as in Brokaw, 1976:
 |
where a(x) = f′(x) + g(x), b(x) = f(x) + g′(x), c(x) = a(x) + b(x) and dt is the time increment = 1 ms. The f(x) and g(x) values are the rates of crossbridge attachment and detachment as given by Huxley, 1957. The values f′(x) and g′(x) are small enough to have no influence on the results. For rabbit psoas muscle at 20°C, the rates are (Borejdo and Morales, 1977):
 |
A stochastic process decides the probabilities whether a particular crossbridge attaches or detaches. If the crossbridge is detached [nstat(n) = 0], it can become attached if the probability p3 of attachment is greater than a random variable in the range of 0 and 1. If the crossbridge is attached [nstat(n) = 1], it can become detached if the probability p1 of detachment is greater than a random variable in the range of 0 and 1. The probabilities depend on the distance. If x ≤ 0, the attached crossbridge has a very good chance of detaching. If x > 10, the attached crossbridge has a small probability of detaching. When 10 ≥ x > 0, the detached crossbridge has a fair probability of attaching. If x < 0 or x > 10, the detached crossbridge cannot attach. Each attached crossbridge generates force F = k × x, where k is the elasticity constant (1.5 pN/nm). The total force developed by muscle is the sum of forces developed by individual crossbridges. Let the force developed by muscle at time t be F(t) and the force developed one time increment later be F(t + dt). The amount of sliding of filaments relative to one another is dL = [F(t) − F(t + dt)]/M × k, where M is the total number of attached crossbridges, i.e., M × k is the instantaneous stiffness of muscle (crossbridges are arranged in parallel). At time t, the x-coordinates of all the crossbridges undergo a shift by the amount of dL. It is assumed that the attached crossbridges have anisotropy of 1 and that dissociated crossbridges are completely random; i.e., their anisotropy = 0.
This model fits our data very well. First, it explains why the rate of anisotropy change is slower in a single turnover than in a steady-state experiment. In a single-turnover experiment, the crossbridge detaches and reattaches only once; i.e., after reattaching, the probability of detachment, p1, becomes 0. A crossbridge that finished a turnover cycle acts as a load for crossbridges that still did not complete the cycle. This load slows down the contraction. The rate of anisotropy rise is illustrated in Fig. 7, where crossbridges undergoing a single-turnover cycle (solid line) generate an anisotropy change that is 2.7-fold slower then during steady-state contraction (dashed line).
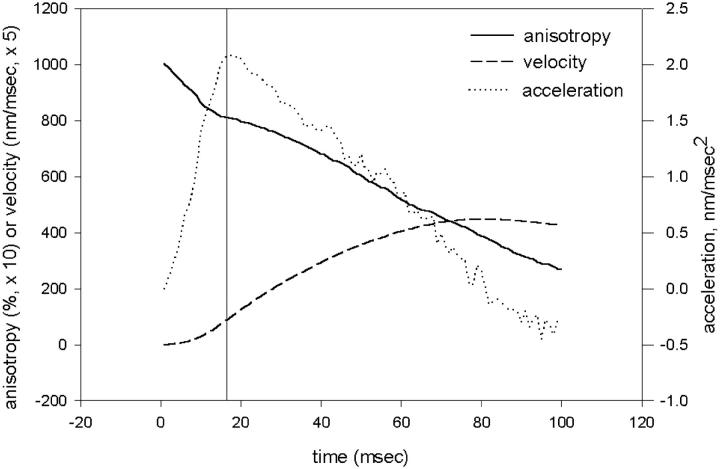
The model also explains the observation that soon after the pulse of ATP there is an inflection in the anisotropy trace, as pointed by the arrows on the experimental traces (Fig. 4, B and C). The model suggests that this inflection is a result of the fact that the fraction of heads undergoing disordering (i.e., dissociation) during a time increment is, at first, very large. This is because all the crossbridges are originally attached and the probability of detachment is large. As a result, the velocity of filament sliding (Fig. 8, dashed line), although small at first, increases very rapidly (Fig. 8, dotted line). There comes a time, however (in our case ∼18 ms after the onset of contraction, indicated in Fig. 8 by a vertical line), when the rate of increase reverses. At this time the fraction undergoing dissociation during each time increment drops because a significant number of heads are already dissociated. This leads to the establishment of a quasi-equilibrium between attached and detached crossbridges.
FIGURE 8.
The anisotropy (solid line) of crossbridges and the velocity (dashed line) of filament sliding have an inflection when an avalanche of detaching heads slows down ∼18 ms after the onset of contraction (vertical line). (Dotted line) The rate of change of velocity. Number of crossbridges, 1000.
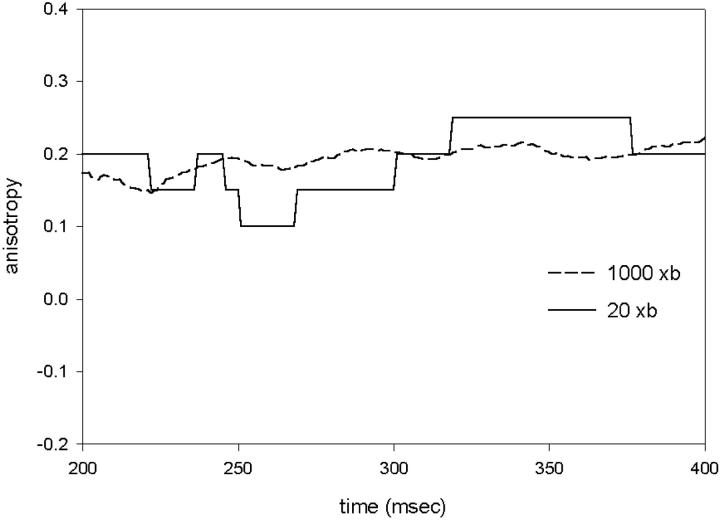
The model also explains why steady-state anisotropy fluctuates in time. If the number of observed crossbridges is large (dashed line in Fig. 9), the steady-state anisotropy settles on an average value that reflects the number of attached heads. But if the number of observed crossbridges is small enough (solid line), the anisotropy fluctuates around this average, reflecting the molecular attachment-detachment process underlying muscle contraction. The steady-state anisotropy can actually increase temporarily. It is a consequence of the fact that the relative fluctuation is inversely proportional to the number of observed crossbridges (e.g., Elson and Magde, 1974).
FIGURE 9.
Anisotropy fluctuations are larger when the number of observed crossbridges is small (solid line, N = 20) than when it is large (dashed line, N = 1000).
The model makes one additional point. It shows that ∼17% of crossbridges are attached to actin at any given time during steady state. The model assumes that these crossbridges are ordered and explains why the steady-state anisotropy is not 0 (Prochniewicz-Nakayama et al., 1983; Borovikov et al., 1991). However, the majority of these crossbridges are in the weak binding state. If this majority were disordered, the average anisotropy during steady state would be zero. This implies that either the regulatory domain of the weakly bound crossbridges is not totally disordered, or that during isometric contraction there is a significant number of crossbridges in the strong binding state.
In nine experiments, the average halftime of slow increase of myosin containing LC3 was 660 ± 100 ms. The rate of anisotropy increase in a single-turnover experiment is ∼3 times slower then the steady-state rate (Fig. 7). It follows that the halftime of anisotropy change associated with crossbridge binding during steady-state contraction of muscle is ∼200 ms.
The rates of dissociation of LC1 and LC3 were significantly different (Fig. 5). In nine experiments, the average halftimes were 920 ± 50 and 660 ± 100 ms for LC1 and LC3, respectively. The difference was statistically significant at 95% level (t = 2.52, P = 0.035). Myosin containing LC1 binds to actin through two sites on the heavy chain (primary site Tyr626-Gln647, Rayment et al., 1993; secondary site Lys567-His578, Rayment et al., 1993; Andreev et al., 1993) and through a light chain Lys3 and Lys4 (Andreev et al., 1999). On the other hand, myosin containing LC3 binds only through the heavy chain. Lowey et al., (1993) and Sweeney (1995) observed that myosin containing LC3 contracted in vitro and in vivo faster then myosin containing LC1. It is proposed here that this difference is due to slower binding of myosin containing LC1.
Abbreviations used: S1: myosin subfragment-1; ELC: essential light chain; LC1: essential light chain 1; LC3: essential light chain 3; RLC: regulatory light chain; 5′-IATR: 5′-iodoacetamido-tetramethyl-rhodamine; Alexa488: Alexa Fluor 488 C5 maleimide; LC1-IATR: LC1 labeled with 5′-IATR; LC3-IATR: LC3 labeled with 5′-IATR; RLC-Alexa: RLC labeled with Alexa Fluor 488 C5 maleimide; DMNPE-caged ATP: 5-dimethyoxy-2-nitrobenzyl-caged ATP.
References
- Allen, T. S.-C., N. Ling, M. Irving, and Y. E. Goldman. 1996. Orientation changes in myosin regulatory light chains following photorelease of ATP in skinned muscle fibers. Biophys. J. 70:1847–1862. [DOI] [PMC free article] [PubMed] [Google Scholar]
- Amdur, I., and G. G. Hammes. 1966. Chemical Kinetics, Principles and Selected Topics. McGraw-Hill, New York.
- Andreev, O. A., A. L. Andreeva, V. S. Markin, and J. Borejdo. 1993. Two different rigor complexes of myosin subfragment-1 and actin. Biochemistry. 32:12046–12053. [DOI] [PubMed] [Google Scholar]
- Andreev, O. A., L. D. Saraswat, S. Lowey, C. Slaughter, and J. Borejdo. 1999. The interaction of the N-terminus of chicken skeletal essential light chain 1 with F-actin. Biochemistry. 38:2480–2485. [DOI] [PubMed] [Google Scholar]
- Axelrod, D. 1979. Carbocyanine dye orientation in red cell membrane studied by microscopic fluorescence polarization. Biophys. J. 26:557–573. [DOI] [PMC free article] [PubMed] [Google Scholar]
- Bagshaw, C. R. 1982. Muscle Contraction. Chapman and Hall, London.
- Borejdo, J., and M. F. Morales. 1977. Fluctuations in tension during contraction of single muscle fibers. Biophys. J. 20:315–334. [DOI] [PMC free article] [PubMed] [Google Scholar]
- Borejdo, J., D. Ushakov, R. Moreland, I. Akopova, Y. Reshetnyak, L. D. Saraswat, K. Kamm, and S. Lowey. 2001. The power stroke causes changes in orientation and mobility of the termini of essential light chain 1 of myosin. Biochemistry. 40:3796–3803. [DOI] [PubMed] [Google Scholar]
- Borejdo, J., D. S. Ushakov, and I. Akopova. 2002. The regulatory and essential light chains of myosin rotate equally during contraction of skeletal muscle. Biophys. J. 82:3150–3159. [DOI] [PMC free article] [PubMed] [Google Scholar]
- Borovikov, Y. S., N. V. Kuleva, and M. I. Khoroshev. 1991. Polarization microfluorimetry study of interaction between myosin head and F-actin in muscle fibers. Gen. Physiol. Biophys. 10:441–459. [PubMed] [Google Scholar]
- Brokaw, C. J. 1976. Computer simulation of movement-generating cross-bridges. Biophys. J. 16:1013–1027. [DOI] [PMC free article] [PubMed] [Google Scholar]
- Burghardt, T. P., S. P. Garamszegi, S. Park, and K. Ajtai. 1998. Tertiary structural changes in the cleft containing the ATP sensitive tryptophan and reactive thiol are consistent with pivoting of the myosin heavy chain at Gly699. Biochemistry. 37:8035–8047. [DOI] [PubMed] [Google Scholar]
- Cooke, R. 1997. Actomyosin interaction in striated muscle. Physiol. Rev. 77:671–697. [DOI] [PubMed] [Google Scholar]
- Dominguez, R., Y. Freyzon, K. M. Trybus, and C. Cohen. 1998. Crystal structure of a vertebrate smooth muscle myosin motor domain and its complex with the essential light chain: visualization of the pre-power stroke state. Cell. 94:559–571. [DOI] [PubMed] [Google Scholar]
- Dos Remedios, C. G., R. G. Millikan, and M. F. Morales. 1972. Polarization of tryptophan fluorescence from single striated muscle fibers. A molecular probe of contractile state. J. Gen. Physiol. 59:103–120. [DOI] [PMC free article] [PubMed] [Google Scholar]
- Eigen, M., and R. Rigler. 1994. Sorting single molecules: application to diagnostics and evolutionary biotechnology. Proc. Natl. Acad. Sci. USA. 91:5740–5747. [DOI] [PMC free article] [PubMed] [Google Scholar]
- Elson, E. L., and D. Magde. 1974. Fluorescence correlation spectroscopy: conceptual basis and theory. Biopolymers. 13:1–28. [DOI] [PubMed] [Google Scholar]
- Goldman, Y. E. 1998. Wag the tail: structural dynamics of actomyosin. Cell. 93:1–4. [DOI] [PubMed] [Google Scholar]
- Goldman, Y. E., M. G. Hibberd, and D. R. Trentham. 1984. Relaxation of rabbit psoas muscle fibres from rigor by photochemical generation of adenosine-5′-triphosphate. J. Physiol. (Lond.). 354:577–604. [DOI] [PMC free article] [PubMed] [Google Scholar]
- He, Z. H., R. K. Chillingworth, M. Brune, J. E. Corrie, D. R. Trentham, M. R. Webb, and M. A. Ferenczi. 1997. ATPase kinetics on activation of rabbit and frog permeabilized isometric muscle fibres: a real time phosphate assay. J Physiol. 501:125–148. [DOI] [PMC free article] [PubMed] [Google Scholar]
- Highsmith, S., and D. Eden. 1993. Myosin-ATP chemomechanics. Biochemistry. 32:2455–2458. [DOI] [PubMed] [Google Scholar]
- Hill, T. L., E. Eisenberg, Y. D. Chen, and R. J. Podolsky. 1975. Some self-consistent two-state sliding filament models of muscle contraction. Biophys. J. 15:335–372. [DOI] [PMC free article] [PubMed] [Google Scholar]
- Horiuti, K., N. Yagi, and S. Takemori. 2001. Single turnover of cross-bridge ATPase in rat muscle fibers studied by photolysis of caged ATP. J. Muscle Res. Cell Motil. 22:101–109. [DOI] [PubMed] [Google Scholar]
- Houdusse, A., V. N. Kalabokis, D. Himmel, A. G. Szent-Gyorgyi, and C. Cohen. 1999. Atomic structure of scallop myosin subfragment S1 complexed with MgADP: a novel conformation of the myosin head. Cell. 97:459–470. [DOI] [PubMed] [Google Scholar]
- Hubley, M. J., B. R. Locke, and T. S. Moerland. 1996. The effects of temperature, pH, and magnesium on the diffusion coefficient of ATP in solutions of physiological ionic strength. Biochim. Biophys. Acta. 1291:115–121. [DOI] [PubMed] [Google Scholar]
- Huxley, A. F. 1957. A hypothesis for the mechanism of contraction of muscle. Prog. Biophys. Biophys. Chem. 7:255–318. [PubMed] [Google Scholar]
- Irving, M., T. St Claire Allen, C. Sabido-David, J. S. Craik, B. Brandmeier, J. Kendrick-Jones, J. E. Corrie, D. R. Trentham, and Y. E. Goldman. 1995. Tilting of the light-chain region of myosin during step length changes and active force generation in skeletal muscle. Nature. 375:688–691. [DOI] [PubMed] [Google Scholar]
- Ling, N., C. Shrimpton, J. Sleep, J. Kendrick-Jones, and M. Irving. 1996. Fluorescent probes of the orientation of myosin regulatory light chains in relaxed, rigor, and contracting muscle. Biophys. J. 70:1836–1846. [DOI] [PMC free article] [PubMed] [Google Scholar]
- Lowey, S., G. S. Waller, and K. M. Trybus. 1993. Function of skeletal muscle myosin heavy and light chains isoforms by an in vitro motility assay. J. Biol. Chem. 268:20414–20418. [PubMed] [Google Scholar]
- Prochniewicz-Nakayama, E., T. Yanagida, and F. Oosawa. 1983. Studies on conformation of F-actin in muscle fibers in the relaxed state, rigor, and during contraction using fluorescent phalloidin. J. Cell Biol. 97:1663–1667. [DOI] [PMC free article] [PubMed] [Google Scholar]
- Rayment, I., W. Rypniewski, K. Schmidt-Base, R. Smith, D. R. Tomchik, M. M. Benning, D. A. Winkelman, G. Wesenberg, and H. M. Holden. 1993. Three-dimensional structure of myosin subfragment-1: a molecular motor. Science. 261:50–58. [DOI] [PubMed] [Google Scholar]
- Sabido-David, C., B. Brandmeier, J. S. Craik, J. E. Corrie, D. R. Trentham, and M. Irving. 1998a. Steady-state fluorescence polarization studies of the orientation of myosin regulatory light chains in single skeletal muscle fibers using pure isomers of iodoacetamidotetramethylrhodamine. Biophys. J. 74:3083–3092. [DOI] [PMC free article] [PubMed] [Google Scholar]
- Sabido-David, C., S. C. Hopkins, L. D. Saraswat, S. Lowey, Y. E. Goldman, and M. Irving. 1998b. Orientation changes of fluorescent probes at five sites on the myosin regulatory light chain during contraction of single skeletal muscle fibres. J. Mol. Biol. 279:387–402. [DOI] [PubMed] [Google Scholar]
- Selvin, P. R., B. A. Scalettar, J. P. Langmore, D. Axelrod, M. P. Klein, and J. E. Hearst. 1990. A polarized photobleaching study of chromatin reorientation in intact nuclei. J. Mol. Biol. 214:911–922. [DOI] [PubMed] [Google Scholar]
- Sweeney, H. L. 1995. Function of the N-terminus of the myosin essential light chain of vertebrate striated muscle. Biophys. J. 68:112s–119s. [PMC free article] [PubMed] [Google Scholar]
- Uyeda, T. Q., P. D. Abramson, and J. A. Spudich. 1996. The neck region of the myosin motor domain acts as a lever arm to generate movement. Proc. Natl. Acad. Sci. USA. 93:4459–4464. [DOI] [PMC free article] [PubMed] [Google Scholar]
- Warshaw, D. M., W. H. Guilford, Y. Freyzon, E. Krementsova, K. A. Palmiter, M. J. Tyska, J. E. Baker, and K. M. Trybus. 2000. The light chain binding domain of expressed smooth muscle heavy meromyosin acts as a mechanical lever. J. Biol. Chem. 275:37167–37172. [DOI] [PubMed] [Google Scholar]
- White, H. D., and E. W. Taylor. 1976. Energetics and mechanism of actomyosin adenosine triphosphatase. Biochemistry. 15:5818–5826. [DOI] [PubMed] [Google Scholar]


