Abstract
Although structural differences for the Mg-DNA and Ca-DNA complexes are provided in the solid state, such comparative study in aqueous solution has been less investigated. The aim of this study was to examine the bindings of Mg and Ca cations with calf thymus DNA in aqueous solution at physiological pH, using constant concentration of DNA (1.25 or 12.5 mM) and various concentrations of metal ions (2 μM–650 μM). Capillary electrophoresis, UV-visible, and Fourier transform infrared spectroscopic methods were used to determine the cation-binding modes, the binding constants, and DNA structural variations in aqueous solution. Direct Ca-PO2 binding was evident by major spectral changes (shifting and splitting) of the backbone PO2 asymmetric stretching at 1222 cm−1 with K = 4.80 × 10⁵ M−1, whereas an indirect Mg-phosphate interaction occurred (due to the lack of shifting and splitting of the phosphate band at 1222 cm−1) with K = 5.6 × 10⁴ M−1. The metal-base bindings were directly for the Mg with K = 3.20 × 10⁵ M−1 and indirectly for the Ca cation with K = 3.0 × 10⁴ M−1. Both major and minor groove bindings were observed with no alteration of the B-DNA conformation.
INTRODUCTION
The structure and dynamics of the grooves of DNA are of immense importance for the recognition of DNA by proteins and drugs, as well as the packaging of DNA into nucleosomes and viral particles. Although it has been recognized that cations are required for the formation and stabilization of nucleic acid structures, the direct influence of cation interaction on sequence-specific DNA conformation and dynamics is still being debated (McFail-Isom et al., 1999). It is important to know how cation binding to the major or minor groove can affect well-established features of DNA conformation.
In recent years, extensive research has been conducted for the localization of the metal cations in the major and minor grooves of DNA duplex and the effects of cation binding on the groove geometry (Hud and Polak, 2001). Similarly, metal ions binding to different DNA conformations varies due to the structural variations of the minor and major grooves in these DNA structures (Sines et al., 2000; Hamelberg et al., 2001). The alkali metal cations Na and K are located in the minor groove of AT-rich sequences, whereas divalent cations prefer major groove binding in the GC-rich sequences (Hud and Feigon, 1997). X-ray diffraction measurements, magnetic relaxation dispersion, molecular dynamics simulations, and electrophoresis were used for the localization of alkali metal cations in the minor or major groove of DNA duplex (Howerton et al., 2001; Chiu et al., 1999; Denisov and Halle, 2000; Hamelberg et al., 2000; Tereshko et al., 1999; Stellwagen et al., 2001). The crystal structures of the Mg(II) and Ca(II) complexes with B-DNA decamers CCAACGTTGG, CCAGCGCTGG, and GCGAATTCGCG were recently determined at atomic resolution (Chiu and Dickerson, 2000; Minasov et al., 1999; Liu et al., 1998; Soler-Lopez et al., 1999; Liu and Subirana, 1999). Structural differences regarding the cation-binding modes to the major or minor groove, specific and nonspecific interactions, as well as DNA bending were reported (Chiu and Dickerson, 2000; Minasov et al., 1999). Ca binds directly and indirectly to DNA bases and the backbone phosphate group, whereas Mg coordination is mainly indirectly (via cation hydration shell). Although detailed structural differences for Mg-DNA and Ca-DNA complexes are provided in the solid state, such comparative study in aqueous solution has been less explored. Therefore, it was of interest to perform a comparative study of DNA binding to Mg(II) and Ca(II) ions in aqueous solution clarifying how the cations interact with DNA bases and the backbone phosphate groups and the effects of metal ion binding on DNA structure.
We now report the results of a comparative study of calf thymus DNA binding to Mg(II) and Ca(II), using capillary electrophoresis (CE) and Fourier transform infrared (FTIR) difference spectroscopic methods at pH 7.4 with cation/DNA(P) molar ratios of 1:640, 1:320, 1:160, 1:80, 1:40, 1:20, 1:10, 1:8, and 1:4 (for CE), and 1:80–1:2 (for infrared measurements) at a final DNA(phosphate) concentrations of 1.25 mM for electrophoresis and 12.5 mM for infrared spectroscopy. Structural analysis regarding the cation binding site, the binding constant, helix stability, and DNA secondary structure are reported here. This is a first infrared spectroscopic and capillary electrophoresis study regarding calf thymus DNA complexes with Mg and Ca cations and should help to elucidate the nature of this biologically important complexation in vitro and in vivo.
MATERIALS AND METHODS
Materials
Highly polymerized type I calf thymus DNA sodium salt (7% Na content) was purchased from Sigma Chemical (St. Louis, MO), and was deproteinated by the addition of CHCl3 and isoamyl alcohol in NaCl solution. Hydrated MgCl2 and CaCl2 salts were from Aldrich Chemical (Milwaukee, WI). Other chemicals were of reagent grade and used as supplied.
Preparation of stock solutions
Sodium-DNA was dissolved to 1% w/w (25 mM DNA(phosphate)) 0.1 mM NaCl and 1 mM Na-cacodylate (pH 7.4) at 5°C for 24 h with occasional stirring to ensure the formation of a homogeneous solution. The solutions of cation salts were prepared in distilled water and added dropwise to the polynucleotides solutions to attain desired cation/DNA(P) molar ratios of 1:640, 1:320, 1:160, 1:80, 1:40, 1:20, 1:10, 1:8, and 1:4 (for CE) and 1:80–1:2 (for infrared measurements) at a final DNA(phosphate) concentration of 1.25 mM for CE and 12.5 mM for infrared measurements. The pHs of stock solutions were adjusted at 7.4 ± 1 with a pH meter Orion model 210A. The infrared spectra of the cation-DNA complexes were recorded after incubation of the mixtures of polynucleotides and cation solutions for 2 h.
FTIR spectra
Infrared spectra were recorded on a Bomem DA3-0.02 FTIR spectrometer equipped with a nitrogen-cooled HgCdTe detector and KBr beam splitter. The solution spectra were taken using specially designed AgBr cells with pathlengths of 50 μm with resolution of 2–4 cm−1 and 100–500 scans. Each set of infrared spectra were taken (three times) on three identical samples with the same DNA and metal ion concentrations. The water subtraction was carried out with 0.1 mM NaCl solution used as a reference at pH 7.4 (Alex and Dupuis, 1989). A good subtraction was achieved as shown by a flat baseline around 2200 cm−1 where the water combination mode is located. This method is a rough estimate, but removes the water content in a satisfactory way. The spectra were smoothed with Savitzy-Golay procedure (Alex and Dupuis, 1989). The intensity ratio variations of several DNA in-plane vibrations related to A-T and G-C basepairs as well as the backbone PO2 stretching were measured with respect to the reference bands at 968 cm−1 as a function of cation concentrations with an error of ±3%. The vibration at 968 cm−1 is due to the sugar C-C stretching modes and show no spectral changes upon cation complexation. These intensity ratios were used to determine the cation binding to DNA bases or the backbone phosphate groups. Similar intensity ratio variations were used to determine the metal ion binding to DNA bases and the backbone phosphate group (Arakawa et al., 2000; Neault and Tajmir-Riahi, 1999).
Capillary electrophoresis
A P/ACE System MDQ (Beckman Coulter, Fullerton, CA) with photodiode array detector was used to determine the Mg-DNA and Ca-DNA binding constants. Uncoated fused silica capillary of 75 μm inner diameter and 57 cm length (50 cm effective length) was used. The capillary was initially conditioned by washing with 1 N sodium hydroxide for 30 min, followed by a 15-min wash with 0.1 M sodium hydroxide. Then it was extensively rinsed with deionized water and also 20 mM NaCl before use. Samples were injected using a voltage injection at 10 kV for 5 s. Electrophoresis was carried out at a voltage of 25 kV for 10 min using normal polarity. All runs were carried out at 25°C in a run buffer of 4 mM NaCl and 10 mM Tris-HCl (pH 7.4). The electropherograms were monitored at 260 nm. Stock solutions of cations (6.25 mM) were prepared in deionized water. The capillary inlet and outlet vials were replenished after every run. The cation binding experiments were performed in a sample buffer 10 mM Tris-HCl and 4 mM NaCl (pH 7.4), using constant concentration of polynucleotides and various concentrations of cation. DNA was dissolved in 4 mM NaCl at a polynucleotide phosphate concentration of 2.5 mM. The stock solutions of cation were added to polynucleotide solutions to attain desired cation/DNA(P) molar ratios of 1:640, 1:320, 1:160, 1:80, 1:40, 1:20, 1:10, 1:8, and 1:4 with final DNA(P) concentration of 1.25 mM. Each sample was allowed to equilibrate for 30 min before injection.
Data analysis
The apparent binding constants for the Mg-DNA and Ca-DNA complexes were determined by the CE using Scatchard analysis (Klotz and Hunston, 1971; Klotz, 1982). The average number (Rf) of cation bound per one binding site of DNA was determined from the change of the peak height due to the presence of the cation by the equation
 |
(1) |
where h is the change in the peak height measured for any added cation concentration, and h0 and hs correspond to the peak heights of the free polynucleotides and cation-saturated polynucleotides, respectively. Using the equation for binding constant
 |
(2) |
the experimental cation binding constant Kb was then computed by fitting the experimental values of Rf and cation concentrations to the equation
 |
(3) |
The last equation gives a convenient form for Scatchard analysis:
 |
(4) |
In recent years, CE has been widely used to determine the binding constants of DNA-protein, metal-protein, and metal-DNA complexes (Foulds and Etzkorn, 1998; Guszczynski and Copeland, 1998; Xian et al., 1996; Li and Martin, 1998; Arakawa et al., 2001a).
RESULTS AND DISCUSSION
FTIR spectra of Mg-DNA and Ca-DNA complexes
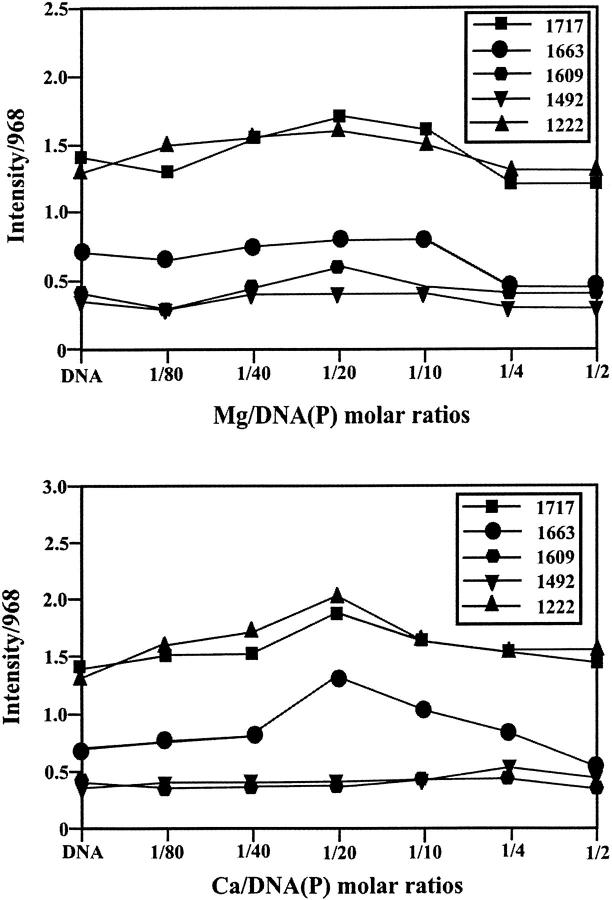
The infrared spectral features related to this discussion are presented in Figs. 1 and 2. Evidence for direct Ca-phosphate binding comes from major spectral changes of the band at 1222 cm−1 related to the asymmetric PO2 stretching vibration (Starikov et al., 1991; Loprete and Hartman, 1993; Alex and Dupuis, 1989; Taillandier et al., 1985; Prescot et al., 1984) of the free DNA upon Ca interaction. The band at 1222 cm−1 exhibited shifting and splitting into three components at 1216, 1231, and 1250 cm−1 in the spectra of Ca-DNA complexes, whereas it showed no shifting or splitting in the Mg-DNA adducts (Fig. 1, r = 1/80). In addition, the PO2 band at 1222 cm−1 showed major increase in intensity (30%) upon Ca interaction, whereas such intensity increase was less pronounced (15%) in the Mg-DNA complexes (Fig. 2). Additional evidence for the Ca-phosphate binding comes from the alterations of the relative intensities of the symmetric and asymmetric vibrations of the backbone PO2 group. The νs PO2 (1088 cm−) and νas PO2 (1222 cm−1) have changed, with the ratio νs/νas going from 1.7 in the free DNA to 1.5 for the Ca-DNA complexes, whereas no major alterations of the intensity ratios occurred for the Mg-DNA adducts. The observed spectral changes are due to a direct Ca-phosphate binding and indirect Mg-phosphate interaction (through H2O) in these cation-DNA complexes. The major splitting of the phosphate band at 1222 cm−1 (at 1216, 1231, and 1250 cm−1) in the spectra of the Ca-DNA adducts is also indicative of multidentate Ca-phosphate bindings (possibly via O1P and O2P atoms). The direct Ca-phosphate binding and indirect Mg-phosphate interaction were observed in the crystal structures of several Ca and Mg complexes with B-DNA oligomers (Chiu and Dickerson, 2000; Minasov et al., 1999).
FIGURE 1.
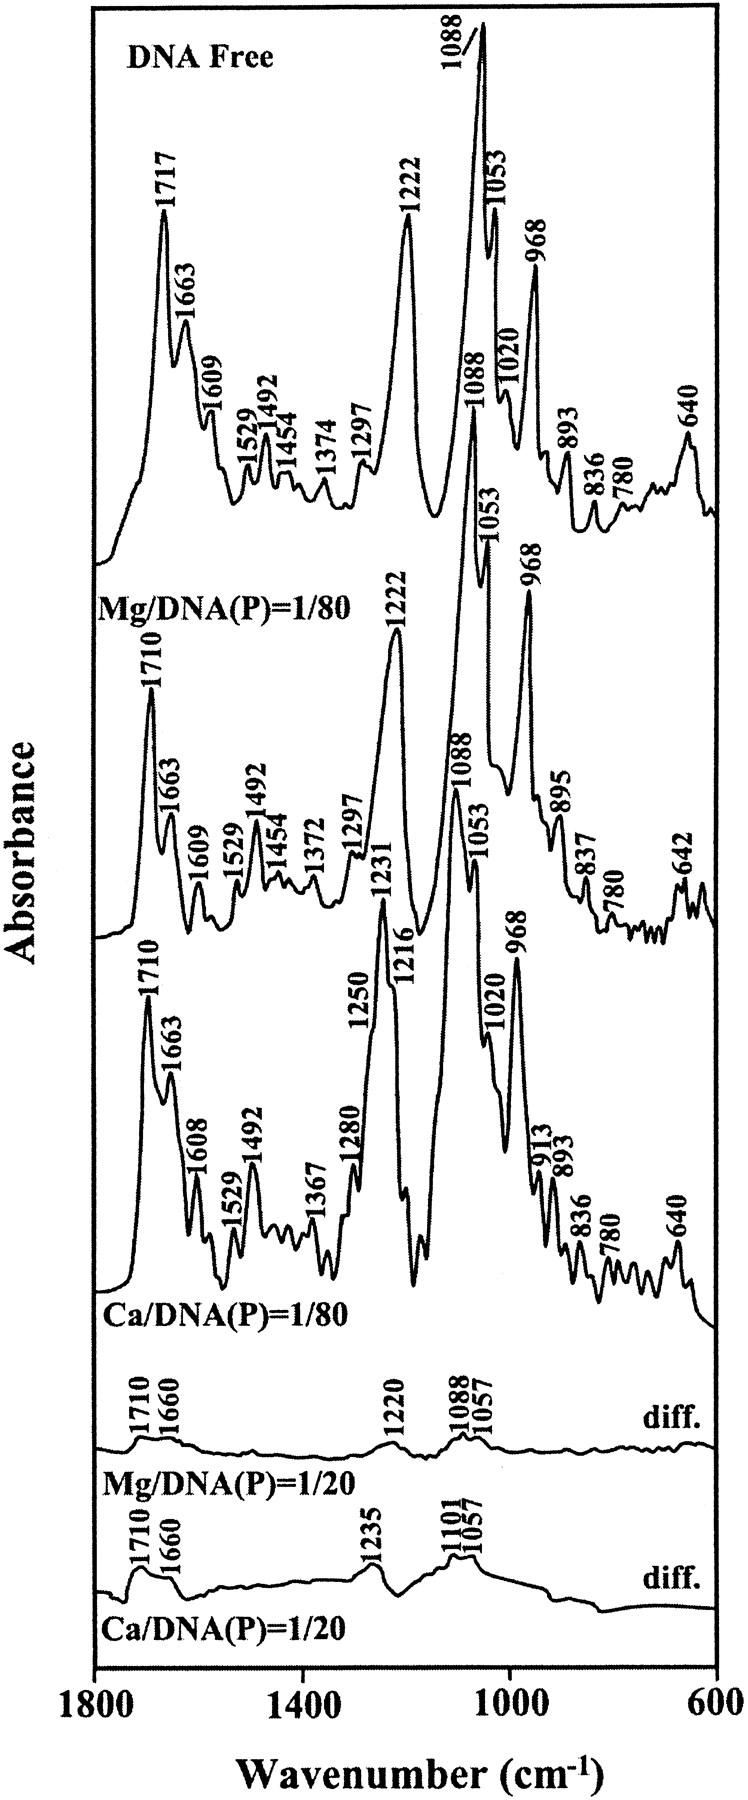
FTIR spectra (top three curves) and difference FTIR spectra [(DNA solution + metal ion) − (DNA solution)] (two bottom curves) of the uncomplexed calf thymus DNA and its Mg and Ca complexes in aqueous solution at pH = 7.4 with various cation/DNA(P) molar ratios in the region of 1800–600 cm−1.
FIGURE 2.
Intensity ratio variations for several DNA in-plane vibrations at 1717 (guanine, thymine), 1663 (thymine, guanine, adenine, cytosine), 1609 (adenine), 1492 (cytosine, guanine), and 1222 cm−1 (PO2 stretch) as a function of Mg and Ca concentrations (different cation-DNA(P) molar ratios).
Cation-base binding was observed for both Mg- and Ca-DNA adducts. The strong band at 1717 cm−1 of the free DNA related mainly to the guanine vibration (Alex and Dupuis, 1989; Dirico et al., 1985; Taillandier et al., 1985; Starikov et al., 1991) shifted toward a lower frequency at 1710 cm−1 in the spectra of the Mg and Ca complexes (Fig. 1, r = 1/80). The spectral shifting of the guanine band at 1717 cm−1 was associated with a major increase in intensity in the Mg-DNA (35%) and to a lesser extent for the Ca-DNA (20%) adducts (Fig. 2). The observed spectral changes are attributed to a direct Mg-N7-guanine binding and indirect Ca-H2O-N7-guanine interaction in these cation-DNA complexes. Direct and indirect Mg-N7 bindings were observed in the crystal structures of several Z-DNA oligomers (Gessner et al., 1985). However, direct and indirect Ca-N7 bindings as well as indirect Mg-H2O-N7 interaction occurred in the crystal structures of several Mg and Ca complexes with B-DNA oligomers (Chiu and Dickerson, 2000; Minasov et al., 1999).
It has been demonstrated that the Cr(III) forms chelation with DNA through guanine N7 and the backbone phosphate group (Arakawa et al., 2000). The infrared spectra of the Cr(III)-DNA adducts showed major spectral shifting and intensity variations for the phosphate asymmetric stretch at 1222 and the guanine band at 1717 cm−1. The PO2 band at 1222 cm−1 shifted toward a lower frequency at 1216 cm−1 and the guanine band at 1717 appeared at 1709 cm−1 upon Cr(III) interaction (Arakawa et al., 2000). Similarly, CE results showed two major bindings with K1 = 2.3 × 10⁵ M−1 (Cr-N7) and K2 = 3.6 × 10⁴ M−1 (Cr-phosphate) for Cr(III)-DNA complexes (Arakawa et al., 2001b). Since one of the phosphate component bands appeared at 1216 cm−1 and the guanine band at 1717 also shifted toward a lower frequency at 1710 cm−1 in the spectra of Ca-DNA adducts (Fig. 1), the Ca cation chelate formation via guanine N7 and the backbone phosphate group can be included here. Such spectral changes were not observed for the phosphate band at 1222 cm−1 in the spectra of the Mg-DNA complexes (Fig. 1); thus the possibility of Mg cation chelate formation can not be included here. However, since guanine O6 atom is in the vicinity of the N7 bound metal ion, an indirect interaction of cation O6-H2O-cation-N7 can occur, which stabilizes metal-DNA complexation. Such weak metal-carbonyl interaction (via cation hydration shell) was observed in the crystal structure of Mg and Ca-DNA adducts (Chiu and Dickerson, 2000; Minasov et al., 1999; Liu et al., 1998; Soler-Lopez et al., 1999; Liu and Subirana, 1999).
As cation concentration increased (r = 1/20), a major increase in intensity of the thymine band at 1663 cm−1 (30%) was observed, although such intensity variations were less important for the Mg-DNA adducts (10%) (Fig. 2). On the other hand, the adenine band at 1609 cm−1 exhibited major intensity increase (25%) in the spectra of the Mg-DNA complexes, whereas no intensity changes showed in the Ca-DNA adducts (Fig. 2, r = 1/20). The observed spectral modifications are due to Ca binding to thymine residue (possibly via O2) and Mg interaction with adenine N7 site. Since no major spectral shiftings were observed for the thymine band at 1663 and adenine band at 1609 cm−1, an indirect cation-base binding with thymine or adenine can be included here. This is consistent with x-ray structural analysis of the Mg and Ca complexes with B-DNA oligomers that showed the participation of both G-C and A-T bases (directly or indirectly) in metal-DNA adducts (Chiu and Dickerson, 2000; Minasov et al., 1999).
DNA conformation
Free DNA showed B conformation with infrared marker bands at 1717 (guanine), 1222 (asymmetric PO2 stretch), 893 (sugar-phosphate stretch), and 836 cm−1 (phosphodiester mode) (Fig. 1). In the B–A transition, the band at 836 appears at ∼820–810 cm−1, whereas the PO2 stretching vibration at 1222 shifts toward a higher frequency at 1230–1240 cm−1 and the guanine band at 1717 appears at 1710–1700 cm−1 (Brahms et al., 1974; Taillandier et al., 1985; Loprete and Hartman, 1993). In the B–Z transition, the guanine band at 1717 shifts to 1690 cm−1 and the phosphate vibration at 1222 appears at 1216 cm−1, whereas the sugar-phosphate band at 836 displaces toward a lower frequency at 800–790 cm−1 (Tajmir-Riahi et al., 1995; Loprete and Hartman, 1993; Taillandier et al., 1985). Since the sugar-phosphate bands at 836 and 893 cm−1 exhibited no major shifting in the spectra of the Mg- and Ca-DNA adducts, the calf thymus DNA remains in the B-family structure. The shifts of the guanine band at 1717–1710 cm−1 and the PO2 stretching band at from 1222 to 1216–1250 cm−1, in the spectra of the Ca- and Mg-DNA complexes, are due to the cation coordination to the guanine N7 atom and the backbone phosphate group and not arising from DNA conformational changes (Fig. 1).
Capillary electrophoresis
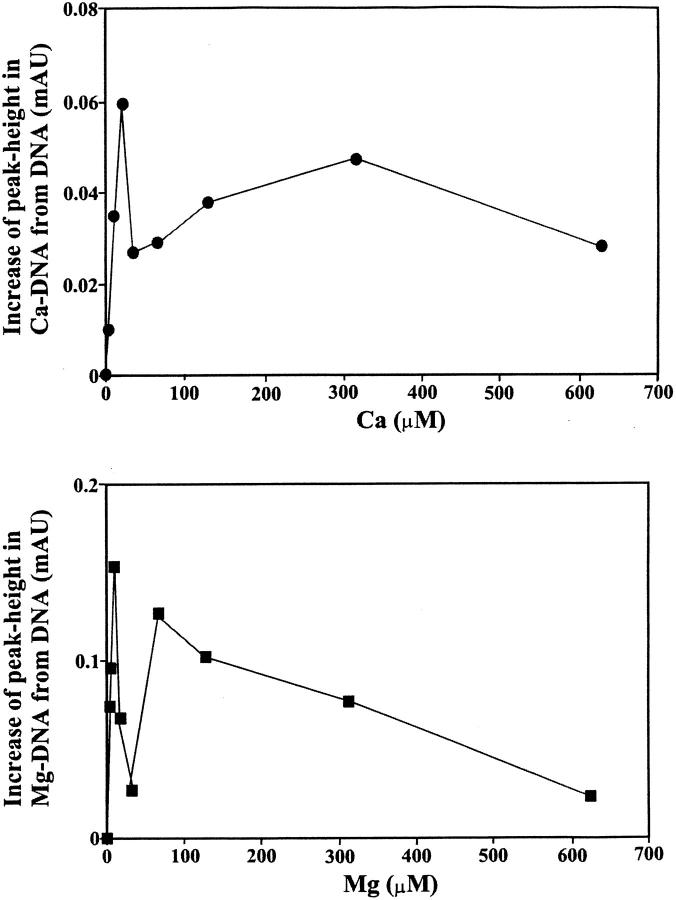
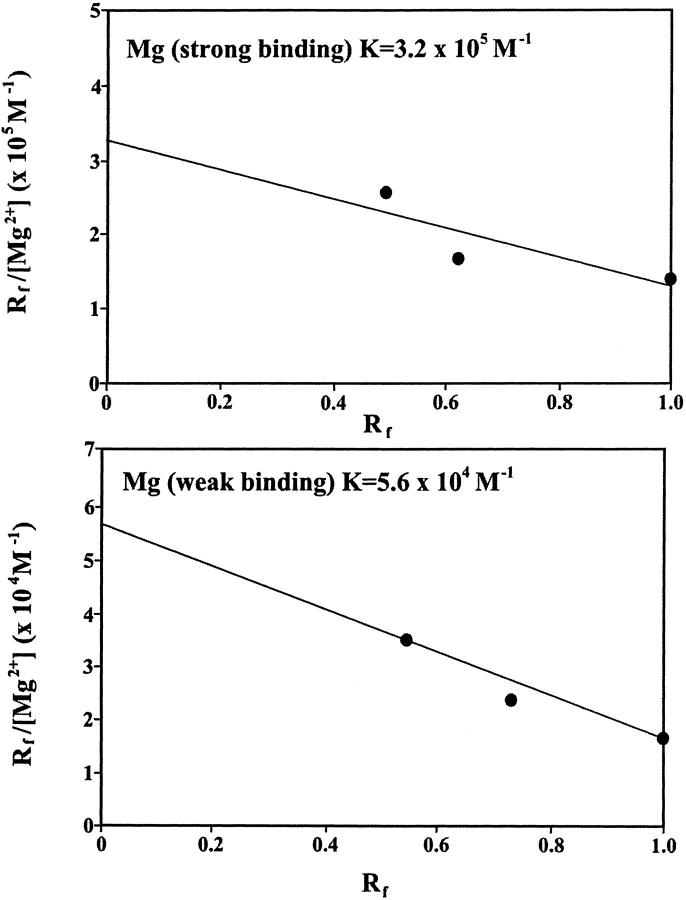
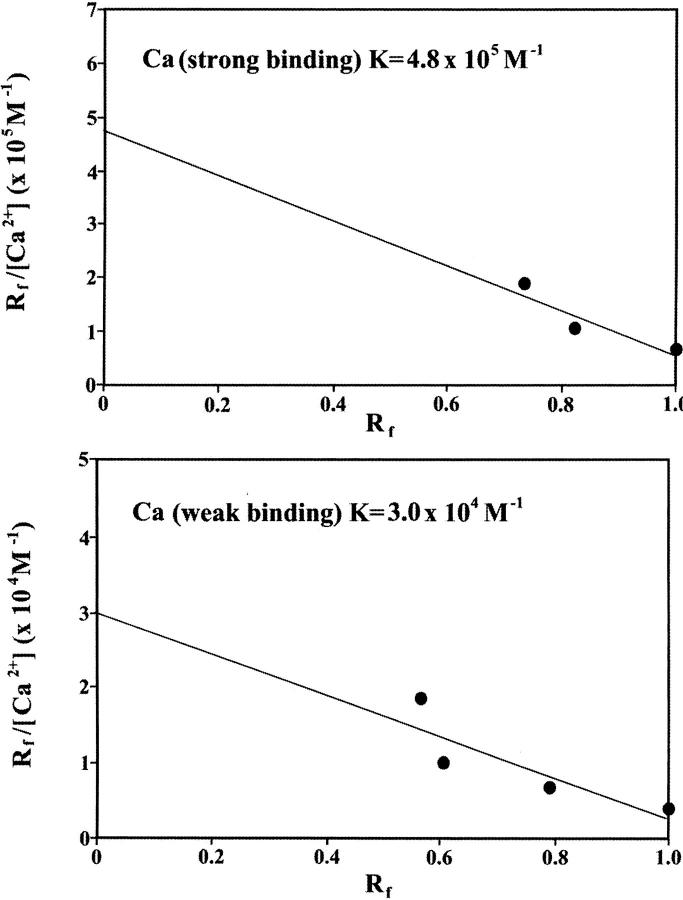
Additional evidence regarding Fe-DNA complexation comes from CE. Reaction mixtures containing constant amount of calf thymus DNA and various amounts of Mg(II) or Ca (III) in molar ratios of 1:640, 1:320, 1:160, 1:80, 1:40, 1:20, 1:10, 1:8, and 1:4 were prepared and subjected to CE. All runs were carried out at 25°C in a run buffer of 4 mM NaCl and 10 mM Tris-HCl (pH 7.4). The peak height of the metal-DNA largely increased as the molar ratios of cation/DNA(P) increased (Fig. 3). However, the saturation curves showed a sharp maximum for both Mg and Ca at very low cation concentrations followed by a sharp decrease as cation concentration increased (Fig. 3). The sharp decrease is due to a major helix stabilization as a result of cation-phosphate interaction (backbone phosphate charge neutralization). As cation concentration increased further, a second peak height was observed with a maximum at 320 μM for Ca and 75 μM for Mg cation complexes (Fig. 3). Further addition of metal cation resulted in a decrease of peak height, indicating more metal-DNA interaction is in progress. Scatchard analysis was performed using data from increase of the peak height for the cation-DNA complexes as a function of metal ion concentration (described in experimental procedures). The results showed two major bindings for the Mg-DNA complexes with K1 = 3.20 × 10⁵ M−1 (strong binding) and K2 = 5.60 × 10⁴ M−1 (weak binding) (Fig. 4). Similarly, two bindings with K1 = 4.80 × 10⁵ M−1 (strong binding) and K2 = 3.0 × 10⁴ M−1 (weak binding) were observed for the Ca-DNA adducts (Fig. 5). The capillary electrophoresis results are consistent with infrared data (described earlier) that showed two major binding sites for the Mg cation, located at the guanine N7 (strong binding) and the backbone phosphate group (weak binding). However, the two binding sites for the Ca cation were at the backbone phosphate group (strong binding) and the N7 guanine (weak binding). The calculated binding constants (K) for the Mg- and Ca-DNA complexes are consistent with those of the corresponding metal-DNA adducts previously reported (Morgan et al., 1986; Izatt et al., 1971).
FIGURE 3.
Plots for cation concentrations versus increase of peak height for the Mg and Ca complexes. Incubation of constant concentration of DNA (1.25 mM of phosphate) with various concentrations of cations were carried out in 10 mM Tris-HCl and 4 mM NaCl (pH 7.4), and the mixtures were subjected to capillary electrophoresis. The increase of peak height in cation-DNA was determined by subtracting the peak height of the free DNA from each cation-DNA adduct.
FIGURE 4.
Scatchard plot for the Mg-DNA complexes.
FIGURE 5.
Scatchard plot for the Ca-DNA complexes.
Competition between Mg and Ca cations
It has been suggested that Ca cation always wins in a competition with Mg for binding to DNA in oriented fibers, while in aqueous solution the differences in bindings of these two cations are likely to be very small (Korolev et al., 1999; Li et al., 1998). Recent x-ray structural analysis showed stronger binding for Ca over Mg cation in several B-DNA oligomers (Chiu and Dickerson, 2000; Minasov et al., 1999). Different crystal packings were observed for the DNA oligomers in the presence of Mg and Ca cations (Liu et al., 1998; Soler-Lopez et al., 1999; Liu and Subirana, 1999). Increased affinity for Ca over Mg cations toward DNA binding has been observed in aqueous solution (Korolev et al., 1999; Duguid et al., 1993, 1995; Langlais et al., 1990; Eichhorn and Shin, 1968). However, gel electrophoresis results showed no major differences for Mg and Ca complexes with DNA in aqueous solution (Li et al., 1998).
Based on our CE and spectroscopic results presented here, there are some differences between Mg-DNA and Ca-DNA complexes in aqueous solution: a), stronger affinity for Ca-phosphate binding with K = 4.80 × 10⁵ M−1 (strong binding) over Mg-phosphate interaction with K = 5.60 × 10⁴ M−1 (weak binding); b), stronger Mg-base binding with K = 3.20 × 10⁵ M−1 (strong binding) over Ca cation complexation with K = 3.0 × 10⁴ M−1 (weak binding); c), chelate formation via guanine N7 and the nearest PO2 group observed for the Ca-DNA complexes and not for the Mg-DNA adducts; and d), Ca-thymine and Mg-adenine interactions occurred at high cation concentrations.
Acknowledgments
We highly appreciate the financial supports received from Natural Sciences and Engineering Research Council of Canada and FCAR (Québec).
Dr. H. Arakawa was on sabbatical leave from the Department of Arts and Sciences, Hokkaido Institute of Technology, Sapporo, Japan.
References
- Alex, S., and P. Dupuis. 1989. FTIR and Raman investigation of cadmium binding by DNA. Inorg. Chim. Acta. 157:271–281. [Google Scholar]
- Arakawa, H., R. Ahmad, M. Naoui, and H. A. Tajmir-Riahi. 2000. A comparative study of calf thymus DNA binding to Cr(III) and Cr(VI) ions. Evidence for the guanine N-7 chromium-phosphate chelate formation. J. Biol. Chem. 275:10150–10153. [DOI] [PubMed] [Google Scholar]
- Arakawa, H., J. F. Neault, and H. A. Tajmir-Riahi. 2001a. Silver(I) complexes with DNA and RNA studied by Fourier transform infrared spectroscopy and capillary electrophoresis. Biophys. J. 81:1580–1587. [DOI] [PMC free article] [PubMed] [Google Scholar]
- Arakawa, H., N. Watanabe, and H. A. Tajmir-Riahi. 2001b. Calf-thymus DNA interaction with Cr(III)-galate and Cr(III)-ethylgalate studied by FTIR spectroscopy and capillary electrophoresis. Bull. Chem. Soc. Jpn. 74:1075–1082. [Google Scholar]
- Brahms, S., J. Brahms, and J. Pilet. 1974. Infrared studies on the backbone conformation of nucleic acids. Isr. J. Chem. 12:153–163. [Google Scholar]
- Chiu, T. K., M. Kaczor-Grzeskowiak, and R. E. Dickerson. 1999. Absence of minor groove monovalent cations in the crosslinked dodecamer C-G-C-G-A-A-T-T-C-G-G. J. Mol. Biol. 292:589–608. [DOI] [PubMed] [Google Scholar]
- Chiu, T. K., and R. E. Dickerson. 2000. 1 Å crystal structure of B-DNA reveal sequence-specific binding and groove-specific bending of DNA by magnesium and calcium. J. Mol. Biol. 301:915–945. [DOI] [PubMed] [Google Scholar]
- Denisov, V. P., and B. Halle. 2000. Sequence-specific binding of counterions to B-DNA. Proc. Natl. Acad. Sci. USA. 97:629–633. [DOI] [PMC free article] [PubMed] [Google Scholar]
- DiRico, D. E. Jr., K. B. Keller, and K. A. Hartman. 1985. The infrared spectrum and structure of type I complex of silver and DNA. Nucleic Acids Res. 13:251–260. [DOI] [PMC free article] [PubMed] [Google Scholar]
- Duguid, J. G., J. M. Benevides, V. A. Bloomfield, and G. J. Thomas Jr. 1993. Raman spectroscopy of DNA-metal complexes. I. Interactions and conformational effects of the divalent cations: Mg, Ca, Sr, Ba, Mn, Co, Ni, Cu, Pd and Cd. Biophys. J. 65:1916–1928. [DOI] [PMC free article] [PubMed] [Google Scholar]
- Duguid, J. G., V. A. Bloomfield, J. M. Benevides, and G. J. Thomas Jr. 1995. Raman spectroscopy of DNA-metal complexes. II. The thermal denaturation of DNA in the presence of Sr2+, Ba2+, Mg2+, Ca2+, Mn2+, Co2+, Ni2+ and Cd 2+. Biophys. J. 69:2623–2641. [DOI] [PMC free article] [PubMed] [Google Scholar]
- Eichhorn, G. L., and Y. A. Shin. 1968. Interactions of metal ions with polynucleotides and related compounds. XII. The relative effect of various metal ions on DNA helicity. J. Am. Chem. Soc. 90:7323–7328. [DOI] [PubMed] [Google Scholar]
- Foulds, G. J., and F. A. Etzkorn. 1998. A capillary electrophoresis mobility shift assay for protein-DNA binding affinities free in solution. Nucleic Acids Res. 26:4304–4305. [DOI] [PMC free article] [PubMed]
- Gessner, R. V., G. J. Quigley, A. H. J. Wang, G. A. van der Marel, J. H. van Boom, and A. Rich. 1985. Structural basis for stabilization of Z-DNA by cobalt hexaammine and magnesium cations. Biochemistry. 24:237–240. [DOI] [PubMed] [Google Scholar]
- Guszczynski, T., and T. D. Copeland. 1998. A binding shift assay for the zinc-bound and zinc-free HIV-1 nucleocapsid protein by capillary electrophoresis. Anal. Biochem. 260:212–217. [DOI] [PubMed] [Google Scholar]
- Hamelberg, D., L. D. Williams, and W. D. Wilson. 2001. Influence of the dynamic positions of cations on the structure of the DNA minor groove: sequence-dependent effects. J. Am. Chem. Soc. 123:7745–7755. [DOI] [PubMed] [Google Scholar]
- Hamelberg, D., L. McFail-Isom, L. D. Williams, and W. D. Wilson. 2000. Flexible structure of DNA: ion dependence of minor-groove structure and dynamics. J. Am. Chem. Soc. 122:10513–10520. [Google Scholar]
- Howerton, S. B., C. C. Sines, D. VanDerveer, and L. D. Williams. 2001. Locating monovalent cations in the grooves of B-DNA. Biochemistry. 40:10023–10031. [DOI] [PubMed] [Google Scholar]
- Hud, N. V., and J. Feigon. 1997. Localization of divalent metal ions in the minor groove of DNA A-tracts. J. Am. Chem. Soc. 119:5756–5757. [Google Scholar]
- Hud, N. V., and M. Polak. 2001. DNA-cation interactions: the major and minor grooves are flexible ionophores. Curr. Opin. Struct. Biol. 11:293–301. [DOI] [PubMed] [Google Scholar]
- Izatt, R. E., J. J. Christensen, and J. H. Ryting. 1971. Site and thermodynamic quantities associated with proton and metal ion interaction with ribonucleic acid, deoxyribonucleic acid, and their constituent bases, nucleosides, and nucleotides. Chem. Rev. 71:439–481. [DOI] [PubMed] [Google Scholar]
- Klotz, M. I. 1982. Numbers of receptor sites from Scatchard graphs: facts and fantasies. Science. 217:1247–1249. [DOI] [PubMed] [Google Scholar]
- Klotz, M. I., and L. D. Hunston. 1971. Properties of graphical representations of multiple classes of binding sites. Biochemistry. 10:3065–3069. [DOI] [PubMed] [Google Scholar]
- Korolev, N., A. P. Lyubartsev, A. Rupprecht, and L. Nordenskold. 1999. Competitive binding of Mg 2+, Ca2+, Na+, and K+ ions to DNA in oriented DNA fibers: experimental and Monte Carlo simulation results. Biophys. J. 77:2736–2749. [DOI] [PMC free article] [PubMed] [Google Scholar]
- Langlais, M., H. A. Tajmir-Riahi, and R. Savoie. 1990. Raman spectroscopic study of the effects of Ca2+, Mg2+, Zn2+ and Cd2+ ions on calf-thymus DNA: binding sites and conformational changes. Biopolymers. 30:743–752. [DOI] [PubMed] [Google Scholar]
- Li, C., and L. M. Martin. 1998. A robust method for determining DNA binding constants using capillary zone electrophoresis. Anal. Biochem. 263:72–78. [DOI] [PubMed] [Google Scholar]
- Li, A. Z., H. Huang, X. Re, L. J. Qi, and K. A. Marx. 1998. A Gel electrophoresis study of the competitive effects of monovalent counterion on the extent of divalent counterions binding to DNA. Biophys. J. 74:964–973. [DOI] [PMC free article] [PubMed] [Google Scholar]
- Liu, J., L. Malinia, T. Huynh-Dinh, and J. A. Subirana. 1998. The structure of most studied DNA fragment changes under the influence of ions: a new packing of d(CGCGAATTCGCG). FEBS Lett. 438:211–214. [DOI] [PubMed] [Google Scholar]
- Liu, J., and J. A. Subirana. 1999. Structure of d(CGCGAATTCGCG) in the presence of Ca 2+ ions. J. Biol. Chem. 274:24749–24752. [DOI] [PubMed] [Google Scholar]
- Loprete, D. M., and K. A. Hartman. 1993. Conditions for the stability of the B, C, and Z structural forms of poly(dG-dC) in the presence of lithium, potassium, magnesium, calcium, and zinc cations. Biochemistry. 32:4077–4082. [DOI] [PubMed] [Google Scholar]
- McFail-Isom, L., C. C. Sines, and L. D. Williams. 1999. DNA structure: cation in charge? Curr. Opin. Struct. Biol. 9:298–304. [DOI] [PubMed] [Google Scholar]
- Minasov, G., V. Tereshko, and M. Egli. 1999. Atomic-resolution crystal structures of B-DNA reveal specific influence of divalent metal ion on conformation and packing. J. Mol. Biol. 291:83–99. [DOI] [PubMed] [Google Scholar]
- Morgan, J. E., J. W. Blankenship, and H. R. Matthews. 1986. Association constants for the interaction of double-stranded and single-stranded DNA with spermine, spermidine, putresine, diaminopropane, N1- and N8-acetylyspermidine, and magnesium: determination from analysis of broadening of thermal denaturation curves. Arch. Biochem. Biophys. 246:225–232. [DOI] [PubMed] [Google Scholar]
- Neault, J. F., and H. A. Tajmir-Riahi. 1999. Structural analysis of DNA-chlorophyll complexes by Fourier transform infrared difference spectroscopy. Biophys. J. 76:2177–2182. [DOI] [PMC free article] [PubMed] [Google Scholar]
- Prescot, B., W. Steinmetz, and G. J. Thomas Jr. 1984. Characterization of DNA structures by laser Raman spectroscopy. Biopolymers. 23:235–256. [DOI] [PubMed] [Google Scholar]
- Sines, C. C., L. McFail-Isom, S. B. Howerton, D. Van Derveer, and L. D. Williams. 2000. Cation mediate B-DNA conformational heterogeneity. J. Am. Chem. Soc. 122:11048–11056. [Google Scholar]
- Soler-Lopez, M., L. Malinina, J. Liu, T. Huynh-Dinh, and J. A. Subirana. 1999. Water and ions in a high resolution structure of B-DNA. J. Biol. Chem. 274:23683–23686. [DOI] [PubMed] [Google Scholar]
- Starikov, E. B., M. A. Semenov, V. Y. Maleev, and A. I. Gasan. 1991. Evidential study of correlated events in biochemistry: physicochemical mechanisms of nucleic acid hydration as revealed by factor analysis. Biopolymers. 31:255–273. [Google Scholar]
- Stellwagen, N. C., S. Magnusdottir, C. Gelfi, and P. G. Righetti. 2001. Preferential counterion binding to A-tract DNA oligomers. J. Mol. Biol. 305:1025–1033. [DOI] [PubMed] [Google Scholar]
- Taillandier, E., J. Liquier, and J. A. Taboury. 1985. Infrared spectral studies of DNA conformations. In Advances in Infrared and Raman Spectroscopy. R. J. H. Clark and R. E. Hester, editors. Wiley-Heyden, New York. 65–114.
- Tajmir-Riahi, H. A., J. F. Neault, and M. Naoui. 1995. Does DNA acid fixation produce left-handed Z structure? FEBS Lett. 370:105–108. [DOI] [PubMed] [Google Scholar]
- Tereshko, V., G. Minasov, and M. Egli. 1999. A hydrat-ion spine in a B-DNA minor groove. J. Am. Chem. Soc. 121:3590–3595. [Google Scholar]
- Xian, J., M. G. Harrington, and E. H. Davidson. 1996. DNA-protein binding assays from a single sea urchin egg: a high-sensitive capillary electrophoresis method. Proc. Natl. Acad. Sci. USA. 93:86–90. [DOI] [PMC free article] [PubMed] [Google Scholar]


