

Abstract
Multiple dense phases of nucleosome core particles (NCPs) were formed in controlled ionic conditions (15–160 mM monovalent salt, no divalent ions), under osmotic pressures ranging from 4.7 × 10⁵ to 2.35 × 10⁶ Pa. We present here the x-ray diffraction analysis of these phases. In the lamello-columnar phase obtained at low salt concentration (<25 mM), NCPs stack into columns that align to form bilayers, kept separated from one another by a layer of solvent. NCPs form a monoclinic lattice in the plane of the bilayer. For high salt concentration (>50 mM), NCPs order into either a two-dimensional columnar hexagonal phase or into three-dimensional orthorhombic (quasi-hexagonal) crystals. The lamellar and hexagonal (or quasi-hexagonal) organizations coexist in the intermediate salt range; their demixing requires a long time. For an applied pressure P = 4.7 105 Pa, the calculated NCPs concentration ranges from ∼280 to 320 mg/ml in the lamello-columnar phase to 495 to 585 mg/ml in the three-dimensional orthorhombic phase. These concentrations cover the concentration of the living cell.
INTRODUCTION
The eukaryotic chromatin must be highly organized to fit into the small volume of the nucleus. At the first level of organization, the nucleosome core particles (NCPs), formed by the association of 146 (or 147) bp DNA coiled around a histone octamer, is highly conserved from yeast to higher eukaryotes. These particles are linked together by linker DNA segments to form the periodic nucleosome structure. Chromatin has also to be organized in such a way that dynamical changes can occur easily to either promote or impede the transcription, replication, and recombination of DNA. Nucleosomes should therefore be able to interact with each other in different ways. Their mutual ordering may be controlled by multiple parameters. Post-translational modifications of the histones, namely along their tails, are known to be involved in the control of chromatin condensation (Eberharter and Becker, 2002). Variations of ionic conditions are also of crucial importance, at least in vitro (Widom, 1998). The organization of chromatin has been investigated by multiple methods, among which were x-ray diffraction analyses of native chromatin (Sperling and Klug, 1977; Widom and Klug, 1985; Widom et al., 1985), and intact cells and nuclei (Langmore and Paulson, 1983; Paulson and Langmore, 1983); however, no definitive answer of the chromatin structure was so far obtained. We can get useful information from the analysis of a simplified system, composed of isolated nucleosome core particles, thus forming either three-dimensional crystals or mesophases.
Let us first recall how NCPs are organized in such dense phases:
NCP prepared from native chromatin crystallize in an orthorhombic lattice with a P212121 space group (Finch et al., 1981; Richmond et al., 1984; Struck et al., 1992). The orthorhombic cell, with a = 111 Å, 198 < b < 203 Å and 110.5 < c < 111 Å, contains four NCPs. Particles organize in a pseudo-hexagonal arrangement in the plane defined by the crystallographic axes a and b. The period c corresponds to two stacked NCP along the direction normal to the plane defined by a and b. More recently, three-dimensional crystals diffracting at high resolution were obtained with reconstituted NCP (Luger et al., 1997; Harp et al., 2000; White et al., 2001; Davey et al., 2002). The length and sequence of DNA is perfectly defined as well as the sequence of the four histones forming the octamer core (coming from Xenopus in Xla-NCP, from chicken in P-NCP, and from yeast in Sce-NCP). Whatever the histone source, NCPs organize as described above in the same P212121 orthorhombic structure, with slightly smaller lattice parameters. Along the c direction, NCPs are either staggered, in Xla-NCP and P-NCP crystals, or stacked with the superhelical axes of the NCP (S) almost superimposed in Sce-NCP crystals. Small changes of the charges carried by the histones tails are enough to switch between different modes of interactions between NCPs, thus leading to the formation of either staggered or regular NCP columns along the c direction. Unfortunately, methods classically used to obtain three-dimensional crystals prevent exploring the large ranges of ionic conditions that we may expect to exist locally inside the living cell. Only ionic conditions leading to the formation of good diffracting crystals can be analyzed a posteriori. A larger range of ionic conditions was explored by using another method to obtain dense phases of NCP. Dilute solutions of particles, prepared in the presence of monovalent ions only, may be progressively concentrated, either by progressive dehydration of the solvent or by exerting an osmotic stress with polyethylene glycol (PEG). Two dense phases have been described so far: a columnar hexagonal phase formed under high salt conditions (Leforestier and Livolant, 1997; Livolant and Leforestier, 2000) and a lamello-columnar phase in the low salt range (Leforestier et al., 2001). The columnar phase, obtained for salt concentrations ranging from 110 to 300 mM, grows in the shape of elongated sixfold symmetry germs, with twisted configurations. Columns formed by NCPs stacked on top of each other can be seen on freeze-fracture replicas. They align in parallel to form a hexagonal lattice. The lamello-columnar phase was found for monovalent salt concentrations ranging from 3.5 to 35 mM, in the presence of 19–22% PEG 20000. The lamellar structure was understood from the electron microscopy observation of cryosections of vitrified samples. The lamellae are bilayers, formed by columns aligned in parallel. A layer of solvent, which thickness depends on the exerted pressure, keep them separated from one another. Along the columns, NCP are stacked on top of each other with their dyad axis normal to the plane of the lamella. The side of the NCP carrying the free ends of the DNA fragment (front side) is facing the solvent.
In the present study, using x-ray diffraction experiments, we explored systematically the salt range between 15 and 160 mM monovalent salt concentration and the pressure range between 4.7 105 and 2.35 106 Pa. Using NCP prepared from native chromatin, we found the lamello-columnar phase below 25 mM salt, a two-dimensional hexagonal phase and a three-dimensional orthorhombic quasi-hexagonal phase above 50 mM salt. In the intermediate salt range, the two phases coexist. Their demixing requires several months. We do not intend here to give a complete view of the phase diagram. It will be presented elsewhere. Our goal is to describe in detail these ordered phases and the parameters which control their formation and their three-dimensional long-range ordering.
MATERIALS AND METHODS
Preparation of nucleosome core particles
The nucleosome core particles (NCPs) were prepared from native calf thymus chromatin following the procedure described in Mangenot et al. (2002). All samples were prepared from a single batch. The core histone integrity and the absence of contaminating di- and oligo-nucleosomes were carefully checked by polyacrylamide gel electrophoresis. After purification by gel chromatography (Sephacryl S300 HR column), the solutions were extensively dialyzed against 10 mM Tris and 1mM EDTA (TE) buffer (pH 7.6) at a concentration of 1 mg/ml. The DNA associated to the protein core displayed a length distribution with a mean value of 155 bp and a half-width of 7 bp at half-height.
Sample preparation
The 1 mg/ml NCP solution was further dialyzed against various solutions: 10 mM TE pH 7.6 supplemented with 5, 15, 27, 40, 90, or 150 mM NaCl to reach final 15, 25, 37, 50, 100, and 160 mM added monovalent salt concentration Cs. The Cs values take into account Tris+ and Na+ cations. Each solution was then concentrated by ultra filtration under nitrogen pressure through a nitrocellulose membrane up to a concentration CiNCP of the order of 205–260 mg/ml. Higher concentrations were reached by the addition of a solution of a neutral stressing polymer (polyethylene glycol, PEG, Fluka MW 20000, at a concentration CiPEG expressed in % (w/v)). The added PEG solution was always prepared in the same buffer and with the same salt concentration as the NCP solution to which it was added. About 15–20 μl of nucleosome solution and 200 μl of polymer solution were successively added into quartz capillaries ∼1.5 mm in diameter. After equilibration for more than 4 weeks at room temperature the NCP condensed phase (final concentration CfNCP ≫ CiNCP) was found separated from the supernatant polyethylene glycol for PEG concentrations lower than 35%. At higher PEG concentrations the meniscus between the two solutions was poorly defined. The final PEG concentration CfPEG was very slightly lower than CiPEG, so that the difference was neglected. The osmotic pressure imposed by the polymer was calculated from the PEG concentration using the data given in http://dir.nichd.nih.gov/Lpsb/docs/osmdata/osmdata.html. The resulting applied pressures were equal to 4.7 × 10⁵, 7.6 × 10⁵, 1 × 10⁶, 1.3 × 10⁶, and 2.35 × 10⁶ Pa, corresponding to PEG concentrations of 19, 23, 25.5, 28, and 35%, respectively.
X-ray diffraction
Most of the x-ray diffraction measurements were carried out on the small angle x-ray scattering instrument D24 at LURE (Laboratoire pour l'Utilisation du Rayonnement Electromagnétique, Orsay, France) using the radiation emitted by a bending magnet of the storage ring DCI. The wavelength λ was selected by a bent Ge (111) monochromator and adjusted to 1.488 Å (Ni K-absorption edge). X-ray patterns were recorded using two-dimensional image plates. The sample-to-detector distance of 2500 mm allowed to investigate the scattering vector range: 0.01 Å−1 < q < 0.25 Å−1 (where q = 4π sin θ/λ, 2θ is the scattering angle) corresponding in real space to distances between 25 and 630 Å. The instrumental resolution was Δq = 0.00145 Å−1 (full width at half-maximum, or FWHM). Some diagrams requiring a better resolution, were recorded on the small angle x-ray scattering instrument ID2 (Narayanan et al., 2001) at ESRF (European Synchrotron Radiation Facility, Grenoble, France). A channel-cut Si (111) monochromator selected the wavelength λ = 0.989 Å and the sample-to-detector distance was fixed at 4730 mm providing an instrumental resolution Δq of 0.0008 Å−1. During all the experiments performed on D24, temperature was maintained at 20°C. Because of the very high intensity of the x-ray beam on ID2, 10-ms exposures were recorded every 10 s. They provided diffraction patterns of high quality without perturbing the temperature of the capillary placed in a thermostated vessel (T = 20°C).
Magnetic ordering of the samples
For PEG concentration higher than 19% (w/v) NCPs get organized in dense phases with a long-range order along privileged directions. Within a macroscopically nonoriented sample these directions are only defined locally so that x-ray diffraction yields powder diagrams. The structure of a dense crystalline phase can theoretically be retrieved from such diagrams. However, this determination can be difficult if only a small number of Bragg reflections are available, or in case of a liquid crystalline phase which is not perfectly organized in all three dimensions. To make the analysis of diffraction diagrams easier, we tried to orient the samples in a magnetic field. Indeed, it has been shown (Brandes and Kearns, 1986) that DNA molecules will orient with the helix axis normal to the field. In NCPs, DNA is wrapped around the histone octamer to form a helix around the cylinder axis (S-axis) of the NCP. A nucleosome core particle placed in a magnetic field  should therefore orient with the S-axis parallel to
  . Such an alignment was in fact observed under some ionic conditions, which are specified below, when the sample-containing capillary was placed in a magnetic field higher than 7 Teslas immediately after addition of the PEG solution to the NCP solution and kept during the whole formation of the dense phase. The alignment is kept after removal of the magnetic field. No orientation was observed when the magnetic field was applied after the formation of the dense phase.
Evaluation of NCP concentration
In dense phases the final NCP concentration is estimated following the indexation of the diffraction diagram and using the relationship:
 |
where Vc is the volume of the unit cell, nc the number of NCP per unit cell, and MNCP the NCP molar mass taken equal to 211,300 g·mol−1 (molar mass of the histone octamer: 109,000; molar mass of 155 bp DNA: 102,300).
RESULTS
Observations at low salt concentration (≤25 mM)
We describe here the NCP organization for the lowest salt concentrations (≤25 mM) and for osmotic pressures larger or equal to 4.7 × 10⁵ Pa. Under these conditions, electron micrographs show a lamellar organization of column bilayers with a mean distance between bilayers ranging from 270 to 420 Å (Leforestier et al., 2001). X-ray measurements were performed after 1 month equilibration of the sample. Controls performed 6 months later did not show any significant evolution of the diffraction diagrams over this period. The lamellar phase seems therefore to reach equilibrium fairly rapidly, within a month. Fig. 1 shows a diffraction diagram characteristic of this lamellar phase of bilayers obtained for an added salt concentration of 25 mM and for an osmotic pressure of 4.7 105 Pa (PEG 19%). The initial NCP concentration was 205 mg/ml. This is a powder diagram, inasmuch as all attempts at orienting the sample in a magnetic field failed here. Also shown in the figure is the scattered intensity I(q) integrated over a 30° sector centered on the vertical axis. This diagram allowed us to describe the lamellar structure and the organization of NCP in the layer.
FIGURE 1.
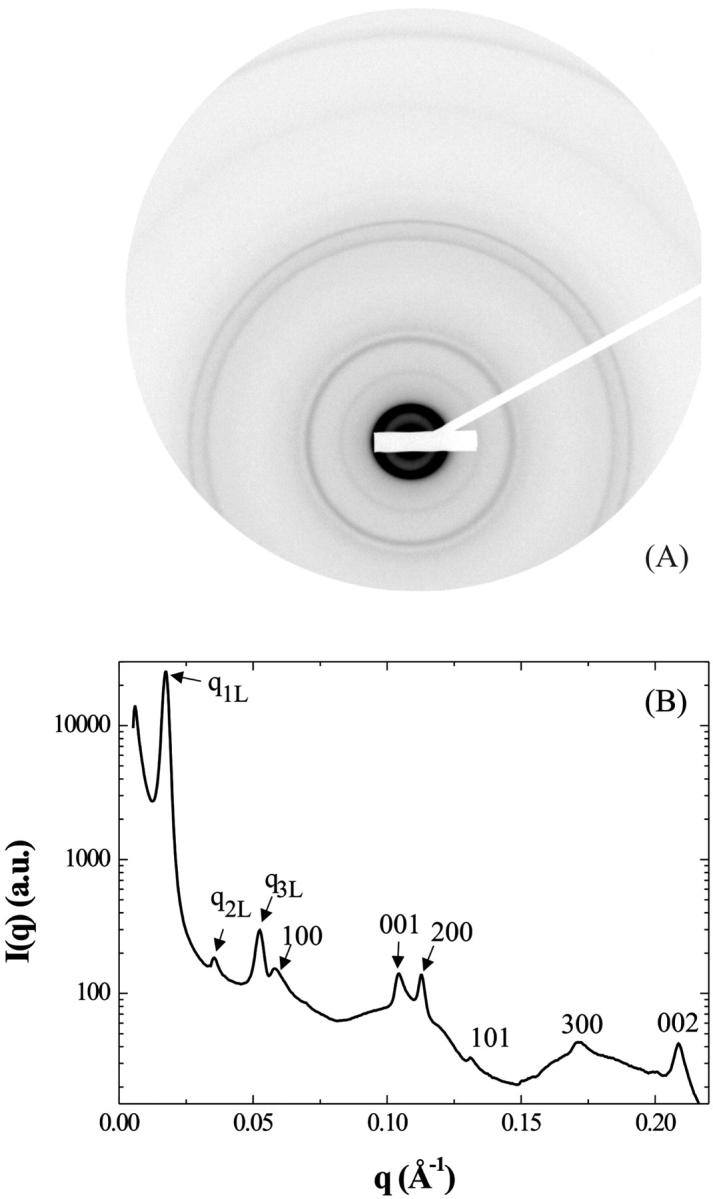
(A) Diffraction pattern obtained on the D24 beam line at LURE, for an added salt concentration of 25 mM and an osmotic pressure of 4.7 × 10⁵ Pa (PEG 19%). The initial NCP concentration was 205 mg/ml. The pattern was recorded 1 month after sample preparation. (B) Profile of the integrated intensity I(q) over a 30° sector centered on the vertical.
Lamellar phase organization
In the small-angle range, a very intense diffraction peak is observed at q1L = 0.01745 Å−1 with two much weaker (less than 1% of the first peak intensity) peaks located at q2L = 2q1L and q3L = 3q1L. These three peaks sign the presence of a lamellar organization with a repetition distance dL of 360 Å. The periodicity dL is not perfectly constant over the whole sample, with a slightly smaller value (∼350 Å) close to the interface between the NCP dense phase and the PEG. The three diffraction peaks q1L, q2L, and q3L display, with respect to the experimental resolution (FWHM), a broadening equal to 0.0007 Å−1, 0.0014 Å−1, and 0.002 Å−1, respectively. This broadening may have two origins: first, the variation of the periodicity dL through the sample is expected to create a peak broadening increasing with the diffraction order; second, the finite distance over which the lamellar order is preserved also causes a broadening, but it is the same for all diffraction peaks (see Appendix). Considering the observed values, this second broadening is necessarily lower than 0.0007 Å−1. Consequently, in this sample, the lamellar organization, with a periodicity of 360 Å ± 7 Å, extends over at least 1.5 μm, which corresponds to ∼40 bilayers.
Organization within a layer
The other diffraction peaks, observed at q-values larger than 0.055 Å−1, reflect the organization of NCPs within each layer of a bilayer. These peaks can be indexed on a two-dimensional monoclinic lattice with parameters a = 114.8 Å, c = 62.2 Å, and an angle β between the two directions of the lattice of ∼104°. The indexation is given in Fig. 1 B. The 001 and 002 peaks show that NCPs are regularly piled up along the columns with a distance between particles of 62.2 Å. In the direction normal to the column, a periodicity is also observed through the diffraction peaks 100, 200, and 300. The intercolumn distance is given by the expression a sin β, corresponding to a value of 111.4 Å. Finally, the 101 peak reflects the existence of a correlation between the packing order of NCPs along a column and the intercolumnar organization. However, the orientation of the NCP S-axis with respect to the direction of the columns cannot be derived from our data. Among others, two possible orientations are schematically represented in Fig. 2. In the first case (Fig. 2 A), NCPs pack with their S-axis parallel to the column axis (crystallographic axis c) as observed in NCP crystals (Luger et al., 1997; Harp et al., 2000; White et al., 2001; Davey et al., 2002). The NCP S-axis could also be tilted by β-90° = 14° with respect to the column axis (Fig. 2 B) In this case, particles are in register from one column to the next. X-ray diffraction patterns do not discriminate between these two possibilities. However, the second case appears to be compatible with electron micrographs showing a tilt of NCPs with respect of the column axis and lining up from one column to the next (not shown).
FIGURE 2.

Two possible orientations of NCPs in the bilayer plane, compatible with a monoclinic order with parameters a = 114.8 Å, c = 62.2 Å, and β = 104°. (A) NCPs pile on top of one another with their S-axis parallel to the column axis. (B) NCPs are tilted in the column and their S-axis makes an angle of 14° with respect to the column axis.
No other diffraction peak is observed, suggesting that there is no correlation between the organization of NCPs in two adjacent bilayers, in agreement with electron microscopy observations. In contrast, our results yield no information about possible correlations between NCPs belonging to the two layers of a given bilayer.
It can be seen that the narrow diffraction peaks described above are superimposed on much broader scattering maxima at ∼0.06 Å−1, 0.11 Å−1, and 0.17 Å−1 (Fig. 1). These maxima reflect an intra- and intercolumnar disorder, as explained further down, in the section on the 37-mM salt concentration. They could mirror the bilayer curvature observed in microscopy, but could also be due to the existence of disordered regions within the sample.
Effect of osmotic pressure
The effect of increasing the osmotic pressure on the parameters of the lamellar phase has been studied for an added salt concentration of 15 mM, varying the pressure from 4.7 × 10⁵ to 2.35 × 10⁶ Pa (which corresponds to PEG concentrations ranging from 19 to 35% (w/v)). The initial NCP concentration was 256 mg/ml. The sample obtained with 19% PEG yielded very different diffraction patterns when illuminating different areas with the x-ray beam. These patterns were all different from that previously described for the same PEG concentration (19%) but under different salt and initial NCP concentrations (Cs = 25 mM; CiNCP = 205 mg/ml). This sample is certainly multiphasic and the resulting diffraction patterns have not been interpreted. In contrast, above 23% PEG, the diffraction patterns are very similar to that described above, characteristic of a lamellar phase of bilayers with a monoclinic organization within the layers. The variation of the parameters of the lamellar phase as a function of the osmotic pressure of the solution is presented in Table 1. All three parameters a, c, and dL decrease by 4–5% with pressure increase, while the width of the diffraction peaks increases, indicating a progressive deterioration of long-distance ordering. The origin of this behavior remains unclear: is it the intrinsic behavior of this dense phase while increasing the NCP concentration, or is it the consequence of the sample preparation method? Indeed, the NCP solution is in direct contact with PEG within the capillary used for x-ray measurements. The interactions between particles within such a system can be very complex when the PEG concentration increases.
TABLE 1.
| Osmotic pressure | PEG 23% | PEG 25.5% | PEG 35% |
| 7.6 × 10⁵ Pa | 1.00 × 10⁶ Pa | 2.35 × 10⁶ Pa | |
| Parameters | a = 111.6 Å | a = 110.9 Å | a = 107.6 Å |
| c = 62.0 Å | c = 61.4 Å | c = 58.9 Å | |
| β = 104° | β = 104° | β = 104° | |
| dL = 376.5 Å | dL = 374 Å | dL = 358 Å | |
| Concentration CfNCP | 278 mg/ml | 284 mg/ml | 319 mg/ml |
Variation of the parameters of the lamellar phase as a function of osmotic pressure, for an added salt concentration of 15 mM. The equilibration time of the samples was 1 month. The initial NCP concentration was 256 mg/ml.
Observations at salt concentration ≥100 mM
The samples prepared at salt concentrations higher or equal to 100 mM yielded extremely complex diffraction patterns with a large number of diffraction rings, indicative of the existence of a crystalline phase. A diffraction pattern recorded on the ESRF ID2 beam line is presented in Fig. 3. The initial NCP concentration was 260 mg/ml, the osmotic pressure 4.7 × 10⁵ Pa (19% PEG), and the salt concentration was 160 mM. The sample was studied after 4 months equilibration. Furthermore, during the formation of the phase, the sample had been submitted to a 10-T magnetic field during 15 days, which led to a partial orientation. On the pattern in Fig. 3, the field orientation is close to vertical.
FIGURE 3.

(A) Diffraction pattern recorded on the ESRF ID2 beam line at an added salt concentration of 160 mM under an osmotic pressure of 4.7 × 10⁵ Pa (PEG 19%). This sample had been partially oriented in a 10-T magnetic field during 15 days. The initial NCP concentration before osmotic stress was applied was equal to 260 mg/ml. The pattern was recorded 4 months after capillary preparation. (B) Profile of the integrated intensity I(q) over 360°. The Bragg reflections noted A to M could correspond to a superstructure along c-axis of a periodicity close to 6c. They can be indexed as: A (1, 1, 2δ), B (1, 1, 3δ), C (0, 2, 1 + 3δ), D (1, 3, 3δ), E (0, 0, 2 + δ), F (0, 0, 2 + 2δ), G (0, 4, 3δ) and (2, 2, 3δ), H (0, 0, 2 + 3δ), I (2, 1, 1 + 3δ), J (3, 1, 3δ), K (3, 3, 1 + 3δ), L (0, 0, 4 + δ), M (0, 0, 4 + 2δ), where δ is close to 1/6.
Examination of the diffraction pattern shows that two sets of arcs are localized along the meridian and the equator respectively. They reflect the longitudinal order of NCPs along their axis and the transversal order between NCPs in the plane normal to their axis. A third series of diffraction arcs can also be identified which are localized off the meridian and equator axes. These extra rings reveal the existence of a correlation between the longitudinal and transversal orders. We are thus dealing here with a three-dimensional order, as observed in a crystal. The meridional and equatorial reflections have the resolution width, i.e., Δq = 8 × 10⁻⁴ Å−1 (full width at half-maximum, or FWHM). This means that the long distance order along the NCP axis and in the normal plane extends over more than 3 μm (see Appendix). The off-axes reflections are slightly broader than the instrumental resolution with a FWHM of 26 × 10−4 Å−1. The longitudinal and transversal orders are thus correlated over more than 0.7 μm.
Let us now index the diffraction peaks. Along the meridian, two very intense peaks are observed at q1h= 0.1080 Å−1 and q2h = 2q1h= 0.2160 Å−1. They correspond to the piling of nucleosomes along their axis, practically parallel to the magnetic field, with an internucleosome distance of 58.16 Å. Regarding the equatorial reflections, they are distributed in two groups whose average positions are in ratios close to 1,  ,
,  , and
, and  , suggesting a quasi-hexagonal organization in the plane normal to the NCP axis.
Most intense diffraction peaks can be indexed within a base-centered orthorhombic lattice with the crystallographic c-axis approximately parallel to the S-axis of the particles. Of course, the space group cannot be determined from our data. However, the space group P212121 of NCP crystals (Luger et al., 1997; Harp et al., 2000; White et al., 2001; Davey et al., 2002) appears to be compatible with the most intense Bragg reflections in Fig. 3. The corresponding orthorhombic unit cell contains four NCPs with parameters a = 114.1 ± 0.2 Å, b = 201.1 ± 0.2 Å, and c = 116.3 ± 0.2 Å (the choice of a-, b-, and c-axes is that of Luger et al., 1997). These parameters yield a NCP concentration of 526 mg/ml. The value of b is very close to a  (it differs by only 1.5%). NCPs are organized according to a quasi-hexagonal order in the plane normal to the S-axis.
The agreement between the theoretical and experimental positions of the peaks indexed using the orthorhombic lattice is excellent. However, some reflections are difficult to index. They seem to originate from a superstructure along the c-axis, of periodicity close to 6c (= 6.3c) which would be incommensurate. Those reflections could also be due to a slight distortion of the orthorhombic unit cell. The orientation of the pattern in Fig. 3 is not sufficient to answer the question and we never succeeded in producing better-oriented samples.
Effect of osmotic pressure
The evolution of the unit cell parameters of the orthorhombic lattice was studied for PEG concentrations ranging from 19 to 28%, which corresponds to a pressure range comprised between 4.7 × 10⁵ and 1.3 × 10⁶ Pa. Samples were prepared at the same salt concentration Cs = 160 mM 2 months before diffraction analysis, and were not oriented under magnetic field. The initial NCP concentration was 260 mg/ml. The diffraction patterns, recorded on the ESRF ID2 beam line for the two extreme pressures, are presented on Fig. 4. All diffraction patterns can be indexed using the previous orthorhombic lattice. The reduction of the parameters a and b is practically the same (4.8% and 4.9% respectively); it is slightly higher for c (5.6%) (Table 2).
FIGURE 4.

Diffraction patterns recorded on the ESRF ID2 beam line for an added salt concentration of 160 mM under an applied pressure equal to 4.7 × 10⁵ Pa (PEG 19%) (A) and 1.3 × 10⁶ Pa (PEG 28%) (B). The initial NCP concentration before osmotic stress was applied was equal to 260 mg/ml. The pattern was recorded 2 months after capillary preparation.
TABLE 2.
| Osmotic pressure | PEG 19% 4.7 × 10⁵ Pa | PEG 28% 1.3 × 10⁶ Pa |
| Parameters | a = 115.4 ± 0.2 Å | a = 110.1 ± 0.4 Å |
| b = 203.6 ± 0.2 Å | b = 194.0 ± 0.4 Å | |
| c = 119.0 ± 0.2 Å | c = 112.7 ± 0.2 Å | |
| Concentration CfNCP | 502 mg/ml | 583 mg/ml |
Evolution of the parameters of the orthorhombic phase with the osmotic pressure of the solution for an added salt concentration of 160 mM. The samples were studied by x-ray diffraction 2 months after preparation. The initial NCP concentration was 260 mg/ml.
The volume of the unit-cell appears to decrease with no apparent change in structure. In contrast, the position of some diffraction peaks of the superstructure along the c-axis changes considerably when the pressure increases, suggesting a change in this superstructure. Finally, as observed in the case of low salt concentrations (≤25 mM), the increase in osmotic pressure causes a slight broadening of the diffraction peaks with respect to the instrumental resolution. The long distance order between particles is thus preserved over shorter distances at higher osmotic pressure.
Above 28% PEG the broadening is large enough to induce a merging of neighboring diffraction peaks. Therefore, we can no longer determine the structure of the phase—whether it is three-dimensional orthorhombic, three-dimensional hexagonal, or two-dimensional hexagonal.
Effect of equilibration time
We have observed that the unit cell parameters vary with time over periods of months. This evolution is reported in Table 3 for samples prepared at an osmotic pressure of 4.7 × 10⁵ Pa and a salt concentration of 160 mM. In contrast, the orthorhombic crystal structure remains unchanged over time. Between 1 and 4 months equilibration, the particle concentration in the sample increases by ∼6%. We checked that this variation was not due to evaporation. This would suggest that the sample is not yet at equilibrium after several months.
TABLE 3.
| Equilibration time | 1 month | 2 months | 4 months |
| Parameters | a = 116.3 ± 0.4 Å | a = 115.4 ± 0.2 Å | a = 114.1 ± 0.2 Å |
| b = 204.3 ± 0.4 Å | b = 203.6 ± 0.2 Å | b = 201.1 ± 0.2 Å | |
| c = 119.4 ± 0.3 Å | c = 119.0 ± 0.2 Å | c = 116.3 ± 0.2 Å | |
| Concentration | 495 mg/ml | 502 mg/ml | 526 mg/ml |
Parameters of the orthorhombic phase obtained for an osmotic pressure of 4.7 × 10⁵ Pa and an added salt concentration of 160 mM, after various equilibration times between sample preparation and x-ray measurements. The same sample has been studied after 1 and 4 months, while another sample has been studied after 2 months. The initial NCP concentration was 260 mg/ml.
Comment on the use of a magnetic field
The sample, which yielded the diffraction pattern shown in Fig. 3, had been placed in the magnetic field at the same time as the PEG solution was introduced into the capillary, before the dense phase was established. In this sample NCPs got progressively organized in a three-dimensions-ordered phase under magnetic field. This raises the question of whether the structure of the dense phase thus obtained depends on the presence of the magnetic field. Two aliquots of the same NCP solution (CiNCP = 260 mg/ml) were prepared at the same time and under the same conditions, only one being placed in the 10 Teslas magnetic field during 15 days. Samples were analyzed after 1 month equilibration. The x-ray patterns are very similar, and only the weakest Bragg reflections from the oriented pattern (obtained with the sample placed in the magnetic field) are not detectable on the isotropic pattern. This is a result of the absence of orientation that entails a reduction of intensity with the consequence that the weakest reflections cannot be extracted from the background any more. In both cases, the pattern analysis leads to the orthorhombic structure already determined. We can therefore conclude that the magnetic field does not modify the crystalline structure of NCP dense phases. It is subsequently most unlikely that the structure of an isolated core particle could be significantly altered by exposure to the magnetic field under these crowded conditions.
Observations for intermediate salt concentrations
50-mM salt concentration
Experiments have been performed with two different initial NCP concentrations: CiNCP = 225 mg/ml, and CiNCP = 260 mg/ml.
Starting from an initial NCP concentration of 225 mg/ml, we obtained the pattern and integrated intensity profile I(q) shown on Fig. 5 under a PEG osmotic pressure of 4.7 × 10⁵ Pa. The pattern was recorded after 1 month equilibration on a nonoriented sample. The diffraction rings can be separated in two categories:
- Five diffraction peaks have the width of the instrumental resolution Δq = 0.00145 Å−1 (FWHM). These peaks are located at q-values in the ratios 1,
 ,
,  ,
,  , and
, and  , which are the signature of a two-dimensional hexagonal order. The value of the parameter aH of the hexagonal order is directly derived from the position of the first peak q1 = 0.0625 Å−1:
Two diffraction peaks located at q1h = 0.1047 Å−1 and q2h = 0.2094 Å−1 display a slight broadening with respect to the instrumental resolution. It is interesting to note that 2π/q1h = 60 Å is close to the height of a nucleosome core particle along the S-axis.
FIGURE 5.

(A) Diffraction pattern obtained on the D24 beam line at LURE, for an added salt concentration of 50 mM and an osmotic pressure of 4.7 × 10⁵ Pa (PEG 19%). The initial NCP concentration before osmotic stress was applied was equal to 225 mg/ml. The pattern was recorded 1 month after sample preparation. (B) Profile of the integrated intensity I(q) over a 30° sector centered on the vertical. The peaks labeled 1,  ,
,  ,
,  , and
, and  are the signature of a two-dimensional hexagonal order. The peaks labeled q1h and q2h correspond to the distance between two adjacent NCPs along a column.
This pattern can be interpreted as follows:
In this phase, NCPs are organized in columns with a periodicity h of 60 Å along the columns. These columns are in turn organized according to a hexagonal order with a parameter aH = 116.1 Å. No other diffraction peak is detected on the pattern, suggesting that the order is hexagonal along two dimensions with no long-distance correlation between the organization of columns in the plane normal to their axis and the longitudinal order of NCPs along the column.
It is difficult to obtain information on the position of NCPs within a column in the absence of an oriented diffraction pattern. However, some assumptions can be made, concerning for instance the periodic organization of NCPs along the columns using the analysis of the width of the diffraction peaks located at q1h and q2h, which reflect this longitudinal packing. The broadening of these peaks with respect to the instrumental resolution is 0.0050 Å−1 and 0.0040 Å−1, respectively. It should be mentioned that in the case of the peak at q1h this is only an approximate value since this peak is very close to the one located at  from the two-dimensional hexagonal order. As explained in the Appendix, these broadenings are due in part to the absence of orientation which produces a broadening of 0.0042 Å−1 for the peak at q1h and a broadening of 0.0024 Å−1 for the second one at q2h. Taking into account this contribution from disorientation, the residual broadening is very weak, of the order of 0.0008 Å−1 and 0.0016 Å−1, respectively. Considering the positional disorder of NCPs along the columns (see Appendix), we assume that NCPs are regularly distributed along the columns with a periodicity of 60 Å, and a standard deviation of the distribution of inter-NCP distances along the columns smaller than 1%. In these conditions, NCPs are very unlikely to be able to rotate freely around their S-axis within a column. However, a definitive answer to that question would require highly oriented samples.
To determine whether a two-dimensional hexagonal order could gradually evolve toward a three-dimensional hexagonal or quasi-hexagonal phase, the same sample was studied again after 7 and 17 months equilibration. The resulting patterns are both qualitatively similar to that presented in Fig. 5. Whatever the equilibration time, this sample displays a hexagonal columnar two-dimensional organization, the parameters of which are summarized in Table 4. Even after 7 months, the sample parameters are not stabilized. Their evolution is not negligible, since the concentration increases by more than 40 mg/ml, i.e., ∼9% between 7 and 17 months equilibration.
TABLE 4.
| Equilibration time | 1 month | 7 months | 17 months |
| Parameters | ah = 116.1 Å | ah = 113.3 Å | ah =110.0 Å |
| h = 60.0 Å | h = 59.4 Å | h = 57.67 Å | |
| Concentration | 501 mg/ml | 531 mg/ml | 580 mg/ml |
Parameters of the columnar hexagonal phase obtained for an added salt concentration of 50 mM and for an osmotic pressure of 4.7 105 Pa, after various equilibration times between sample preparation and x-ray measurements. This sample was studied after 1, 7, and 17 months following preparation.
A second series of experiments was performed using an initial NCP concentration (CiNCP = 260 mg/ml) identical to the one used at high salt (100 and 160 mM). In this series, osmotic pressure was systematically varied from 4.7 × 10⁵ to 2.35 × 10⁶ Pa (19 to 35% PEG). Some samples were oriented in a magnetic field, and all samples were studied after 2 months equilibration. The most striking result of this study is that the hexagonal columnar two-dimensional phase described above was never observed. All diffraction patterns exhibit a three-dimensional quasi-hexagonal crystalline organization, identical to the one observed at high salt. An example is shown in Fig. 6 A, obtained with an oriented sample under the osmotic pressure of a 23% PEG solution. The variation of the crystalline parameters with the increase in osmotic pressure is practically identical to the one described above at an added salt concentration of 160 mM. Similarly, the increase in osmotic pressure causes a marked degradation of the order within the sample with increasingly broader diffraction peaks (see Fig. 6 B). For osmotic pressure higher than 2.35 × 10⁶ Pa (35% PEG), the three-dimensional organization is considerably degraded: all diffraction peaks related to the correlation between longitudinal and transversal orders have vanished. This sample corresponds to a particularly high particle concentration, of the order of 610 mg/ml after 2 months equilibration. Finally, the magnetic field does not seem to influence in any significant way the NCP organization at 50 mM salt, as previously observed at Cs = 160 mM.
FIGURE 6.

Diffraction patterns recorded on the D24 beam line at LURE for an added salt concentration of 50 mM and PEG solutions at (A) 23% and (B) 35%. The initial NCP concentration before osmotic stress was 260 mg/ml. The pattern was recorded 2 months after capillary preparation. The sample with a PEG concentration of 23% had been partially oriented in a 7-T magnetic field during a month.
37-mM salt concentration
Fig. 7 shows the diffraction patterns obtained at 37-mM salt concentration for an osmotic pressure of 4.7 × 10⁵ Pa after 1 month (A) and 7 months (B) equilibration. The initial particle concentration was 224 mg/ml. The intensities I(q) derived by integration over a 30° sector around the vertical axis are shown in Fig. 7 C. The two patterns display very different features.
FIGURE 7.

Diffraction pattern obtained on the D24 beam line at LURE, for an added salt concentration of 37 mM under an osmotic pressure of 4.7 × 10⁵ Pa (PEG 19%). The initial NCP concentration before osmotic stress was 224 mg/ml. The sample has been analyzed (A) 1 month and (B) 7 months after sample preparation. (C) Profile of the integrated intensity I(q) over the top 30° sector centered on the vertical.
The pattern obtained after 1 month equilibration is completely different from all the patterns described up to now as it exhibits diffraction rings much broader than the instrumental resolution. These rings are centered around q = 0.0594 Å−1, 0.1102 Å−1, and 0.1715 Å−1, and their width (FWHM) is 0.0100 Å−1, 0.0096 Å−1, and 0.0171 Å−1, respectively (to be compared with the instrumental resolution of 0.00145 Å−1 in this experiment). It should be recalled at that point that the scattered intensity I(q) can be expressed by the following relationship,
 |
where S(q) is the interference function of the system or structure factor and F(q) is the form factor of the scattering objects. The first point to elucidate in the analysis of the diffraction pattern is the nature of the scattering units: are they isolated NCPs or columns of NCPs? In an attempt at answering this question, the form factor F(q) of an isolated NCP was calculated from the crystal coordinates (pdb file 1eqz) using the program CRYSOL that takes into account the contribution from the hydration layer around the particle (Svergun et al., 1995). The structure factor was calculated using the expression developed for cylindrical objects with a very short-range local hexagonal order (Busson and Doucet, 2000). It was not possible to simulate by this approach the scattering profile shown in Fig. 7 C, and more specifically to account for the peak at 0.1102 Å−1. The scattering objects are therefore unlikely to be isolated NCPs, suggesting that under these conditions NCPs also pile up into columns as observed in all other dense phases. The first scattering peak at 0.0594 Å−1 corresponds to the average distance between columns. The second peak at 0.1102 Å−1 corresponds to the distance of ∼60 Å between two adjacent NCPs in a column and to the first subsidiary maximum of the column form factor, while the third peak at 0.1715 Å−1 can be related to the second subsidiary maximum.
In summary, the pattern obtained after 1 month equilibration is compatible with a columnar organization of NCPs with no long range order between columns (broad first scattering peak) and with NCPs being fairly irregularly piled along a column (broad second scattering peak). Since the sample was not oriented in a magnetic field, we are not in a position to distinguish between a liquidlike nematic order and a short-range hexagonal order for the column organization. Subsequently, we can only give a crude approximation of the average distance 〈a〉 between columns, since the relationship between this distance and the position q1 of the first scattering peak depends on the organization: 〈a〉 = 1.23 × 2π/q1 = 130 Å in the case of a liquid (Guinier, 1956), 〈a〉 = 1.117 × 2π/q1 = 118 Å for a nematic phase (De Vries, 1970), and  Å in the case of a local columnar hexagonal order.
The analysis of the same sample after 7 months equilibration reveals an altogether different organization. In contrast with the previous pattern, very narrow diffraction peaks are observed, indicating the existence of a long-range order. The simplest interpretation of this pattern is in terms of a biphasic sample. The first peak in the pattern is located at q1L = 0.01816 Å−1, corresponding to a distance of 346 Å, the distance between bilayers within the lamellar phase. As the intensity of this peak is rather weak, it is not surprising that the second and third order as well as the peaks related to NCP order within a bilayer are not detected. Indeed, we have seen in the study of the low salt lamellar phase that all these peaks have an intensity lower than 0.6% of that of the first-order peak of the lamellar periodicity. At higher q-values, diffraction peaks are observed at positions in ratios 1,  ,
,  ,
,  , and
, and  , characteristic of a two-dimensional hexagonal order, the first one in the series being at q = 0.06222 Å−1. A peak displaying a slight broadening with respect to the instrumental resolution is observed at q2h = 0.2097 Å−1, a value characteristic of the second order of the periodicity h of NCP piling along the columns. These peaks are identical (same position, similar intensity ratios) to those observed in the columnar hexagonal phase, with a parameter between columns of 116.6 ± 0.2 Å and a distance between NCPs along the columns of 59.9 ± 0.3 Å. The sample therefore appears to be essentially biphasic, a lamellar phase of bilayers coexisting with a columnar hexagonal phase. However, the examination of the scattering profiles in Fig. 7 C shows that part of the sample could still be disordered, since the three broad peaks characteristic of the disordered phase seem to coexist (with a weak intensity) with the narrow diffraction peaks.
In conclusion, after 1 month equilibration, the sample obtained at a salt concentration of 37 mM, an initial NCP concentration of 224 mg/ml, and an osmotic pressure of 4.7 105 Pa displays a strongly disordered phase out of equilibrium. Several months later, this sample has undergone demixing and exhibits two well-ordered phases with different concentrations: a lamellar phase and a columnar hexagonal phase.
DISCUSSION
The organization of highly concentrated solutions of NCP was systematically studied as a function of the added monovalent salt concentration (15 mM ≤ Cs ≤ 160 mM) and for osmotic pressure ranging from 4.7 × 10⁵ to 2.35 × 10⁵ Pa. A lamellar phase is observed at low salt concentrations (Cs ≤ 25 mM), with a particle concentration ∼300 mg/ml, whereas a hexagonal phase is formed at high salt concentrations (Cs ≥ 50 mM), with a particle concentration ∼500 mg/ml. At intermediate salt concentration (Cs ≈ 37 mM), we observe the coexistence of these two phases. These observations are summarized in Fig. 8.
FIGURE 8.

Various organizations observed in highly concentrated solutions of NCP as a function of the added monovalent salt concentration, of the osmotic pressure, and of the initial particle concentration before applying the osmotic stress.
The time required to reach the equilibrium state highly depends on the salt concentration. In a few weeks the lamellar structure (Cs ≤ 25 mM) and the hexagonal packing (Cs ≥ 50 mM) are set. Although the parameters of the lamellar phase do not vary significantly, the crystallographic parameters of the two-dimensional and three-dimensional hexagonal phases still evolve over more than 6 months. In contrast, at intermediate salt concentration (Cs ≈ 37 mM) NCPs display a disordered phase of columns for at least a few weeks. Demixing between the lamellar phase and the hexagonal phase requires several months to take place.
In the explored range of salt and pressure we did not observe any other phase. Nevertheless the sample prepared at Cs = 15 mM and PEG 19% gave scattering patterns that we are not able to interpret. We cannot exclude that we are dealing here with another structure. For pressures higher than 2.35 × 10⁵ Pa, other phases may exist as well.
From our experiments we noticed that the NCP concentration of the solution before addition of PEG is a crucial parameter. This effect has been clearly observed at high salt concentration where the final structure may be either two-dimensional hexagonal or three-dimensional quasi-hexagonal, depending on the value of CiNCP.
Lamellar phase of bilayers
At low salt concentrations, up to 25 mM, a lamellar phase of column bilayers is observed. Within each layer of a lamella, NCPs are regularly organized in a bidimensional monoclinic lattice. The particles are piled up into columns. Within these columns, NCPs may be tilted at an angle of 14° with respect to the column axis. Increasing the osmotic pressure in the sample from 4.7 × 10⁵ to 2.35 × 10⁶ Pa causes a decrease in the interlamellar distance from 376 to 358 Å. The intercolumn distance and the distance between adjacent NCPs within a column are also decreased in the same proportion, from 111.4 to 104.4 Å and from 59.8 to 57.1 Å, respectively. Accordingly, the NCP concentration in this phase increases from 278 to 319 mg/ml. The lamellar phase seems to reach equilibrium fairly rapidly, within about a month. Besides, the organization of this dense phase does not seem to depend on the initial concentration in the range 205 ≤ CiNCP ≤ 256 mg/ml.
Our observations are in qualitative agreement with electron micrographs, which showed a lamellar organization of bilayers. However, whereas we observe a perfect lamellar periodicity over more than 40 bilayers on average, the lamellar order seems to be less regular and over shorter distance on electron micrographs. This discrepancy might be due to differences in the preparation protocol of the samples. At a macroscopic level, optical micrographs show that bilayers wind up into tubes of a few micrometers with new tubes budding out at their extremities, thereby leading to dense spherulites formation. This behavior is due to the chiral structure of NCPs, which introduces torsion between columns within lamella. X-ray diffraction on disordered samples does not yield information on this point. However, as reported in the description of diffraction patterns, broad maxima were always observed superimposed on the thin diffraction peaks, which were attributed to the existence of intra- and intercolumnar disorder in some parts of the sample, a behavior possibly associated with lamellar torsion. Several unsuccessful attempts were made to obtain oriented samples to reach a more precise description of this organization. This failure can be due to the liquid crystal behavior of this phase, the preferential orientation of the particles relaxing in the absence of magnetic field. Alternatively, this could be an intrinsic property of this phase, the formation of tubes being possibly incompatible with the particle orientation in a magnetic field.
We finally consider the influence of DNA length on the structure of the lamellar phase. A few diffraction patterns have been collected on samples with a DNA length of 170 ± 15 bp. They suggest that an increase of the DNA length does not modify either the bilayer lamellar organization or the inter-NCPs distance within bilayers. However, a significant increase in the interlamellar distance is observed. This is easily rationalized if electron microscopy data are taken into account, which show that particles are oriented in such a way that the free ends of DNA are located outside the bilayer. Subsequently, the extra base pairs will also be located outside lamella, with no noticeable alteration in the inter-NCP distance within layers. However, these extra base pairs increase electrostatic repulsion, which are strong at low salt concentration, and therefore also increase the distance between bilayers.
Hexagonal phases
The importance of the initial NCP concentration before addition of PEG has been evidenced for Cs = 50 mM under an osmotic pressure of 4.7 × 10⁵ Pa. A bidimensional hexagonal columnar organization is observed for CiNCP = 220 mg/ml instead of a three-dimensional orthorhombic quasi-hexagonal structure for CiNCP = 260 mg/ml. Final NCP concentrations are quite similar in both cases. Interestingly, we have observed that, in the absence of PEG, NCPs pile on top of one another to form columns above a critical concentration of ∼250 mg/ml (article in preparation). The addition of PEG to isolated NCPs or to NCPs already organized into columns would lead to two-dimensional or three-dimensional structures, respectively. We suspect that NCPs form a two-dimensional structure when lateral and top-to-bottom contacts between NCP occur simultaneously. In contrast, the three-dimensional structure would form when top-to-bottom contacts are first established. Unfortunately this behavior has not been checked for Cs > 50 mM because all samples at Cs = 100 and 160 mM have been prepared only with an initial NCP concentration of 260 mg/ml.
In the two-dimensional phase, NCPs are piled up regularly into columns that form a hexagonal lattice. No correlation is observed between the longitudinal order along columns and the transverse order in the plane normal to the columns. For equilibration times ranging from 1 to 17 months, the distance between columns decreases from 116 to 110 Å and the distance between adjacent NCPs along a column from 60 to 57.7 Å. The NCP concentration in this phase increases therefore from 501 to 580 mg/ml with time. In the absence of oriented patterns, the type of order along the columns could not be determined. However, since there is no correlation between longitudinal and transverse order and the columns are therefore liable to undergo mutual sliding, it is reasonable to assume that, for reason of steric hindrance (NCP diameter ∼110 Å and intercolumn distance ≈ 110–116 Å), two adjacent NCPs along a column are piled up with their S-axis almost superimposed, without any lateral stagger in the plane normal to the columns. This assumption is supported by the analysis of cryofracture electron micrographs (Leforestier and Livolant, 1997), which clearly shows the columnar organization of the particles, with nonsystematic lateral stagger between NCPs.
In the three-dimensional structure, the crystalline unit cell is orthorhombic in a first approximation, with  (indicating that the hexagonal order is only slightly distorted) and c = 2 h, with h the distance between two adjacent NCPs along a column. Increasing the osmotic pressure causes a reduction of all three parameters a, b, and c from 115.4 to 110.1 Å, 203.6 to 194.0 Å, and 119.0 to 112.7 Å, respectively, in case of an equilibration time of 2 months. These variations correspond to an increase in the final NCP concentration from 502 to 583 mg/ml. The three-dimensional crystalline phase exhibits structural features common to NCP crystals obtained in the presence of divalent ions (Luger et al., 1997; Harp et al., 2000; White et al., 2001; Davey et al., 2002). From our data, we cannot discriminate between regular columns with no lateral stagger between two adjacent NCPs along a column, as observed in Sce-NCP crystals (White et al., 2001), and staggered columns of the type observed in other NCP crystals (Luger et al., 1997; Harp et al., 2000; White et al., 2001; Davey et al., 2002). While indexing the diffraction peaks from the corresponding patterns, it has also been noticed that some peaks which were indexed only with difficulty in an orthorhombic lattice could well be due to a slight distortion of the orthorhombic unit cell. Optical micrographs of the hexagonal phase (Livolant and Leforestier, 2000) showed that NCPs form chiral discotic germs involving twist between columns. Under these conditions, this twist may be responsible for the formation of an orthorhombic instead of a hexagonal crystal and also for the slight distortion of the orthorhombic unit cell itself (Kornyshev and Leikin, 1997, 1998; Lorman et al., 2001; Kornyshev et al., 2002; Harreis et al., 2002) and for the superstructure along the direction of the columns, reported here. An x-ray diffraction study of a monocrystalline sample would permit the unambiguous indexing of all diffraction peaks, and thus allows us to precisely detect the NCP organization within the columns and to detect a possible torsion between columns. All samples obtained during this work were polycrystalline, but they were constituted of monocrystals of a size larger than a few micrometers, as shown by the pattern in Fig. 4 A. Such a study on a monocrystal is therefore within experimental reach, using the micro beams now available at third generation storage rings like the European Synchrotron Radiation Facility (Grenoble, France).
All crystals described so far have been obtained in the presence of divalent ions and, for the most recent studies, with exactly 146 bp DNA (Luger et al., 1997; Harp et al., 2000; White et al., 2001; Davey et al., 2002) or 147 bp DNA (Davey et al., 2002). This study shows that it is possible to form three-dimensional crystals using completely different protocols, in the presence of monovalent ions only, and with NCPs that do not have a perfectly defined length of DNA.
It was proposed (see White et al., 2001) that three types of major interactions govern the NCP organization in the crystals:
End-to-end stacking of DNA fragments belonging to neighboring NCPs in the same plane (a,b) would be responsible for the quasi-hexagonal organization between particles in a given plane of the crystal lattice.
Histone octamer contacts, through a series of interactions between the basic H4 tail of one nucleosome and the acidic patch region of a neighboring particle, would stabilize the columns.
Interactions between two adjacent NCPs along a column through divalent ions, in particular Mn2+, would also stabilize the columns.
The histone tails are indeed essential to allow NCPs to pile up into columns perfectly ordered in a three-dimensional structure. The diffraction pattern obtained at a salt concentration of 160 mM and a PEG concentration of 19% (w/v) using a NCP solution with a DNA length of 155 bp but with part of histone H3 tails being proteolyzed is shown in Fig. 9 A. The initial NCP concentration before applying the osmotic stress was 250 mg/ml and the equilibration time was 1 month. The diagram displays very broad peaks. As already described in the case of a salt concentration of 37 mM, such a profile is characteristic of a columnar NCP organization with a strong intra- and intercolumn disorder. The average intercolumn distance thus ranges from 113 to 125 Å, depending on whether columns follow a nematic, locally hexagonal, or isotropic organization.
FIGURE 9.

Scattered intensity I(q) for a salt concentration of 160 mM and a PEG concentration of 19% (w/v) using the following: (A) an NCP solution with a DNA length of 155 bp but with part of histone H3 tails being proteolyzed. The initial NCP concentration before applying the osmotic stress was 250 mg/ml and the equilibration time was 1 month. (B) A solution of NCPs with a DNA length of 170 ± 15 bp and intact histone tails. The initial NCP concentration of this sample was 230 mg/ml and the equilibration time was 1 month.
Our observations lead us to reconsider the two other assumptions:
The polydispersity of the DNA length (155 ± 7bp) in our NCPs more likely prevents a regular end-to-end stacking of DNA fragments between neighboring particles. It thus rules out the assumption that the base stacking of adjacent DNA fragments is preponderant in the formation of three-dimensional orthorhombic crystals, at least in our case. Furthermore, parameter values observed in our crystals (a = 110.1 Å, b = 194.0 Å, and c = 112.7 Å for NaCl 160 mM, PEG 28%) are hardly larger than the values reported earlier: a ≈ 106 Å, b ≈ 181 Å, and c ≈ 110 Å in the case of staggered columns (Luger et al., 1997; Harp et al., 2000; White et al., 2001; Davey et al., 2002), and a = 104.9 Å, b = 192.6 Å, and c = 110.4 Å in the case of regular columns with no lateral stagger (White et al., 2001). This comparison suggests that the extra 10 bp are coiled around the histone core and do not point outside of the NCP. For higher lengths of the DNA fragments, the crystalline order is finally lost. Fig. 9 B shows the diffraction pattern obtained with a solution of NCPs with a DNA length of 170 ± 15 bp, at a salt concentration of 160 mM and a PEG concentration of 19%. The initial NCP concentration of this sample was 230 mg/ml and the equilibration time 1 month. This pattern exhibits broad diffraction peaks, indicative of a highly disordered columnar organization. Note that the first peak of the diffraction pattern, which reflects the average intercolumnar distance, is located at a q-value corresponding to distances between 130 and 143 Å. We recall that in the case of 155bp DNA and intact histones under the same conditions, an average intercolumn distance of 117.1 Å can be deduced from the parameter values a and b equal to 116.3 and 204.3 Å.
The complete absence of free divalent ions in our three-dimensional crystals lead us to question the crucial role they are supposed to play in the stabilization of NCP along the direction of the columns. In their absence, precise positioning of NCP in columns relative to the others can be set anyway. Thus, the three-dimensional ordering of NCPs accepts some polydispersity in DNA length and histone sequences. It is lost if histone tails are proteolyzed or if DNA length is too high or too polydisperse. The columnar organization subsists although with a strong intra- and intercolumn disorder. Finally, in the case of too-long DNA, distances between columns are considerably increased. We are presently not in a position to propose a molecular origin for the forces stabilizing the crystalline organization that we observe.
The experimental conditions were designed to produce samples under equilibrium conditions. In reality, the evolution of the lattice parameters was followed over months but not long enough to be certain that the equilibrium values have been reached. For the 37-mM salt concentration, the presence of a biphasic sample after 7 months equilibration was unexpected; we cannot rule out the hypothesis that it will finally turn monophasic after years. Besides, we noticed the important effect of the initial conditions in the settlement of the final phases, that we attribute to the fact that the dense phases can form either from isolated NCP or from already formed columns.
We also observed that the width of the diffraction peaks, in the lamellar phase and in the three-dimensional orthorhombic crystal, enlarges when the applied pressure is increased. The positional order decreases when the crystals are compressed. A similar observation was done previously in DNA (Strey et al., 2000). Additional experiments should be done to discriminate between different possible reasons for this behavior, either a decrease of the positional order due to angular frustration originating from the chirality of the objects and/or specific PEG or pressure effects.
As a conclusion, we found that multiple two-dimensional or three-dimensional phases of isolated NCP form in the presence of 15 to 160 mM monovalent salt concentration. For a given applied pressure, equal to 4.7 × 10⁵ Pa, the NCP concentration was found extremely different, ranging from ∼300 mg/ml under low salt conditions (Cs ≤ 25 mM) to ∼500 mg/ml for high salt conditions (Cs ≥ 50 mM), and coupled to phase transition between lamellar and hexagonal structures. Repulsive interactions between highly charged nucleosome core particles are screened by the addition of salt, thus allowing the sample to reach significantly higher concentrations without any change of the applied pressure. Although values found in the literature are extremely vague, the monovalent salt concentration range we have been exploring here covers the concentrations found in the living cell. We may speculate that local changes in the ionic conditions inside the cell may as well be responsible for similar dramatic changes in the supramolecular organization of chromatin.
APPENDIX
Analysis of the diffraction diagrams
In a two-dimensional columnar hexagonal phase, NCPs pile up in perfectly periodical columns which are all parallel and organized in the plane normal to their axis, according to a bidimensional hexagonal order, but are free to slide along their axis and to rotate around it. Let h be the distance between two NCPs and c the period along a column. Let us consider a possible organization along columns, similar to those observed in crystals, in which pseudo-diad axes of two successive NCPs point toward opposite directions, i.e., in which consecutive NCPs are linked by an 180° rotation around the column axis with no stagger in the plane normal to the axis. The period c is then equal to 2 h. Such an organization is schematically represented in Fig. 10 A.
FIGURE 10.

(A) Let us consider particles piling up in columns which are organized on a hexagonal lattice with an intercolumn distance aH. (B) On the equator, the diffraction diagram displays Bragg reflections characterizing the column organization. Layer lines normal to the meridian are also visible, which characterize the particle distribution along the columns. In the case of a periodic distribution along the columns of period c = 2 h, these layer lines are located at distances q| = π/h, 2π/h, 3π/h, and 4π/h, from the equator. (C) The calculation of the scattering intensity along these four layer lines show that those at 2π/h and 4π/h are the most intense. (D) In the case of a disorientated sample, these intense layer lines yield scattering rings broader than the instrumental resolution, the broadening decreasing with the diffraction order. In contrast, the diffraction rings characterizing the intercolumn order have the resolution width if this order has an infinite extension.
The diffraction diagram of such a system, obtained with the x-ray beam normal to the columns, has the following characteristics, represented in Fig. 10 B:
1. On the equator (axis perpendicular to the columns) diffraction spots are observed which characterize the bidimensional organization in the plane normal to the columns.
2. Out of the equator, scattering is concentrated on layer lines perpendicular to the meridian. The most intense layer lines correspond to the distance h between two successive NCPs. Their intensity is maximal on the meridian and their distance to the equator is a multiple of 2π/h. Other, weaker layer lines appear between the intense layer lines at distances which are multiple of 2π/c (in the present case: π/h). Their intensity is maximal away from the meridian. If the longitudinal order along the columns is infinite, the width of these layer lines is that of the instrumental resolution.
The intensity scattered along the first four layer lines has been calculated for two NCPs piled up along the meridian in the case where c = 2 h, with h = 60 Å. The result is presented in Fig. 10 C which shows the dependence with  of the scattered intensity
  for the four values of q| : π/h, 2π/h, 3π/h, and 4π/h, where
  and q| are the modulus of the projections of the scattering vector
  on the equator and the meridian respectively. The freedom of rotation of the columns was taken into account by rotating the NCPs around their axis and by averaging the resulting intensities. The crystal coordinates from 1aoi.pdb (Luger et al., 1997) were used. The calculation thus performed of the scattered intensity along the four layer lines (π/h, 2π/h, 3π/h, and 4π/h) shows that the most intense are those located at 2π/h and 4π/h.
In the case of an oriented sample in which NCP columns are all parallel, the structure of the columns, i.e., the position of NCPs within a column, can therefore be determined from the analysis of the diffraction diagram. In the case of a disoriented sample, this information is partly lost. Through the disorientation intense layer lines are transformed into rings broader than the instrumental resolution, while the weaker layer lines yield blurred circular halos which may vanish into the background and become undetectable (see Fig. 10 D). Bragg spots on the equator also give rise to diffraction rings, but these display no broadening with respect to the instrumental resolution if the order in the plane normal to the columns is infinite. The broadening of rings corresponding to intense layer lines can be estimated on the basis of simple geometrical considerations. If  is the half-width at half-maximum of the intense layer line at q| = n2π/h, the corresponding diffraction ring will be broadened by approximately
  . This is described in Fig. 10 D. The curves in Fig. 10 C give the following values for half-widths at half-maximum
  and
and  This corresponds to a broadening of the diffraction rings at q = 2π/h and q = 4π/h of ∼0.0042 Å−1 and 0.0024 Å−1, respectively.
The above calculations give a minimal estimate of the broadening of diffraction rings due to the disorientation of the column axes. If the longitudinal order along the columns has a finite extension, an extra broadening is added to that previously computed. This new contribution is the same for all diffraction rings n2π/h and only depends on the distance over which the longitudinal order is maintained. Generally speaking (and this holds true for all phases), if ξ is the correlation length of the position of the scattering particles, Bragg peaks in this direction will be broadened by ∼4π/ξ.
Finally, if the columns are not perfectly periodic, with NCPs free to rotate about their axis, the translation periodicity c along columns is lost, and only an averaged distance hmoy between two successive NCPs can be determined. In the case of an oriented sample, only intense layer lines across the meridian are observed at a distance n2π/hmoy from the equator. The broadening of these layer lines in the direction of the meridian decreases very rapidly for increasing n values, whereas their intensity diminishes, making them undetectable (Vainshtein, 1966). The nth layer line is broadened by ∼ndh2π/hmoy, where dh is the standard deviation of the inter-NCP distance distribution in reduced units. For a standard deviation of 5%, a minimum value in the case where NCPs are free to rotate around their axis, broadenings of the order of 0.005 Å−1 and 0.01 Å−1 are derived for the first two layer lines respectively. In the case of a disoriented sample, the broadening due to the disorientation is of course to be added.
Acknowledgments
We thank P. Vachette for assistance in using beam line D24 (LURE, Orsay) and for fruitful discussions. Thanks are due to T. Narayanan for help with ID2 (European Synchrotron Radiation Facility, Grenoble) experiments. We are grateful to L. Kreplak for performing the simulation of the scattered intensity. We also thank F. Artzner for his help during the experiments on ID2, and J. Doucet, P. Davidson, and E. Raspaud for stimulating discussions.
This work was partially supported by the Centre National de la Recherche Scientifique (ACI Physicochimie des Systèmes Complexes). Stéphanie Mangenot was supported by Ministère de l‘Education Nationale and Association pour la Recherche sur le Cancer fellowships.
Stéphanie Mangenot's present address is Ludwig Maximilan Universität, Sektion Physik, Geschwisterschollplatz 1, D-80539 Munich, Germany.
References
- Brandes, R., and D. R. Kearns. 1986. Magnetic ordering of DNA liquid crystals. Biochemistry. 25:5890–5895. [DOI] [PubMed] [Google Scholar]
- Busson, B., and J. Doucet. 2000. Distribution and interference function for two-dimensional hexagonal paracrystals. Acta Crystallogr. A56:68–72. [DOI] [PubMed] [Google Scholar]
- Davey, C. A., D. F. Sargent, K. Luger, A. W. Maeder, and T. J. Richmond. 2002. Solvent mediated interactions in the structure of the nucleosome core particle at 1.9 Å resolution. J. Mol. Biol. 319:1097–1113. [DOI] [PubMed] [Google Scholar]
- De Vries, A. 1970. X-ray photographic studies of liquid crystals. I. A cybotactic nematic phase. Mol. Cryst. Liq. Cryst. 10:219–236. [Google Scholar]
- Eberharter, A., and P. B. Becker. 2002. Histone acetylation: a switch between repressive and permissive chromatin: second in review series on chromatin dynamics. EMBO Rep. 3:224–229. [DOI] [PMC free article] [PubMed] [Google Scholar]
- Finch, J. T., R. S. Brown, T. Richmond, B. Rushton, L. C. Lutter, and A. Klug. 1981. X-ray diffraction study of a new crystal form of the nucleosome core showing higher resolution. J. Mol. Biol. 145:757–769. [DOI] [PubMed] [Google Scholar]
- Guinier, A. 1956. Théorie et Technique de la Radiocristallographie. Dunod, Paris.
- Harp, J. M., B. L. Hanson, D. E. Timm, and G. J. Bunick. 2000. Asymmetries in the nucleosome core particle at 2.5 Å resolution. Acta Crystallogr. D Biol. Crystallogr. 56:1513–1534. [DOI] [PubMed] [Google Scholar]
- Harreis, H. M., A. A. Kornyshev, C. N. Likos, H. Lowen, and G. Sutmann. 2002. Phase behavior of columnar DNA assemblies. Phys. Rev. Lett. 89:018303. [DOI] [PubMed] [Google Scholar]
- Kornyshev, A. A., and S. Leikin. 1997. Theory of interaction between helical molecules. J. Chem. Phys. 107:3656–3674. [Google Scholar]
- Kornyshev, A. A., and S. Leikin. 1998. Electrostatic interaction between helical macromolecules in dense aggregates: an impetus for DNA poly- and meso-morphism. Proc. Natl. Acad. Sci. USA. 95:13579–13584. [DOI] [PMC free article] [PubMed] [Google Scholar]
- Kornyshev, A. A., S. Leikin, and S. V. Malinin. 2002. Chiral electrostatic interaction and cholesteric liquid crystals of DNA. Eur. Phys. J. E7:83–93. [Google Scholar]
- Langmore, J. P., and J. R. Paulson. 1983. Low angle x-ray diffraction studies of chromatin structure in vivo and in isolated nuclei and metaphase chromosomes. J. Cell Biol. 96:1120–1131. [DOI] [PMC free article] [PubMed] [Google Scholar]
- Leforestier, A., J. Dubochet, and F. Livolant. 2001. Bilayers of nucleosome core particles. Biophys. J. 81:2414–2421. [DOI] [PMC free article] [PubMed] [Google Scholar]
- Leforestier, A., and F. Livolant. 1997. Liquid crystalline ordering of nucleosome core particles under macromolecular crowding conditions: evidence for a discotic columnar hexagonal phase. Biophys. J. 73:1771–1776. [DOI] [PMC free article] [PubMed] [Google Scholar]
- Livolant, F., and A. Leforestier. 2000. Chiral discotic columnar germs of nucleosome core particles. Biophys. J. 78:2716–2729. [DOI] [PMC free article] [PubMed] [Google Scholar]
- Lorman, V., R. Podgornik, and B. Zeks. 2001. Positional, reorientational, and bond orientational order in DNA mesophases. Phys. Rev. Lett. 87:218101. [DOI] [PubMed] [Google Scholar]
- Luger, K., A. W. Mader, R. K. Richmond, D. F. Sargent, and T. J. Richmond. 1997. Crystal structure of the nucleosome core particle at 2.8 Å resolution. Nature. 389:251–260. [DOI] [PubMed] [Google Scholar]
- Mangenot, S., A. Leforestier, P. Vachette, D. Durand, and F. Livolant. 2002. Salt-induced conformation and interaction changes of nucleosome core particles. Biophys. J. 82:345–356. [DOI] [PMC free article] [PubMed] [Google Scholar]
- Narayanan, T., O. Diat, and P. Bösecke. 2001. SAXS and USAXS on the high brilliance beamline at the ESRF. Nucl. Instr. Meth. Phys. Res. A. 467–468:1005–1009. [Google Scholar]
- Paulson, J. R., and J. P. Langmore. 1983. Low angle x-ray diffraction studies of HeLa metaphase chromosomes: effects of histone phosphorylation and chromosome isolation procedure. J. Cell Biol. 96:1132–1137. [DOI] [PMC free article] [PubMed] [Google Scholar]
- Richmond, T. J., J. T. Finch, B. Rushton, D. Rhodes, and A. Klug. 1984. Structure of the nucleosome core particle at 7 Å resolution. Nature. 311:532–537. [DOI] [PubMed] [Google Scholar]
- Sperling, L., and A. Klug. 1977. X-ray studies on “native” chromatin. J. Mol. Biol. 112:253–263. [DOI] [PubMed] [Google Scholar]
- Strey, H. H., J. Wang, R. Podgornik, A. Rupprecht, L. Yu, V. A. Parsegian, and E. B. Sirota. 2000. Refusing to twist: demonstration of a line hexatic phase in DNA liquid crystals. Phys. Rev. Lett. 84:3105–3108. [DOI] [PubMed] [Google Scholar]
- Struck, M. M., A. Klug, and T. J. Richmond. 1992. Comparison of x-ray structures of the nucleosome core particle in two different hydration states. J. Mol. Biol. 224:253–264. [DOI] [PubMed] [Google Scholar]
- Svergun, D. I., C. Barberato, and M. H. J. Koch. 1995. CRYSOL—a program to evaluate x-ray solution scattering of biological macromolecules from atomic coordinates. J. Appl. Crystallogr. 28:768–773. [Google Scholar]
- Vainshtein. 1966. Diffraction of X-Ray by Chain Molecules. Elsevier, Amsterdam.
- White, C. L., R. K. Suto, and K. Luger. 2001. Structure of the yeast nucleosome core particle reveals fundamental changes in internucleosome interactions. EMBO J. 20:5207–5218. [DOI] [PMC free article] [PubMed] [Google Scholar]
- Widom, J. 1998. Structure, dynamics, and function of chromatin in vitro. Annu. Rev. Biophys. Biomol. Struct. 27:285–327. [DOI] [PubMed] [Google Scholar]
- Widom, J., J. T. Finch, and J. O. Thomas. 1985. Higher-order structure of long repeat chromatin. EMBO J. 4:3189–3194. [DOI] [PMC free article] [PubMed] [Google Scholar]
- Widom, J., and A. Klug. 1985. Structure of the 300A chromatin filament: x-ray diffraction from oriented samples. Cell. 43:207–213. [DOI] [PubMed] [Google Scholar]