

Abstract
Ca2+-binding proteins (CaBPs) represent key factors for the modulation of cellular Ca2+ dynamics. Especially in thin extensions of nerve cells, Ca2+ binding and buffered diffusion of Ca2+ by CaBPs is assumed to effectively control the spatio-temporal extend of Ca2+ signals. However, no quantitative data about the mobility of specific CaBPs in the neuronal cytosol are available. We quantified the diffusion of the endogenous CaPB parvalbumin (PV) in spiny dendrites of cerebellar Purkinje neurons with two-photon fluorescence recovery after photobleaching. Fluorescently labeled PV diffused readily between spines and dendrites with a median time constant of 49 ms (37–61 ms, interquartile range). Based on published data on spine geometry, this value corresponds to an apparent diffusion coefficient of 43 μm2 s−1 (34–56 μm2 s−1). The absence of large or immobile binding partners for PV was confirmed in PV null-mutant mice. Our data validate the common but so far unproven assumption that PV is highly mobile in neurons and will facilitate simulations of neuronal Ca2+ buffering. Our experimental approach represents a versatile tool for quantifying the mobility of proteins in neuronal dendrites.
INTRODUCTION
Neuronal Ca2+ signaling is characterized by highly localized Ca2+ influx into the cytosol and subsequent redistribution governed by diffusion. Functionally relevant distances for Ca2+ diffusion range from a few tens of nm in the case of Ca2+-triggered vesicle release at presynaptic terminals (Rozov et al., 2001) to hundreds of nm for Ca2+ signaling between spines and dendrites (Takechi et al., 1998) and to tens of μm for Ca2+ signals in somata (Sala and Hernández-Cruz, 1990; Eilers et al., 1995a). Beside morphological factors which, for example, may lead to compartmentalization of Ca2+ signals in single spines (Sabatini et al., 2002), endogenous Ca2+-binding proteins (CaBPs) have the strongest impact on Ca2+ diffusion (Zhou and Neher, 1993). CaBPs limit the range of action of free calcium ions to ∼100 nm in the case of fast and to ∼1000 nm in the case of slow buffer kinetics (Allbritton et al., 1992). Once bound, the spread of Ca2+ will be significantly retarded if the CaBPs are fixed (Nowycky and Pinter, 1993). However, mobile CaBPs can transport Ca2+ over distances of several μm (Allbritton et al., 1992; Nowycky and Pinter, 1993). This buffered diffusion of bound Ca2+ may, for example, carry Ca2+ from active synapses to neighboring, inactive ones and, thereby, underlay Ca2+-dependent forms of heterosynaptic plasticity (Lisman, 1989; Hansel et al., 1997; Yang et al., 1999). For CaBPs that act as Ca2+ sensors, such as caldendrin (Yang et al., 2002), diffusion of the Ca2+-protein complex will directly determine their range of action.
Neurons express a large variety of CaBPs among which parvalbumin (PV), calbindin D28k, and calretinin are the most abundant ones (see Baimbridge et al., 1992 for review). The Ca2+-binding affinities of most and the binding kinetics of some CaBPs have been characterized (see, for example, Nägerl et al., 2000). However, little quantitative information about the mobility of these proteins is available. To our knowledge, diffusion coefficients of specific CaBPs have only been determined in nonneuronal cell types and only for two proteins: PV in skeletal and calmodulin in smooth muscle cells (Maughan and Godt, 1999 and Luby-Phelps et al., 1995, respectively). Unfortunately, these data may not be applicable to other cell types because calmodulin's mobility strongly depends on the activation state of the cell (Luby-Phelps et al., 1995) and diffusion in skeletal muscle cells may be significantly affected by the regularly arranged myofilaments. In neuronal preparations, the mobility of endogenous CaBPs has been assessed so far only indirectly, with no reference to a specific protein. Zhou and Neher (1993) analyzed endogenous buffers in chromaffin cells, Gabso et al., (1997) in axons of Aplysia neurons. These studies revealed upper bounds for the mobility of endogenous Ca2+ buffers present in these cells. Protein-specific diffusion coefficients, however, could not be derived. Their estimate would have required knowledge of the intracellular concentrations of the relevant CaBPs, which was (and still is) not available. Taken together, simulations of neuronal Ca2+ dynamics have to deal with major uncertainties regarding the role of buffered diffusion of Ca2+. This fact severely limits our understanding of the functional roles of specific CaBPs, as well as that of neuronal Ca2+ signaling in general.
In this study we developed an approach that allowed us to quantify the mobility as well as possible binding partners of specific proteins in the neuronal cytosol. Based on the methodology of two-photon fluorescence recovery after photobleaching (FRAP) measurements of three-dimensional diffusion (Brown et al., 1999), we took advantage of the geometrical constrains of dendritic spines (Špaček, J., 1985; Harris and Stevens, 1988) to study one-dimensional diffusion across spine necks of cerebellar Purkinje neurons. We first established and validated our approach by performing FRAP measurements on spines loaded with fluorescein dextrans (Svoboda et al., 1996). Subsequently we quantified the mobility of fluorescently labeled PV. We obtained the PV diffusion coefficient and found no evidence for large or immobile binding partners of PV. The latter finding was verified in mutant animals that lack endogenous PV.
Our results show that PV is a highly mobile endogenous Ca2+ buffer that diffuses readily between spines and dendrites on the timescale of synaptic Ca2+ transients. Thus, in cells that express large concentrations of PV, such as Purkinje neurons, diffusion of PV-buffered Ca2+ will profoundly affect the spatio-temporal extent of dendritic Ca2+ signals. Our experimental approach will allow the study of various other neuronal proteins, including the widely expressed CaBPs, calbindin D28k and calretinin. The resulting data will provide a quantitative framework for our understanding of Ca2+-dependent signal integration in neurons.
METHODS
Animals and slice preparation
Acute cerebellar brain slices were prepared from 20- to 24-day-old wild-type (CD-1) and parvalbumin-deficient (PV−/−; Schwaller et al., 1999) mice. Animals were anesthetized with isoflurane (Curamed, Karlsruhe, Germany) and decapitated. The vermis was removed and mounted in a chamber filled with cooled (0–2°C) artificial cerebrospinal fluid (ACSF; see below). 200-μm thick parasagittal slices were cut using a HR2 vibratome (Sigmann Elektronik, Heidelberg, Germany) and kept in ACSF at 37°C for 45 min before they were transferred to the recording chamber. The experiments were performed at 20–22°C.
Labeling of parvalbumin with Alexa Fluor 488
Purified rat recombinant PV (a kind gift of T. Pauls, Fribourg) was dissolved in a 0.5 M NaHCO3 solution (pH 9.3) at a protein concentration of 2 mg/ml. The protein solution was added to vials containing Alexa Fluor 488 reagent (Alexa, mol wt ∼ 640; Molecular Probes, Leiden, The Netherlands) and incubated in the dark for 1 h at 20–22°C. The separation of the labeled protein (PV*) from the excess labeling reagent was carried out on a desalting column provided in the labeling kit. The gel resin was equilibrated with a buffer consisting of 15 mM (NH4)HCO3 and 0.1 mM CaCl2. The fluorescent protein fraction was collected, divided into aliquots of 200 μg and lyophilized in a Speed-Vac concentrator (Savant, Farmingdale, NY). Samples were stored in the dark at either −20 or −70°C for long-term storage. The molecular Alexa/PV ratio was 0.8–0.9, as calculated from the absorbance of PV* at 494 nm, the known protein concentration (assuming a 95% recovery after desalting), and the molar extinction coefficient of Alexa 488 (71,000 cm−1 M−1).
Solutions
The ACSF contained (in mM): 125 NaCl, 2.5 KCl, 1.25 NaH2PO4, 26 NaHCO3, 1 MgCl2, 2 CaCl2, 20 glucose, pH 7.3 to 7.4 at 20–22°C when gassed with 95% O2 and 5% CO2. The pipette solution was composed of (in mM): 140 K-gluconate, 10 NaCl, 3 Mg-ATP, 0.3 GTP, 10 HEPES dissolved in purified water (W-3500, as all chemicals, from Sigma, Munich, Germany). The pH was adjusted to 7.3 with KOH. To this solution 500 μM of 10- or 40-kDa fluorescein dextran (FD; Molecular Probes), or 100 μM PV* dissolved in purified water was added. Before use, the solution was filtered with a syringe filter (0.2 μm, Nalgene, New York).
Dye loading of Purkinje neurons
Purkinje neurons were equilibrated with the dye-containing pipette solution in the whole-cell patch-clamp configuration. Current (up to 300 pA) was injected to clamp the membrane potentials at −60 to −65 mV using an Axopatch 200A amplifier, a Digidata 1320A AD/DA converter and Clampex 8.0 software (Axon Instruments, Union City, CA). The AD/DA converter and the Clampex software were also used to control the Pockels cell (model 350-50 KDP*; Conoptics, Danbury, CT) and to record the fluorescence signal, see below. Patch-pipettes were pulled from borosilicate glass (Science Products, Hofheim, Germany) on a P-87 puller (Sutter, Novato, CA) to resistances of 3–5 MΩ. To allow rapid equilibration of the cytosol with the pipette solution, the series resistance was kept below 20 MΩ for at least 15 min after breaking into the cell.
FRAP recordings
Two-photon fluorescence recovery after photobleaching (FRAP) experiments were performed with a mode-locked Ti:sapphire laser (Tsunami; Spectra Physics, Mountain View, CA) that generated pulses of <100 fs at 80 MHz at a center wavelengths of 825 nm. The laser intensity was modulated using a Pockels cell and focused onto the specimen with a custom-modified Fluoview-300 BX-50 laser-scanning microscope equipped with a 60×/0.9 NA water immersion objective (Olympus, Tokyo, Japan). Recordings were performed between 30 and 120 min after the whole-cell configuration was established. The 40-kDa FD required a longer loading time of ∼45 min before spines were resolvable. The fluorescence was detected with an external photomultiplier tube (PMT; HC 125-02, Hamamatsu, Tokyo, Japan) and sampled either with the Fluoview system (for viewing the preparation and selecting spines) or (for performing the FRAP experiments) with the AD/DA converter of the electrophysiology system.
For the FRAP experiments, the laser beam was focused on a single spine head using the point-scan mode of the Fluoview system and the laser intensity was set to a monitoring intensity of 4–10 mW (measured at the exit of the objective). After 500 ms, a bleach pulse (6 ms, 35–65 mW) was applied and the recovery of the fluorescence monitored for 1.5 s. The fluorescence signals were low-pass filtered at 300 Hz (AM 502; Tektronix, Beaverton, OR) and sampled at 1 kHz. After the recording of the spine-head fluorescence signal, using the same intensity protocol, the specimen background, the laser intensity, and the system background were recorded by defocusing, by deflecting the (attenuated) laser beam directly toward the PMT, and by complete blockade of the laser beam, respectively. In some experiments the monitoring intensity induced a noticeable decline in the fluorescence during the baseline period. Experiments were discarded if this bleaching was larger than 15%.
Data analysis
The analysis was performed with custom-written routines in Igor Pro 4.0 (Wavemetrics, Lake Oswego, OR). The spine fluorescence data were corrected for the specimen background, the laser intensity data for the system background. Because of the quadratic dependence of the fluorescence on the laser intensity (two-photon excitation), the fluorescence was subsequently divided by the square of the laser intensity, thereby eliminating distortions of the fluorescence signal due to nonlinear switching artifacts of the Pockels cell (Brown et al., 1999). Finally, the fluorescence data were expressed as F/F0, i.e., as fluorescence (F) divided by the baseline fluorescence (F0).
In analogy to Pusch and Neher (1988) and Svoboda et al. (1996), we used the following formalism to derive apparent diffusion coefficients (D) from the FRAP experiments: the time course of fluorescence recovery after bleaching was described by a differential equation of the form
 |
(1) |
where c(t) denotes the concentration of the fluorescently labeled molecules in the spine head and cd the concentration in the dendrite. The expression is based on the assumptions that c(t) is independent of space, i. e. that the spine head represents a well-mixed compartment, and that cd is constant in time. The first assumption holds because diffusional redistribution within spine heads will occur on timescales of tens of μs, too fast to be detected with our experimental approach. Thus, c(t) is proportional to F/F0. cd can be assumed to be constant in time because the volume of the spine head (∼0.1 fl; Harris and Stevens, 1988) is small in comparison to the volume of the adjacent dendritic compartment (∼1.6 fl per μm distance from the spine; Vecellio et al., 2000). Given the above assumptions, Eq. 1 predicts an exponential recovery time course with a time constant τ (see also Svoboda et al., 1996).
For FRAP experiments on spine heads, Fick's first diffusion law was adapted according to the above assumptions and using a geometrical model for the spine neck:
 |
(2) |
where r is the effective (i.e., corrected for the endoplasmic reticulum) radius of the spine neck, l the length of the spine neck, and V the effective volume of the spine head. It should be noted that the ER in the spine neck usually consists of one thin, centrally located tubule with a rather constant diameter (Špaček, 1985). Thus, at first approximation its presence leads to a homogenous reduction of the effective neck radius and not to variable obstructions which would complicate the above geometrical model.
The solutions to Eqs. 1 and 2 are equal if
 |
(3) |
In our study, we could not determine the geometrical parameters of each analyzed spine and, therefore, had to rely on published values (r = 0.09 ± 0.01 μm, l = 0.66 ± 0.32 μm, and V = 0.083 ± 0.02 μm3; mean ± SD values taken/computed from Harris and Stevens, 1988). Furthermore, the measured τ values were not normally distributed. Thus, median diffusion coefficients were calculated according to:
 |
(4) |
where  denotes the median τ of a given experimental group and
  the expectation of r squared.
RESULTS
Fluorescence recovery after photobleaching experiments were performed on 195 spines of cerebellar Purkinje neurons (PNs). In a first set of experiments, fluorescein dextrans (FDs) were used to establish and validate a quantitative analysis of FRAP data; in a second set of experiments, the mobility of parvalbumin (PV) was investigated in PNs from wild-type and PV−/− mutant mice.
FRAP recordings in spiny dendrites of Purkinje neurons
FRAP was recorded from individual spines located on distal dendrites of PNs loaded with 10,000 Da fluorescein dextran (10-kDa FD, 500 μM; Fig. 1, A and B). Our experimental approach (Fig. 1 C) was based on the use of a Pockels cell to rapidly modulate the excitation intensity (Brown et al., 1999) and the point-scan mode of the scanner system; it allowed us to monitor the spine fluorescence at a high temporal resolution and with a high signal-to-noise ratio. A typical FRAP recording is shown in Fig. 1 D. After a baseline period in which the spine fluorescence (expressed as F/F0, see Methods) was monitored at low excitation intensity, a brief (6 ms) high intensity laser pulse (bleach pulse) was applied, resulting in a steep decline in the fluorescence due to bleaching of the fluorophores in the spine. The recovery of the fluorescence after the bleach pulse was well described by an exponential function (red curve in Fig. 1 D) reflecting the diffusional equilibration between bleached and unbleached FDs in the spine and the parent dendrite (see Eq. 1). The time constant τ was 70 ms in this example.
FIGURE 1.

Molecular diffusion in spiny dendrites quantified by two-photon fluorescence recovery after photobleaching (FRAP). (A) Fluorescence image of a cerebellar Purkinje neuron filled with 10-kDa fluorescein dextran (10-kDa FD, 500 μM) via a somatic whole-cell patch pipette (bottom center). The dendritic region outlined by the red square is shown at a higher magnification in B. (B) Spines on terminal dendrites. The experiment illustrated in D was performed on the spine marked by the crosshair. (C) Equipment diagram. Pulsed laser light was intensity-modulated (Icmd) by a Pockels cell and scanned with a custom-built two-photon laser-scanning microscope. During the FRAP experiments the laser beam was restricted to a single spine. (D) Normalized fluorescence signal (F/F0) from the spine shown in B during a FRAP experiment. After a baseline period monitored at low intensity, a brief pulse (6 ms) of high-intensity laser light was applied which bleached the fluorophore in the spine. The time course of recovery (τ) was well described by an exponential function (red line). The upper trace shows the residuals, i.e., the data after subtraction of the fit.
Stability of the FRAP recordings
The relatively high laser power directed onto a single spine during the monitoring phase and during the bleach pulse may induce phototoxic damage and, thereby, significantly affect τ (Koester et al., 1999). To test for this possibility, we performed multiple recordings on the same spine and searched for changes in the spine morphology as well as in the mobility of 10-kDa FD (Fig. 2 A). Repeated FRAP recordings yielded τ values that showed little variability and, importantly, no systematic increase as described by Koester et al. (1999). Furthermore, no alterations in the spine morphology were observed, even after 10 successive recordings (Fig. 2 A). Fig. 2 B summarizes the results of four such experiments. It should be noted that phototoxic damage could easily be induced by deliberately increasing the bleach intensity and/or duration two- to threefold (data not shown). However, careful adjustment of the duration and intensity of the laser illumination, as performed throughout our experiments, reliably prevented malicious side effects of the laser illumination.
FIGURE 2.
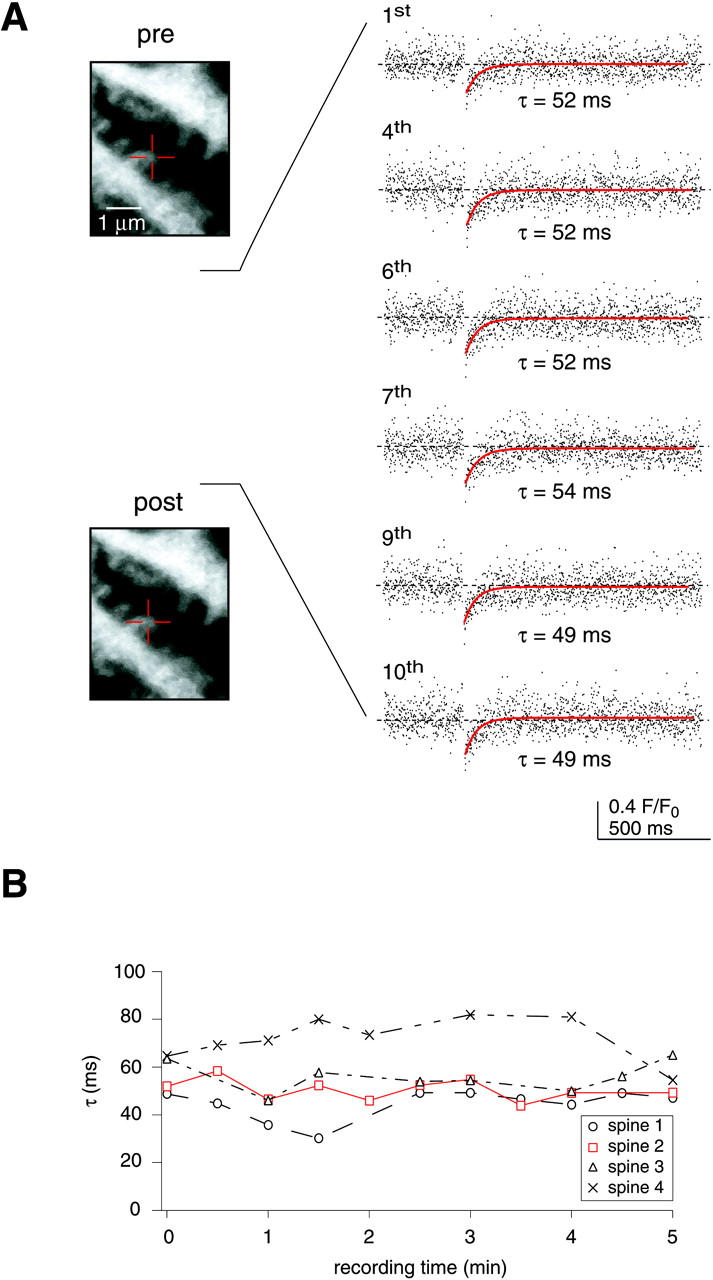
FRAP recordings were reproducible and induced no photodamage. (A) Left, images taken before and after 10 successive recordings on the same spine (marked by the crosshair). The bleach experiments (right) showed little variability and did not induce noticeable morphological alterations (left). (B) Summary of four such experiments (2 cells, 2 animals), the experiment illustrated in A is marked in red.
We further investigated whether τ is affected by the bleach depth. Besides possible phototoxic damage, stronger bleach pulses result in larger focal volumes that undergo bleaching (Denk et al., 1995). As a consequence, fluorophores in the spine neck and in the parent dendrite may get bleached, leading to a protraction of the diffusional refilling of the spine head. However, as illustrated in Fig. 3 A, we found no correlation between the bleach depth and the τ values (r = 0.03, n = 57). Thus, although FRAP recordings of free diffusion in solution or in the bulk cytoplasm of cell bodies are sensitive to the initial spatial distribution of bleached fluorophore (Brown et al., 1999), FRAP recordings in well-mixed dendritic spines are not and hence are independent of the bleach depth. Fig. 3 B summarizes the results of all FRAP experiments performed on 10-kDa FD loaded cells (n = 57, 7–9 spines per cell, 7 cells from 5 animals). Both within as well as between cells only a small variability of the τ values was observed. Taken together, under our experimental conditions, FRAP recordings on spines represent a reliable and reproducible measure of diffusion in spiny dendrites.
FIGURE 3.

Mobility of 10-kDa FD. (A) τ values from all 10-kDa FD experiments (n = 57, 7 cells, 5 animals) plotted against the bleach depth. The solid line represents a linear fit to the data. Note that τ is independent of the bleach depth. (B) τ values (median and IQR), grouped for cells. (C) Distribution of τ values binned to 10 ms. The median value of all recordings was 67 ms (51–79 ms IQR).
The distribution of all τ values is shown in Fig. 3 C. As expected from the nonlinear dependence of τ on the radius of the spine neck (see Methods), the distribution was slightly skewed toward larger τ values. The median τ value was 67 ms (51–79 ms interquartile range, IQR, n = 57).
We further tested for an immobile fraction (IF) of the fluorescently labeled molecules for which an incomplete return to baseline after the bleach pulse would be the hallmark (Luby-Phelps et al., 1995; Star et al., 2002) An IF can be quantified as the steady-state offset from the baseline after the bleach pulse divided by the maximum decrease in fluorescence induced by the bleach pulse (“bleach depth”; Luby-Phelps et al., 1995). Although we never observed an incomplete baseline return in our recordings, immobile molecules in the spine head may have been bleached during successive FRAP experiments performed on the same spine. To decisively exclude an IF of 10-kDa FD molecules, we performed only one FRAP experiment per spine. The calculated IF was close to 0 (normalized baseline return = 99.7%, n = 57), signifying that 10-kDa FD is freely mobile in spines.
Relationship between the diffusional mobility and the molecular weight
According to the Stokes-Einstein relationship, in an aqueous environment the diffusion coefficient is approximately proportional to the hydrodynamic radius of the diffusing particle. Thus, for relatively large molecules, such as dextrans, D should be proportional to the inverse cubic root of the molecular weight (M; see, for example, Pusch and Neher, 1988; Koch, 1999). Assuming an inverse relationship between τ and D (see below), τ should be proportional to M1/3.
To test for the relationship between the diffusional mobility and M in spiny dendrites, PNs were loaded with a FD of 40,000 Da (40-kDa FD). A representative FRAP experiment performed on a 40-kDa FD loaded spine is illustrated in Fig. 4, A and B. As expected, the time constants of recovery were larger than those in the 10-kDa FD experiments (115 ms in this example). In all recordings the fluorescence fully returned to baseline values after the bleach pulse, indicating the absence of any immobile fraction of 40k FD. Fig. 4 C shows the variability of the τ values within and between cells, Fig. 4 D the distributions of τ values (n = 54, 6 cells, 4 animals). Similar to the 10-kDa FD experiments, a skewing toward larger τ values occurred. The median τ value was 104 ms (80–127 ms IQR). The values were significantly smaller than the corresponding values of the 10-kDa FD (p < 0.001, Mann-Whitney Rank sum test).
FIGURE 4.

Mobility of 40-kDa fluorescein dextran (40-kDa FD). (A and B) Representative FRAP experiment. The crosshair marks the spine that was analyzed. (C) τ values (median and IQR), grouped for cells. (D) Distribution of τ values binned to 10 ms. The median value of all recordings was 104 ms (80–127 ms, n = 54, 6 cells, 4 animals).
A linear regression to the logarithmic τ values of the two FDs plotted against the logarithms of their molecular weights yielded a slope of 0.32 (data not shown). This value is within the expected range and, thus, at first approximation, the relationship τ ∝ M1/3 seems to be valid in spiny dendrites (but see below).
Mobility of parvalbumin
Having established FRAP-based quantification of diffusion in spines, we next analyzed the mobility of dye-labeled parvalbumin (PV*). PNs were loaded with 100 μM PV*, a concentration similar to the assumed dendritic concentration of the native protein in PNs (50-100 μM; Kosaka et al., 1993). PV* rapidly diffused within the cell; individual spines could be resolved after 20–30 min loading time. No difference in the staining pattern between FD and PV* experiments was observed, indicating that PV* has free access to all dendritic compartments. A representative FRAP recording is shown in Fig. 5, A and B. The time course of recovery was fast and again well described by a monoexponential function (τ = 42 ms in this example). Within and between cells there was little variability in the estimates of τ (Fig. 5 C) and, as for the dextrans, the distribution of τ values was skewed toward larger values (Fig. 5 D). The median τ value was 49 ms (37–61 ms IQR, n = 43, 6 cells, 5 animals).
FIGURE 5.

Mobility of dye-labeled Parvalbumin (PV*). (A and B) Representative FRAP experiment. The spine marked by the crosshair in A was used for the recording shown in B. The cell was loaded with 100 μM PV*. (C) τ values (median and IQR), grouped for cells. (D) Distribution of τ values binned to 10 ms. The median value of all recordings was 49 ms (37–61 ms, n = 43, 6 cells, 5 animals). (E) Representative FRAP experiment in a spine from a PV null-mutant (PV−/−) animal. The cell was loaded with 100-μM PV*. Note the complete baseline return. (F) Logarithm of the median apparent diffusion coefficients of 10-kDa FD, 40-kDa FD, and PV* (estimated according to Eq. 4) plotted against the logarithm of their molecular weights. The solid line represents a linear fit through the data of the dextrans. The slope of this line (−0.32) is in close agreement with the expected dependence of D on the molecular weight (D ∝ M−⅓). Note that despite the similar molecular weights of PV* and 10-kDa FD, DPV is significantly larger than D10kDaFD.
Given the molecular weight of PV (∼12,000 Da; Berchtold, 1996), this value is surprisingly small compared to those of the dextrans. Specifically, τPV was significantly smaller than τ10kDaFD (p < 0.001, Mann-Whitney Rank sum test). Most likely, this discrepancy can be explained by the tertiary structure of dextrans and PV (Arrio-Dupont et al., 1996; Kretsinger and Nockolds, 1973). However, it is evident that the simple relationship τ ∝ M1/3 (see above) does not hold when comparing dextrans and the endogenous protein PV.
In the example shown in Fig. 5 B, as well as in all other PV* recordings summarized in Fig. 5 C, the fluorescence fully returned to the baseline after the bleach pulse. This implies that PV* had no immobilized fraction, i.e., no large and/or immobile binding partner(s). However, PNs express a relatively high concentration of endogenous PV (Kosaka et al., 1993). Assuming that putative partners bind PV irreversibly or with rather slow kinetics (on the order of tens of minutes), the endogenous, nonfluorescent PV could have occupied all binding sites, leaving no available sites for the added PV*. To test for this hypothesis, we also recorded FRAP of PV* in Purkinje neurons from PV deficient (PV−/−) mice. In these mice, the spines of Purkinje neurons show morphological alterations (Vecellio et al., 2000), which impede a direct comparison of τ values between wild-type and PV−/− recordings. Nonetheless, the quantification of an IF of PV is independent of the morphology of the spines. Thus, putative binding sites for PV, which would be fully available in these cells, could be revealed by the FRAP experiments. However, as illustrated in Fig. 5 E, in PV−/− PNs, the recovery after the bleach pulse was well described by a monoexponential function and fully returned to the baseline value. The quantification of immobilized PV* in all FRAP experiments in PV−/− cells confirmed the absence of an IF (normalized baseline return = 100.4%, n = 41 from 5 cells and 3 animals).
Estimating D from spine FRAP experiments
Our experimental approach allows estimation of the apparent diffusion coefficient (D) of the labeled particles: by interpreting the diffusional exchange between spine and dendrite as diffusion through a pipe and by using published data on the spine geometry, the measured time constants can be converted to a median D value (see Methods). Our data predict apparent dendritic diffusion coefficients of 43 μm2 s−1 (34–56 μm2 s−1 IQR) for PV, 32 μm2 s−1 (27–41 μm2 s−1) for 10-kDa FD, and 20 μm2 s−1 (17–26 μm2 s−1) for 40-kDa FD. Fig. 5 F illustrates the dependence of D on the molecular weight of the diffusing particles. It is evident that the relationship D ∝ M−1/3 (see above) holds approximately for dextrans but not for comparing dextrans with PV, which has a significantly larger D value.
DISCUSSION
Using two-photon FRAP, we quantified the mobility of the endogenous Ca2+-binding protein PV in spiny dendrites of cerebellar Purkinje neurons. FRAP recordings from dendritic spines have been performed previously for investigating spineous protein turnover (Star et al., 2002) as well as diffusional coupling between spines and dendrites (Svoboda et al., 1996; Majewska et al., 2000a,b). We extended these previous studies by converting FRAP time constants to diffusion coefficients based on published data on the spine geometry and by using mutant animals that lack the protein of interest to ensure proper identification of possible binding partners. To our knowledge, the present study represents the first measurement of the dendritic diffusion coefficient of a neuronal protein.
Estimate of apparent diffusion coefficients
Quantification of molecular diffusion by two-photon FRAP was introduced by Brown et al. (1999). The approach allows the measurement of three-dimensional diffusion in unconfined solution or within large cellular compartments (i.e., cell bodies). A prerequisite for this method, however, is a careful adjustment of the bleach depth to obtain a well-defined bleach volume. Our approach based on FRAP recordings from spines lessens the experimental and mathematical burden of two-photon FRAP recordings because the measured diffusive recovery occurs between two well-mixed compartments (i.e., the spine head and the dendrite) and the bleach depth is not a critical parameter (Fig. 3 A). The latter effect is due to the fact that boundary conditions (head size, neck size, etc.) define the recovery time, and not the initial distribution of bleached molecules. Thus, in contrast to three-dimensional FRAP experiments (Brown et al., 1999), increasing the bleach intensity beyond excitation saturation does not significantly alter the recovery kinetics.
The main limitation of our quantification is that it depends on a rather precise knowledge of the spine geometry. Beside the length and radius of the head and the neck, the volume of intracellular organelles (i.e., the endoplasmic reticulum, ER) is of importance. In the neck, the ER reduces the cytosolic volume and thus the cross-section available for diffusion; in the head, it reduces the bleached volume. Both parameters directly affect the estimate of the diffusion coefficients. Although the size of the spine head can be approximated from fluorescence data (Svoboda et al., 1996), the geometry of the neck as well as that of the ER is well below the resolution of light microscopy. We, therefore, had to rely on published data on the morphology of spines of rat Purkinje neurons (Harris and Stevens, 1988). The application of these electron microscopic data to our FRAP recordings may have distorted our quantification for the following reasons: shrinking/swelling due to the fixation process, species differences, spine variability, and unidentified obstructions in the spine neck. Regarding the morphological differences between in vivo and fixed samples, little quantitative data are available. Roth and Häusser (2001), for example, found less than 5% shrinking during the fixation process in brain slices, which would lead to an error of ∼10% in our estimates of D (Eq. 4). Species differences between spines of rat and mice seem to be rather small. Whereas complete data on spine heads, necks and spineous ER are only available for rats (Harris and Stevens, 1988), comparable data from mice show no significant deviations (Špaček and Hartmann, 1983; Špaček, 1985). Variability in spine geometry, as documented by Harris and Stevens (1988), would lead to rather imprecise quantification of diffusion considering a single spine only. However, calculating median diffusion coefficients from a large number of spines, as in our study, will efficiently compensate for random variability of spine shape. The systematic error introduced by imprecise knowledge of the geometrical spine parameters can be expected to be in the range of 10–20%. Finally, unidentified obstructions in the spine necks may impede the diffusional exchange between the spine and the dendrite and, consequently, may lead to an underestimation of D.
Mobility of parvalbumin
We found that PV can access all dendritic branches and spines, has no large or fixed binding partner, and is highly mobile. PV's apparent diffusion coefficient of ∼43 μm2 s−1 is similar to the 43 and 32 μm2 s−1 reported by Maughan and Godt (1999) for transverse and longitudinal PV diffusion in frog myoplasm, the only other preparation in which the mobility of PV has been directly quantified.
Our experiments on PV−/− mutants substantiate the common, but so far unverified assumption that PV is a freely mobile Ca2+ buffer in neurons. It could be argued that the rapid equilibration of exogenous PV in the cytosol (Chard et al., 1993; Gabso et al., 1997; Maughan and Godt, 1999; Lee et al., 2000a; John et al., 2001; this study) already indicates free mobility of PV. However, the situation may have been complicated by high-affinity intracellular binding sites for PV. A considerable fraction of the Ca2+-binding protein calmodulin (CaM), for example, seems to be immobilized in smooth muscle cells, hindering washout of the protein even after Triton-induced permeabilization of the cell membrane (Tansey et al., 1994). Notably, FRAP experiments on microinjected fluorescently labeled CaM failed to detect this fixed fraction (Luby-Phelps et al., 1995), most likely because the exogenous CaM could not replace the efficiently bound endogenous CaM. Analogously, in wild-type animals, putative high-affinity binding sites may have been saturated by endogenous PV and, therefore, not be available for the injected PV*. However, our experiments on PV−/− mice provide strong evidence against the presence of spineous binding sites for PV.
As a consequence of its high mobility, PV will be readily washed out during whole-cell patch-clamp recordings. Assuming an access resistance of 10 MΩ, the concentration of endogenous PV in a round cell with a diameter of 15 μm, for example, will drop with a time constant of ∼170 s (Pusch and Neher, 1988). In neuronal dendrites washout will occur over tens of minutes. Based on the work of Rexhausen (1992), the PV concentration in terminal dendrites (150–200 μm distant from the soma) of Purkinje neurons will drop with a time constant of 15–25 min. Thus, in whole-cell recordings performed on these timescales, the functional role of PV may be significantly underestimated (Lee et al., 2000b; Schmidt et al., unpublished data).
Functional implications
Its high mobility will allow PV to effectively transport bound Ca2+ between spines and dendrites. Due to this buffered diffusion, local Ca2+ elevations will dissipate faster and spread over lager distances than in the absence of PV (Nowycky and Pinter, 1993; Gabso et al., 1997; Naraghi and Neher, 1997). Because buffered diffusion is known to profoundly affect Ca2+-dependent signaling cascades, as, for example, IP3-mediated Ca2+ release from intracellular stores (John et al., 2001) and transmitter release (Roberts, 1993; Tang et al., 2000; Rozov et al., 2001; Meinrenken et al., 2002), the highly mobile PV may substantially modulate Ca2+-dependent signal integration in spines and dendrites. If, for example, buffered diffusion would allow Ca2+ to spread from active spines to neighboring inactive spines, PV could effectively control the spatial extend of heterosynaptic plasticity within dendritic branchlets.
Can PV shuttle Ca2+ between neighboring spines? According to Allbritton et al. (1992), the range of action of free Ca2+ is only ∼0.1 μm (calculated from the diffusion coefficient of Ca2+ (223 μm2 s−1) and the concentration and kinetics of fast endogenous Ca2+ buffers). Free Ca2+, therefore, cannot spread between spines (see also Sabatini et al., 2002). The range of action of buffered Ca2+, on the other hand, can be estimated from the diffusion coefficient (D) of the buffer and the duration (t) of the Ca2+ transient as ∼(2Dt)1/2 (Allbritton et al., 1992). For PV, also the slow Ca2+ binding kinetics (Lee et al., 2000b; Schmidt et al., unpublished data) need to be considered, which delay the onset of PV-dependent Ca2+ buffering by ∼30–100 ms. In spines and dendrites, synaptically evoked Ca2+-transients last for ∼300 ms (Takechi et al., 1998; Sabatini et al., 2002; Schmidt et al., unpublished data). Thus, from the above assumptions and PV's diffusion coefficient of ∼43 μm2 s−1, the range of action of PV-buffered Ca2+ will be ∼4 μm. Given the spine density in PCs (3.4 spines μm−1; Vecellio et al., 2000) this range covers 10–20 spines.
This surprisingly large range of action of PV-bound Ca2+ contrasts with the situation in dendrites of CA1 pyramidal neurons. In these cells, which seem to lack highly mobile Ca2+ buffers, synaptic Ca2+ signals are effectively restricted to active spines (Sabatini et al., 2002). It is tempting to speculate that highly mobile Ca2+ buffers such as PV allow Ca2+ to breach the spine limit and to extend its signaling range to larger functional compartments (Eilers et al., 1995b, 1997). Within these units, inactive synapses will receive a low-pass filtered copy of Ca2+ signals from neighboring spines. Heterosynaptic long-term depression would be a prime target for such signaling because this form of synaptic plasticity typically requires relatively small but long-lasting Ca2+ transients (Lisman, 1989; Hansel et al., 1997; Yang et al., 1999). Thus, by expressing Ca2+-binding proteins with distinct mobilities, neurons could effectively modulate the size of dendritic compartments in which Ca2+-dependent signal integration occurs.
Two-photon FRAP in spines will allow to quantify the mobility of further Ca2+ binding proteins such as calbindin D28k or calretinin as well as of other neuronal proteins. These data will help to validate and to refine models on the spatio-temporal dynamics of cellular signaling cascades.
Acknowledgments
We thank T. Pauls for providing recombinant parvalbumin and Gordon Pipa for useful discussions.
This work was supported by the Deutsche Forschungsgemeinschaft and the Max-Planck-Society (J.E.) and the Swiss National Science Foundation (grant 3100-063448.00/1 to B.S.).
References
- Allbritton, N. L., T. Meyer, and L. Stryer. 1992. Range of messenger action of calcium ion and inositol 1,4,5-trisphosphate. Science. 258:1812–1815. [DOI] [PubMed] [Google Scholar]
- Arrio-Dupont, M., S. Cribier, G. Foucault, P. F. Devaux, and A. d'Albis. 1996. Diffusion of fluorescently labeled macromolecules in cultured muscle cells. Biophys. J. 70:2327–2332. [DOI] [PMC free article] [PubMed] [Google Scholar]
- Baimbridge, K. G., M. R. Celio, and J. H. Rogers. 1992. Calcium-binding proteins in the nervous system. Trends Neurosci. 15:303–308. [DOI] [PubMed] [Google Scholar]
- Berchtold, M. W. 1996. Parvalbumin. In Guidebook to the calcium-binding proteins. Celio, M. R., T. Pauls, and B. Schwaller, editors. Sambrook & Tooze Publication at Oxford University Press. Oxford.
- Brown, E. B., E. S. Wu, W. Zipfel, and W. W. Webb. 1999. Measurement of molecular diffusion in solution by multiphoton fluorescence photobleaching recovery. Biophys. J. 77:2837–2849. [DOI] [PMC free article] [PubMed] [Google Scholar]
- Chard, P. S., D. Bleakman, S. Christakos, C. S. Fullmer, and R. J. Miller. 1993. Calcium buffering properties of calbindin D28k and parvalbumin in rat sensory neurones. J. Physiol. 472:341–357. [DOI] [PMC free article] [PubMed] [Google Scholar]
- Denk, W., D. W. Piston, and W. W. Webb. 1995. Two-photon molecular excitation in laser-scanning microscopy. In: Pawley J. B., editor. Handbook of Biological Confocal Microscopy, 2nd ed. Plenum Press, New York. 445–458.
- Eilers, J., G. J. Augustine, and A. Konnerth. 1995b. Subthreshold synaptic Ca2+ signalling in fine dendrites and spines of cerebellar Purkinje neurons. Nature. 373:155–158. [DOI] [PubMed] [Google Scholar]
- Eilers, J., G. Callewaert, C. Armstrong, and A. Konnerth. 1995a. Calcium signaling in a narrow somatic submembrane shell during synaptic activity in cerebellar Purkinje neurons. Proc. Natl. Acad. Sci. USA. 92:10272–10276. [DOI] [PMC free article] [PubMed] [Google Scholar]
- Eilers, J., H. Takechi, E. A. Finch, G. J. Augustine, and A. Konnerth. 1997. Local dendritic Ca2+ signaling induces cerebellar LTD. Learn. Mem. 3:159–168. [DOI] [PubMed] [Google Scholar]
- Gabso, M., E. Neher, and M. E. Spira. 1997. Low mobility of the Ca2+ buffers in axons of cultured Aplysia neurons. Neuron. 18:473–481. [DOI] [PubMed] [Google Scholar]
- Hansel, C., A. Artola, and W. Singer. 1997. Relation between dendritic Ca2+ levels and the polarity of synaptic long-term modifications in rat visual cortex neurons. Eur. J. Neurosci. 9:2309–2322. [DOI] [PubMed] [Google Scholar]
- Harris, K. M., and J. K. Stevens. 1988. Dendritic spines of rat cerebellar Purkinje cells: serial electron microscopy with reference to their biophysical characteristics. J. Neurosci. 8:4455–4469. [DOI] [PMC free article] [PubMed] [Google Scholar]
- John, L. M., M. Mosquera-Carlo, P. Camacho, and J. D. Lechleiter. 2001. Control of IP3-mediated Ca2+ puffs in Xenopus laevis oocytes by the Ca2+-binding protein parvalbumin. J. Physiol. 535:3–16. [DOI] [PMC free article] [PubMed] [Google Scholar]
- Koch, C. 1999. Biophysics of Computation: Information Processing in Single Neurons. Oxford University Press, Oxford.
- Koester, H. J., D. Baur, R. Uhl, and S. W. Hell. 1999. Ca2+ fluorescence imaging with pico- and femtosecond two-photon excitation: signal and photodamage. Biophys. J. 77:2226–2236. [DOI] [PMC free article] [PubMed] [Google Scholar]
- Kosaka, T., K. Kosaka, T. Nakayama, W. Hunziker, and C. W. Heizmann. 1993. Axons and axon terminals of cerebellar Purkinje cells and basket cells have higher levels of parvalbumin immunoreactivity than somata and dendrites: quantitative analysis by immunogold labeling. Exp. Brain Res. 93:483–491. [DOI] [PubMed] [Google Scholar]
- Kretsinger, R. H., and C. E. Nockolds. 1973. Carp muscle calcium-binding protein. II. Structure determination and general description. J. Biol. Chem. 248:3313–3326. [PubMed] [Google Scholar]
- Lee, S.-H., C. Rosenmund, B. Schwaller, and E. Neher. 2000a. Differences in Ca2+ buffering properties between excitatory and inhibitory hippocampal neurons from the rat. J. Physiol. 525:405–418. [DOI] [PMC free article] [PubMed] [Google Scholar]
- Lee, S.-H., B. Schwaller, and E. Neher. 2000b. Kinetics of Ca2+ binding to parvalbumin in bovine chromaffin cells: implications for [Ca2+] transients of neuronal dendrites. J. Physiol. 525:419–432. [DOI] [PMC free article] [PubMed] [Google Scholar]
- Lisman, J. 1989. A mechanism for the Hebb and the anti-Hebb processes underlying learning and memory. Proc. Natl. Acad. Sci. USA. 86:9574–9578. [DOI] [PMC free article] [PubMed] [Google Scholar]
- Luby-Phelps, K., M. Hori, J. M. Phelps, and D. Won. 1995. Ca2+-regulated dynamic compartmentalization of calmodulin in living smooth muscle cells. J. Biol. Chem. 270:21532–21538. [DOI] [PubMed] [Google Scholar]
- Majewska, A., E. Brown, J. Ross, and R. Yuste. 2000a. Mechanisms of calcium decay kinetics in hippocampal spines: role of spine calcium pumps and calcium diffusion through the spine neck in biochemical compartmentalization. J. Neurosci. 20:1722–1734. [DOI] [PMC free article] [PubMed] [Google Scholar]
- Majewska, A., A. Tashiro, and R. Yuste. 2000b. Regulation of spine calcium dynamics by rapid spine motility. J. Neurosci. 20:8262–8268. [DOI] [PMC free article] [PubMed] [Google Scholar]
- Maughan, D. W., and R. E. Godt. 1999. Parvalbumin concentration and diffusion coefficient in frog myoplasm. J. Muscle Res. Cell Motil. 20:199–209. [DOI] [PubMed] [Google Scholar]
- Meinrenken, C. J., J. G. Borst, and B. Sakmann. 2002. Calcium secretion coupling at calyx of held governed by nonuniform channel-vesicle topography. J. Neurosci. 22:1648–1667. [DOI] [PMC free article] [PubMed] [Google Scholar]
- Nägerl, U. V., D. Novo, I. Mody, and J. L. Vergara. 2000. Binding kinetics of calbindin-D28k determined by flash photolysis of caged Ca2+. Biophys. J. 79:3009–3018. [DOI] [PMC free article] [PubMed] [Google Scholar]
- Naraghi, M., and E. Neher. 1997. Linearized buffered Ca2+ diffusion in microdomains and its implications for calculation of [Ca2+] at the mouth of a calcium channel. J. Neurosci. 17:6961–6973. [DOI] [PMC free article] [PubMed] [Google Scholar]
- Nowycky, M. C., and M. J. Pinter. 1993. Time courses of calcium and calcium-bound buffers following calcium influx in a model cell. Biophys. J. 64:77–91. [DOI] [PMC free article] [PubMed] [Google Scholar]
- Pusch, M., and E. Neher. 1988. Rates of diffusional exchange between small cells and a measuring patch pipette. Pflügers Arch. 411:204–211. [DOI] [PubMed] [Google Scholar]
- Rexhausen, U. 1992. Bestimmung der Diffusionseigenschaften von Fluoreszenzfarbstoffen in verzweigten Nervenzellen unter Verwendung eines rechnergesteuerten Bildverarbeitungssystems. University of Göttingen, Diploma thesis.
- Roberts, W. M. 1993. Spatial calcium buffering in saccular hair cells. Nature. 363:74–76. [DOI] [PubMed] [Google Scholar]
- Roth, A., and M. Häusser. 2001. Compartmental models of rat cerebellar Purkinje cells based on simultaneous somatic and dendritic patch-clamp recordings. J. Physiol. 535:445–472. [DOI] [PMC free article] [PubMed] [Google Scholar]
- Rozov, A., N. Burnashev, B. Sakmann, and E. Neher. 2001. Transmitter release modulation by intracellular Ca2+ buffers in facilitating and depressing nerve terminals of pyramidal cells in layer 2/3 of the rat neocortex indicates a target cell-specific difference in presynaptic calcium dynamics. J. Physiol. 531:807–826. [DOI] [PMC free article] [PubMed] [Google Scholar]
- Sabatini, B. L., T. G. Oertner, and K. Svoboda. 2002. The life cycle of Ca2+ ions in dendritic spines. Neuron. 33:439–452. [DOI] [PubMed] [Google Scholar]
- Sala, F., and A. Hernández-Cruz. 1990. Calcium diffusion modeling in a spherical neuron. Relevance of buffering properties. Biophys. J. 57:313–324. [DOI] [PMC free article] [PubMed] [Google Scholar]
- Schwaller, B., J. Dick, G. Dhoot, S. Carroll, G. Vrbova, P. Nicotera, D. Pette, A. Wyss, H. Bluethmann, W. Hunziker, and M. R. Celio. 1999. Prolonged contraction-relaxation cycle of fast-twitch muscles in parvalbumin knockout mice. Am. J. Physiol. 276:C395–C403. [DOI] [PubMed] [Google Scholar]
- Špaček, J. 1985. Three-dimensional analysis of dendritic spines. II. Spine apparatus and other cytoplasmic components. Anat. Embryol. 171:235–243. [DOI] [PubMed] [Google Scholar]
- Špaček, J., and M. Hartmann. 1983. Three-dimensional analysis of dendritic spines. I. Quantitative observations related to dendritic spine and synaptic morphology in cerebral and cerebellar cortices. Anat. Embryol. 167:289–310. [DOI] [PubMed] [Google Scholar]
- Star, E. N., D. J. Kwiatkowski, and V. N. Murthy. 2002. Rapid turnover of actin in dendritic spines and its regulation by activity. Nat. Neurosci. 5:239–246. [DOI] [PubMed] [Google Scholar]
- Svoboda, K., D. W. Tank, and W. Denk. 1996. Direct measurment of coupling between dendritic spines and shafts. Nature. 272:716–719. [DOI] [PubMed] [Google Scholar]
- Takechi, H., J. Eilers, and A. Konnerth. 1998. A new class of synaptic responses involving calcium release in dendritic spines. Nature. 396:757–760. [DOI] [PubMed] [Google Scholar]
- Tang, Y., T. Schlumpberger, T. Kim, M. Lueker, and R. S. Zucker. 2000. Effects of mobile buffers on facilitation: experimental and computational studies. Biophys. J. 78:2735–2751. [DOI] [PMC free article] [PubMed] [Google Scholar]
- Tansey, M. G., K. Luby-Phelps, K. E. Kamm, and J. T. Stull. 1994. Ca2+-dependent phosphorylation of myosin light chain kinase decreases the Ca2+ sensitivity of light chain phosphorylation within smooth muscle cells. J. Biol. Chem. 269:9912–9920. [PubMed] [Google Scholar]
- Vecellio, M., B. Schwaller, M. Meyer, W. Hunziker, and M. R. Celio. 2000. Alterations in Purkinje cell spines of calbindin D-28k and parvalbumin knock-out mice. Eur. J. Neurosci. 12:945–954. [DOI] [PubMed] [Google Scholar]
- Yang, J., S. McBride, D.-O. D. Mak, N. Vardi, K. Palczewski, F. Haeseleer, and J. K. Foskett. 2002. Identification of a family of calcium sensors as protein ligands of inositol trisphosphate receptor Ca2+ release channels. Proc. Natl. Acad. Sci. USA. 99:7711–7716. [DOI] [PMC free article] [PubMed] [Google Scholar]
- Yang, S. N., Y. G. Tang, and R. S. Zucker. 1999. Selective induction of LTP and LTD by postsynaptic [Ca2+]i elevation. J. Neurophysiol. 81:781–787. [DOI] [PubMed] [Google Scholar]
- Zhou, Z., and E. Neher. 1993. Mobile and immobile calcium buffers in bovine chromaffin cells. J. Physiol. 469:245–273. [DOI] [PMC free article] [PubMed] [Google Scholar]