Abstract
Pattern formation in 3D random media has been a topic of interest in soft matter and biological systems. However, the onset of long-range microscopic ordering has not been explored in randomly moving self-propelled particles due to a lack of model systems as well as local probe techniques. In this article, we report on a novel experiment, using motile Escherichia coli bacteria as a model system, to study the onset of dynamic correlation and collective movement in three-dimension. We use fluctuation of an optically trapped micron-size bead as a detector of correlated bacterial motion, and further study this behavior by analyzing the motility of fluorescent bacteria in a confocal volume. We find evidence of dynamic correlation at very low volume fractions (0.01). We show that the magnitude of this correlation strongly depends on the interbacterial distances and their coupling modes. This opens up possibilities to probe long-range pattern formation in actively propelled cells or organisms coupled through hydrodynamics and/or chemical signaling.
INTRODUCTION
Cell movement is ubiquitous in nature. A variety of inter- and intracellular signaling mechanisms underlie collective cell movement, which is a topic of intense current interest (Bray, 2002). The physical origins of fluid dynamics and chemical coupling between actively moving cells are poorly understood. This is a generic problem of active motion leading to long-range ordering, for example, birds in flight, a swarm of fish, or bacterial cells swimming together (Pedley and Kessler, 1992). Theoretical approaches for long-range ordering have also been explored (Berg, 2000; Grégoire et al., 2001; Jeremy et al., 1996; Nasseri and Phan-Thien, 1997; Toner and Tu, 1998). The motility and the chemotactic signaling mechanism of bacteria have been well characterized and serve as a good model system to address aspects of long-range ordering (Berg, 2000). A typical Escherichia coli bacterial cell is ∼1 μm in diameter and 3 μm in length, and has a mass of ∼1 pg. Viscous forces dominate the motion of bacteria due to its very low Reynold's number of ∼10−4 (Purcell, 1977). Bacterial dynamics are characterized as tumbling and running. Under homogenous external chemical signal concentration, bacteria run with a mean velocity of 20 μm/s, with exponentially distributed run lengths and mean time of 1-s runtime. They change direction randomly by tumbling, which has a mean duration of 0.1 s (Berg, 1996; Berg, 2000). In an interesting recent experiment, Wu and Libchaber (2000) analyzed active bacterial motion in quasi two-dimension and observed an anomalous diffusion, which they attributed to the collective dynamics of bacteria.
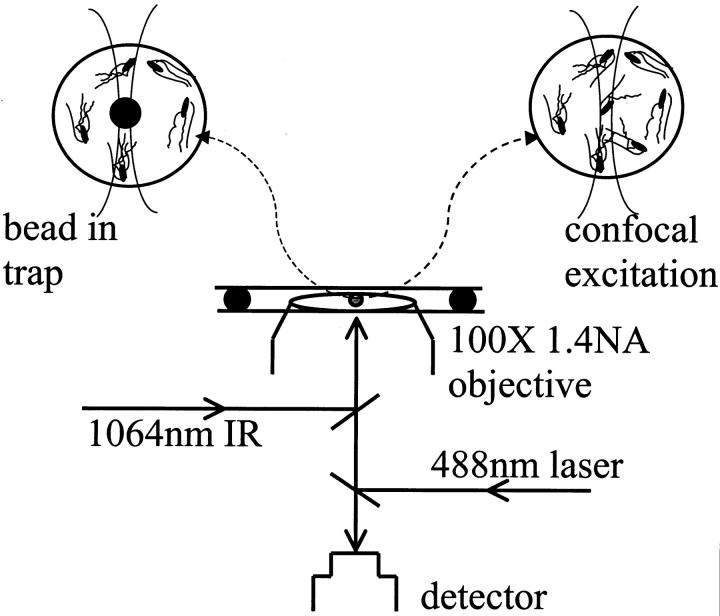
In this article, we probe these active processes using an optically localized bead (Ashkin, 1997) and measure the local ordering in the bacterial bath at different percentage volume fraction (φ) 0.1, 0.01, and 0.001 corresponding to mean interbacterial spacing of 10, 21, and 46 μm respectively. This allows us to measure the onset of correlation in bacterial dynamics in three dimensions. The above cooperative dynamics was further studied using confocal fluorescence detection (Webb et al., 2001). In particular, we present experiments as shown in Fig. 1, on 1), single particle tracking of an optically trapped polystyrene 3-μm diameter bead in the presence of active (motile) bacteria at various concentrations, and 2), observing single fluorescent bacterial motion, at various volume fractions, through a 3.12-μm diameter confocal excitation volume, which is much smaller than the mean run length. In the above experiments, we analyze the time series of Brownian fluctuations of the trapped bead and fluorescence intensity fluctuations with and without bacteria. From these experiments we are able to distinguish the subtle differences between thermal and active processes leading to correlated bacterial dynamics and the role of chemical signaling.
FIGURE 1.
Schematic of the experiment: (a) an optically trapped bead is used to track the effect bacterial dynamics; and (b) a confocal fluorescence detection is used to monitor the fluorescence intensity fluctuations of EGFP-transformed bacterial dynamics.
MATERIAL AND METHODS
Sample preparation
The motile strain of E. coli RP437 was transformed (insertion of plasmid DNA, with gene of interest, into the bacteria) with a plasmid having enhanced green fluorescent protein (EGFP) gene driven by lac promoter (pUC origin, ampicillin resistance), for fluorescence measurements and imaging. Cells taken from plates were grown in 120-ml LB media for 18 h at 25°C. Cells were visually checked for their motile behavior, centrifuged at 5500 rpm for 20 min at 4°C and resuspended in motility buffer (MB, 10 mM KH2PO4, 67 mM NaCl, 0.1 mM EDTA and 0.1% glycerol) to the required concentration. Cells were incubated, at room temperature, in the motility buffer for 30 min before the experiments. Measurements were carried out at room temperature, at three different bacterial concentrations 107, 108, and 109 cells/ml. Sample cell volume was confined to ∼120 μl in a circular well of depth 1.5 mm made of neoprene O-rings between two cover slips. Both the optical trap and the fluorescence correlation spectroscopy (FCS) experiments were carried on the same batch of samples and at 5 μm above the cover slip. The concentration of the Verapimil drug in our experiment, used to inhibit bacterial chemotaxis and motility, was based on the values reported in the literature (Tisa et al., 2000).
Experimental setup and data acquisition
The schematic of the experimental setup is shown in Fig. 1. The optical tweezer was set up by focusing an infrared laser (Nd-Yag, 1064 nm, 200 mW from Coherent, Santa Clara, CA) beam to a diffraction-limited focus using an objective lens (100×, N.A 1.4, Olympus, Japan). A red diode laser (5 mW, 635 nm, Thorlabs, Newton, NJ) was aligned coaxial to infrared for tracking the bead in the trap using back-scattered light collected on a quadrant detector (Shivashankar et. al., 1998). In confocal fluorescence measurements, a 488-nm laser (Ar-Ion, 50 mW from Spectra Physics, Mountain View, CA) was used to excite the fluorescent bacterial cells, and their emission signal was detected in a confocal arrangement (3.12-μm diameter detection volume, characterized by measuring the diffusion constant of 1-μm fluorescent bead). An avalanche photo detector (EG&G, Gaithersburg, MD) and a photon counter (SR400, Stanford Research Systems, Sunnyvale, CA) were used for photodetection. The time series of the trapped bead fluctuations and intensity fluctuations in the confocal volume was obtained using onboard DAQ (data acquisition card AT-MIO-16EX10) and Labview software (National Instruments, Austin, TX). Each measurement of autocorrelation function (ACF) constitutes an average of 10 independent runs repeated on the same sample and more than five sets of experiments were performed on samples drawn from independent cultures. The statistical autocorrelation of the time series give values between +1 and −1. In confocal fluorescence experiments, the intensity fluctuation time series was recorded with a 1-ms bin time for 50 s. Each experiment lasted for ∼2 h from the time of resuspension of cells in motility buffer. The motility buffer does not favor bacterial growth and thus the cell number remains unchanged. We have also confirmed, by microscopy, that the morphology is not changed during the experiment.
INSTRUMENTATION AND CALIBRATION
Optical trap characterization
To characterize our optical trap in both frequency and time domain, we calculate the solvent viscosity η (Pralle et al., 1998). The equation of motion of a particle in an optical trap is given by,  and
and  where k is the trap stiffness and f(t) is the thermal noise and γ is the stokes coefficient given by γ = 6πηa, a being the bead radius. The power spectral density (PSD) is given by,
 |
where fc = k/2πγ, is the corner frequency of the PSD (Gittes and Schmidt, 1998). In Fig. 4 inset, we get fc = 9.64 Hz by fitting the Lorentzian to the frequency range 5–100 Hz, which gives k200 = 1.7 × 10⁻⁶ N/m for a 200-mW output power of the laser. Laser power after the objective lens was 5 mW giving a low trapping stiffness, which is required to measure small forces. The inverse Fourier transform of PSD, gives the autocorrelation function (ACF),  where τ1 = γ/k is the characteristic decay time. From the above equation, we can relate, fc = 1/(2πτ1). From our ACF measurement, τ1 = 0.0165 s for a 3-μm bead trapped in water. To obtain the timescale, the ACF is normalized to give values between 1 and −1 and then fitted with single exponential (or double exponential in the case of bacteria). Using fc and τ1 for a trapped bead and correcting for the height of the bead (Lorentz formula, Happel and Brenner, 1983), d = 5 μm from the cover slip, we get the viscosity
 |
of water as 0.8 × 10⁻³ Nm−2 s. In the presence of bacteria, the equation of motion of the trapped bead is given by  where the force term F (x, t) reflects the effect of bacterial kicks.
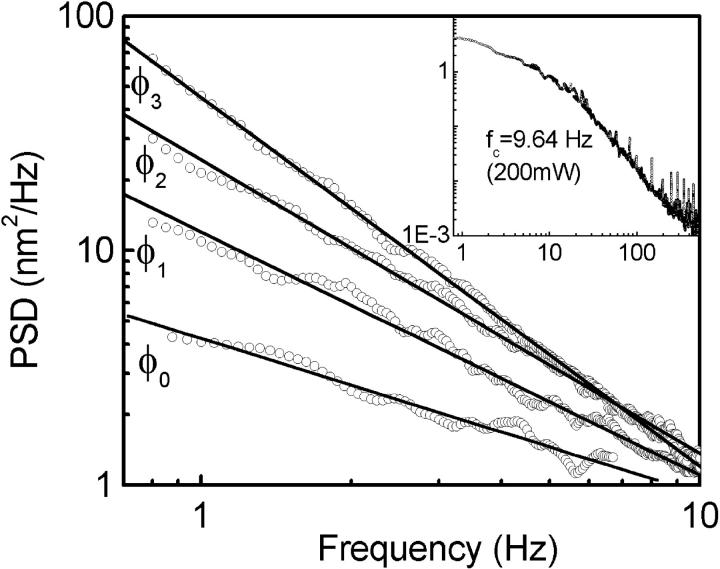
FIGURE 4.
(A) The PSD of trapped bead fluctuations using the 200-mW laser trap is plotted against frequency (f < fc), with and without bacteria at different concentrations as shown. The solid lines are the linear fits in the white noise regime. Inset shows the PSD for φ = 0, for full frequency range to deduce the corner frequency.
RESULTS AND DISCUSSION
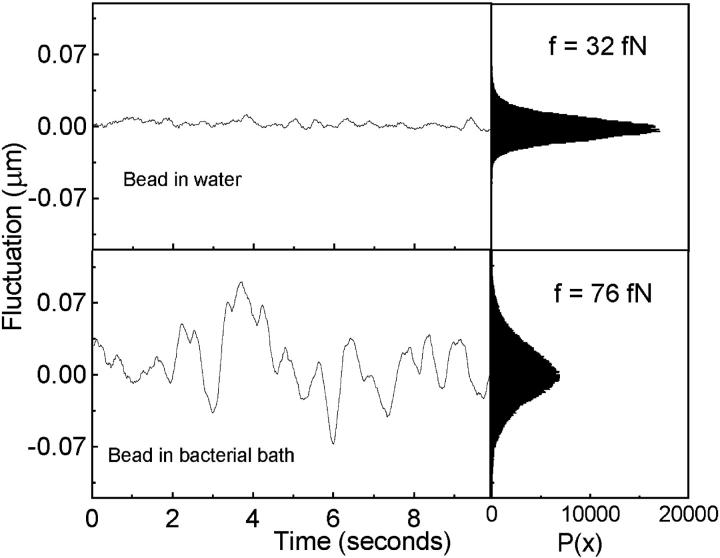
The effect of bacterial movement on bead fluctuations is plotted in Fig. 2 (for φ = 0.1). For clarity the time series is plotted for a 10-s interval where one sees enhanced bead fluctuations due to bacterial dynamics. The histogram plots give the fluctuation statistics of the complete time series. In the case of an optical tweezer, the bead fluctuation characterizes the trap as well as the randomness of the local environment (Meiners and Quake, 1999). Bead fluctuations originate due to thermal agitation, single bacteria-bead collisions as well as continuous hits from the ordered bacterial structures leading to distinct timescales of such interactions, in terms of the distribution in peak widths. This suggests that the local bead-bacteria interactions (at large bacterial concentrations) are not random but spatially correlated. Using the trap stiffness, k200 = 1.7 × 10⁻⁶ N/m for 200-mW laser power, we estimate the net mean force imparted on the bead by the bacterial bath and Langevin thermal kicks to be 76 fN (φ = 0.1) as compared to only the Langevin forces of ∼32 fN.
FIGURE 2.
Time series of the 3-μm trapped bead fluctuations with and without bacteria. For clarity the time series is plotted for a 10-s interval whereas the corresponding histograms are for 100-s intervals.
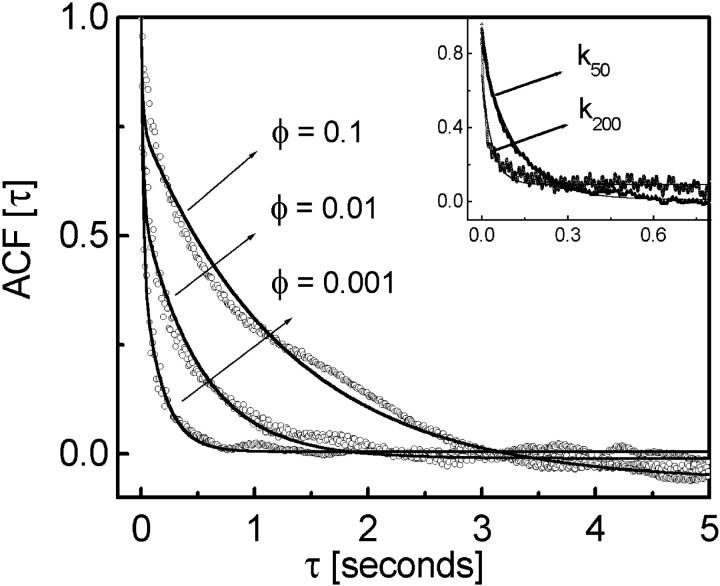
In Fig. 3, we plot the position autocorrelation function (ACF) of the bead fluctuations as a function of bacterial concentration to probe the timescales of bead-bacteria collisions. We analyze our ACF data, by fitting with different exponential functions to separate the timescales arising due to thermal fluctuations and correlated motion. In the zero bacteria case, as expected, the ACF fits to  where τ1 = 0.0165 s (for trap stiffness k200) is the correlation time due to passive diffusion. In the presence of bacteria, the ACF data were best fitted to
  where we fix A1 + A2 = 1 and τ1 = 0.0165 s. The correlation due to active movement was measured as a second timescale in the autocorrelation τ2, which increases with the concentration of bacteria (φ = 0.001, 0.01, and 0.1 corresponding to τ2 = 0.175, 0.508, and 1.281 s, respectively). From the fits we obtain the relative strength of τ2 to be A2 = 0.433, 0.577, and 0.817 for φ = 0.001, 0.01, and 0.1 respectively. τ2 is a direct measure of the correlated motion and gives the magnitude of effective dynamic viscosity,
 |
due to active motion of bacteria. In the inset to Fig. 3, we plot the ACF of bead fluctuation in water at two different trapping stiffness and their single exponential fits (k200 = 1.7 × 10⁻⁶ for 200 mW and k50 = 0.3 × 10⁻⁶ N/m for 50-mW laser power with corresponding τ1 = 0.0165 and 0.0965 s.), showing that τ2 is not due to an effective increase in temperature ( ) arising from the bacterial bath.
FIGURE 3.
The autocorrelation function of the trapped bead fluctuations with their double exponential fits (solid line) is plotted for different motile bacterial concentration φ = 0.001, 0.01, and 0.1 using the 200-mW laser trap with k200 = 1.7 × 10⁻⁶ N/m. (Inset) Single exponential fit to the ACF of trapped bead fluctuations without bacteria is shown at k200 and k50.
We plot in Fig. 4, the PSD of the time series for φ = 0, 0.001, 0.01, and 0.1 at k200. The PSD of bead fluctuations in water is characterized by a Lorentzian function (see Material and Methods), where different trapping stiffness corresponds to different corner frequencies (fc) with no changes in the white noise. We obtain, for k200 and k50, slopes of −0.66 and −0.63 for f < fc (white noise regime), and −2 for f > fc. In the presence of bacteria, we find an increase in slope for f < fc (slope = −0.66, −1.04, −1.25, and −1.57 for φ = 0, 0.001, 0.01, and 0.1 respectively, at k200). This deviation from white noise in the low frequency (large timescales) regime suggests a transition from random to correlated bead fluctuations. However, we are still unclear about the analytical form of this correlation.
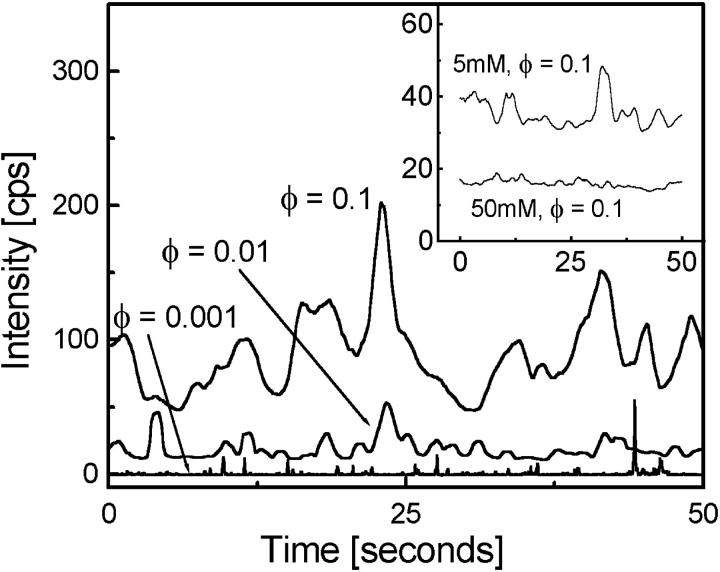
To directly capture the bacterial dynamics in real time, we measured the intensity fluctuations from fluorescent bacteria crossing the confocal detection volume (Fig. 1). The fluorescence time series, plotted in Fig. 5, is used to analyze the coupling modes (hydrodynamic and/or chemical signaling) that lead to coherent bacterial dynamics. At φ = 0.001, we clearly see distinct peaks arising due to individual bacterial movement and at larger φ (φ = 0.01 and 0.1) the width of peaks are broadened as clusters of bacteria (coherent structures) cross the excitation volume. To separate the coupling mechanisms in correlated bacterial dynamics, we used the drug Verapimil. This drug blocks calcium channels located on the bacterial cell membrane. At low concentration (5 mM) the drug inhibits the chemical signaling network and at high concentration (50 mM) reduces bacterial motility (Tisa et al., 2000). These effects are clearly manifested, in the inset to Fig. 5, at 5-mM and 50-mM drug concentrations for φ = 0.1. We observe a gradual reduction in the number of broad peaks, suggesting that at low concentration of 5 mM, there is a loss of chemical coupling and at high concentration of 50 mM, a loss of hydrodynamic coupling in the microscopic ordering. However, the bacterial cells, upon Verapimil drug treatment, releases chemicals that make the quantitative measurements and analysis difficult in the presence of drugs.
FIGURE 5.
The fluorescence fluctuation time series for different bacterial concentrations is plotted. As the volume fraction increases, large-scale structures crossing the confocal volume are clearly seen. Inset to the figure shows time series with 5-mM and 50-mM drug concentrations, respectively. Structures disappear with increasing drug concentration emphasizing the role of chemical signaling in local ordering of moving bacteria. The time series are mean shifted by 10 counts for φ = 0.01, 20 counts for φ = 0.1, 20 counts for 5 mM, φ = 0.1 data for clarity.
CONCLUSIONS
In conclusion, we have directly measured the onset of dynamic correlation in randomly moving self-propelled particles. Using single particle tracking methods and tuning the mean interbacterial distance, comparable to their mean run lengths, we measured the correlation time scales. The magnitude of the dynamic viscosity in the bacterial bath was determined by separating the thermal and active correlation timescales in the trapped bead fluctuations. We propose that long-ranged pattern formation in chemotactic and motile bacterial bath may be strongly modulated by chemical signaling in addition to hydrodynamic coupling. Our results have implications in understanding localized microscopic ordering mechanisms in self-propelled organisms involving chemical signaling and hydrodynamic coupling modes.
Acknowledgments
We thank A. Libchaber and S. Ramaswamy for useful discussions and John S. Parkinson, University of Utah, Salt Lake City, Utah USA for providing us with the bacterial strains.
B. M. Jaffar Ali's present address is AU-KBC Research Center, Anna University, Chennai 600 044 India.
References
- Ashkin, A. 1997. Optical trapping and manipulation of neutral particles using lasers. Proc. Natl. Acad. Sci. USA. 94:4853–4860. [DOI] [PMC free article] [PubMed] [Google Scholar]
- Bray, D. 2002. Cell Movements: From Molecules to Motility. Garland Science Publishing, New York.
- Berg, H. C. 1996. Symmetries in bacterial motility. Proc. Natl. Acad. Sci. USA. 93:14225–14228. [DOI] [PMC free article] [PubMed] [Google Scholar]
- Berg, H. C. 2000. Motile behavior of bacteria. Phys. Today. 53:24–29. [Google Scholar]
- Gittes, F., and C. F. Schmidt. 1998. Laser Tweezers in Cell Biology, Methods in Cell Biology. M. P. Sheetz, editor. Vol. 55, Ch. 8. Academic Press, San Diego. 129–156.
- Grégoire, G., Chaté, H., and Y. Tu. 2001. Active and passive particles: modeling beads in a bacterial bath. Phys. Rev. E. 64:011902-1–7. [DOI] [PubMed] [Google Scholar]
- Happel, J., and H. Brenner. 1983. Low Reynolds Number Hydrodynamics: With Special Applications to Particulate Media. M. Nijhoff, editor. Kluwer Press, Dordrecht, The Netherlands.
- Jeremy, S., M. H. Andrew, and S. A. Rice. 1996. Dynamics of quasi two-dimensional colloidal systems. J. Phys. Chem. 100:18950–18961. [Google Scholar]
- Meiners, J. C., and S. R. Quake. 1999. Direct measurement of hydrodynamic cross-correlations between two particles in an external potential. Phys. Rev. Lett. 82:2211–2214. [Google Scholar]
- Nasseri, S., and N. Phan-Thien. 1997. Hydrodynamic interaction between two nearby swimming micromachines. Computational Mechanics. 20:551–559. [Google Scholar]
- Pedley, T. J., and J. O. Kessler. 1992. Hydrodynamic phenomena in suspensions of swimming microorganisms. Annu. Rev. Fluid Mech. 24:313–358. [Google Scholar]
- Pralle, A., E. L. Florin, E. H. K. Stelzer, and J. K. H. Horber. 1998. Local viscosity probed by photonic force microscopy. Applied Physics A. 66:S71–S73. [Google Scholar]
- Purcell, E. M. 1977. Life at low Reynolds number. Am. J. Phys. 45:3–11. [Google Scholar]
- Shivashankar, G. V., G. Stolovitzky, and A. Libchaber. 1998. Backscattering from a tethered bead as a probe of DNA flexibility. Appl. Phys. Lett. 73:291–293. [Google Scholar]
- Tisa, L. S., J. J. Sekelsky, and J. Adler. 2000. Effects of organic antagonists of Ca2+, Na+ and K+ on chemotaxis and motility in Esterichia Coli. J. Bacteriol. 182:4856–61. [DOI] [PMC free article] [PubMed] [Google Scholar]
- Toner, J., and Y. Tu. 1998. Flocks, herds, and schools: a quantitative theory of flocking. Phys. Rev. E. 58:4828–4858. [Google Scholar]
- Webb, W. W. 2001. Fluorescence Correlation Spectroscopy: Theory and Application. R. Riger and E. L. Elson, editors. Springer Series in Chemical Physics, Vol. 65, Ch. 14. Springer-Verlag, Heidelberg.
- Wu, X. L., and A. Libchaber. 2000. Particle diffusion in a quasi-two-dimensional bacterial bath. Phys. Rev. Lett. 84:3017–3020. [DOI] [PubMed] [Google Scholar]


