

Abstract
The demarcation membrane system (DMS) is the precursor of platelet cell membranes yet little is known of its properties in living megakaryocytes. Using confocal microscopy, we now demonstrate that demarcation membranes in freshly isolated rat marrow megakaryocytes are rapidly stained by styryl membrane indicators such as di-8-ANEPPS and FM 2-10, confirming that they are invaginations of the plasma membrane and readily accessible from the extracellular space. Two-photon excitation of an extracellular indicator displayed the extensive nature of the channels formed by the DMS throughout the extranuclear volume. Under whole-cell patch clamp, the DMS is electrophysiologically contiguous with the peripheral plasma membrane such that a single capacitative component can account for the biophysical properties of all surface-connected membranes in the majority of recordings. Megakaryocyte capacitances were in the range of 64–694 pF, equivalent to 500–5500 platelets (mean value 1850). Based upon calculations for a spherical geometry, the DMS results in a 4- to 14-fold (average 8.1-fold) increase in specific membrane capacitance expressed per unit spherical surface area. This indicates a level of plasma membrane invagination comparable with mammalian skeletal muscle. Whole-cell capacitance measurements and confocal imaging of membrane-impermeant fluorescent indicators therefore represent novel approaches to monitor the DMS during megakaryocytopoiesis and thrombopoiesis.
INTRODUCTION
During megakaryocytopoiesis the demarcation membrane system (DMS) develops to provide additional membrane for the formation of platelets (Kautz and De Marsh, 1955; Yamada, 1957; Nakao and Angrist, 1968; Behnke, 1968; Cramer, 1999; Kaushansky, 1999). Despite the importance of platelets for thrombosis and hemostasis, very little is known about the physical properties of the DMS in resting megakaryocytes (MKs) and its reorganization during platelet production. Although some studies have suggested that the DMS is a specialization of the endoplasmic reticulum, the Golgi apparatus (Han and Baker, 1964), or an entirely separate membrane system (Yamada, 1957), most electron microscopic evidence is consistent with a close association between the DMS and the plasma membrane (MacPherson, 1972; Behnke, 1968; Shaklai and Tavassoli, 1978) (for review see Leven (1987)). There has been significant debate over the series of events that results in formation of platelets from the DMS and MK cytoplasm during thrombopoiesis. In one model, the DMS simply divides areas of the cytoplasm into future platelets, which are released after fragmentation of the MK cytoplasm (Breton-Gorius and Reyes, 1976; Paulus et al., 1979; Tavassoli, 1980). In an alternative and currently more favored model, the DMS acts as a reserve of membrane which evaginates to form long processes, termed proplatelets, which release platelets along their length (Radley and Haller, 1982) or only at their tip (Italiano et al., 1999). It has also been suggested that blebbing of the MK surface represents the pinching off of individual platelets (Chen and Barnhart, 1984), however these blebs lack organelles and therefore their role is uncertain (see Leven (1987) and White (1989) for reviews).
To date, studies of the DMS have depended upon electron microscopy of fixed specimens (Behnke, 1968; Shaklai and Tavassoli, 1978). These have provided significant information on MK ultrastructure but do not allow studies of the real-time dynamics of morphological responses within the DMS or permit easy quantification of its development. There is also concern over fixation artifacts in these hyperactive cells (MacPherson, 1972; White, 1989). We now demonstrate the use of impermeant fluorescent membrane indicators and whole-cell membrane capacitance to image and quantify demarcation membranes in living MKs. Furthermore, we have examined for the first time the relationship between membrane invagination, that is the extent of DMS development, and cell size.
MATERIALS AND METHODS
Cell preparation and salines
Adult male Wistar rats were killed by exposure to a rising concentration of CO2 followed by cervical dislocation. Suspensions of marrow cells were prepared from the femoral and tibial bones as described elsewhere (Mahaut-Smith et al., 1999). MKs were distinguished by their large size compared to other marrow cells. Human erythroleukemia (HEL) cells were obtained from the European Collection of Animal Cell Culture (Porton Down, Salisbury, UK) and cultured as described previously (Somasundaram et al., 1997). The external saline used in all recordings consisted of (in mM) 145 NaCl, 5 KCl, 1 CaCl2, 1 MgCl2, 10 HEPES, 10 glucose, titrated to pH 7.35 with NaOH. To reduce activation by spontaneously released nucleotides, 0.32 units ml−1 type VII apyrase was added to the external saline throughout isolation and maintenance of marrow cells but was omitted during experiments.
Reagents
Di-8-ANEPPS, FM 2-10, Hoescht 33258, and Oregon Green 488 BAPTA-1 were obtained from Molecular Probes (Leiden, The Netherlands). All other reagents were from Sigma-Aldrich, Dorset, UK). Di-8-ANEPPS and FM 2-10 were made as stock solutions of 2.5 mM in dimethylsulfoxide and 10 mM in methanol, respectively, and were diluted into saline immediately before an experiment.
Confocal fluorescence recordings
Single-photon confocal fluorescence images were collected using a Zeiss LSM 510 (Carl Zeiss Ltd, Welwyn Garden City, UK) coupled to an inverted microscope (Zeiss Axiovert 100). Di-8-ANEPPS and FM dyes were excited at 488 nm and emission collected at >505 nm. Hoescht 33258 was excited at 364 nm and emission collected at >385 nm. Two-photon confocal fluorescence measurements were made using a Leica TCS-SP-MP with excitation from a solid-state Millenia V-pumped Tsunami TI/sapphire laser tuned to 797–800 nm. Emission bandwidth was optimized using a spectrophotometer detector and was in the range of 500–700 nm. Cells were exposed to FM 2-10 (50 μM) using a gravity-fed superfusion system. Di-8-ANEPPS (final concentration 10 μM) was added to the recording chamber from a solution of ≤50 μM in external saline. The dye was pipetted away from the region of interest and mixed as vigorously as possible without disturbing the cells. For fluorescence measurement of membrane potential, di-8-ANEPPS signals were background subtracted, corrected for photobleach, and expressed as f/f0 ratios to normalize fluorescence levels (f) to starting fluorescence (f0).
Electrophysiological recordings
Conventional whole-cell patch clamp recordings were performed using an Axopatch 200A or B clamp amplifier with a headstage gain of 0.1 or 1.0 (Axon Instruments, Union City, CA) (Hussain and Mahaut-Smith, 1998; Mahaut-Smith et al., 1999). In MKs where the capacitative transient in response to a 5- or 10-mV voltage step decayed with a single exponential, membrane capacitance was measured by one of two methods. In the first, the capacitative transient was acquired to disk via a Digidata 1200 acquisition system and pClamp 6 software (Axon Instruments) at 25–200 kHz and the integral of the current transient used to calculate charge and thus membrane capacitance (Adrian and Almers, 1974). In the second method, the whole-cell capacitance and series resistance compensation facility of the amplifier were used to completely eliminate the current transient and cell capacitance read directly from the dial. The capacitance settings for each amplifier were calibrated in open circuit by measurement of the charge required for a 10-mV voltage step and a correction equation applied to all dial measurements of cell capacitance. Estimates of capacitance using both methods in the same cell differed by 2.9 ± 2.2% (mean ± SD, n = 6). A transmitted light image of cells under whole-cell patch clamp was captured on a Cohu CCD camera or the transmitted light detector of the Zeiss LSM 510 and average cell diameter assessed from measurements at two perpendicular planes. Cell surface area was calculated assuming a spherical geometry. The internal saline contained (in mM) 150 KCl, 2 MgCl2, 0.1 EGTA, 0.05 Na2GTP, 10 HEPES, and either 0.05 K5fura-2, 0.05 (NH4)5fluo-3, or 0.05 K6Oregon Green 488 BAPTA-1, titrated to pH 7.2 with KOH. Curve fitting was performed using Microcal Origin v5.0 (Microcal Software Inc., Northampton, MA). Statistical values are given as the means ± SD of the mean for the specified number (n) of measurements. Linear regression coefficients, r, were considered to be significant when p < 0.01. All experiments were conducted at the ambient temperature (20–25°C).
RESULTS
Styryl dyes label the megakaryocyte DMS
Based upon the observation that the DMS in fixed cells is accessible from the extracellular space (Nakao and Angrist, 1968; Behnke, 1968), we investigated the extent to which bath-applied membrane indicators could label demarcation membranes in freshly isolated rat MKs. Under confocal examination, 10-μM di-8-ANEPPS labeled small marrow cells as a simple halo confirming a lack of plasma membrane invaginations (Fig. 1 i). In contrast, the staining pattern of MKs clearly indicated surface-connected membranes penetrating deep into the cell (Fig. 1 ii). Di-8-ANEPPS fluorescence was detectable throughout the majority of the extranuclear volume of the MK as shown by colabeling with the double stranded DNA-specific indicator, Hoescht 33258 (Fig. 2). A narrow dye-free zone separated the peripheral plasma membrane and underlying surface-accessible membrane (see expanded rectangular area, Fig. 2). This gap was occasionally bridged by a narrow band of fluorescence (arrow). The level of di-8-ANEPPS staining of both peripheral and invaginated plasma membranes continued to increase throughout the period of exposure (5–30 min in these experiments) and was irreversible upon washing (Fig. 3), as predicted from the properties of this dye reported in other cells (Bedlack et al., 1992; Rohr and Salzberg, 1994). The initial pattern of di-8-ANEPPS staining displayed marked heterogeneity in different MKs, ranging from an immediate labeling of membranes throughout the extranuclear volume (23 out of 36 cells), to an initial halo pattern followed by a slower staining of deeper membranes. The extensive staining of MKs by di-8-ANEPPS did not result from rapid endocytosis as the lower affinity styryl indicator, FM 2-10 (Klingauf et al., 1998) reversibly stained with a similar pattern (Fig. 4; see also video in the supplementary material available at http://www.biophysj.org/content/vol84/issue4/). In MKs exposed to 50 μM FM 2-10 for less than 9 min, 4 ± 1% (SD n = 6) of the cell-dependent peak fluorescence remained after a 6-min wash. As observed for di-8-ANEPPS, the initial FM 2-10 pattern appeared as a halo in the minority (five out of 22) of MKs before the labeling of deeper surface-connected membranes. Taken together, these data show that the DMS is readily accessible from the extracellular space and that di-8-ANEPPS and FM 2-10 are irreversible and reversible indicators, respectively, of this membrane system.
FIGURE 1.
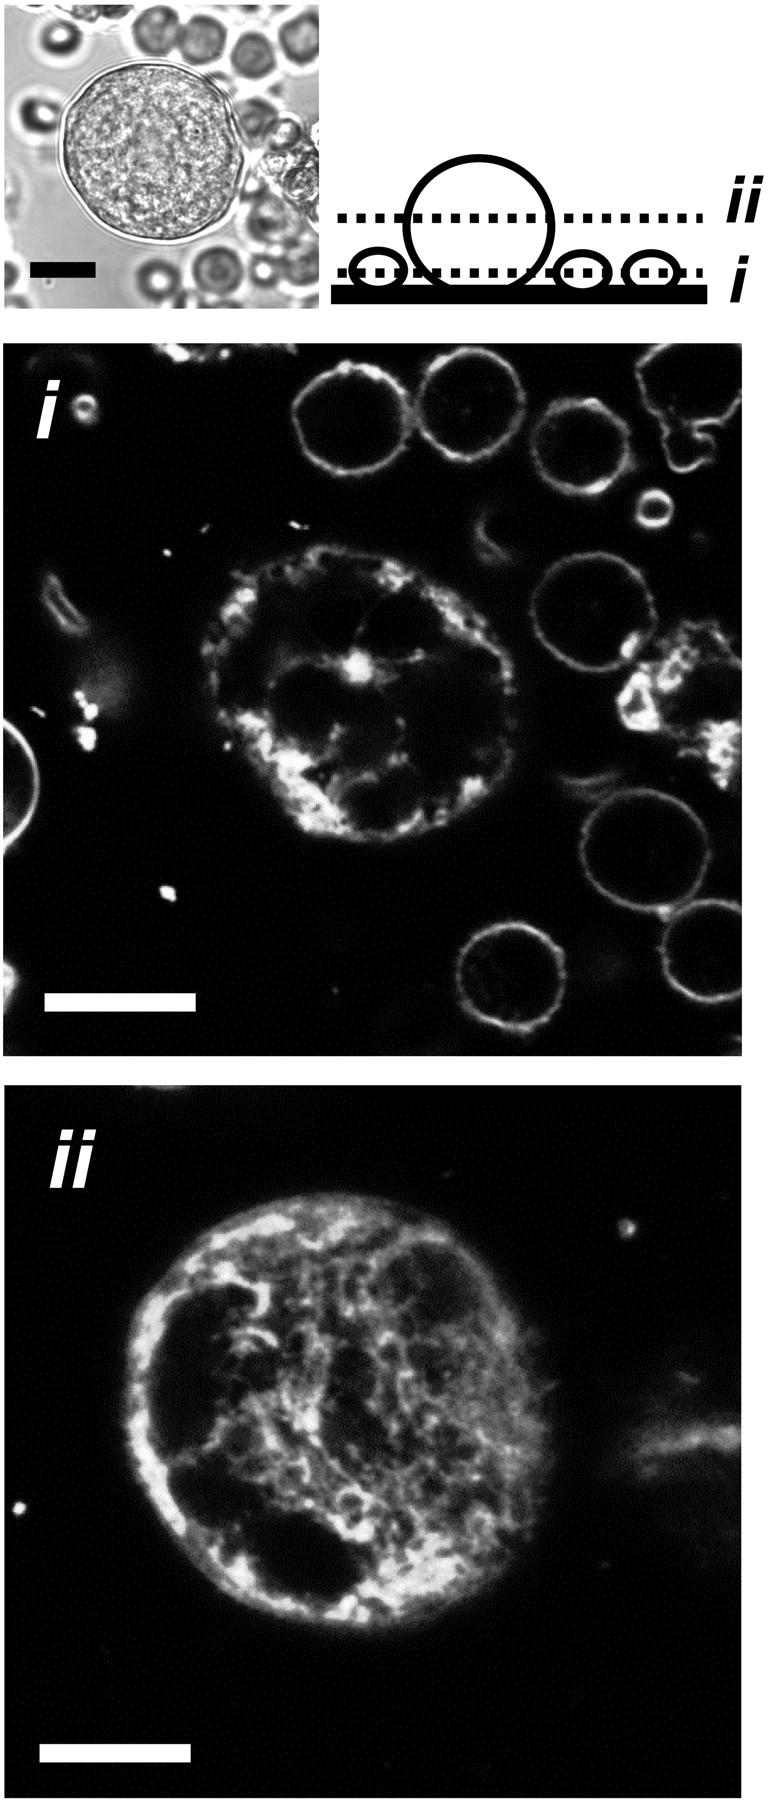
Extracellular di-8-ANEPPS labels demarcation membranes in primary living rat megakaryocytes. Cells extracted from whole marrow (see transmitted light image, top left) were incubated with the membrane dye di-8-ANEPPS (10 μM) and confocal fluorescence images acquired at two focal planes (i and ii, see schematic). Small marrow cells were stained as halos, (lower focal plane, i), whereas surface-connected membranes were observed deep into the volume of the MK (higher focal plane, ii). Scale bars 10 μM. Confocal section = 1 μM.
FIGURE 2.
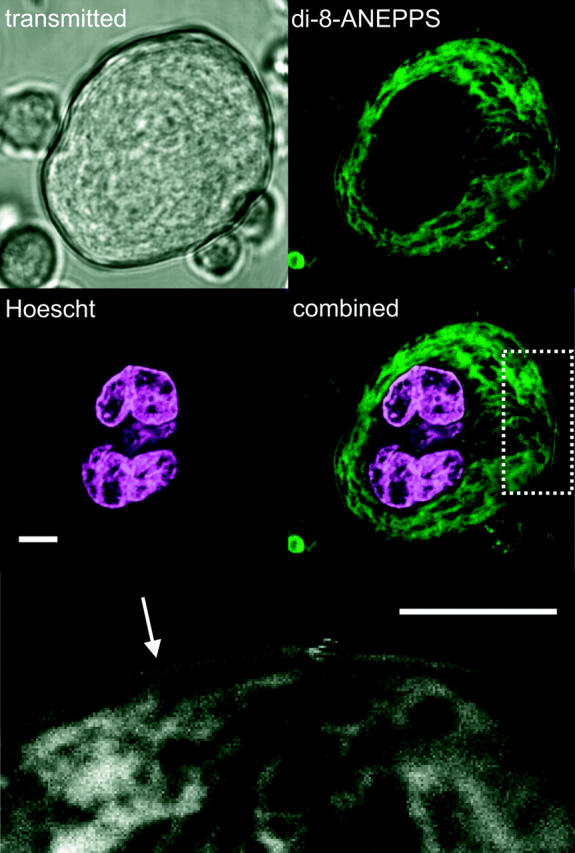
Styryl dye-labeled demarcation membranes penetrate throughout the extranuclear volume of the megakarytocyte. Dual labeling of the MK nucleus (Hoescht 33258, magenta) and surface-connected membranes (di-8-ANEPPS, green) illustrates the extensive nature of styryl dye-labeled demarcation membranes throughout the extranuclear cellular volume. The rectangular area indicated in the merged image has been expanded (bottom image, in grayscale) to show the separation of peripheral plasma membrane and underlying membrane invaginations. This gap was occasionally spanned by a thin band of fluorescence (arrow). Confocal section = 1 μM. Scale bars = 5 μM.
FIGURE 3.

Cumulative and irreversible nature of di-8 ANEPPS staining of demarcation membranes. Average fluorescence (arbitary units, a.u.) of an entire MK (1) and a region of the DMS (2) shows the cumulative and irreversible staining by di-8-ANEPPS (10 μM). This cell is representative of the staining pattern in the majority (23/36) of MKs, in which the DMS was labeled at the same rate as the peripheral plasma membrane. The other 13 cells showed an initial halo followed by a slower progressive staining of the DMS. Di-8-ANEPPS has negligible fluorescence in the extracellular medium (area 3). Confocal section = 1 μM. Image scale bar = 10 μM.
FIGURE 4.

Reversible staining of megakaryocyte demarcation membranes by FM 2-10. The average fluorescence (arbitary units, a.u.) is plotted for an entire MK (1) and for the background (2) during a brief exposure to 50 μM FM 2-10. Representative fluorescent images show that FM 2-10 reversibly stains membranes throughout the extranuclear volume of the MK. The time course of superfusion is indicated by the small FM 2-10 background fluorescence. (See also Supplementary video). Image scale bar = 10 μM. Confocal section = 1μm.
DMS access studied with extracellular indicators
The ability of bath-applied styryl dyes to readily stain demarcation membranes in living MKs suggests a substantial access to the extracellular surface of the DMS from beyond the cell periphery. This was confirmed from the distribution of a membrane-impermeant indicator examined under confocal microscopy. Two-photon excitation was required to reduce the out of focus fluorescence emitted by the large volume of external indicator (Soeller and Cannell, 1999). Oregon Green 488 BAPTA-1 (50 μM) proved to be ideal for these experiments as a consequence of its high charge and marked fluorescence in the presence of normal external Ca2+. The dye was totally excluded from smaller cells yet rapidly (within 1 min) penetrated the volume of the MK demonstrating the presence of extensive extracellular-continuous areas extending deep into the cell (Fig. 5). Oregon Green was excluded from the nucleus, which appeared as a multilobular negatively stained region. In addition, less dye was observed within a thin band around the cell circumference in many sections suggesting that the channels formed by the DMS occupy less volume immediately under the plasma membrane.
FIGURE 5.
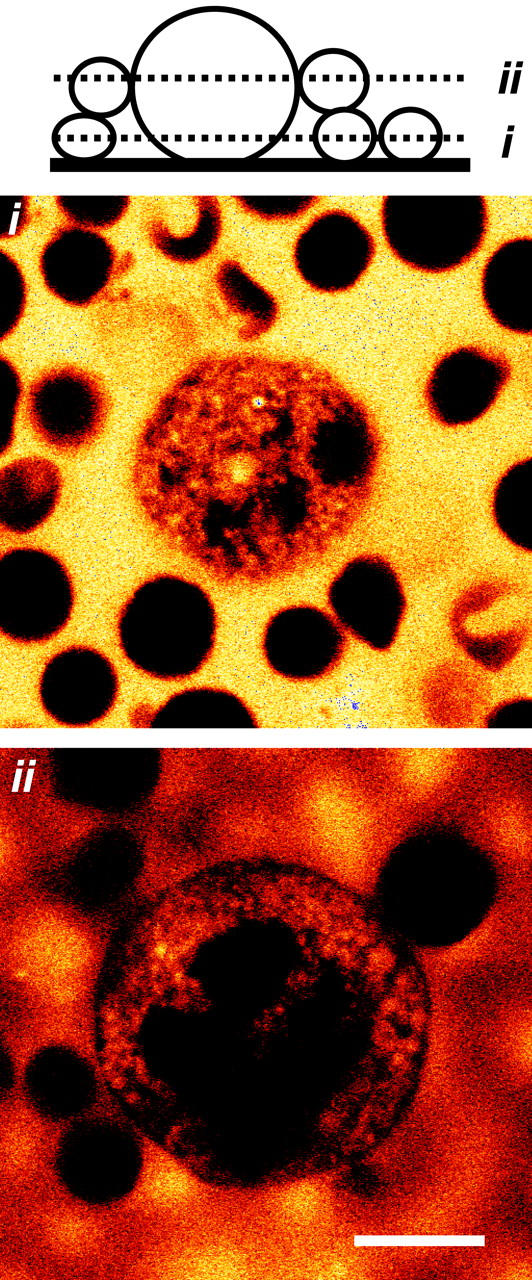
Visualization of extracellular-continuous areas formed by the demarcation membrane system using two-photon confocal fluorescence imaging. Two-photon fluorescence images of marrow cells in the presence of extracellular Oregon Green 488 BAPTA-1 (50 μM). Images are shown at two focal planes (i and ii, see schematic) after 20-min exposure to the dye, but represent fluorescence patterns observed within 1 min of dye addition. The extracellular indicator confirms the lack of invaginations in small marrow cells (i) and the presence of extensive extracellular-continuous zones in the MK (ii). The dye is excluded from the polyploidic nucleus and a narrow band immediately under the peripheral plasma membrane. Scale bar = 10 μM.
Electrophysiological continuity of the DMS and peripheral surface membranes
Previous whole-cell patch clamp studies have reported ion channels within the MK plasma membrane (Uneyama et al., 1993; Somasundaram and Mahaut-Smith, 1994; Mahaut-Smith et al., 2000), however, the extent to which this recording configuration interacts with demarcation membranes is unknown. Electrophysiological control of the plasma and demarcation membranes was assessed in whole-cell voltage-clamped MKs stained with di-8-ANEPPS, using the sensitivity of this dye to membrane potential (Rohr and Salzberg, 1994; Bedlack et al., 1992). In Fig. 6 the bleach-corrected di-8-ANEPPS f/f0 fluorescence ratio, which is linearly related to membrane potential (Huser et al., 1996), is represented by a monochrome intensity scale and plotted against time for a 3-μm wide central band across the cell (dashed line, upper left image of Fig. 6). As the command potential was stepped from −75 to 0 mV, the fluorescence ratio decreased evenly throughout the demarcation membranes indicating that all membranes had been depolarized to the same extent. The temporal and spatial uniformity of voltage control throughout the DMS was further confirmed by the indistinguishable f/f0 responses within three different 7.5 μm2 regions across the cell (Fig. 6).
FIGURE 6.

Uniform control of membrane potential throughout the demarcation membrane system in whole-cell voltage clamped megakaryocytes. A MK stained with 10 μM di-8-ANEPPS was held under whole-cell voltage clamp and images acquired from a 3-μm confocal section (dashed line, top left image) as the command potential (V) was stepped from –75 to 0 mV. After correction for photobleach, the di-8-ANEPPS fluorescence (f), expressed relative to starting fluorescence (f0), is proportional to membrane potential. f/f0, represented by a greyscale intensity plot, is shown for a 3-μm wide central band across the cell (dashed line), with the nonstaining central nuclear area blanked off for clarity. The average f/f0 ratio is also shown for three 7.5-μm2 areas (1–3) at different positions along this central band (traces offset for clarity). Depolarization to 0 mV results in a transient outward current and a uniform change in membrane potential, as indicated by the identical decrease in f/f0, throughout the surface-connected membranes.
Whole-cell capacitance as a measurement of the DMS
A consequence of the uniform electrophysiological control of the DMS throughout the cell is that whole-cell capacitance represents a unique means of quantifying this platelet-generating membrane system. Whole-cell capacitance was measured from the current transient in response to a small (−10 mV) voltage step (Fig. 7 A) over a range that does not activate K+ conductances in the rat MK (Romero and Sullivan, 1997). Despite the morphological complexity of the demarcation membranes, the capacitative transient in >95% of MKs decayed with a single exponential (red dashed line, Fig. 7 A). This suggests the equivalent biophysical model of Fig. 7 B, in which the entire membrane capacitance (Cm) and parallel membrane resistance (Rm) are in series with a single access resistance (Rs). A similar circuit has been described for many cell types with simple geometry (Marty and Neher, 1995). The capacitative transient in a small proportion (<5%) of MK whole-cell recordings displayed a multiexponential decay (data not shown), as observed for neuronal cells with complex morphology, and requires a multicompartmental model (Marty and Neher, 1995). The integral of the current transient for the 38-μm diameter MK in Fig. 7 A yielded a whole-cell capacitance of 339 pF. In contrast, HEL cells, a pluripotent primitive hematopoietic line (Martin and Papayannopoulou, 1982; Papayannopoulou et al., 1983; Tabilio et al., 1984), possessed much smaller membrane capacitances: 98 pF for the 42-μm diameter HEL cell in Fig. 7 C. This smaller capacitance compared with MKs is predicted from electron microscope studies, which show no evidence for demarcation membranes in unstimulated HEL cells (Long et al., 1990). Furthermore, HEL cells stained with styryl dyes such as di-8-ANEPPS displayed a simple ringlike pattern under confocal examination (not shown) as observed for small marrow cells (see Fig. 1 i).
FIGURE 7.
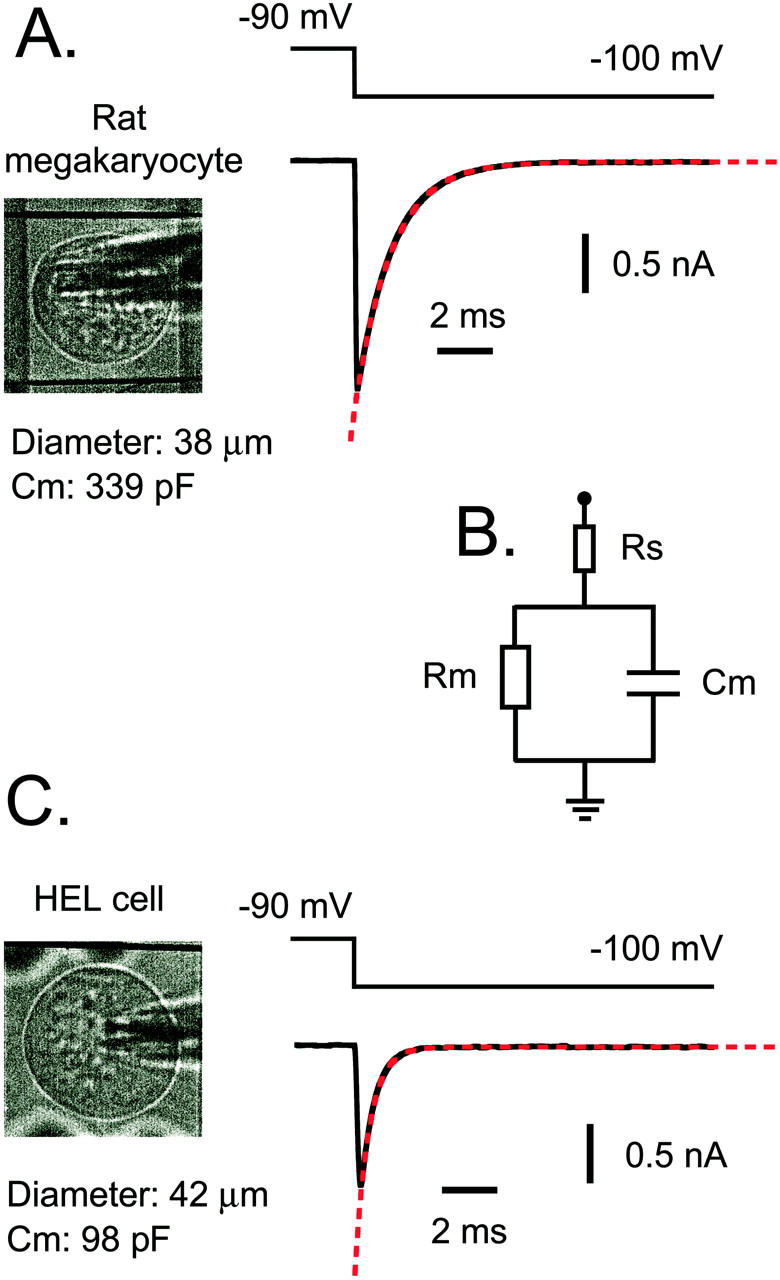
Whole-cell patch clamp measurements of membrane capacitance in rat megakaryocytes and HEL cells. Whole-cell capacitative transients in response to –10 mV voltage steps from –90 mV in >95% of MKs (A) and all HEL cells (C) decay with a single exponential (red dashed lines). This suggests the simple biophysical model of a membrane capacitor (Cm) and parallel membrane resistor (Rm), which are both in series with an access resistor (Rs), as illustrated in (B). Integration of the area under the current transients yielded capacitance values of 339 pF for the 38-μm diameter MK in (A) and 98 pF for the 42-μm diameter HEL cell in (C).
The relationship between membrane capacitance and cell surface area for MKs and HEL cells, where surface area was estimated from average diameter assuming a simple spherical geometry, is plotted in Fig. 8 A. Biological membranes have a relatively constant specific membrane capacitance (SMC) of ∼1 μF cm−2 (Curtis and Cole, 1938; Hodgkin and Nakajima, 1972a; Gentet et al., 2000), which was used to calculate the capacitance of spherical cells lacking membrane invaginations (solid line). MK capacitances were considerably larger than both the predicted and HEL cell capacitances throughout the range of cell size. Membrane capacitance expressed per unit peripheral surface area is commonly used to compare the level of membrane invaginations in different cell types. The specific membrane capacitance per unit spherical surface area (SMCSSA) for HEL cells and MKs is plotted against the spherical surface area in Fig. 8 B. SMCSSA was constant in HEL cells (1.6 ± 0.3 μF cm−2; mean ± SD, n = 23; dashed line, Fig. 8 B) but in MKs displayed a positive correlation with surface area (dotted line, Fig. 8 B; r = 0.34; p < 0.01). SMCSSA increased ≈1.4-fold for a doubling of spherical surface area, although there was a marked scatter around the mean value. This indicates that an increase in cell size results in an increased amount of demarcation membrane per unit peripheral surface area. Throughout the entire range of MKs for which diameters were measured, SMCSSA varied between 4.1 and 14.1 μF cm−2 with a combined average of 8.1 ± 2.0 μF cm−2 (mean ± SD, n = 110). A frequency histogram for capacitances measured from a large number of MKs (Fig. 8 C) covered more than a 10-fold range (64–694 pF) without evidence for discrete levels or quantal distribution. The average MK capacitance was 237 ± 108 pF (n = 656).
FIGURE 8.
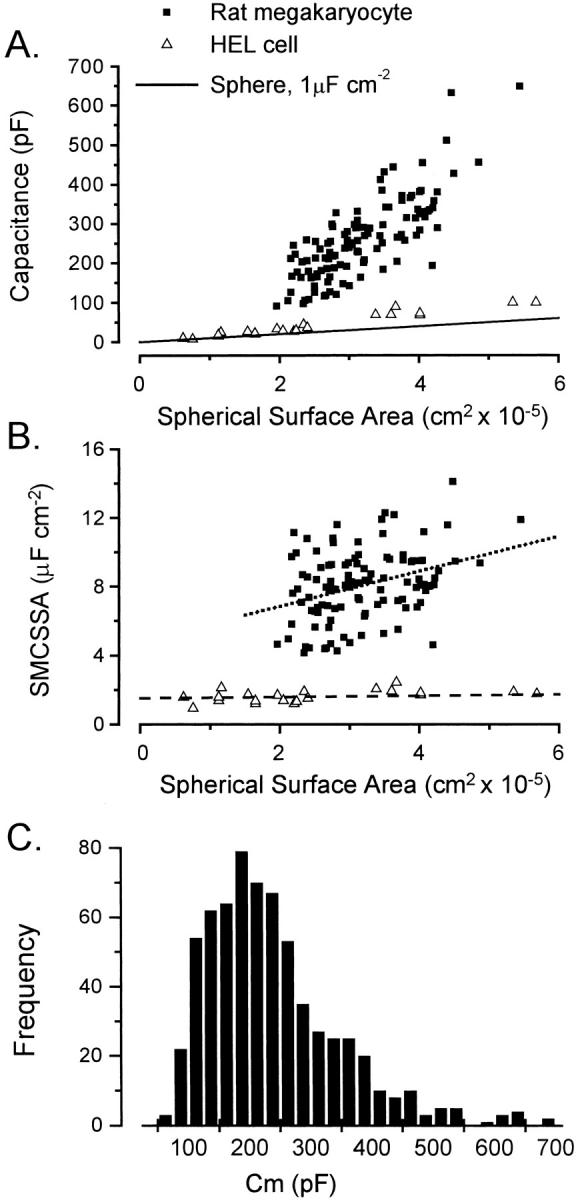
Relationship between cell size and membrane capacitance in megakaryocytes and HEL cells. (A) Whole-cell capacitance was significantly larger for MKs (▪) compared with HEL cells (▵) throughout the range of cell size. The surface area was calculated from the average diameter assuming a spherical geometry. The solid line shows the value expected for a cell with no membrane invaginations using a specific membrane capacitance for a biological membrane of 1 μF cm−2. (B) Specific membrane capacitance per unit spherical surface area was constant (1.6 μF cm−2) for HEL cells (▵, dashed line), but increased with surface area (r = 0.34, p < 0.01) for primary MKs (▪, dotted line) despite a large scatter. The dotted line describes a 1.4-fold increase in SMCSSA per doubling of spherical surface area. (C) The entire range of capacitances for MKs selected on the basis of their large size covered more than a 10-fold range and had an average value of 237 ± 108 pF (n = 656).
DISCUSSION
The mechanisms underlying the development and reorganization of the MK demarcation membrane system during platelet production remain largely unknown. Therefore, the ability of styryl dyes such as di-8-ANEPPS and FM 2-10 (or FM 1-43 and 4-64; data not shown) to rapidly and extensively stain the DMS in unfixed tissue (Figs. 1–4) provide important tools for studies of membrane formation during megakaryocytopoiesis and its reorganization during thrombopoiesis. Di-8-ANEPPS and FM 2-10 are irreversible and reversible indicators, respectively, of MK surface-connected demarcation membranes. It should be noted that these dyes do gradually cross the plasma membrane, and were detected in small marrow cells after ∼1 h in the continued presence of di-8-ANEPPS (M.P. Mahaut-Smith and A.B. Higham, unpublished observations). Therefore, repeated brief exposures to FM 2-10 may be more useful for long-term studies of DMS remodeling. Extracellular-continuous channels formed by the DMS throughout the extranuclear volume of the MK (Fig. 5) account for the accessibility of demarcation membranes to styryl dyes. These channels have been reported to undergo dilation during formation of proplatelets (Cramer, 1999), therefore two-photon measurements of extracellular, membrane-impermeant indicators such as Oregon Green 488 BAPTA-1 (Fig. 5) provides an additional means to monitor events during thrombopoiesis. The signal from a fluorophore contains some out-of-focus fluorescence even with two-photon excitation therefore deconvolution routines may further resolve the geometry of tubules formed by the invaginating MK plasma membrane. This approach, using FITC-dextran as the extracellular indicator, has yielded a complete three-dimensional reconstruction of the T-tubular system in ventricular myocytes with more accurate geometric information compared with electron microscopy (Soeller and Cannell, 1999). Finally, the demonstration that whole-cell patch clamp recordings access the DMS as a single electrophysiological entity (Figs. 6 and 7), purports membrane capacitance measurements as a unique quantitative assay of demarcation membrane development and organization in single living MKs.
In previous studies using fixed MKs, the origin and properties of the DMS have been debated. Although the majority of workers have concluded that the DMS is an invagination of the plasma membrane (MacPherson, 1972; Nakao and Angrist, 1968; Behnke, 1968; Shaklai and Tavassoli, 1978), some have suggested that it is a specialization of the endoplasmic reticulum or Golgi apparatus (Han and Baker, 1964) (for review see Leven (1987)), or is a distinctly separate membrane system (Yamada, 1957; Geyer and Schaaf, 1972). The staining of the DMS in unfixed tissue by external styryl dyes (Figs. 1–4) and its uniform voltage response under whole-cell patch clamp (Fig. 6) demonstrate that this membrane system is indeed entirely an extension of the plasma membrane.
A number of features of MK plasma and demarcation membranes reported by electron microscopy were clearly distinguishable in confocal images of living MKs (Yamada, 1957; Behnke, 1968; Shaklai and Tavassoli, 1978). The DMS, and the channels that it forms, extend deep into the cell even between lobes of the polyploidic nucleus (Figs. 1–5). Some studies (Han and Baker, 1964; Yamada, 1957) have divided the MK cytoplasm into three discrete zones: a peripheral or marginal zone, an intermediate zone, and a perinuclear zone. The marginal zone may correspond with the ≈1-μm thick band immediately under the plasma membrane that tended to remain unstained in the presence of styryl dyes and exclude extracellular Oregon Green. However, tubules must span this circumferential band of cytoplasm to deliver the bath-applied indicators throughout the DMS. Plasma membrane invaginations forming “pores” on the surface of the MK have been reported in freeze fracture and scanning electron microscopy of human and rat MK surface membranes (Shaklai and Tavassoli, 1978; Chen and Barnhart, 1984). These connections are most likely represented by the areas of di-8-ANEPPS staining that were continuous between the outermost plasma membrane and underlying DMS (Fig. 2, arrow). Further division of the cytoplasm into intermediate and perinuclear zones was less obvious in our studies. The heterogeneity in the rate of styryl dye staining of the MK surface-connected membranes is interesting, however the underlying reasons are presently unclear. One possibility is that this results from differences in the number and size of the pores formed by the invaginating surface membrance that connect to the underlying demarcation membrane system.
Despite the complex membrane cytoarchitecture of the MK, whole-cell patch clamp recordings in the majority (>95%) of experiments could be modeled by the simple biophysical circuit shown in Fig. 7 B. Thus, a single capacitative element (Cm), in parallel with the cell input resistance (Rm), is sufficient to account for the passive electrophysiological properties of the combined DMS and plasma membranes. A single series resistance (Rs) is also therefore sufficient to account for the electrical access through the patch pipette and cytoplasm to the surface-connected membranes. However, this model may only apply to the low-frequency domain used here and multiple capacitative components may be resolved with increased stimulus frequency, as demonstrated for skeletal and cardiac muscle (Falk and Fatt, 1964; Takashima, 1985; Moore et al., 1984). A small percentage of MK whole-cell recordings displayed multiexponential capacitative transients indicating a more complex biophysical model with multiple capacitative elements. More experiments are required to understand the basis of this variation, which may result from inadequate disruption of the cell-attached patch or the presence of a connecting pore to the DMS (Shaklai and Tavassoli, 1978) within the membrane patch.
The values for MK specific membrane capacitance per unit peripheral surface area (SMCSSA; average 8.1; range 4–14.1 μF cm−2) are comparable with those previously reported for vertebrate skeletal muscle (5–11 μF cm−2) (Hodgkin and Nakajima, 1972b; Dulhunty et al., 1984) but larger than observed for mammalian ventricular myocytes (3–6 μF cm−2) (Isenberg and Klockner, 1982; Powell et al., 1980; Moore et al., 1984). The SMC for a non-invaginating biological membrane is close to 1 μF cm−2 (Curtis and Cole, 1938; Hodgkin and Nakajima, 1972a; Gentet et al., 2000), however surface villi increase the capacitance of many cells and probably account for the value of 1.6 μF cm−2 in HEL cells (Papayannopoulou et al., 1983). From the value reported for the capacitance of a mammalian platelet (128 fF) by Maruyama (1987), the average MK capacitance (237 pF) can be estimated to generate on average ≈1850 platelets if all surface membrane in the progenitor cell is used in the process of thrombopoiesis. The complete spectrum of capacitance values for rat marrow MKs selected in our study on the basis of size, yields a range of ≈500–5500 platelets per cell. The SMCSSA was not constant for megakaryocytes, as observed for HEL cells, but increased 1.4-fold for a doubling of spherical surface area (Fig. 8 B). This implies that as the cell becomes larger, more DMS develops per unit peripheral surface area of the cell. This increase in capacity to develop more membrane invaginations is also observed for skeletal muscle (Adrian and Almers, 1974). The large scatter in Fig. 8, A and B, suggests a wide range in the amount of DMS in MKs of similar size. However, it is unclear at present the extent to which our simple measurement of cell surface area based upon average diameter in two dimensions contributes to the apparent heterogeneity in capacitance expressed against cell surface area. Further experiments using three-dimensional volume rendering are required to clarify these issues. An additional issue is whether the styryl dye and whole-cell capacitance measurements detect all membranes within the DMS. Certainly access was available from the extracellular space to demarcation membranes running throughout the extranuclear volume of the cell as shown by the labeling patterns of di-8-ANEPPS and FM 2-10 (see Figs. 1–4 and supplementary video). Furthermore, the membrane capacitative transient decays with a single exponential in the majority of megakaryocyte whole-cell patch clamp recordings with a typical initial series resistance only 2–3 times (2.4 ± 1.0; mean ± SD, n = 68) higher than the pipette resistance (1.8 ± 0.5 MΩ, mean ± SD, in the same set of recordings), indicating good access from the pipette to the DMS. However, we cannot discount that multiple microdomains of DMS are not accessed by these techniques, which would result in an underestimation of the amount of membrane within this system.
Although the principal function of the DMS is to provide additional membrane for thrombopoiesis, it is worth drawing a further analogy between the high specific membrane capacitance and specialized Ca2+ signaling pathways reported in certain muscle types and in MKs. In ventricular myocytes and skeletal muscle, T-tubules assist in synchronizing Ca2+ release after membrane depolarization by direct or indirect mechanisms (Schneider and Chandler, 1973; Fabiato, 1983; Rios and Brum, 1987). Considering the electrical contiguity of the DMS and plasma membranes, and a similar or larger specific membrane capacitance compared with T-tubular-containing muscle cells, it is therefore particularly interesting to note that voltage-dependent Ca2+ release during activation of G-protein-coupled receptors has been reported in the MK (Mahaut-Smith et al., 1999; Mason and Mahaut-Smith, 2001). In this phenomenon, depolarization releases Ca2+ from IP3-dependent Ca2+ stores compared with the central role of ryanodine receptors in the voltage-dependent Ca2+ release process of muscle. A similar interaction between membrane voltage and IP3 receptor-dependent Ca2+ release has been reported in smooth muscle (Ganitkevich and Isenberg, 1993), however the response is particularly robust in the MK. The mechanism for release of Ca2+ by voltage in the MK is unknown, although it is possible that the electrically conducting DMS accounts for the robust nature of the response. For example, the invaginations may bring surface-connected and Ca2+ store membranes into closer proximity to allow an innate voltage dependence to IP3 production to be more effectively transduced into Ca2+ release. In this respect, the DMS may be the nonexcitable cell equivalent of muscle T-tubules, and voltage control of IP3-dependent Ca2+ release may occur in any cell with a significant level of membrane invagination or cell compartments with a high ratio of membrane surface area to cytoplasmic volume. Platelets may also have this mechanism as a consequence of the surface-connected open canalicular system (Behnke, 1967; Escolar and White, 1991) and thus the consequences of this phenomenon on G-protein-coupled receptor signaling should be further considered. It is possible, for example, that this interaction between the membrane potential and Ca2+ release contributes to the overall high level of reactivity of the platelet and MK.
In conclusion, the present study has demonstrated how the accessibility of the DMS from the extracellular space allows impermeant membrane indicators to stain this unique thrombocytogenic membrane in living MKs. In addition, despite its complex invaginating nature, the DMS is electrophysiologically contiguous with the plasma membrane such that MKs are modeled by a single capacitative element in whole-cell patch clamp recordings. Therefore, confocal fluorescence and electrophysiological measurements represent novel approaches to image and quantify the properties of the DMS at rest and its remodeling during thrombopoiesis.
Supplementary Material
Acknowledgments
An online video supplement to this article can be found by visiting BJ Online at http://www.biophysj.org/.
We thank Chris Huang for helpful discussions on membrane capacitance, Christof Schwiening for providing image analysis software, and Jon Holdich for expert technical assistance.
This work was funded by grants from the British Heart Foundation (PG 94151, PG 95005, PG 2000108, and BS/10 to MPM-S), the Royal Society (to MPM-S), the Medical Research Council (G9900182 and G9901465 to MPM-S/MJM) and the Wellcome Trust (Infrastructure Grant 055203/Z/98/Z/ST/RC to JNS). JAU-S was supported by a Wellcome Trust Vacation Studentship.
References
- Adrian, R. H., and W. Almers. 1974. Membrane capacity measurements on frog skeletal muscle in media of low ion content. J Physiol. 237:573–605. [DOI] [PMC free article] [PubMed] [Google Scholar]
- Bedlack, R. S., M. Wei, and L. M. Loew. 1992. Localized membrane depolarizations and localized calcium influx during electric field-guided neurite growth. Neuron. 9:393–403. [DOI] [PubMed] [Google Scholar]
- Behnke, O. 1967. Electron microscopic observations on the membrane systems of the rat blood platelet. Anat. Rec. 158:121–137. [DOI] [PubMed] [Google Scholar]
- Behnke, O. 1968. An electron microscope study of the megacaryocyte of the rat bone marrow. I. The development of the demarcation membrane system and the platelet surface coat. J. Ultrastruct. Res. 24:412–433. [DOI] [PubMed] [Google Scholar]
- Breton-Gorius, J., and F. Reyes. 1976. Ultrastructure of human bone marrow cell maturation. Int. Rev. Cytol. 46:251–321. [DOI] [PubMed] [Google Scholar]
- Chen, S., and M. I. Barnhart. 1984. Scanning electron microscopy of cultured human megakaryocytes. Scan Electron Microsc. 291–301. [PubMed]
- Cramer, E. M. 1999. Megakaryocyte structure and function. Curr. Opin. Hematol. 6:354–361. [DOI] [PubMed] [Google Scholar]
- Curtis, H. J., and K. S. Cole. 1938. Transverse electric impedance of the squid giant axon. J. Gen. Physiol. 21:757–765. [DOI] [PMC free article] [PubMed] [Google Scholar]
- Dulhunty, A., G. Carter, and C. Hinrichsen. 1984. The membrane capacity of mammalian skeletal muscle fibres. J. Muscle Res. Cell Motil. 5:315–332. [DOI] [PubMed] [Google Scholar]
- Escolar, G., and J. G. White. 1991. The platelet open canalicular system: a final common pathway. Blood Cells. 17:467–485. [PubMed] [Google Scholar]
- Fabiato, A. 1983. Calcium-induced release of calcium from the cardiac sarcoplasmic reticulum. Am. J. Physiol. 245:C1–14. [DOI] [PubMed] [Google Scholar]
- Falk, G., and P. Fatt. 1964. Linear electrical properties of striated muscle fibres observed with intracellular electrodes. Proc. R. Soc. Lond. B Biol. Sci. 160:69–123. [DOI] [PubMed] [Google Scholar]
- Ganitkevich, V. Y., and G. Isenberg. 1993. Membrane potential modulates inositol 1,4,5-trisphosphate-mediated Ca2+ transients in guinea-pig coronary myocytes. J Physiol. 470:35–44. [DOI] [PMC free article] [PubMed] [Google Scholar]
- Gentet, L. J., G. J. Stuart, and J. D. Clements. 2000. Direct measurement of specific membrane capacitance in neurons. Biophys. J. 79:314–320. [DOI] [PMC free article] [PubMed] [Google Scholar]
- Geyer, G., and P. Schaaf. 1972. The megakaryocyte demarcation membrane (DM) - endoplasmic or superficial origin? Acta Histochem. 44:137–143. [PubMed] [Google Scholar]
- Han, S. S., and B. L. Baker. 1964. The ultrastructure of megakaryocytes and blood platelets in the rat spleen. Anat. Rec. 149:251–268. [DOI] [PubMed] [Google Scholar]
- Hodgkin, A. L., and S. Nakajima. 1972a. Analysis of the membrane capacity in frog muscle. J Physiol. 221:121–136. [DOI] [PMC free article] [PubMed] [Google Scholar]
- Hodgkin, A. L., and S. Nakajima. 1972b. The effect of diameter on the electrical constants of frog skeletal muscle fibres. J Physiol. 221:105–120. [DOI] [PMC free article] [PubMed] [Google Scholar]
- Huser, J., P. Lipp, and E. Niggli. 1996. Confocal microscopic detection of potential-sensitive dyes used to reveal loss of voltage control during patch-clamp experiments. Pflugers Arch. 433:194–199. [DOI] [PubMed] [Google Scholar]
- Hussain, J. F., and M. P. Mahaut-Smith. 1998. ADP and inositol trisphosphate evoke oscillations of a monovalent cation conductance in rat megakaryocytes. J Physiol. 511:791–801. [DOI] [PMC free article] [PubMed] [Google Scholar]
- Isenberg, G., and U. Klockner. 1982. Calcium tolerant ventricular myocytes prepared by preincubation in a “KB medium“. Pflugers Arch. 395:6–18. [DOI] [PubMed] [Google Scholar]
- Italiano, J. E. J., P. Lecine, R. A. Shivdasani, and J. H. Hartwig. 1999. Blood platelets are assembled principally at the ends of proplatelet processes produced by differentiated megakaryocytes. J. Cell Biol. 147:1299–1312. [DOI] [PMC free article] [PubMed] [Google Scholar]
- Kaushansky, K. 1999. Thrombopoietin and hematopoietic stem cell development. Ann. N. Y. Acad. Sci. 872:314–319. [DOI] [PubMed] [Google Scholar]
- Kautz, J., and Q. B. De Marsh. 1955. Electron microscopy of sectioned blood and bone marrow elements. Rev d'Hematol. 10:314–323. [PubMed] [Google Scholar]
- Klingauf, J., E. T. Kavalali, and R. W. Tsien. 1998. Kinetics and regulation of fast endocytosis at hippocampal synapses. Nature. 394:581–585. [DOI] [PubMed] [Google Scholar]
- Leven, R. M. 1987. Megakaryocyte motility and platelet formation. Scanning Microsc. 1:1701–1709. [PubMed] [Google Scholar]
- Long, M. W., C. H. Heffner, J. L. Williams, C. Peters, and E. V. Prochownik. 1990. Regulation of megakaryocyte phenotype in human erythroleukemia cells. J. Clin. Invest. 85:1072–1084. [DOI] [PMC free article] [PubMed] [Google Scholar]
- MacPherson, G. G. 1972. Origin and development of the demarcation system in megakaryocytes of rat bone marrow. J. Ultrastruct. Res. 40:167–177. [DOI] [PubMed] [Google Scholar]
- Mahaut-Smith, M. P., S. J. Ennion, M. G. Rolf, and R. J. Evans. 2000. ADP is not an agonist at P2X1 receptors: evidence for separate receptors stimulated by ATP and ADP on human platelets. Br. J. Pharmacol. 131:108–114. [DOI] [PMC free article] [PubMed] [Google Scholar]
- Mahaut-Smith, M. P., J. F. Hussain, and M. J. Mason. 1999. Depolarization-evoked Ca2+ release in a non-excitable cell, the rat megakaryocyte. J Physiol. 515:385–390. [DOI] [PMC free article] [PubMed] [Google Scholar]
- Martin, P., and T. Papayannopoulou. 1982. HEL cells: a new human erythroleukemia cell line with spontaneous and induced globin expression. Science. 216:1233–1235. [DOI] [PubMed] [Google Scholar]
- Marty, A., and E. Neher. 1995. Tight-seal whole-cell recording. In Single Channel Recording. B. Sakmann and E. Neher, editors. Plenum Press, New York and London. 31–52.
- Maruyama, Y. 1987. A patch-clamp study of mammalian platelets and their voltage-gated potassium current. J Physiol. 391:467–485. [DOI] [PMC free article] [PubMed] [Google Scholar]
- Mason, M. J., and M. P. Mahaut-Smith. 2001. Voltage-dependent Ca2+ release in rat megakaryocytes requires functional IP3 receptors. J Physiol. 533:175–183. [DOI] [PMC free article] [PubMed] [Google Scholar]
- Moore, L. E., A. Schmid, and G. Isenberg. 1984. Linear electrical properties of isolated cardiac cells. J. Membr. Biol. 81:29–40. [DOI] [PubMed] [Google Scholar]
- Nakao, K., and A. A. Angrist. 1968. Membrane surface specialization of blood platelet and megakaryocyte. Nature. 217:960–961. [DOI] [PubMed] [Google Scholar]
- Papayannopoulou, T., B. Nakamoto, T. Yokochi, A. Chait, and R. Kannagi. 1983. Human erythroleukemia cell line (HEL) undergoes a drastic macrophage-like shift with TPA. Blood. 62:832–845. [PubMed] [Google Scholar]
- Paulus, J. M., J. Bury, and J. C. Grosdent. 1979. Control of platelet territory development in megakaryocytes. Blood Cells. 5:59–88. [PubMed] [Google Scholar]
- Powell, T., D. A. Terrar, and V. W. Twist. 1980. Electrical properties of individual cells isolated from adult rat ventricular myocardium. J Physiol. 302:131–153. [DOI] [PMC free article] [PubMed] [Google Scholar]
- Radley, J. M., and C. J. Haller. 1982. The demarcation membrane system of the megakaryocyte: a misnomer? Blood. 60:213–219. [PubMed] [Google Scholar]
- Rios, E., and G. Brum. 1987. Involvement of dihydropyridine receptors in excitation-contraction coupling in skeletal muscle. Nature. 325:717–720. [DOI] [PubMed] [Google Scholar]
- Rohr, S., and B. M. Salzberg. 1994. Multiple site optical recording of transmembrane voltage (MSORTV) in patterned growth heart cell cultures: assessing electrical behavior, with microsecond resolution, on a cellular and subcellular scale. Biophys. J. 67:1301–1315. [DOI] [PMC free article] [PubMed] [Google Scholar]
- Romero, E., and R. Sullivan. 1997. Complexity of the outward K+ current of the rat megakaryocyte. Am. J. Physiol. 272:C1525–C1531. [DOI] [PubMed] [Google Scholar]
- Schneider, M. F., and W. K. Chandler. 1973. Voltage dependent charge movement of skeletal muscle: a possible step in excitation-contraction coupling. Nature. 242:244–246. [DOI] [PubMed] [Google Scholar]
- Shaklai, M., and M. Tavassoli. 1978. Demarcation membrane system in rat megakaryocyte and the mechanism of platelet formation: a membrane reorganization process. J. Ultrastruct. Res. 62:270–285. [DOI] [PubMed] [Google Scholar]
- Soeller, C., and M. B. Cannell. 1999. Examination of the transverse tubular system in living cardiac rat myocytes by 2-photon microscopy and digital image-processing techniques. Circ. Res. 84:266–275. [DOI] [PubMed] [Google Scholar]
- Somasundaram, B., and M. P. Mahaut-Smith. 1994. Three cation influx currents activated by purinergic receptor stimulation in rat megakaryocytes. J Physiol. 480:225–231. [DOI] [PMC free article] [PubMed] [Google Scholar]
- Somasundaram, B., M. J. Mason, and M. P. Mahaut-Smith. 1997. Thrombin-dependent calcium signalling in single human erythroleukaemia cells. J Physiol. 501:485–495. [DOI] [PMC free article] [PubMed] [Google Scholar]
- Tabilio, A., J. P. Rosa, U. Testa, N. Kieffer, A. T. Nurden, M. C. Del Canizo, J. Breton-Gorius, and W. Vainchenker. 1984. Expression of platelet membrane glycoproteins and alpha-granule proteins by a human erythroleukemia cell line (HEL). EMBO J. 3:453–459. [DOI] [PMC free article] [PubMed] [Google Scholar]
- Takashima, S. 1985. Passive electrical properties and voltage dependent membrane capacitance of single skeletal muscle fibers. Pflugers Arch. 403:197–204. [DOI] [PubMed] [Google Scholar]
- Tavassoli, M. 1980. Megakaryocyte–platelet axis and the process of platelet formation and release. Blood. 55:537–545. [PubMed] [Google Scholar]
- Uneyama, C., H. Uneyama, and N. Akaike. 1993. Cytoplasmic Ca2+ oscillation in rat megakaryocytes evoked by a novel type of purinoceptor. J Physiol. 470:731–749. [DOI] [PMC free article] [PubMed] [Google Scholar]
- White, J. G. 1989. Mechanisms of platelet production. Blood Cells. 15:48–57. [PubMed] [Google Scholar]
- Yamada, E. 1957. The fine structure of the megakaryocyte in the mouse spleen. Acta Anat. (Basel). 29:267–290. [DOI] [PubMed] [Google Scholar]
Associated Data
This section collects any data citations, data availability statements, or supplementary materials included in this article.