

Abstract
The peculiar pseudounipolar geometry of primary sensory neurons can lead to ectopic generation of “extra spikes” in the region of the dorsal root ganglion potentially disrupting the fidelity of afferent signaling. We have used an explicit model of myelinated vertebrate sensory neurons to investigate the location and mechanism of extra spike formation, and its consequences for distortion of afferent impulse patterning. Extra spikes originate in the initial segment axon under conditions in which the soma spike becomes delayed and broadened. The broadened soma spike then re-excites membrane it has just passed over, initiating an extra spike which propagates outwards into the main conducting axon. Extra spike formation depends on cell geometry, electrical excitability, and the recent history of impulse activity. Extra spikes add to the impulse barrage traveling toward the spinal cord, but they also travel antidromically in the peripheral nerve colliding with and occluding normal orthodromic spikes. As a result there is no net increase in afferent spike number. However, extra spikes render firing more staccato by increasing the number of short and long interspike intervals in the train at the expense of intermediate intervals. There may also be more complex changes in the pattern of afferent spike trains, and hence in afferent signaling.
INTRODUCTION
Sensory systems are generally presumed to convey peripheral afferent signals to the central nervous system with a high degree of fidelity. Distortions, in the form of dropped spikes, extra ectopic spikes, or changes in spike patterning, degrade sensory signaling. In light of this expectation, it is interesting that during repetitive firing at natural, physiological rates extra spikes are sometimes injected into the spike train between the periphery and the central nervous system. This occurs not only in the event of nerve pathology, such as demyelination, but also in fully intact nerves, particularly in the region of the dorsal root ganglion (DRG; Tagini and Camino, 1973; Howe et al., 1976; Gottschaldt and Fakoya, 1977; Burchiel and Wyler, 1978). A single propagating spike can spawn a second “extra” spike in midnerve. In this article, we explore the mechanism and consequences of extra spike generation in sensory neurons.
METHODS
We used a computerized model of a vertebrate myelinated DRG neuron that captures much of the detailed geometry of primary afferents. This included the cell soma (diameter 80 μm) and an unmyelinated initial segment axon connected to a short myelinated “stem axon” four internodes in length. The stem axon joined the main conducting axon at a t-junction bifurcation (see sketch in Fig. 2). The main axon was myelinated and consisted of peripheral (nerve) and central (dorsal root) branches 33 internodes in length. Numerical computations were performed using the NEURON simulation environment (ver. 3.2.1b and 4.2.1; Hines, 1989; http://neuron.yale.edu). A detailed description of the morphological and physiological parameters used, as well as its verification against data from other simulations and from electrophysiological recordings in DRG neurons, is given elsewhere (Amir and Devor, 2003). All trials were conducted at 20°C.
FIGURE 2.
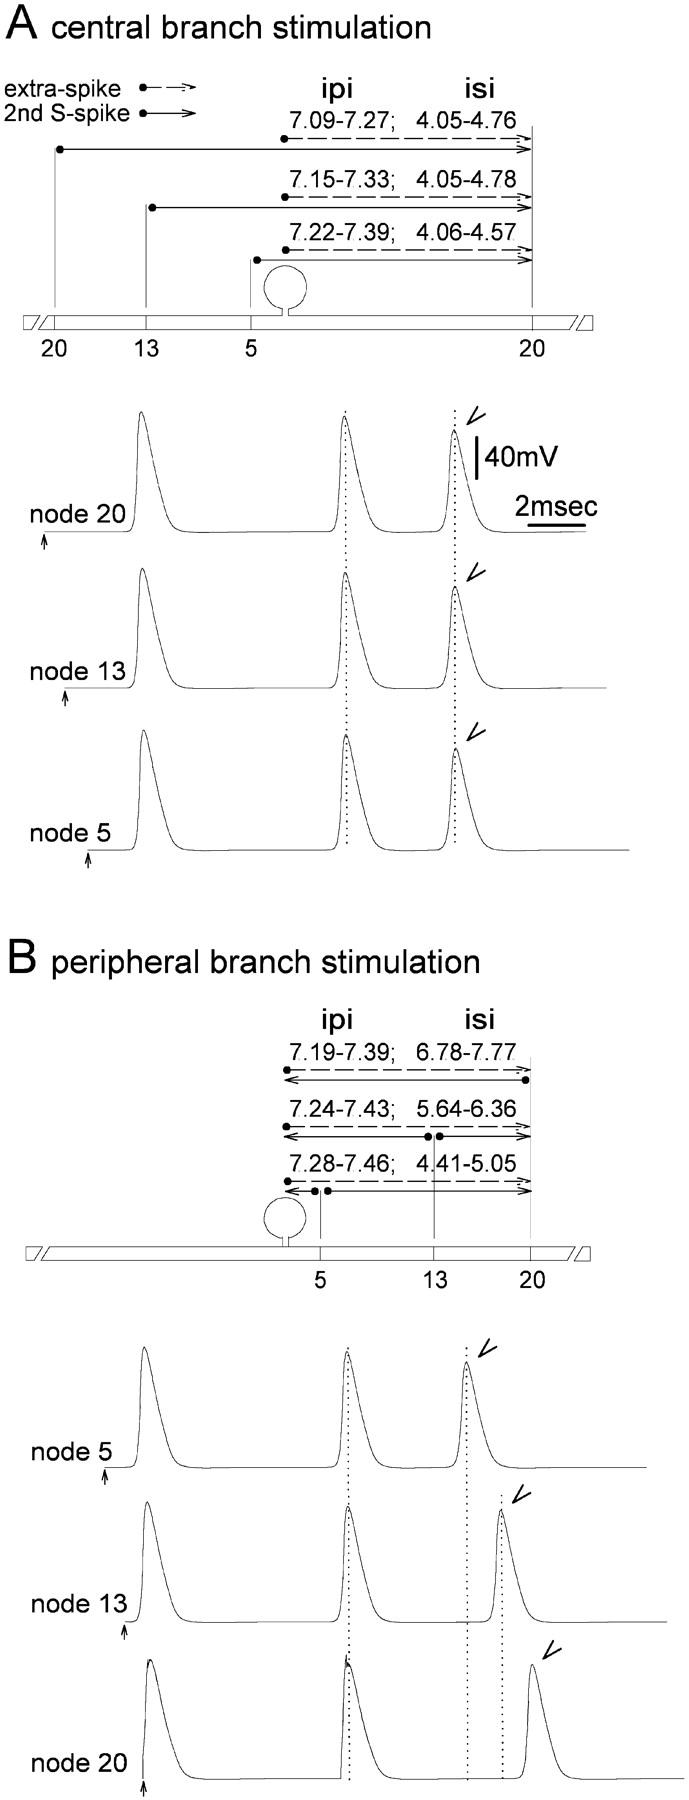
Evidence that extra spikes are generated in the region of the DRG. (A) Stimulating the central branch axon and recording from the peripheral, the delay between the second S-spike and the extra spikes (arrowhead) is independent of the exact site of stimulation (20th, 13th, or fifth central node). (B) Stimulating and recording on the peripheral branch axon, the delay between the second S-spike and extra spikes (arrowhead) varies with the exact site of stimulation (20th, 13th, or fifth peripheral node). This behavior is a consequence of the spike propagation path, given the initiation of extra spikes in the DRG (horizontal solid and dashed lines above sketches of the neuron). Similar observations were made in live DRG neurons by Tagini and Camino (1973).
Stimuli were 0.2 ms depolarizing pulse pairs, usually delivered to the 20th node along the peripheral axon branch, at an intensity 2 × (first pulse) or 2.5 × threshold (second pulse). The interval between the two pulses (IPI) was varied systematically. The absolute refractory period (ARP), determined to 0.01 ms accuracy, was defined as the minimum IPI at which the second spike continued to appear (Ito and Saiga, 1959; Stoney, 1985, 1990). Recordings were made at various locations (Results). The soma spike in DRG neurons has three superimposed components: the M-spike which originates in stem axon nodes, the NM-spike which originates in the initial segment axon, and the S-spike (soma spike) which is generated in the soma membrane proper (Fig. 1; Ito, 1957; Amir and Devor, 2003).
FIGURE 1.
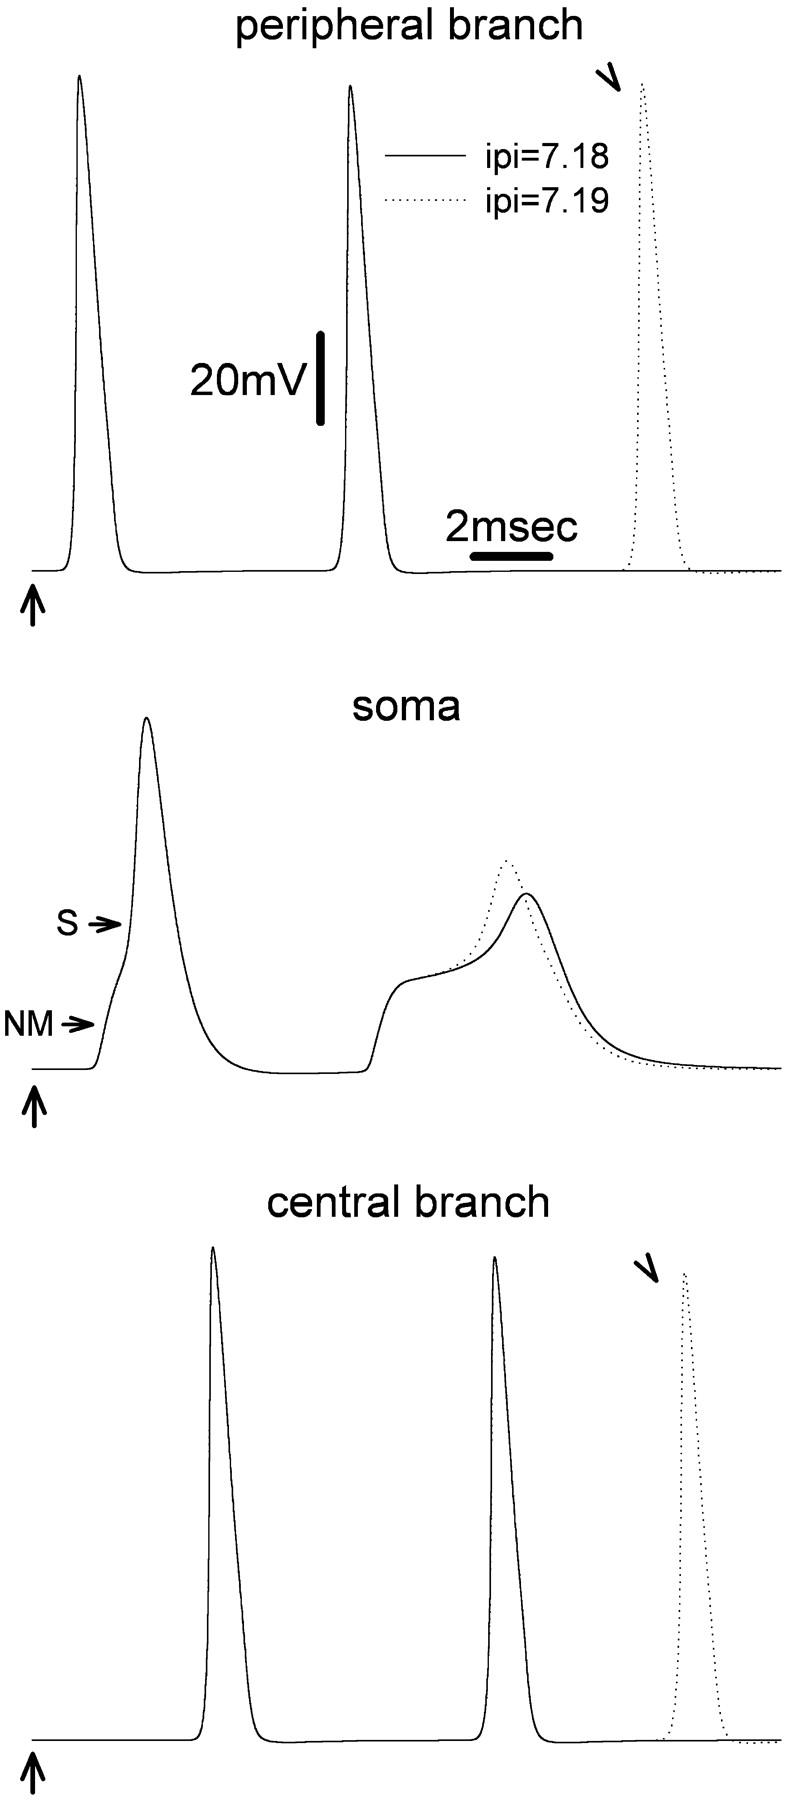
Extra spikes are observed in the peripheral and the central axon branches at particular values of interpulse interval (IPI). The first of two stimulus pulses (arrows) was delivered at the 20th peripheral node. The second was given 7.18 ms (solid line) or 7.19 ms later (dotted line). Recordings were made from: the most distal node (34th) of the peripheral branch (upper traces), the cell soma (middle traces), and the most central (34th node) of the central branch (bottom traces). Using IPI = 7.18 ms, two spikes were evoked. Increasing IPI to 7.19 ms yielded an extra (third) spike in both the peripheral and the central branch (arrowheads), but not in the cell soma.
RESULTS
Conditions for evoking extra spikes
The spike evoked by the first pulse of each stimulus pulse pair always propagated successfully from the nerve, past the ganglion, and into the dorsal root. It also invaded the cell soma. However, propagation of the second spike depended on the IPI. When the IPI was less than the ARP of the peripheral axon branch (2.26 ms), no second spike was generated. For IPI ≥ 2.26 ms both stimuli generated spikes that successfully propagated past the DRG and into the central axonal branch. Both also entered the stem axon. However, for a certain range of IPI values anomalous behavior occurred within the soma-stem axon complex including the generation of extra spikes.
For IPI values less than the ARP of the soma (i.e., <7.18 ms), only the first of the two spikes reached the soma in the form of an S-spike; the second yielded only a decremented NM-soma spike residue. For IPI = 7.18 ms, the second stimulus did generate an S-spike. However, this spike was significantly delayed (beyond the IPI); it was broadened, and its amplitude was markedly reduced in comparison to that of the first S-spike (Fig. 1). This reflects the relative refractoriness of the soma membrane after the first S-spike. A further slight increase of the IPI, to 7.19 ms, modified the soma spike only slightly, but it led to the appearance of an extra, third spike in the main axon, both proximal and distal to the DRG (Fig. 1). Three spikes appeared in response to stimulus pulse pairs for all IPI values from 7.19 to 7.39 ms. For IPI > 7.39 ms no extra spike formed, and only two spikes appeared in the axon branches. Extra spikes were never observed in recordings from the soma (e.g., Fig. 1).
Location of extra spike formation
In live afferent neurons extra spikes form as the propagating spike passes the DRG, whether stimuli are applied to the peripheral or to the central axon branch (Tagini and Camino, 1973; Howe et al., 1976). Evidence for this was derived from measurement of the latency between the extra spike and the spike that preceded it. This latency corresponded to the distance between the stimulation site and the DRG when the stimulation and recording points were on the same side of the ganglion. However, when stimulation and recording sites were on opposite sides of the ganglion, the latency was constant (Tagini and Camino, 1973).
Simulation in our model yielded corresponding results. For example, recording from the 20th peripheral node, we stimulated the central branch. Moving the stimulation point toward the soma did not significantly change extra spike–second S-spike latency (Fig. 2 A). However, when the stimulation point was moved to the peripheral branch, the latency began to increase with increasing distance from the t-junction (Fig. 2 B). The differences in latency correspond to differences in the spike propagation trajectory as summarized by the horizontal arrows in Fig. 2, assuming that extra spike formation occurs in the vicinity of the DRG. Extra spikes were not recorded in the soma, but this still leaves a variety of candidate sites: the initial segment, stem axon nodes and the t-junction, for example. More precise localization requires detailed understanding of the process underlying extra spike generation.
Biophysical events underlying extra spike generation
Extra spikes formed only when the second stimulus pulse evoked an S-spike that was delayed and broadened. The broadening was not due simply to the large capacitance load of the soma membrane as the S-spike evoked by the first stimulus pulse was much narrower (Figs. 1 and 4). Rather, broadening is primarily due to persistent effects of the first spike on membrane conductances (“relative” refractoriness). Within the range of IPI values that evoked extra spikes (7.19–7.39 ms), the time course of the net inward current responsible for the second S-spike was significantly extended. For example, using IPI = 7.19, the rise-time of the current driving the second spike was 2.57 ms (baseline to peak) compared with 0.54 ms for the first spike. Likewise, peak current amplitude was reduced (Fig. 3 B). This was mainly due to changes in inward sodium current (INa+) and its underlying permeability pNa+ (Fig. 3, B and C).
FIGURE 4.
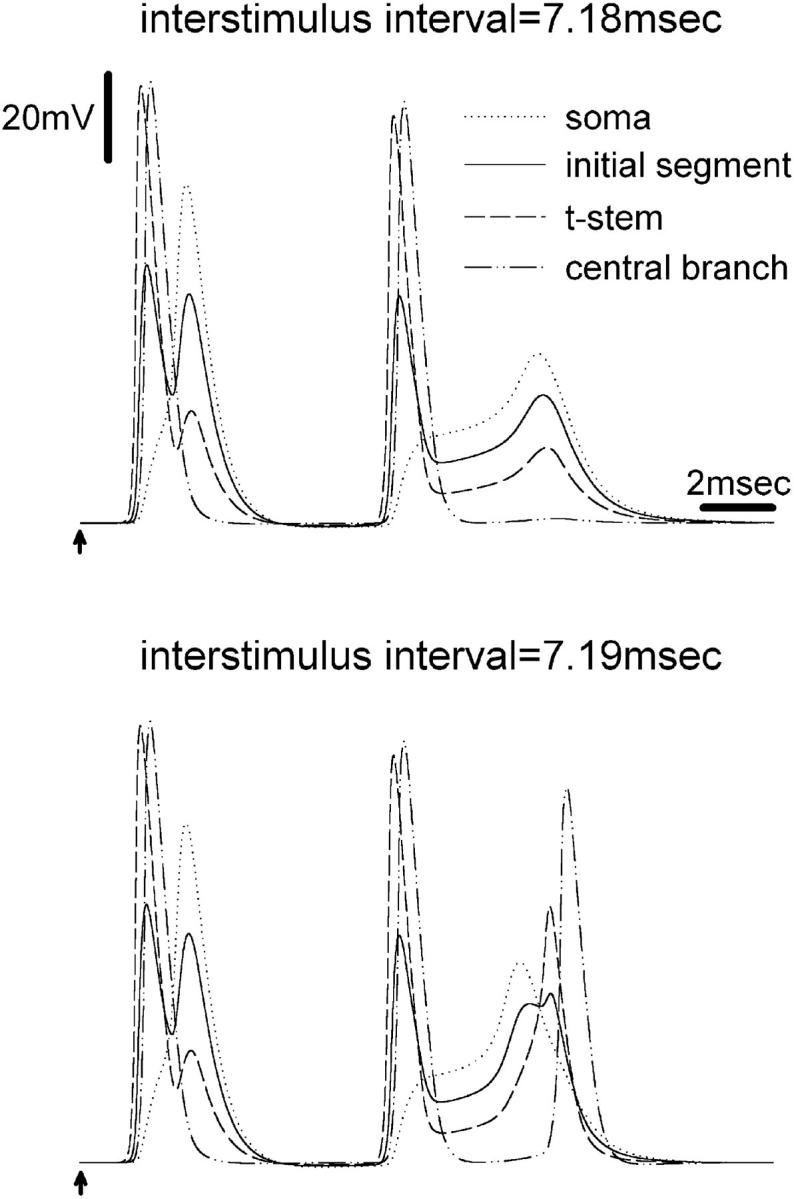
Membrane potential at various locations during the onset of extra spikes. The first stimulus pulse is indicated by an arrow. The second was given 7.18 (top) or 7.19 ms (bottom) later. Recordings were made from four points: the soma, mid-initial segment, the third node on the t-stem axon, and the fifth node from the t-junction along the central axon branch. With IPI = 7.18 ms, the second S-spike decayed as it propagated along the stem axon; no extra spike was recorded in the central or peripheral axon branch. Increasing IPI to 7.19 ms, a propagated extra spike was present in the central or peripheral axons.
FIGURE 3.
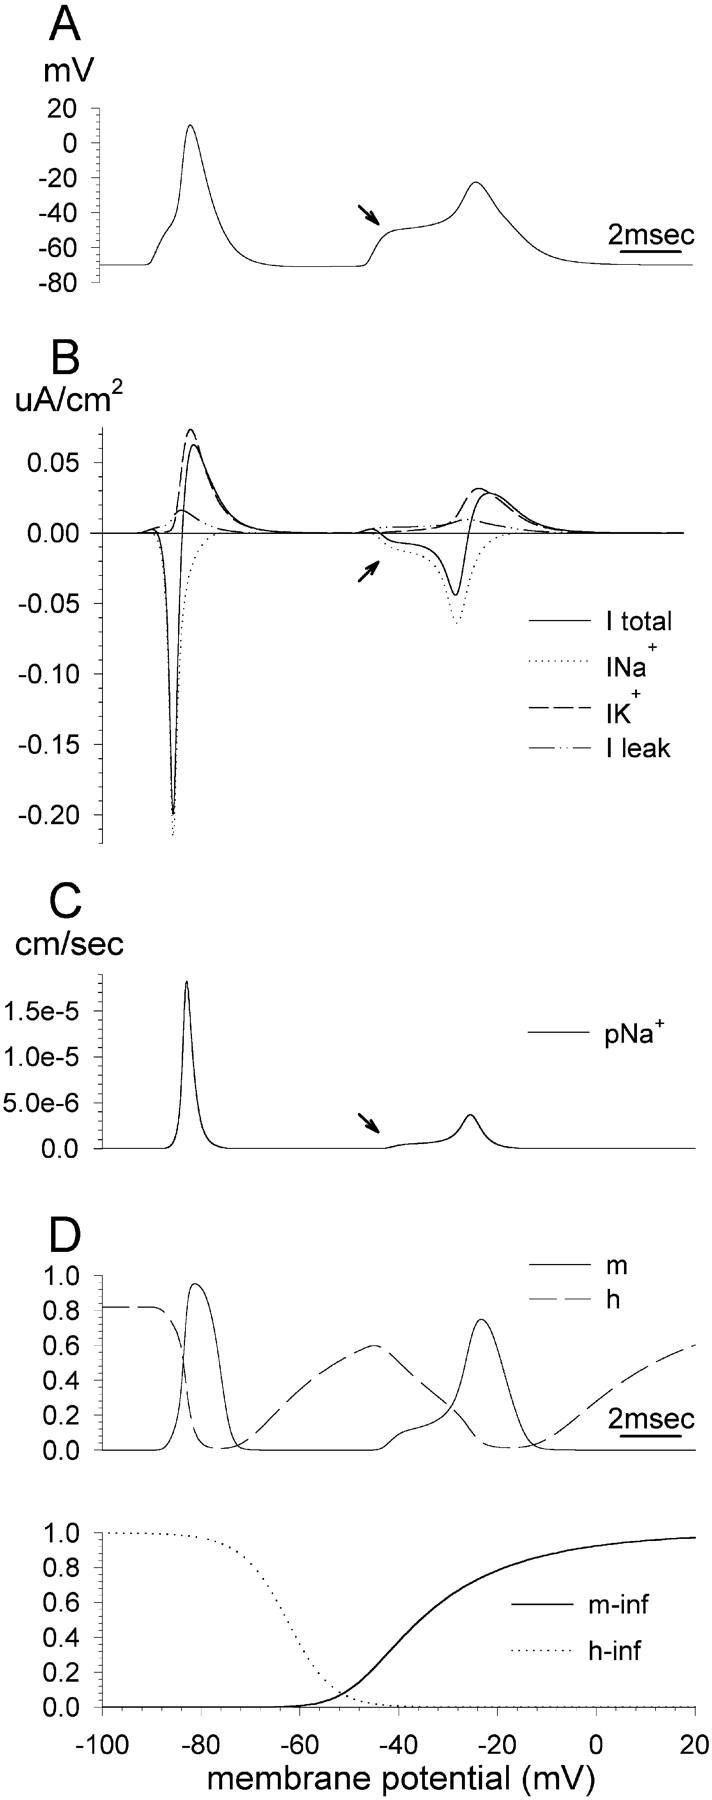
Biophysical events underlying the onset of the first and second soma spikes. The first stimulus of the pulse pair was applied at the beginning of the trace and the second 7.19 ms later. (A) Membrane potential recorded in the soma. (B) Transmembrane currents recorded in the soma. (C) Na+ ion permeability in the soma. (D) Values of the gating parameters m and h. Arrows indicate the onset of the second S-spike.
pNa+ is a function of pNamax+ (the maximal value of pNa+) and the dimensionless variables m and h (Frankenhaeuser and Huxley, 1964). m is increased by depolarization while h is decreased (Fig. 3 D, lower). With IPI = 7.19 ms, h had not fully recovered at the time of arrival of the second S-spike (Fig. 3 D, upper). Consequently, pNa+, INa+, and hence the net inward current were reduced, delaying and broadening the second S-spike. Nevertheless, after the NM-component, m increased rapidly, generating a large enough S-spike current to trigger a propagated extra spike. With increasing IPI, the value of m increased still more rapidly. The generation of extra spikes ceased at IPI = 7.4 ms, by which value the increase in m was very rapid, generating an S-spike that was too brief to generate a propagated extra spike.
Propagation of extra spikes
To gain further insight into the process of extra spike formation, we monitored the voltage changes along the stem axon during the course of the second S-spike. For IPI = 7.19–7.39 ms, the window within which propagated extra spikes formed, an extra spike was always generated along the stem axon after the second S-spike. Although of lower amplitude, the stem axon extra spike consistently preceded the extra spike recorded along the peripheral and central axon branches (Fig. 4).
At IPI values <7.19 ms and >7.39 ms no extra spike was recorded in the peripheral and central axons (Figs. 5 and 6). Failure to record an extra spike could, in principle, be due to failure of extra spike generation in the stem axon, or successful generation but failure to propagate. Propagation failure might occur at intervening sites of reduced safety factor, at the t-junction for example, or in the regions of enlargement of axonal diameter immediately beyond the t-junction. The distinction is not trivial to make because it requires a criterion for extra spike generation other than long-distance axonal propagation. Classically, a spike is defined by its ability to propagate a much greater distance than the space constant of the axon it is conveyed through. However, this definition is inappropriate in the present context given the short length and complex geometry of the stem axon/t-junction area. As an alternative criterion we used the amplitude and direction of the currents underlying extra spike generation. Specifically, an extra spike is said to have occurred at a given point if a net inward transmembrane current, synchronized with the inward sodium current, was present (Fig. 5, inset). That is, did the peak of the inward current exceed the integral of all outward currents at the recording point?
FIGURE 5.

Extra spikes are generated in the t-stem axon over a broader range of IPI values than support propagation into the main conducting axons. The two top horizontal lines indicate the range of IPI values for which a second NM- and S-spike were present in the cell soma. The remaining horizontal lines show the range of IPI values for which a criterion extra spike was present at the recording locations marked on the left. Insets show transmembrane currents at the first node of the stem axon using IPI = 7.18 ms (upper) and IPI = 7.19 ms (lower). The net current (I total) first became inward for IPI = 7.19 ms, the minimum IPI value for evoking propagated extra spikes.
FIGURE 6.
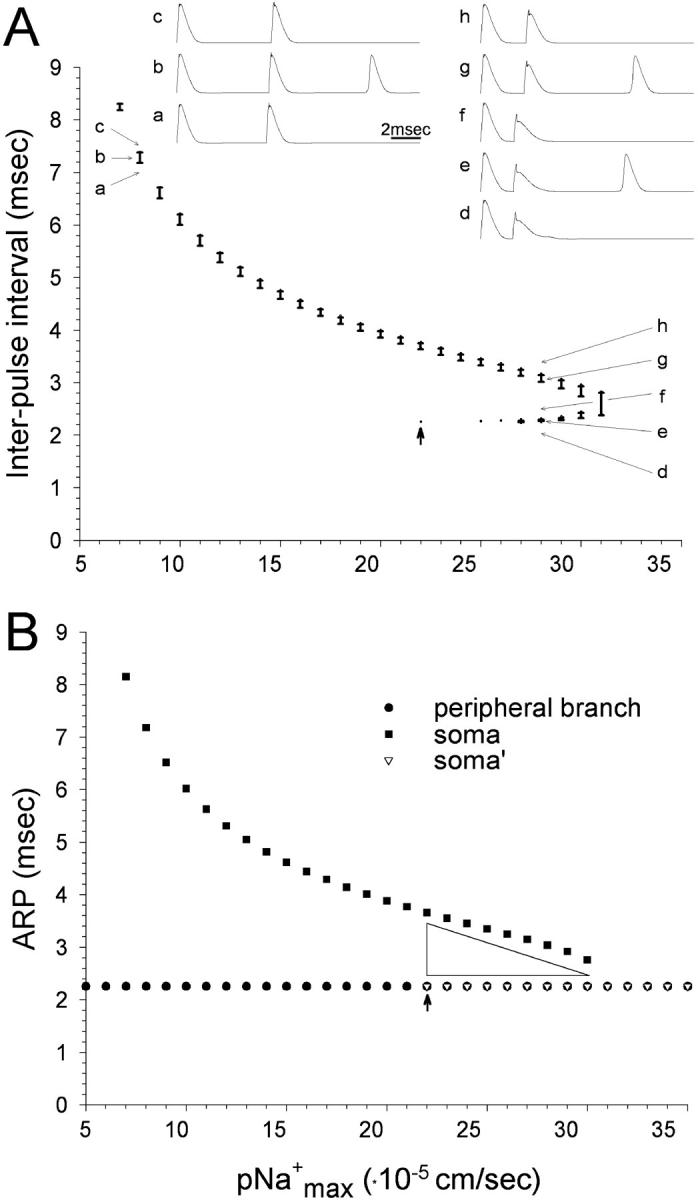
With increasing electrical excitability (pNamax+) extra spikes are generated using progressively shorter IPI values. Two successive stimuli were applied to the peripheral axon branch at the 20th node. (A) The range of IPI values that support extra spikes is indicated by vertical bars. For pNamax+ 22–31 cm/s extra spikes were evoked in two separate IPI ranges. Traces a–c (pNamax+ = 8 × 10⁻⁵ cm/s) and d–h (pNamax+ = 28 × 10−5 cm/s) illustrate zones with a single, and dual extra spike range. For pNamax+ < 7 × 10⁻⁵ cm/s and >31 × 10−5 cm/s extra spikes could not be evoked. (B) Recording from the soma and the peripheral axon branch, ARP for axonal propagation was unchanged over the entire range of pNamax+ values. ARP values for the soma declined with increasing pNamax+. For pNamax+≥22 × 10−5 cm/s ARP for the soma took the same value as the axon. See explanation for the difference between soma and soma′ in Results. The arrow at ARP = 22 × 10−5 cm/s indicates a discontinuity in the soma's ARP function. The physiological value of pNamax+ is ∼8 × 10⁻⁵ cm/s.
This criterion for extra spike formation was met at all axonal locations for IPI = 7.19–7.39 ms. The extra spike consistently appeared first at the initial segment and then propagated down the stem axon toward the t-junction and main axonal branches (Figs. 4 and 5). This implies that it was generated by the second S-spike at the initial segment. Criterion extra spikes were never observed in the cell soma itself. Recordings made at the initial segment showed that the extra spike was generated by the electrotonic decay of the second S-spike. The amplitude of the Na+ and net inward currents, and resultant extra spike, increased progressively at subsequent stem axon nodes along the path from the initial segment to the t-junction (Fig. 4).
Interestingly, there were certain IPI values at which extra spike generation occurred in the initial segment and adjacent parts of the stem axon but not in the peripheral or central branches. In the initial segment extra spikes were generated for IPI = 7.18–8.63 ms, and they propagated as far as the third node of the stem axon for IPI = 7.19–7.81 ms. For IPI = 7.19–7.43 ms they consistently passed the t-junction (Fig. 5). However, only for IPI = 7.19–7.39 ms did extra spikes successfully propagate along the full length of the main axon branches.
The influence of excitability in the soma and the initial segment
Tissue inflammation and axonal injury can increase soma and initial segment excitability. This is thought to be at least partially due to an increase in local sodium channel density (Devor et al., 1989; Waxman et al., 1994; Rizzo et al., 1995; Amir et al., 1999, 2002; Devor and Seltzer, 1999; Boucher et al., 2000). We tested the effect of conjointly changing values of pNamax+ of the soma and initial segment on extra spike formation and propagation. In the simulations described above, pNamax+ = 8 × 10⁻⁵ cm/s. For all values of pNamax+ between 7–31 × 10−5 cm/s propagated extra spikes were observed in the main axon within at least a narrow window of IPI values. This window of permissive IPI values shifted systematically lower with increasing excitability (Fig. 6). High pNamax+ values within the 7–31 × 10−5 cm/s range facilitated reliable soma invasion by the second spike, and hence supported extra spike formation at lower IPI values. At the same time it prevented extra spike formation at higher IPI values because it rendered the second S-spike too rapid and brief. When pNamax+ was reduced the S-spike began to fail, leaving only an NM-spike. This required an increase in IPI to restore invasion of the soma (Amir and Devor, 2003) and extra spike formation. For values of pNamax+ < 7 × 10⁻⁵ cm/s extra spikes failed to propagate into the axonal branches despite increased IPI, due to their low amplitude in the initial segment/stem-axon region. For values of pNamax+ > 31 × 10−5 cm/s, the second S-spike was too rapid and brief to trigger an extra spike, even using short IPI values approaching the cell's absolute refractory period (ARP) (Fig. 6).
Interestingly, at permissive values of pNamax+ beginning slightly above 21 × 10−5 cm/s, there were two ranges of IPI values within which extra spikes were evoked (arrow and inset in Fig. 6 A). These ranges reflect a true discontinuity as determined using tiny (0.01 cm/s) pNamax+ increments. Moreover, the parameters that yielded two ranges for extra spike formation also yielded two distinctive ranges for soma ARP (Fig. 6 B, Amir and Devor, 2003). The reason for the discontinuity is instructive. Using pNamax+ = 21.11 × 10⁻⁵ cm/s and IPI ≥ 3.76 ms, the spike successfully invaded the soma, setting the stage for extra spiking. This remained true when pNamax+ was very slightly increased, to 21.12 × 10⁻⁵ cm/s. However, soma invasion now began also to occur at IPI = 2.26 ms, the ARP of the axon membrane (soma′ in Fig. 6 B). But remarkably, using IPI between these two values (i.e., between 2.26 and 3.76 ms) the second spike failed to invade the soma, and extra spikes never occurred (inset, Fig. 6 A). Further increasing the value of pNamax+ continued to yield two narrow IPI domains that supported spike invasion and extra spikes, one just above 2.26 ms, and the other just below 3.76 ms (region marked with triangle in Fig. 6 B). The exact position of the two windows depended on pNamax+, and they converged into a single window near pNamax+ = 31 × 10−5.
The explanation of this behavior is to be found at the stimulation site on the peripheral axon. Increasing IPI above 2.26 ms caused the second spike to propagate centrally along the axon more quickly than at IPI = 2.26 ms. As a result, when it reached the t-junction, it fell within the ARP for spike invasion of the soma, precluding invasion. To overcome this effect, it was necessary to substantially increase IPI, or to substantially increase pNamax+ (Amir and Devor, 2003).
Extra spikes evoked by stimulus pulse trains
Tagini and Camino (1973) evoked extra spikes in live DRG neurons in vitro using trains of stimulus pulses (tetani). IPI at the stimulation frequencies used (≤108 Hz, IPI > 9.3 ms) were outside of the permissive window we found using pulse pairs (7.19–7.39 ms). This may have been due to basic parameters being somewhat different (e.g., gNamax+), or an additional effect of prolonged stimulus trains. To test this, we ran our simulation with the usual parameters, but applied pulse trains to the 20th peripheral node (first stimulus 2 × threshold, all subsequent stimuli 2.5 × threshold). Using trains two pulses in length (pulse pairs), extra spikes failed to be recorded along the axonal branches when IPI was increased above 7.39 ms. However, using trains of three pulses, extra spikes were recorded for IPI up to 8.1 ms. Progressively longer trains supported extra spiking at increasingly long IPI, hence lower firing frequency (Fig. 7). The reason for this is the progressive lengthening of the soma S-spike during the course of the train. The apparent asymptote in train length with IPI ∼8.7 ms (Fig. 7) suggests that this is the time required for full resetting of soma membrane conductances.
FIGURE 7.
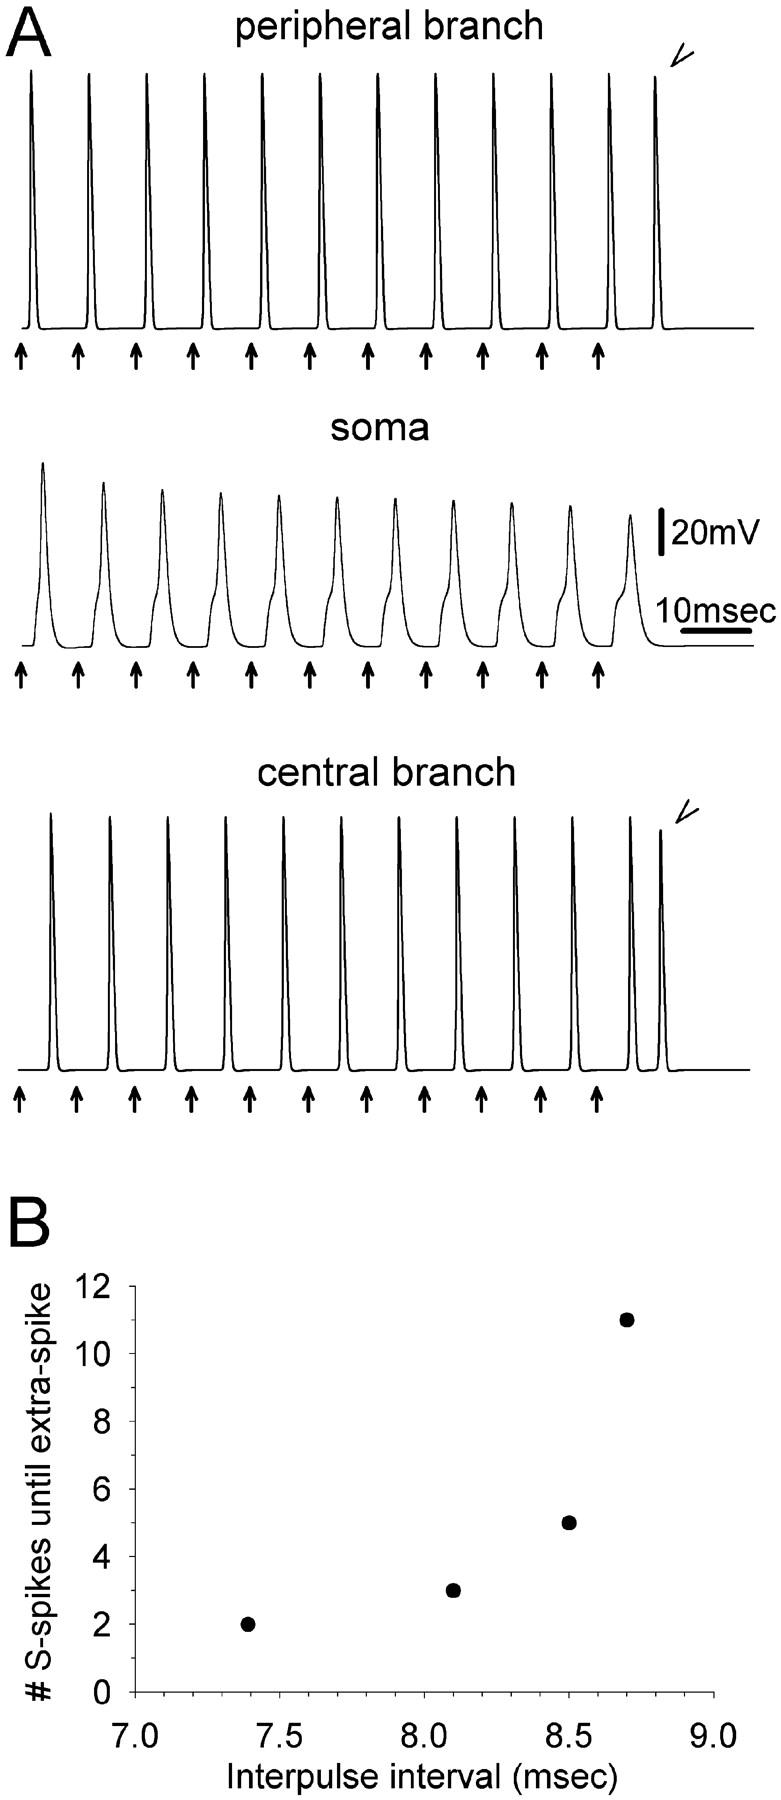
Extra spiking during tetanic stimulation. (A) Eleven stimulus pulses were delivered at the 20th peripheral node (arrows, IPI = 8.7 ms). Recordings were made from the most distal node of the peripheral axon branch (top), the soma (middle), and the last node of the central axon branch (bottom). During the tetanus, onset of the S-spike was progressively delayed. The eleventh stimulus evoked an extra spike, recorded in both the central and the peripheral branch (arrowheads). (B) Using stimulus trains, extra spikes are supported at progressively greater values of IPI.
Extra spikes generated during tetanic stimulation disrupt firing patterns
We followed soma and axonal responses to trains consisting of 50 consecutive suprathreshold pulses. For IPI > 8.7 ms (<115 Hz) a uniform train of 50 spikes was recorded at the end of the central branch and in the soma. For IPI ≤ 8.7 ms, however, the firing rhythm was disrupted. For example, using IPI = 8.1 ms the S-spike progressively broadened after each spike, and its peak was progressively delayed, until after the third S-spike an extra spike was generated (Fig. 8 A). The extra spike reached the end of the central branch, but on the peripheral branch it collided with and occluded the spike from the fourth stimulus pulse. This allowed the initial segment and soma extra recovery time before arrival of the fifth spike. The fifth spike evoked an S-spike with relatively fast onset, but subsequent spikes were again progressively delayed until the seventh once again generated an extra spike and collision, resetting the pattern. Interestingly, because of the collision, there was no overall change in the number of spikes that reached the end of the central axon branch. However, the spike pattern was altered, and the number of S-spikes evoked by the tetanus was reduced by 25%.
FIGURE 8.
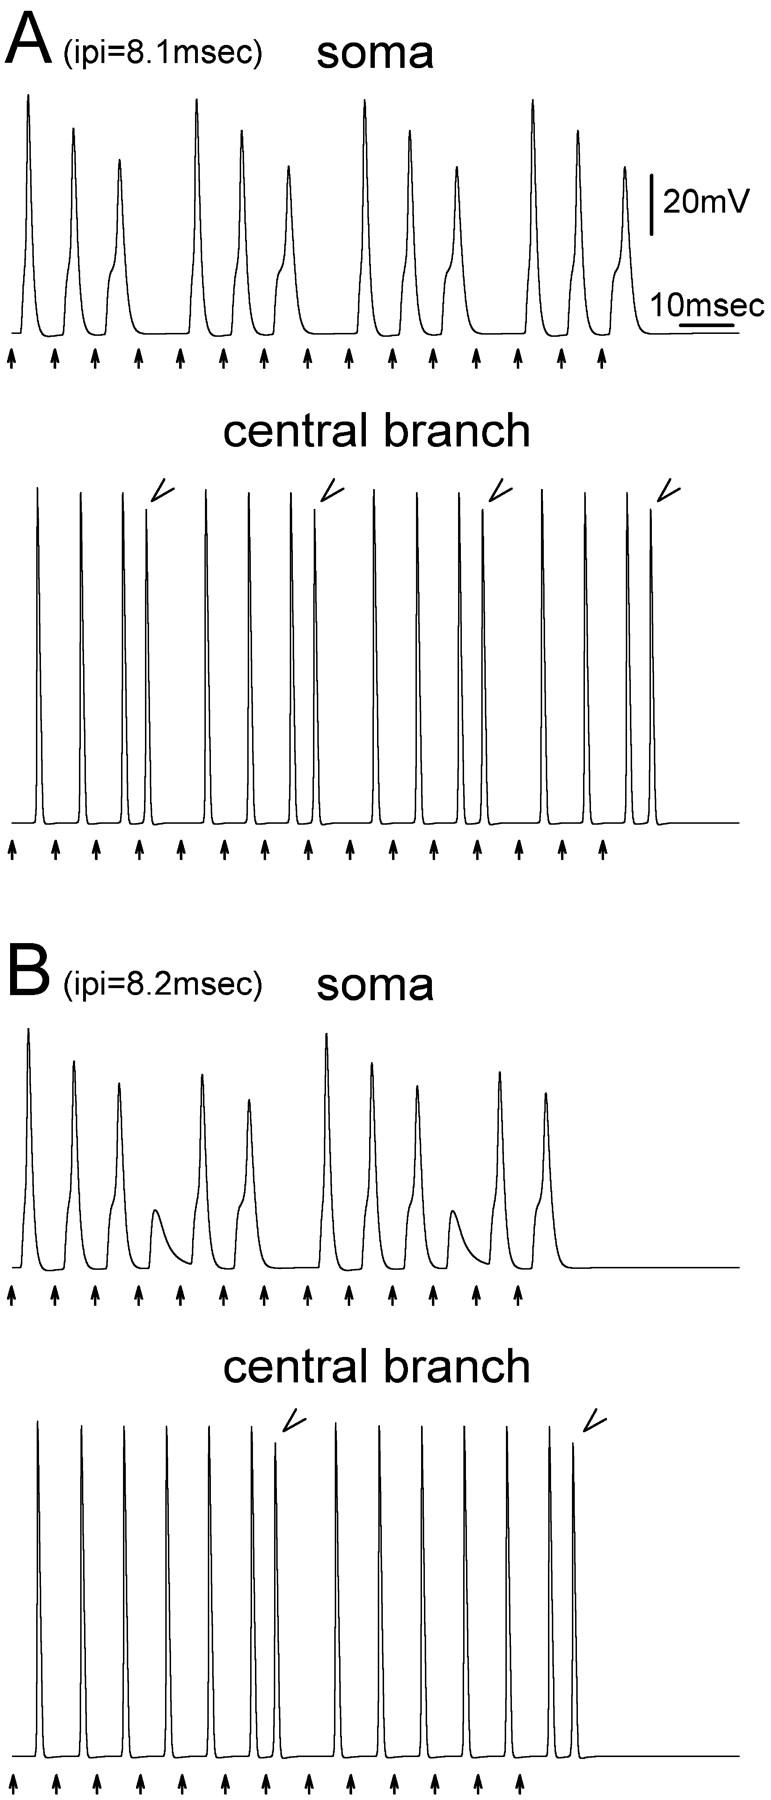
Extra spiking disrupts rhythmic firing patterns. Fifteen stimuli (arrows) were given at IPI = 8.1 ms (A) or 8.2 ms (B). Recordings were made from the soma and from the last node of the central axon branch. In A, an extra spike was inserted every fourth spike in the train (arrowheads). In B extra spikes occurred every seventh spike (arrowheads).
Extra spikes can alter firing pattern in more complex ways. In Fig. 8 B, for example (IPI = 8.2 ms), S-spike onset was progressively delayed during the tetanus. The first untoward event under these circumstances was not generation of an extra spike. Rather, the fourth spike failed to successfully invade the soma revealing an NM-spike. This allowed partial membrane recovery, permitting the fifth spike to invade the soma. The sixth (S-) spike then generated an extra spike that propagated into the central and peripheral branch causing occlusion as described above.
Note that since extra spikes follow the trigger spike at short latency, and collision block deletes a spike from the baseline train, the process of extra spike formation tends to increase the number of short and long interspike intervals and reduce the number of intermediate ones. This rendered the discharge pattern more staccato. Furthermore, because of S-spike failures, and the failure of extra spikes to invade the soma, extra spiking tends to cause a mismatch between soma spiking and axon discharge (Fig. 8).
DISCUSSION
We used an explicit model of the sensory neuron to define the location and mechanism of extra spike formation, and to show how extra spikes can disrupt the pattern of afferent spike trains. Extra spiking does not result simply from the impedance and capacitance load seen by the propagating action potential as it approaches the t-junction region in the DRG. Single spikes are minimally affected. Rather, it is a consequence of the peculiar pseudounipolar geometry of DRG neurons and depends on actual spike invasion of the cell soma. When a second spike invades the soma before somatic membrane conductances have fully reprimed, an extra, third spike may be generated ectopically. Because of this use-dependence, the disruption of afferent signaling is nonuniform and dependent on the pattern of the original spike train.
Site of extra spike generation
We confirmed the conclusion, originally based on electrophysiological evidence, that extra spikes are generated in the region of the DRG, and propagate from there into the main conducting axon—both the central (dorsal root) and the peripheral (nerve) branch (Tagini and Camino, 1973; Howe et al., 1976). In these earlier experiments propagating spikes were recorded from axons, at some distance from the presumed site of spike duplication. For this reason, the precise location of extra spike origin could not be determined. Our data indicate that generation occurs in the initial segment of the stem axon and not at other potential sites such as the t-junction. Extra spikes are not visible in the soma itself.
Interestingly, the generation of a regenerative spike in the initial segment does not guarantee that it will propagate successfully into the main conducting axon. Block may occur at points of reduced conduction safety factor downstream, particularly in the region of the t-junction. Failure of propagation is presumably due to the opposing forces of electrotonic decay that exponentially attenuates the amplitude of the generator potential with distance, and regenerative currents that depend on baseline membrane excitability and refractoriness due to the recent history of spike activity. In the case of successful extra spike propagation, inward Na+ current, net inward current, and the resultant extra spike amplitude all increase along the trajectory from the initial segment to the t-junction (Fig. 4). This increase is partly due to the fact that the current source for extra spikes is the S-spike in the cell soma. Accordingly, membrane segments closest to the soma, notably the initial segment, have less time to overcome refractoriness than membrane segments more distant from the soma, e.g., the t-junction.
Extra spike mechanism
In principle, extra spikes might have been due to a number of alternative mechanisms. Many large diameter DRG neurons, for example, generate a brief regenerative postspike depolarizing afterpotential that can give rise to spike doublets and bursts (Amir et al., 1999, 2002; Pedroarena et al., 1999; Wu et al., 2001). Extra spikes in our model, however, were not an outcome of such rebound depolarizing afterpotentials. Another possibility is late depolarization due to spike activity in neighboring DRG neurons (“cross-excitation,” Utzschneider et al., 1992; Amir and Devor, 1996; Amir et al., 2002). Such cell-to-cell interactions, however, were not represented in our simulation. They could also not account for extra spikes in vitro as no corresponding change in soma membrane potential was reported at times of extra spike triggering (Tagini and Camino, 1973; their Fig. 1 e). Moreover, intra-axonal stimulation of single afferents evoked extra spikes without the need to stimulate neighboring neurons. Our simulations indicated that extra spikes are a result of the delay and broadening of the S-spike generated by the arrival of an action potential within the relative refractory period of a previous spike. The interval between the first spike and the second, the IPI, is critical. The second S-spike, broadened sufficiently, re-excites the membrane it has just passed over (initial segment/stem axon), generating an extra spike. The spike is thus “reflected” back into the main conducting axons. Extra spikes can similarly be evoked at other loci of geometric inhomogeneity such as axonal bifurcations, or at sudden enlargements of axon diameter. At all of these sites some of the longitudinal current needed to keep the spike moving is dissipated in charging the increased capacitance of the enlarged membrane. The result is a local increase of spike duration especially at high firing frequencies (Goldstein and Rall, 1974; Parnas, 1979). In the DRG, extra spikes do not form at the t-junction bifurcation, but rather at the junction of the axon and cell soma. The presence of a second S-spike is essential. But this is not a general rule. In the lobster stretch receptor, for example, extra spikes are generated even when soma invasion fails (Calvin and Hartline, 1977).
Functional significance of extra spikes
Because of occlusion in the peripheral nerve branch, extra spike formation is not expected to increase the overall number of afferent spikes. However, spike patterning is altered. Extra spiking tends to increase the number of short and long intervals at the expense of intermediate ones, making previously tonic spike trains bursty. Such changes may have important consequences for sensory signaling by degrading the fidelity of central transmission of sensory messages generated in the periphery. The specifics of discharge pattern, and particularly the insertion of ectopic bursts, can powerfully alter the postsynaptic effect of an afferent spike train (Burke et al., 1976; Lisman, 1997; Baccus, 1998). The relation between impulse encoding at sensory endings and spike invasion of the cell soma may also have long-term consequences for cell metabolism and the regulation of excitability in DRG neurons (Devor 1999; Amir and Devor, 2003).
The probability of extra spike formation is fundamentally use-dependent, varying with instantaneous firing frequency (IPI) and the repriming kinetics of the cell soma. Activation of electrogenic pumps, and accumulation of ions in the extracellular space due to recent spike history may also have an effect (Rang and Ritchie, 1968; Parnas, 1979). When afferent input is rhythmic, i.e., when spike trains have a fixed interspike interval, extra spiking yields a recurring, cyclic change in discharge pattern (Fig. 8). However, in vivo, input spike trains that arise from natural sensory stimuli often feature complex sequences of variable interspike interval. Under these conditions extra spiking is likely to induce unpredictable and perhaps even chaotic changes in spike patterning.
Geometrical and biophysical heterogeneity of the DRG neuron may also significantly alter the probability of extra spike formation and/or propagation into the main axon branches. Such factors may also cause extra spikes to be preferentially propagated into the peripheral rather than the central axon branch (Tagini and Camino, 1973). It is therefore likely that the impact of extra spiking varies not only with recent spike history but also with the functional type of the afferent neuron involved, e.g., low threshold mechanoreceptors versus nociceptors. Indeed, Tagini and Camino (1973) reported that extra spikes occur preferentially in large rather than small diameter myelinated axons. Moreover, since both afferent firing pattern and somatic membrane conductances may be radically altered in the event of neuropathology (Amir and Devor, 1996; Waxman et al., 1999; Devor et al., 2002), effects of extra spiking might contribute to sensory abnormalities associated with nerve injury and disease. For example, it has previously been proposed that in the context of patchy segmental demyelination, extra spike formation might amplify afferent signals and hence contribute significantly to active clinical symptoms such as paresthesia and pain (Howe et al., 1976; Calvin et al., 1977). Extra spiking at the stem axon/t-junction complex could likewise contribute to sensory abnormalities by differentially altering spike pattern.
Acknowledgments
This work was supported by grants from the German-Israel Foundation for Research and Development, the United States-Israel Binational Science Foundation, and the Charles Smith Family National Institute for Psychobiology in Israel.
References
- Amir, R., and M. Devor. 1996. Chemically-mediated cross-excitation in rat dorsal root ganglia. J. Neurosci. 16:4733–4741. [DOI] [PMC free article] [PubMed] [Google Scholar]
- Amir, R., and M. Devor. 2003. Electrical excitability of the soma of sensory neurons is required for spike invasion of the soma, but not for through-conduction. Biophys. J. 84:2181–2191. [DOI] [PMC free article] [PubMed] [Google Scholar]
- Amir, R., M. Michaelis, and M. Devor. 1999. Membrane potential oscillations in dorsal root ganglion neurons: role in normal electrogenesis and in neuropathic pain. J. Neurosci. 19:8589–8596. [DOI] [PMC free article] [PubMed] [Google Scholar]
- Amir, R., M. Michaelis, and M. Devor. 2002. Burst discharge in primary sensory neurons: triggered by subthreshold oscillations, maintained by depolarizing afterpotential. J. Neurosci. 22:1187–1198. [DOI] [PMC free article] [PubMed] [Google Scholar]
- Baccus, S. A. 1998. Synaptic facilitation by reflected action potentials: enhancement of transmission when nerve impulses reverse direction at axon branch points. Proc. Natl. Acad. Sci. USA. 95:8345–8350. [DOI] [PMC free article] [PubMed] [Google Scholar]
- Boucher, T. J., K. Okuse, D. L. Bennett, J. B. Munson, J. N. Wood, and S. B. McMahon. 2000. Potent analgesic effects of GDNF in neuropathic pain states. Science. 290:124–127. [DOI] [PubMed] [Google Scholar]
- Burchiel, K. J., and A. R. Wyler. 1978. Ectopic action potential generation in peripheral trigeminal axons. Exp. Neurol. 62:269–281. [DOI] [PubMed] [Google Scholar]
- Burke, R. E., P. Rudomin, and F. D. I. Zajac. 1976. The effect of activation history on tension production by individual muscle units. Brain Res. 109:515–529. [DOI] [PubMed] [Google Scholar]
- Calvin, W. H., and D. K. Hartline. 1977. Retrograde invasion of lobster stretch receptor somata in control of firing rate and extra spike patterning. J. Neurophysiol. 40:106–118. [DOI] [PubMed] [Google Scholar]
- Calvin, W. H., J. D. Loeser, and J. F. Howe. 1977. A neurophysiological theory for the pain mechanism of tic doloreux. Pain. 3:147–154. [DOI] [PubMed] [Google Scholar]
- Devor, M. 1999. Unexplained peculiarities of the dorsal root ganglion. Pain. (suppl.6):S27–S35. [DOI] [PubMed] [Google Scholar]
- Devor, M., R. Amir, and Z. H. Rappaport. 2002. Pathophysiology of trigeminal neuralgia: the ignition hypothesis. Clin. J. Pain. 18:4–13. [DOI] [PubMed] [Google Scholar]
- Devor, M., C. H. Keller, T. Deerinck, S. R. Levinson, and M. H. Ellisman. 1989. Na+ channel accumulation on axolemma of afferents in nerve end neuromas in Apteronotus. Neurosci. Lett. 102:149–154. [DOI] [PubMed] [Google Scholar]
- Devor, M., and Z. Seltzer. 1999. Pathophysiology of damaged nerves in relation to chronic pain. In Textbook of Pain, 4th ed. P. D. Wall and R. Melzack, editors. Churchill Livingstone, London. pp. 129–164.
- Frankenhaeuser, B., and A. F. Huxley. 1964. The action potential in the myelinated nerve fiber of Xenopus laevis as computed on the basis of voltage clamp data. J. Physiol. (Lond.). 171:302–315. [DOI] [PMC free article] [PubMed] [Google Scholar]
- Goldstein, S. S., and W. Rall. 1974. Changes of action potential shape and velocity for changing core conductor geometry. Biophys. J. 14:731–757. [DOI] [PMC free article] [PubMed] [Google Scholar]
- Gottschaldt, K.-M., and A. Fakoya. 1977. Backfiring in trigeminal afferent nerve fibers of the goose elicited by antidromic stimulation. In Pain in the Trigeminal Region. Anderson and Matthews, editors. Elsevier/North-Holland Biomedical Press.
- Hines, M. 1989. A program for simulation of nerve equations with branching geometry. Int. J. Biomed. Comp. 15:69–76. [DOI] [PubMed] [Google Scholar]
- Howe, J. F., W. H. Calvin, and J. D. Loeser. 1976. Impulses reflected from dorsal root ganglia and from focal nerve injuries. Brain Res. 116:139–144. [DOI] [PubMed] [Google Scholar]
- Ito, M. 1957. The electrical activity of spinal ganglion cells investigated with intracellular microelectrodes. Jap. J. Physiol. 7:297–323. [DOI] [PubMed] [Google Scholar]
- Ito, M., and M. Saiga. 1959. The mode of impulse conduction through the spinal ganglion. Jap. J. Physiol. 9:33–42. [DOI] [PubMed] [Google Scholar]
- Lisman, J. E. 1997. Bursts as a unit of neural information: making unreliable synapses reliable. Trends Neurosci. 20:38–43. [DOI] [PubMed] [Google Scholar]
- Parnas, I. 1979. Propagation in nonuniform neurites: form and function in axons. In The Neurosciences, 4th Study Program. F. O. Schmitt, and F. G. Worden, editors. MIT Press, Cambridge, Massachusetts.
- Pedroarena, C. M., I. E. Pose, M. H. Chase, and F. R. Morales. 1999. Oscillatory membrane potential activity in the soma of a primary afferent neuron. J. Neurophysiol. 82:1465–1476. [DOI] [PubMed] [Google Scholar]
- Rang, H. P., and J. M. Ritchie. 1968. On the electrogenic sodium pump in mammalian non-myelinated nerve fibers and its activation by various external cations. J. Physiol. (Lond.). 196:183–221. [DOI] [PMC free article] [PubMed] [Google Scholar]
- Rizzo, M. A., J. D. Kocsis, and S. G. Waxman. 1995. Selective loss of slow and enhancement of fast Na+ currents in cutaneous afferent DRG neurons after axotomy. Neurobiol. Dis. 2:87–96. [DOI] [PubMed] [Google Scholar]
- Stoney, S. D. 1985. Unequal branch point filtering action in different types of dorsal root ganglion neurons of frogs. Neurosci. Lett. 59:15–20. [DOI] [PubMed] [Google Scholar]
- Stoney, S. D. 1990. Limitation on impulse conduction at the branch point of afferent axons in frog dorsal root ganglion. Exp. Brain Res. 80:512–524. [DOI] [PubMed] [Google Scholar]
- Tagini, G., and E. Camino. 1973. T-shaped cells of dorsal ganglia can influence the pattern of afferent discharge. Pflugers Arch. 344:339–347. [DOI] [PubMed] [Google Scholar]
- Utzschneider, D., J. Kocsis, and M. Devor. 1992. Mutual excitation among dorsal root ganglion neurons in the rat. Neurosci. Lett. 146:53–56. [DOI] [PubMed] [Google Scholar]
- Waxman, S. G., T. R. Cummins, S. Dib-Hajj, J. Fjell, and J. A. Black. 1999. Sodium channels, excitability of primary sensory neurons, and the molecular basis of pain. Muscle Nerve. 22:1177–1187. [DOI] [PubMed] [Google Scholar]
- Waxman, S. G., J. D. Kocsis, and J. A. Black. 1994. Type III sodium channel mRNA is expressed in embryonic but not in adult spinal sensory neurons, and is reexpressed after axotomy. J. Neurophysiol. 72:466–470. [DOI] [PMC free article] [PubMed] [Google Scholar]
- Wu, N., C.-F. Hsiao, and S. Chandler. 2001. Membrane resonance and subthreshold membrane oscillations in mesencephalic V neurons: participants in burst generation. J. Neurosci. 21:3729–3739. [DOI] [PMC free article] [PubMed] [Google Scholar]