

Abstract
The growth of an actin network against an obstacle that stimulates branching locally is studied using several variants of a kinetic rate model based on the orientation-dependent number density of filaments. The model emphasizes the effects of branching and capping on the density of free filament ends. The variants differ in their treatment of side versus end branching and dimensionality, and assume that new branches are generated by existing branches (autocatalytic behavior) or independently of existing branches (nucleation behavior). In autocatalytic models, the network growth velocity is rigorously independent of the opposing force exerted by the obstacle, and the network density is proportional to the force. The dependence of the growth velocity on the branching and capping rates is evaluated by a numerical solution of the rate equations. In side-branching models, the growth velocity drops gradually to zero with decreasing branching rate, while in end-branching models the drop is abrupt. As the capping rate goes to zero, it is found that the behavior of the velocity is sensitive to the thickness of the branching region. Experiments are proposed for using these results to shed light on the nature of the branching process.
INTRODUCTION
In numerous instances of actin-based motility, including extension of lamellipodia in cells (Small et al., 2002), and “rocketing” motion of Listeria monocytogenes (Dramsi and Cossart, 1998; Goldberg, 2001), or small beads coated with actin-polymerization activators (Cameron et al., 2001; Bernheim-Grosswasser et al., 2002), actin filaments form a branched network structure. Typical densities of filamentous actin in such networks are 1 mM, and spacings between branches along a filament are often in the range 40–70 nm (Svitkina et al., 1997; Svitkina and Borisy, 1999). The filaments are eventually terminated by capping proteins, which prevent further filament growth. The branch points have a characteristic angle of 70° and are decorated by a seven-subunit complex of actin-related proteins, Arp2/3. This complex has a low constitutive activity. However, it can be activated directly or indirectly by several agents associated with the obstacle (the cell membrane or the bacterial/bead surface). These agents include the membrane phospholipid PIP2, the membrane-associated protein Cdc42, and the bacterial surface protein ActA. In the case of Cdc42 and PIP2, intermediate proteins such as Scar and WASp are required for Arp2/3 activation. These are also constitutively inactive but can be activated by Cdc42 or PIP2. When the Arp2/3 is activated, it causes new branches to form on existing filaments and thereby greatly stimulates actin polymerization in the vicinity of the obstacle. The branching activity of Arp2/3 has been confirmed by in vitro studies (Mullins et al., 1998).
While several of the basic biochemical events in the pathway leading to Arp2/3-induced actin assembly are well established, the details of the process by which new filaments are generated at the obstacle are not well understood. The following issues are among those that are unresolved:
The relative importance of branching along filament sides and branching at their ends
Initial data (Pantaloni et al., 2000) comparing the lengths of mother and daughter filaments (beyond the branch point) found a close correlation, suggesting the dominance of end branching. However, recent total internal-reflection fluorescence microscopy studies (Amann and Pollard, 2001a,b) of single filaments have found that most branches are formed along filament sides. A recent confocal microscopy study (Ichetovkin et al., 2002) found that branches can form anywhere along the sides of filaments, but that there were numerous instances of new branches forming very near the barbed end, and branches formed more readily on newly grown filaments. This suggested that branch formation could be enhanced in the ATP cap region near a filament barbed end.
The thickness of the region near the obstacle where new branches can form
Branch formation could, for example, be activated by direct contact with membrane proteins; on the other hand, Arp2/3 could be activated by membrane-bound proteins and subsequently diffuse to the branching point, or it could be indirectly activated by effectors of these proteins. In a recently proposed model for filament generation at membranes (Wear et al., 2000), Cdc42 and PIP2 in the membrane are first activated by an external signal. They interact with WASp, causing it to change to a partly active conformation. Binding of actin to WASp completes its activation. Then the WASp binds to, and activates, the Arp2/3 complex, which is also associated with a filament. Finally, a new filament grows from the activated Arp2/3 complex. In this model, if the WASp is attached to the Cdc42 and PIP2, branching could only occur if the Arp2/3 is essentially in physical contact with the obstacle; if the WASp detaches, the branching region could be wider.
Whether new filaments are created on existing filaments, or are created free and subsequently diffuse and attach to existing filaments (cf. Fig. 1)
FIGURE 1.

Schematic of autocatalytic versus nucleation-based branch-generation processes. d: branching layer thickness. θ: angle between filament and growth direction.
We term these models the autocatalytic and nucleation models, respectively. In autocatalytic models, the formation rate of new branches is proportional to the number of filaments or amount of polymerized actin in the branching region; in nucleation models, it is independent of the number of preexisting branches. The scenario (Wear et al., 2000) discussed above leads to an autocatalytic behavior if the concentrations of Arp2/3 and WASp are not rate limiting, since the Arp2/3 is filament associated. Such autocatalytic models have generally been in favor because of the enhancement of Arp2/3 in vitro nucleating activity in the presence of preformed filamentous actin (Machesky et al., 1999; Higgs et al., 1999; Pantaloni et al., 2000). In the absence of preformed filaments, actin polymerization in the presence of activated Arp2/3 typically has a lag time on the order of minutes; this lag time is eliminated by the presence of preformed filaments. We also note that in vitro polymerization kinetics are well described by autocatalytic models (Pantaloni et al., 2000). It is plausible that the generation of new filaments in lamellipodia and around intracellular pathogens/beads involves essentially the same steps as the in vitro studies. However, the sequence of steps may not necessarily be the same as in the in vitro studies. If the concentration of Arp2/3 or its activators is rate limiting, then the generation rate for new filaments will be nearly independent of the filament concentration. At present, there appears to be no straightforward experimental method for distinguishing between the autocatalytic and nucleation models in vivo. The true behavior is very likely somewhere between the limiting cases defined here, but these cases form a useful conceptual framework.
The main purpose of this paper is to evaluate the dependence of the growth velocity of actin networks on key protein concentrations and opposing force, and to ascertain how these dependences are modulated by key molecular-scale details of the branching process, including the relative importance of side and end branching, the thickness of the branching region, and whether the branching process is autocatalytic or nucleation driven. These predicted dependences can be combined with experimental measurements to establish important molecular aspects of the branching process. Because the autocatalytic model is more plausible in view of existing experimental data, we treat it in more detail; our treatment of the nucleation model is mainly focused on distinguishing it from the autocatalytic model experimentally. We have previously evaluated (Carlsson, 2001) the dependence of the growth velocity on branching rate, capping rate, and opposing force, for an autocatalytic branch generation model, using a stochastic simulation methodology. These simulations showed that over a limited range of parameters at fixed actin concentration, the growth velocity drops linearly with increasing capping rate, and drops to zero for values of the branching rate at which the number of branches per filament is less than ∼1.5. It was also found that the growth velocity is nearly independent of the applied force. The present paper treats some of the same issues using a deterministic rate-equation model. This approach has three advantages over the stochastic-growth approach. First, it is possible to prove rigorous results within such a model, and this explains some puzzling results of the stochastic-growth simulations. Second, it is possible to treat parameter regimes that were computationally forbidding using the stochastic-simulation methodology, in particular the limits of small capping-protein concentration and slow growth. The former leads to an unwieldy number of branches per filament, and the latter results are very sensitive to stochastic fluctuations in the simulations. Finally, by analysis of the deterministic equations, it is possible to find intuitive explanations for the behavior of the growth velocity.
Autocatalytic model
Our model assumes a flat obstacle of finite size in two or three dimensions, although the rigorous results that we prove hold for an obstacle of arbitrary shape. The branching mechanism is such that new filaments are generated inside a narrow branching region, of thickness d, at the obstacle. Only filaments within a distance d of the obstacle can branch. In a rigorously two-dimensional model, d would be a width, but since there is a always a third dimension present, we will still call d a thickness. The mathematical approach uses simple rate equations based on the laterally averaged filament orientation distribution n(θ,t), where t is time, and θ is the angle of a filament with respect to the normal to the surface (cf. Fig. 1). The component υ of the filament growth velocity in the direction of network growth is related to the orientation by υ(θ) = Vmax cos θ, where Vmax is the growth velocity of a free filament. The number of filament ends in the branching region, per unit of obstacle length (in two dimensions) or obstacle area (in three dimensions) with angles between θ and θ + dθ is n(θ, t)dθ. The main factors of interest to us are the formation of new filaments inside the branching region, the capping of existing filaments, and the motion of the obstacle away from the filaments in the branching region. We ignore potential effects of uncapping and branch detachment; the rationale for this is discussed in the section “Sensitivity to key approximations.”
We thus employ the following equation of motion for the filament orientation distribution:
 |
(1) |
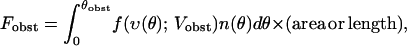
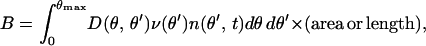
Here θmax is the maximum value of θ (taken to be 180° for most of our calculations), kbr is the total branching rate for a filament with θ = 0, kcap is the capping rate, D(θ, θ′) is the distribution of filament orientations generated by branching from filaments of orientation θ′, and ν(θ) is a factor describing the dependence of filament length on orientation in side-branching models; in end-branching models, we take ν(θ) = 1. Vobst is the obstacle velocity, and H is the Heaviside step function, defined by H[Vobst − υ(θ)] = 1 if Vobst > υ(θ) and H[Vobst − υ(θ)] = 0 if Vobst ≤ υ(θ). For end branching models, we assume that, unless θ is restricted, the overall rate of branching from a given filament is independent of θ′. Thus  for all θ′. For side-branching models, we assume that the rate of branching from a given filament is proportional to the length of its portion inside the branching region, as described by the ν(θ) term. Detailed forms for D(θ, θ′) and ν(θ) are given in the next section. The last term on the right-hand side describes filaments with υ < Vobst leaving the branching region. The rate of this process is proportional to the spatial number density of filament ends at the back end of the branching region. (Here and in the rest of the paper, the term “density” will always refer to number density rather than mass density.) For most values of θ, the relative velocity of the filaments and the obstacle is large enough that the distribution is fairly constant in space; in this case the density can be approximated by n(θ, t)/d, leading to the first term in square brackets. However, filaments with υ very close to Vobst can remain in the branching region long enough that the density at back of the branching region greatly exceeds that at the front, because of exponential growth due to branching (and modified by capping). For such filaments, we assume a time growth rate of kbrν(θ) − kcap, leading to a spatial growth rate of (kbrν(θ) − kcap)/(Vobst − υ). This yields the second term inside the brackets. For filaments with υ > Vobst, we include no leaving terms. Filaments are not able to leave at the front end of the branching region because they are blocked by the obstacle, and they cannot grow in from the back end, since branching cuts off there, so that no new filaments can be nucleated beyond that point.
This model is closely related to one previously employed (Maly and Borisy, 2001) in the calculation of actin filament orientation distributions near obstacles. The main difference is that effects of filaments leaving the branching region are treated explicitly in the present model. This allows us to study the mechanism for establishing the steady-state number of filaments and velocity. In Maly and Borisy (2001), these were treated as fixed inputs. Our model is also related to those studied in Mogilner and Oster (2003) and Mogilner and Edelstein-Keshet (2002); the parallel is explored in more detail in the section describing nucleation models.
Rigorous properties of rate equation
In this section, we demonstrate two rigorous steady-state properties of the rate equation (Eq. 1): that the growth velocity is independent of the applied force, and that the network density is proportional to the applied force. These results hold regardless of the form of the branching orientation distribution D(θ, θ′), and are independent of the shape of the obstacle. Before proving the results, we first clarify the mechanism by which the steady-state Vobst is determined. Fig. 2 sketches the generic behavior. We consider the limits Vobst = 0 and Vobst = Vmax first. If Vobst = 0, then the leaving terms vanish for filaments with θ < 90°. If we define  as the rate of branching restricted to the subset of filaments with θ < 90°, then Eq. 1 implies that the total number of filaments touching the obstacle,
  satisfies
 |
(2) |
where the relation is an inequality because additional touching branches can be produced by nontouching filaments. Eq. 2 gives exponential growth if  This inequality holds for the networks that have been studied by electron microscopy. Since the θ > 90° region includes half of the angles available for branching,
  is roughly half of kbr. The ratio kbr/kcap, in turn, is the ratio of the filament length to the branch spacing, and this is five or more in the observed structures (Svitkina et al., 1997; Svitkina and Borisy, 1999). Thus dntouch/dt > 0 for Vobst = 0. On the other hand, when Vobst is very close to Vmax, only a very small fraction of newly generated filaments will touch the obstacle, so capping and leaving terms will dominate. Then dntouch/dt < 0. The value of dntouch/dt will then cross zero at a value of Vobst between 0 and Vmax, and this determines the steady-state velocity.
FIGURE 2.

Mechanism determining steady-state obstacle velocity Vobst in autocatalytic models. Vmax: free-filament growth velocity. ntouch: number of filaments touching obstacle. Steady-state velocity is that for which dntouch/dt = 0.
The above discussion is somewhat incomplete because dntouch/dt is determined not just by ntouch, but by the entire distribution n(θ, t). The time evolution of n(θ, t) can be described more precisely by noting that the growth or decay of the filament density is determined by the eigenvalues of the right-hand side of Eq. 1. The largest eigenvalue will dominate at large times. For Vobst = Vmax, all of the eigenvalues are negative and the solution decays. For Vobst = 0, there will be a positive eigenvalue, and the filament density will grow exponentially. At a critical value of Vobst, the largest eigenvalue will cross zero, and this is the steady-state value of Vobst. The filament orientation distribution is proportional to the eigenvector corresponding to the zero eigenvalue, as was noted by Maly and Borisy (2001).
To show that the growth velocity is independent of the applied force, we first demonstrate that if n(θ) is a steady-state solution, then any multiple of n(θ) is also a steady-state solution. This follows immediately from the form of Eq. 1, since each term is linear in n(θ, t). We then write the total force exerted by the filaments on the obstacle as
 |
(3) |
where f(υ(θ); Vobst) is the force exerted by a filament at an angle θ on an obstacle moving at velocity Vobst, θobst is defined by υ(θobst) = Vobst, and the total force contains a factor of either area or length according to whether the model is three or two dimensional. Filaments growing at angles greater than θobst exert no force since they do not remain in contact with the obstacle. If a given set [n(θ), F, Vobst] gives a steady-state solution, then Eqs. 1 and 3 show that for any α the set [αn(θ), αF, Vobst] will also give a steady-state solution. Thus for any force αF, the steady-state velocity will be Vobst; the filament orientation distribution is αn(θ), and is thus proportional to the applied force.
The physical scenario leading to the obstacle velocity being independent of the applied force is that when the force on the obstacle is increased, the obstacle will temporarily slow, allowing the creation of new filaments, until the filament density is precisely that required to compensate for the additional obstacle force. Then the velocity returns to its steady-state value. The present results explain the corresponding results found in the stochastic-growth simulations (Carlsson, 2001), which were not previously understood. The result obtained here is significantly more general than that obtained in these simulations. The only aspect of Eq. 1 used to derive the result is that all the terms are linear in n(θ). Therefore, the result would also hold for obstacles of arbitrary shape, for which D(θ,θ′) would depend on the position of the branching filament. It also holds for any form of the interaction force between the filaments and the obstacle. It continues to hold when several effects not included in the present model are included, but its validity will be limited when filament-filament interactions, depletion of actin and actin-binding proteins, and filament-number fluctuation effects are important. These aspects of the results are discussed in the section Sensitivity to key approximations.
Numerical solution of rate equation
Evaluation of the dependence of the growth velocity on the rate parameters kbr and kcap provides several avenues for comparing the model predictions with experimental data. These parameters should correspond roughly to the concentration of activated Arp2/3 complex and capping protein. However, the correspondence is not exact, since changes in the concentrations of these proteins can lead to changes in the free actin monomer concentration and thus change Vmax, as well as kbr. In addition, the net branching and capping rates will be determined by capping-uncapping and branching-debranching equilibria, which do not give a strictly linear dependence of the rates on the protein concentrations. To evaluate the dependence of the growth velocity on kbr and kcap, we solve the rate equation numerically, using four different forms for D(θ,θ′):
Two-dimensional geometry, end branching
In this geometry, we assume a Gaussian spread of the branching angle of width Δθ = 10° with respect to its average value θbr = 70°. This value is a rough mean of the measured widths of the distribution in in vitro experiments, which range from 7° (Mullins et al., 1998) to 10°–13° (Blanchoin et al., 2000). Then
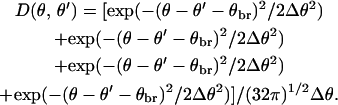 |
(4) |
The alternating plus and minus signs preceding θbr correspond to branching in clockwise and counterclockwise directions, and those in front of θ′ account for branching from the right semicircle to the left semicircle.
Three-dimensional geometry, end branching
In this geometry, we assume the same values of θbr = 70° and Δθ = 10° as in the two-dimensional model. However, in three dimensions the orientation distribution is more complicated because different values of the azimuthal angle φ (the angle describing rotation about the mother filament) of the new filament give different values of θ. One readily shows that
 |
(5) |
where φ = 0 is chosen to be in the plane defined by the orientations of the mother filament and the normal to the obstacle. Then
 |
(6) |
which, after simplification, yields
 |
(7) |
where φ is determined by Eq. 5 and we choose 0 ≤ φ ≤ 180°. We include the broadening by writing D(θ, θ′) as a linear combination of terms of the form given by Eq. 7, for closely spaced set of values of θbr, with weights determined by the Gaussian distribution used in Eq. 4.
Two-dimensional geometry, side branching
When side branching is present, filaments nearly parallel to the obstacle will have a greater length inside the branching region, and will thus branch more rapidly than those perpendicular to the obstacle. We take this into account by multiplying the end-branching result of Eq. 4 by the following angular factor, which takes different forms for filaments with υ > Vobst and those with υ < Vobst:
 |
 |
(8) |
This factor is approximately equal to the average filament length, divided by d. In the first case, the filament ends are in contact with the obstacle, and the 1/cosθ term comes from the length of the piece of an infinitely long filament that is inside the branching region; the Vmax/kcapd term accounts for the finiteness of the filament length induced by capping. In the second case, the last term accounts for the fact that the filament length is limited by the amount of time it has spent in the branching region. A calculation assuming uniform filament distributions shows that the average age of a filament in the branching region is d/4(Vobst − υ(θ′)).
Three-dimensional geometry, side branching
The three-dimensional end-branching result, Eq. 7, is multiplied by the same factor ν(θ′) as in the two-dimensional case.
To obtain the obstacle velocity, the integral in Eq. 1 is replaced by a Riemann sum over a finely spaced set of values of θ and θ′. This converts it into a matrix equation of the form  , where the coefficients Aij include all of the terms in Eq. 1. A standard eigenvalue finder (dgees.f in the Lapack library (Anderson et al., 1999)) is used to find the eigenvalues of the matrix Aij. They are monotonically decreasing as a function of Vobst, and a search is made over a range of possible values of Vobst to find the value of Vobst at which the largest eigenvalue is closest to zero, which gives dni/dt = 0 and thus leads to steady-state behavior.
The results are plotted in Fig. 3 vs. kbr and Fig. 4 vs. kcap. In generating Fig. 3, we use a fixed value of 0.35 s−1 for kcap. This is obtained from measured in vitro capping rate constants (Schafer et al., 1996) of ∼3.5 μM−1 s−1 and a typical capping-protein concentration (Pollard et al., 2000) of 1 μM, on the assumption that diffusion in the cellular environment is slower than that in vitro by a factor of 10, with a corresponding reduction in the capping rate. Our value of Vmax, 0.27 μm s−1, is obtained from the measured on-rate (Pollard, 1986) of roughly 10 μM−1 s−1, a typical free-actin concentration (Pollard et al., 2000) of 100 μM, and the monomer step size of 2.7 nm, together with the diffusion-factor reduction used in obtaining kcap. (Most of the nonpolymerized actin in cellular environments is present as profilin-actin complexes, and it is not known at what rate actin in this form contributes to filament elongation. If its addition rate is much less than that for actin monomers, then the overall scale of the velocities will be reduced. However, when Vobst is scaled by Vmax as in Figs. 3 and 4, the shape of the curves is independent of Vmax.) We normalize kbr by kcap because the ratio corresponds roughly to the average number of branches per filament. In these curves and those in Fig. 4, we use d = a, where a = 2.7 nm is the step size per monomer; the effects of varying d are treated in the discussion of Fig. 5 below. In both the two- and three-dimensional cases, Vobst appears to approach an asymptotic value less than Vmax for large kbr, as was seen in the stochastic-growth simulations (Carlsson, 2001). For small kbr, the velocity in the end-branching case drops abruptly to zero at a value of kbr between kcap and 2kcap; for side branching, the decrease is smoother. This difference was not resolved in the stochastic-growth simulations because they did not treat long enough times. In the two-dimensional geometry, the curve has a shoulder around kbr = 2kcap, which is not seen in the three-dimensional results. We believe that this shoulder is due to the presence of sharp peaks in the filament orientation distribution around ±35°. Such peaks were seen in the analysis of Maly and Borisy (2001), and we see similar peaks here.
FIGURE 3.

Dependence of steady-state obstacle velocity Vobst on branching rate kbr, with kcap fixed at 0.35 s−1. Vmax: maximum projected filament velocity. kcap: capping rate. Solid line: side-branching model in three dimensions. Dotted line: end-branching model in three dimensions. Dashed line: side-branching model in two dimensions. Long-dashed line: end-branching model in two dimensions.
FIGURE 4.

Dependence of steady-state obstacle velocity Vobst on capping rate kcap, with kbr fixed at Vmax/20a = 5 s−1. Vmax: maximum projected filament velocity. kbr: branching rate. Solid line: side-branching model in three dimensions. Dotted line: end-branching model in three dimensions. Dashed line: side-branching model in two dimensions. Long-dashed line: end-branching model in two dimensions.
FIGURE 5.

Effect of branching layer thickness d on kcap-dependence of obstacle velocity Vobst, with kbr fixed at Vmax/20a = 5 s−1. Vmax: maximum projected filament velocity. kbr: branching rate. Solid line: d = 0.1a (a = monomer size). Dotted line: d = a. Dashed line: d = 5a. Long-dashed line: d = 10a.
In Fig. 4, we use kbr = Vmax/20a = 5 s−1, which gives a branch spacing of ∼20 monomers at the higher obstacle velocities, roughly commensurate with experimentally measured branch spacings (Svitkina and Borisy, 1999). For all four of the branching models considered, Vobst drops monotonically and smoothly with kcap for kcap > 0.05kbr, as in the stochastic-growth simulations. The asymptotic  value extrapolated from this range is between 0.8Vmax and 0.9Vmax. However, for smaller values of kcap, the curve turns up, and approaches Vmax as
  this effect was not seen in the stochastic-growth simulations because such small values of kcap could not be treated.
We can understand these aspects of the behavior of the growth velocity as follows:
Vanishing of growth velocity at finite kbr/kcap
We note that the only positive term in Eq. 1 is the branching term. Therefore, when kbr = kcap in the end-branching models, the total number of filaments must decay because leaving terms make a negative contribution to its time derivative (we recall that  ). Thus no growth is possible for kbr/kcap ≤ 1. The actual threshold is greater, because of the leaving effects. For side-branching models, the situation is different because of the ν(θ′) factor in Eq. 1. This factor can be significantly greater than unity for filaments with θ near 90°, which means that in principle growth is possible for kbr/kcap ≤ 1. As the obstacle slows, the proportion of filaments with θ near 90° increases because they can remain in contact with the obstacle, and this causes the branching rate per filament to increase. This explains the small kbr tail in the side-branching results.
Asymptotic velocity
One would expect that as either the branching rate becomes infinite, or the capping rate becomes small, sufficiently many filaments would be generated that even the small fraction of the filaments with  would be able to push the obstacle, leaving the other filaments behind. This would give an asymptotic velocity of Vmax. This is seen in Fig. 4 for very small values of kcap, but the apparent asymptotic velocity extrapolated from higher values is less than Vmax. To understand this crossover behavior, we note that the branching events can be divided into two types, those occurring on filaments touching the obstacle, having υ > Vobst, and those occurring on filaments in the branching region but not touching the obstacle, which have υ < Vobst. As above, we will denote the number of filaments touching the obstacle by ntouch. In steady state, contributions to ntouch from branching are cancelled by capping effects alone, since the leaving terms do not apply to the touching filaments. The branching contribution consists of “direct” branching events in which a touching filament is generated from another touching filament, and “indirect” events in which a touching filament is generated from a nontouching one. In general, we expect direct events to dominate if d is much less than the typical branch spacing, since most newly generated nontouching filaments will not have time to branch before they leave the branching region. If we ignore indirect events entirely, and take Δθ = 0 for simplicity, then the angle θ of some of the touching filaments must exceed θbr/2 = 35° for direct branching events to occur. This means that Vobst ≤ cos(35°)Vmax = 0.87Vmax, giving an asymptotic value less than Vmax. This explains the main parts of the curves in Figs. 3 and 4.
However, if kcap is very small, it is possible for the indirect events to dominate. Even though they are a small fraction of the total branching events, they can be sufficient to cancel a small kcap. For indirect events, there is no geometrical limit on the obstacle velocity. For example, a filament with θ = 0 will produce a daughter filament with θ = 70°, and this filament can produce its own daughter filament with θ = 0. Thus for very small values of kcap, propulsion at velocities near Vobst is possible, and in this case indirect processes dominate. Using very large values of kbr will also yield an asymptotic velocity of Vmax, since the relevant quantity in balancing branching with capping is the ratio of the branching to the capping rates. In this case there will be an added effect from the decrease of the average branch spacing, which will also increase the fraction of indirect branching events.
The above argument depends on the ratio of d to the relative branch spacing. As d becomes smaller, the magnitude of the indirect branching terms becomes less. One should then have to go to progressively smaller values of kcap to reach the regime where indirect branching dominates and the velocity approaches Vmax. This is demonstrated in Fig. 5, which shows Vobst vs. kcap for a range of values of d ranging up to 10a, in the three-dimensional side-branching model. The branching layer thickness cannot be much greater than 10a, because this would lead to exponential growth in the filament density away from the obstacle, and this has not been observed. It is seen in Fig. 5 that the growth velocity varies in a fairly linear fashion with kcap down to a crossover value kcapc, at which it turns upward; kcapc increases with d. kcapc should be proportional to the rate of indirect branching events. The latter is proportional to both the rate of production kbr of new filaments and the fraction of these new filaments which branch before they leave the branching region. Since most of the new filaments will point at angles relatively far from the growth direction, they will leave the branching region rapidly. The fraction that branch before this happens will be proportional to d/lbr, where lbr is the average spacing between branches along a filament. Thus
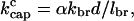 |
(9) |
where α is a dimensionless constant. From our numerical results, we find that α = 0.2 and α = 0.4 for side and end branching, respectively, in three dimensions. The possibility of applying this effect experimentally is evaluated in the Discussion section.
Nucleation model
In nucleation models, the obstacle generates new filaments without making use of the existing filament network, and it is assumed that the generated filaments subsequently attach to this framework. We thus take the overall generation rate for new filaments to be independent of the filament density. However, it is not possible for the orientation distribution of new branches to be independent of n(θ, t), since the new branches must satisfy the 70° branching angle constraint. For this reason, we obtain the equation of motion for the nucleation model by dividing the first term in Eq. 1 by the total rate of new filament generation, so that
 |
(10) |
where knuc is total the number of filaments generated per unit time,
 |
and the other quantities and parameters are as in the autocatalytic model.
The area factor is used for three dimensions, the length factor in two dimensions. We ignore the correction used in Eq. 1 to account for exponential growth of the filament density, because in nucleation models this does not occur.
This rate equation is solved by numerically stepping forward in time, at a fixed obstacle velocity, until a steady-state filament orientation distribution n(θ) is obtained. The force is then obtained via Eq. 3. In order to evaluate the right-hand side of Eq. 3, it is necessary to take a specific form for the force-velocity relation of a single filament. We take the form suggested by Brownian-ratchet theory (Peskin et al., 1993; Mogilner and Oster, 1996):
 |
(11) |
 |
(12) |
which translates to an exponential dependence when the velocity is given in terms of force. Here the factor of  accounts for the orientation dependence of the step size per monomer.
Fig. 6 shows the calculated force-velocity relation for the network in three-dimensional side- and end-branching nucleation models. The parameters, kcap = 0.35 s−1 and kbr = Vmax/20a, are the same as in Figs. 3 and 4. To evaluate knuc we use the value knuc/kcap = 100 suggested by experiments (Kuo and McGrath, 2000) on Listeria; similar results are obtained for the value knuc/kcap = 10 suggested by experiments (Cameron et al., 1999) on beads, except that the horizontal scale is compressed. For comparison, we include the force-independent behavior found in the autocatalytic models. The network force-velocity relation in the nucleation models differs from the exponential decay for a single filament in two ways:
There is a very rapid drop-off in the low-force region, where Vobst is near Vmax. For
 the number of filaments is reduced by leaving effects, and only the fraction of filaments with near optimal orientations contact the obstacle. Thus only a very small number of filaments contact the obstacle. This leads to a rapid decrease of the velocity with applied force, since the force per filament is large.
There is a decay at large forces, but it is slower than exponential. This occurs because with increasing force the load is redistributed between filaments of different orientations. For small forces, filaments with
 carry most of the load, because they are the only ones in contact with the obstacle. However, for larger forces, the most rapidly growing filaments are those with larger values of θ, as was pointed out in previous work developing the Brownian-ratchet model for single filaments (Mogilner and Oster, 1996). The velocities of these filaments decay less rapidly with force, because their orientation gives a smaller step size per monomer. At large forces, filaments with progressively smaller values of υ dominate, reducing the decay rate of the velocity with applied force.
FIGURE 6.

Force-velocity relation for nucleation and autocatalytic models, with side and end branching. Rate parameters are kcap = 0.35 s−1 and kbr = Vmax/20a = 5 s−1. Vobst: obstacle velocity. Vmax: maximum free-filament velocity. Fobst: force exerted by filaments on obstacle. a: step size along filament.
The overall shape of the force-velocity relation is quite similar to that obtained by a “tethered-ratchet” model (Mogilner et al., 2003) which treats two types of filaments, attached and working, where the working filaments supply the motile force by polymerization. In this model the deviations from exponential behavior result from changes in the relative numbers of attached and working filaments, an effect not included in the present model.
We do not show detailed results for the dependence of the velocity in nucleation models on the rate parameters kbr and kcap. However, the main findings are that the drop-off of velocity with increasing kcap is steeper than in autocatalytic models, and its drop-off with decreasing knuc is more rapid than its drop-off with decreasing kbr in autocatalytic models.
Sensitivity to key approximations
The preceding sections have presented calculated growth velocities for several models for branch generation during actin-based motility, which differ in their underyling assumptions and give distinct results. We now discuss how these results depend on the approximations and assumptions made in the models. The most important of these are the following:
Neglect of filament-filament interactions
The stochastic simulations (Carlsson, 2001) showed that at typical polymerized-actin densities, steric volume exclusion has only a small impact. Electrostatic interactions are also expected to have minor effects because the Debye screening length of 1 nm at typical physiological ionic strengths of 150 mM is much less than the typical filament spacing (Abraham et al., 1999) of 30 nm. Thus the neglect of filament-filament interactions in the above models seems to be a reasonable approximation. Inclusion of these interactions would cause the velocity to be reduced at large branching rates, small capping rates, and high forces in autocatalytic models. The effects in nucleation models would be weaker because the density of filaments approaches a constant value at high forces.
Neglect of filament bending and branch-point elasticity
These effects could lead to individual filaments changing their orientation over time. However, as discussed above, typical branch-point angle fluctuations are ∼10°. Provided that filaments remain short, the angle fluctuations from filament bending are roughly the same as those from the branch points (Carlsson, 2001). Thus the changes in filament orientation should not have a major impact on the results. Bending and elasticity could also have a substantial impact on the single filament force-velocity relation. However, previous work (Mogilner and Oster, 1996) has argued that the exponential form continues to hold when filament elasticity is included.
The actin network can also propagate effective elastic interactions from one point to another. These could lead to long-range effective interactions between filaments. The major effect of such interactions would be a stiffening which would increase with increasing filament density. Such a stiffening would reduce the filament-end fluctuations in a density-dependent fashion. This would lead to a reduction in network growth velocity with increasing density. However, this effect is expected to be small, because at observed filament lengths, the thermal fluctuations of individual filaments are already equal to or greater than the monomer size; the network elasticity would only serve to enhance these.
Neglect of severing and annealing effects
These have been treated previously in a rate-equation model (Sept et al., 1999). The rates obtained there are much lower than the capping and branching rates used here. However, if there is a very large acceleration of severing and/or nucleation in the cellular environment, these effects could become important. If filament severing is independent of interactions between filaments, the severing terms are linear in the filament concentration. Thus they would add a linear term to Eq. 1. Such a term would transfer free ends in the network from the branching region to regions farther from the obstacle, since the leftover filament free barbed ends would generally be outside the branching region. The severing effects would thus in some ways act like an increase in kcap or the leaving terms. The force-independence of the velocity in the autocatalytic models would continue to hold because it depends only on the linearity of the rate equation. However, in the nucleation models, inclusion of severing would have the effect of accelerating the drop-off of velocity with applied force.
On the other hand, annealing corresponds to nonlinear terms (Sept et al., 1999) in the rate equation. The most important type of event would be the incorporation of filament fragments into the network. The resulting effects on the branching region would be small, because the fragments would be overwhelmingly capped. Even the uncapped ones would have a small effect because the likelihood of their free ends being inside the branching region after network incorporation would be small. In addition, the time scales for annealing were found (Sept et al., 1999) to be on the order of several hours, and thus they are likely too slow to be important here.
Filament uncapping and branch detachment
Spontaneous uncapping rates are estimated (Schafer et al., 1996) to be in the range of 10−4 s−1. Thus very little uncapping would occur during the time that a capped filament spends in the branching region. However, obstacle-induced filament uncapping could occur more rapidly, and this would change the growth velocities. Branch detachment rates are related to the decay of the filamentous-actin density away from the obstacle. Observations of Listeria tails (Tilney and Tilney, 1994) and tails on beads mimicking Listeria (Cameron et al., 2001) indicate that the tail density decays over a distance of microns away from the obstacle, and similar results are obtained for the network density around lamellipodia (Svitkina and Borisy, 1999). Thus little branch detachment is expected over the thickness of the branching region.
Restrictions on the orientation of new filaments
Our earlier simulations (Carlsson, 2001) had suggested that observed filament structures near the growth front are better described if new branches are allowed only in the forward direction. We have performed runs including such effects, and find curves quite similar to those shown above. Provided that kbr is adjusted to keep the filament generation rate constant, the main effect of the orientation restriction is a moderate increase in the growth velocity.
ATP hydrolysis
Hydrolysis of a filament subunit generally is believed to occur on a time scale of several seconds (Blanchoin and Pollard, 2002), and by this time the branching region will have moved away from the subunit.
Depletion of actin and actin-binding proteins
These effects would change the rate parameters in Eq. 1, as well as Vmax and the force-velocity relation. A previous analysis of this issue (Carlsson, 2001) showed that for obstacles of size up to 1 μm, the depletion effects are less than 20%. For larger obstacles, the effects can be more significant.
Rate-limiting activation steps upstream of the branch-generation step
If the Arp2/3 activation process has a long activation time, then there will be a limit to the number of filaments that can be generated per unit time per unit area of the obstacle. The presence of such activation steps would result in a behavior similar to that of nucleation models, even if preexisting branches are required for new branch nucleation.
Effects of fluctuations due to small numbers of filaments
We expect these to be proportional to  . Taking 20% as a cutoff for fluctuations, substantial corrections to the present results would begin to set in at Ntot = 25.
The relation (Eq. 11) between force and filament velocity, used in the nucleation model
This relation assumes an exponential dependence of the velocity on applied force, and a particular exponential decay parameter. Although such a relationship has been found in model calculations (Peskin et al., 1993; Mogilner and Oster, 1996) and Brownian-dynamics simulations (Carlsson, 2000), the true relation may be more complex or have a different decay parameter. In addition, Eq. 11 ignores potential attachment forces between the filaments and the obstacle. The presence of such attachments in the case of Listeria has been demonstrated by attempts to detach the bacterium from its tail using optical tweezers (Gerbal et al., 2000), and by measurements of the bacterium position (Kuo and McGrath, 2000) which have found very small fluctuations. In the case of beads, the presence of attachments is demonstrated by the continuous motion of a 50 nm bead propelled by a single filament (Cameron et al., 2001); without attachments, the bead would rapidly diffuse away from the filament tip. The results for the velocity in the autocatalytic model would continue to hold regardless of the attachment force, since the force does not enter these calculations. The results for the nucleation model would be strongly influenced by attachments, although the nature and magnitude of the effects are not certain. As mentioned above, a recent model (Mogilner et al., 2003) has treated the effects of filament attachments on the force-velocity relation for Listeria, and found that the attachments tend to accentuate the drop-off at small forces, and reduce the drop-off at high velocities. Thus they tend to reinforce the behavior found here, and could amplify the differences between the autocatalytic and nucleation models.
DISCUSSION
The above analysis has shown that both the dependence of the growth velocity on key protein concentrations and the force-velocity relation are sensitive to the details of the generation process for new branches. This motivates measurements of these dependences. Measurement of the dependence of the growth velocity on the activated Arp2/3 and capping-protein (CP) concentrations would require the use of a pure-protein medium in order to control secondary effects from the concentrations of other proteins. Such media have been used in studies of both Listeria (Loisel et al., 1999) and plastic beads coated with VCA (Bernheim-Grosswasser et al., 2002). In pure-protein media, one could monitor the free-actin concentration in the growth medium as the concentrations of activated Arp2/3 and capping protein are changed, and buffer the actin appropriately to keep the free-actin concentration constant. Measurements of the dependence of the growth velocity on the Arp2/3 concentration at fixed CP concentration could shed light on the relative importance of side and end branching. As indicated in Fig. 3, end-branching models would lead to a sharp cutoff in growth when the Arp2/3 concentration drops below a critical value, while side-branching models would display a much more gradual cutoff. Measurements of the dependence of the growth velocity on CP concentration at fixed Arp2/3 concentration could, in principle, help establish the thickness of the branching region. The results in Fig. 5 show that for a branching region less than a single monomer in thickness, the plot is essentially a straight line as the CP concentration goes to zero. If the branching layer thickness is one or a few monomers, the velocity displays a sharp upturn at small CP concentrations. If the thickness is greater than a few monomers, the velocity curves smoothly upwards as the CP concentration drops. However, because the magnitude of the differences between the curves is fairly small, obtaining velocity measurements of sufficient resolution to assess the branching layer thickness might be impossible.
Quantitative measurement of the force-velocity relation would appear to be the most straightforward way of using the present results to evaluate competing models of filament generation. Such experiments have been performed by using methylcellulose to vary the viscosity, for beads moving in pure-protein media (Wiesner et al., 2003) and bacteria moving in cell extracts (McGrath et al., 2003). Because of the simplicity of the growth medium and moving obstacle, the bead experiments would appear to be the closest to the present calculations. These experiments indicated that, over a broad range of forces up to ∼50 pN, the velocities of 2 μm beads varied by only 30%. This behavior is consistent with the autocatalytic model discussed above. However, we cannot yet draw a definite conclusion because the nucleation rate in the nucleation model is not firmly established, and with a very high nucleation rate the velocity could be insensitive to force up to 50 pN. The measurements of bacterial motion found that the velocity at 50 pN opposing force is much less than its value at zero opposing force. These results would suggest that the generation rate of new filaments is limited, perhaps because of the presence of different rate-limiting steps than for the beads. We note, however, that in the bead experiments, a correction for the effects of methylcellulose not related to viscosity was made, and no such correction was made in the bacterium experiments. This could also be an important factor in explaining the differences between the results.
Other possible methods for measuring the force-velocity relation involve the use of laser-based optical-tweezer techniques. In such methods one tracks a fluorescently labeled object (bead or bacterium), and the force is determined by the position of the object relative to the center of the laser spot. One can then impose a feedback loop which keeps the force fixed by motion of the substrate, and then measure the velocity by tracking the object's coordinates. This method would avoid any uncertainties resulting from the addition of thickeners to the cell extract. However, because optical tweezers are only able to exert forces up to ∼40 pN, it would be necessary to use conditions under which not too many filaments impinge on the object.
Two other types of experiments in the literature have some relevance to our results. The first involves attempts to stop the motion of Listeria with an optical trap (Gerbal et al., 2000). These experiments found that the trap could temporarily stop the motion, but the bacterium eventually broke free due to an increase in the force supplied by the tail. However, because the force exerted by the trap is only ∼10 pN, these experiments are unable to distinguish between the models considered here. The second treats the dynamics of the actin filament density behind “hopping” Listeria. These are mutants in which roughly 80 residues of the ActA surface protein have been deleted. They move rapidly for short intervals of time, stop for longer periods, then move again and repeat the cycle. Experiments with fluorescent actin (Lasa et al., 1997; Fung and Theriot, 1998) have shown that the fluorescence intensity increases during the stationary period, suggesting that the actin density is building up to counter the forces opposing the motion of the bacterium. However, the opposing force is not known in these experiments.
Acknowledgments
I am grateful to Marie-France Carlier, Scot Kuo, and Alex Mogilner for supplying preprints of their articles before publication. I appreciate informative conversations with John Cooper, David Sept, and Jonathan Katz.
This research was supported by the National Institutes of Health under Grant Number GM38542.
References
- Abraham, V. C., V. Krishnamurthi, D. L. Taylor, and F. Lanni. 1999. The actin-based nanomachine at the leading edge of migrating cells. Biophys. J. 77:1721–1732. [DOI] [PMC free article] [PubMed] [Google Scholar]
- Amann, K. J., and T. D. Pollard. 2001a. The Arp2/3 complex nucleates actin filament branches from the sides of pre-existing filaments. Nat. Cell Biol. 3:306–310. [DOI] [PubMed] [Google Scholar]
- Amann, K. J., and T. D. Pollard. 2001b. Direct real-time observation of actin filament branching mediated by Arp2/3 complex using total internal reflection fluorescence microscopy. Proc. Natl. Acad. Sci. USA. 98:15009–15013. [DOI] [PMC free article] [PubMed] [Google Scholar]
- Anderson, E., Z. Bai, C. H. Bischof, S. Blackford, J. W. Demmel, J. J. Dongarra, J. D. Croz, A. Greenbaum, S. Hammarling, A. McKenney, and D. C. Sorensen. 1999. Lapack User's Guide, Third Edition. SIAM Press, Philadelphia.
- Bernheim-Grosswasser, A., S. Wiesner, R. M. Golsteyn, M.-F. Carlier, and C. Sykes. 2002. The dynamics of actin-based motility depends on surface parameters. Nature. 417:308–311. [DOI] [PubMed] [Google Scholar]
- Blanchoin, L., and T. D. Pollard. 2002. Hydrolysis of ATP by polymerized actin depends on the bound divalent cation but not profilin. Biochemistry. 41:597–602. [DOI] [PubMed] [Google Scholar]
- Blanchoin, L., T. D. Pollard, and R. D. Mullins. 2000. Interactions of ADF/cofilin, Arp2/3 complex, capping protein and profilin in remodeling of branched actin filament networks. Curr. Biol. 10:1273–1282. [DOI] [PubMed] [Google Scholar]
- Cameron, L. A., M. J. Footer, A. van Oudenaarden, and J. A. Theriot. 1999. Motility of ActA protein-coated microspheres driven by actin polymerization. Proc. Natl. Acad. Sci. USA. 96:4908–4913. [DOI] [PMC free article] [PubMed] [Google Scholar]
- Cameron, L. A., T. M. Svitkina, D. Vignjevic, J. A. Theriot, and G. G. Borisy. 2001. Dendritic organization of actin comet tails. Curr. Biol. 11:130–135. [DOI] [PubMed] [Google Scholar]
- Carlsson, A. E. 2000. The force-velocity relation for growing biopolymers. Physical Review E. 62:7082–7091. [DOI] [PubMed] [Google Scholar]
- Carlsson, A. E. 2001. Growth of branched actin networks against obstacles. Biophys. J. 81:1907–1923. [DOI] [PMC free article] [PubMed] [Google Scholar]
- Dramsi, S., and P. Cossart. 1998. Intracellular pathogens and the actin cytoskeleton. Annu. Rev. Cell Dev. Biol. 14:137–166. [DOI] [PubMed] [Google Scholar]
- Fung, D. C., and J. A. Theriot. 1998. Movement of bacterial pathogens driven by actin polymerization. In Motion Analysis of Living Cells, pp. 157–176. (Wiley-Liss, New York).
- Gerbal, F., V. Laurent, A. Ott, M.-F. Carlier, P. Chaikin, and J. Prost. 2000. Measurement of the elasticity of the actin tail of Listeria monocytogenes. Eur. Biophys. J. 29:134–140. [DOI] [PubMed] [Google Scholar]
- Goldberg, M. B. 2001. Actin-based motility of intracellular microbial pathogens. Microbiol. Mol. Biol. Rev. 65:595–626. [DOI] [PMC free article] [PubMed] [Google Scholar]
- Higgs, H. N., L. Blanchoin, and T. D. Pollard. 1999. Influence of the C terminus of Wiskott-Aldrich syndrome protein WASp and the Arp2/3 complex on actin polymerization. Biochemistry. 38:15212–15222. [DOI] [PubMed] [Google Scholar]
- Ichetovkin, I., W. Grant, and J. Condeelis. 2002. Cofilin produces newly polymerized actin filaments that are preferred for dendritic nucleation by the Arp2/3 complex. Curr. Biol. 12:79–84. [DOI] [PubMed] [Google Scholar]
- Kuo, S. C., and J. L. McGrath. 2000. Steps and fluctuations of Listeria monocytogenes. Nature. 407:1026–1029. [DOI] [PubMed] [Google Scholar]
- Lasa, I., E. Gouin, M. Goethals, K. Vancompernolle, V. David, J. Vandekerckhove, and P. Cossart. 1997. Identification of two regions in the N-terminal domain of ActA involved in the actin comet tail formation by Listeria monocytogenes. EMBO J. 7:1531–1540. [DOI] [PMC free article] [PubMed] [Google Scholar]
- Loisel, T. P., R. Boujemaa, D. Pantaloni, and M.-F. Carlier. 1999. Reconstitution of actin-based motility of Listeria and Shigella using pure proteins. Nature. 401:613–616. [DOI] [PubMed] [Google Scholar]
- Machesky, L. M., D. M. Mullins, H. N. Higgs, D. A. Kaiser, L. Blanchoin, R. C. May, M. E. Hall, and T. D. Pollard. 1999. Scar, a WASp-related protein, activates nucleation of actin filaments by the Arp2/3 complex. Proc. Natl. Acad. Sci. USA. 96:3739–3744. [DOI] [PMC free article] [PubMed] [Google Scholar]
- Maly, I. V., and G. G. Borisy. 2001. Self-organization of a propulsive actin network as an evolutionary process. Proc. Natl. Acad. Sci. USA. 98:11324–11329. [DOI] [PMC free article] [PubMed] [Google Scholar]
- McGrath, J. L., N. J. Eungdamrong, C. I. Fisher, F. Peng, L. Mahadevan, T. J. Mitchison, and S. C. Kuo. 2003. The force-velocity relationship for the actin-based motility of Listeria monocytogenes. Curr. Biol. 13:329–332. [DOI] [PubMed] [Google Scholar]
- Mogilner, A., and L. Edelstein-Keshet. 2002. Regulation of actin dynamics in rapidly moving cells: a quantitative analysis. Biophys. J. 83:1237–1258. [DOI] [PMC free article] [PubMed] [Google Scholar]
- Mogilner, A., and G. Oster. 2003. Force generation by actin polymerization II: the elastic ratchet and tethered filaments. Biophys. J. 84:1591–1605. [DOI] [PMC free article] [PubMed] [Google Scholar]
- Mogilner, A., and G. Oster. 1996. Cell motility driven by actin polymerization. Biophys. J. 71:3030–3045. [DOI] [PMC free article] [PubMed] [Google Scholar]
- Mullins, R. D., J. A. Heuser, and T. D. Pollard. 1998. The interaction of Arp2/3 complex with actin: nucleation, high-affinity pointed end capping, and formation of branching networks of filaments. Proc. Natl. Acad. Sci. USA. 95:6181–6186. [DOI] [PMC free article] [PubMed] [Google Scholar]
- Pantaloni, D., R. Boujemaa, D. Didry, P. Gounon, and M.-F. Carlier. 2000. The Arp2/3 complex branches filament barbed ends: functional antagonism with capping proteins. Nat. Cell Biol. 2:385–391. [DOI] [PubMed] [Google Scholar]
- Peskin, C. S., G. M. Odell, and G. F. Oster. 1993. Cellular motions and thermal fluctuations: the Brownian ratchet. Biophys. J. 65:316–342. [DOI] [PMC free article] [PubMed] [Google Scholar]
- Pollard, T. 1986. Rate constants for the reactions of ATP- and ADP-actin with the ends of actin filaments. J. Cell Biol. 103:2747–2754. [DOI] [PMC free article] [PubMed] [Google Scholar]
- Pollard, T. D., L. Blanchoin, and R. D. Mullins. 2000. Molecular mechanisms controlling actin filament dynamics in nonmuscle cells. Annu. Rev. Biophys. Biomol. Struct. 29:545–576. [DOI] [PubMed] [Google Scholar]
- Schafer, D. A., P. B. Jennings, and J. A. Cooper. 1996. Dynamics of capping protein and actin assembly in vitro: uncapping barbed ends by polyphosphoinositides. J. Cell Biol. 135:169–179. [DOI] [PMC free article] [PubMed] [Google Scholar]
- Sept, D., J. Xu, T. D. Pollard, and J. A. McCammon. 1999. Annealing accounts for the length of actin filaments formed by spontaneous polymerization. Biophys. J. 77:2911–2919. [DOI] [PMC free article] [PubMed] [Google Scholar]
- Small, J. V., T. Stradal, E. Vignal, and K. Rottner. 2002. The lamellipodium: where motility begins. Trends Cell Biol. 12:112–120. [DOI] [PubMed] [Google Scholar]
- Svitkina, T. M., and G. G. Borisy. 1999. Arp2/3 complex and actin depolymerizing factor/cofilin in dendritic organization and treadmilling of actin filament array in lamellipodia. J. Cell Biol. 145:1009–1026. [DOI] [PMC free article] [PubMed] [Google Scholar]
- Svitkina, T. M., A. B. Verkhovsky, K. M. McQuade, and G. G. Borisy. 1997. Analysis of the actin-myosin (ii) system in fish epidermal keratocytes: mechanism of cell body translocation. J. Cell Biol. 139:397–415. [DOI] [PMC free article] [PubMed] [Google Scholar]
- Tilney, L. G., and M. S. Tilney. 1994. Methods to visualize actin polymerization associated with bacterial invasion. Methods Enzymol. 236:476–481. [DOI] [PubMed] [Google Scholar]
- Wear, M. A., D. A. Schafer, and J. A. Cooper. 2000. Actin dynamics: assembly and disassembly of actin networks. Curr. Biol. 10:R891–R895. [DOI] [PubMed] [Google Scholar]
- Wiesner, S., E. Helfer, D. Didry, F. Lafuma, M.-F. Carlier, and D. Pantaloni. 2003. A biomimetic motility assay provides insight into the mechanism of actin-based motility. J. Cell Biol. 160:387–398. [DOI] [PMC free article] [PubMed] [Google Scholar]