Abstract
We have used site-directed spin-labeling and electron paramagnetic resonance spectroscopy to monitor a conformational change at the nucleotide site of kinesin. Cys-lite kinesin (K349 monomer) with the mutation S188C was spin labeled with MSL or MTSL. This residue is at the junction between the switch 1 region (which is a structure known to be sensitive to bound nucleotide in the G-proteins) and the α3-helix, adjacent to the nucleotide site. The spectra showed two or more components of mobility, which were independent of nucleotide in the absence of microtubules (MTs). The spectra of both labels showed a change of mobility upon binding to MTs. A more mobile spectral component became enhanced for all triphosphate analogs examined, AMPPNP, ADP•AlFx, or ADP•BeFx, in the presence of MTs, although the magnitude of the new component and the degree of mobility varied with nucleotide analog. The ADP state showed a much-reduced spectral change with a small shift to the more immobilized component in the presence of MTs. For kinesin•ADP•MT, a van't Hoff plot gave ΔH° = −96 kJ/mol implying that the conformational change was extensive. We conclude there is a conformational change in the switch 1-α3-helix domain when kinesin binds to MTs.
INTRODUCTION
One fundamental goal in the field of motility is to define the conformational changes at the nucleotide site associated with the interaction of the motor with the physiological substrate, and how the conformational changes that accompany nucleotide hydrolysis are translated into movement. Kinesin-family motors, along with myosin motors and the guanosine triphosphate binding proteins, are members of the larger G-protein superfamily (Vale, 1996; Kull et al., 1998). In this superfamily, the triphosphate-binding domain is composed of three conserved amino acid sequences: the P-loop, switch 1, and switch 2. A comparison of crystal structures shows that the conformation of switch 1 can vary. In the initial structures of kinesin-family motors, the phosphate-binding portion of the nucleotide site formed an open trough, with the triphosphates exposed to solvent (Gulick et al., 1998; Kull et al., 1996; Sablin et al., 1996; Sack et al., 1997) and the switch 1 region (amino acids 190–204 in human kinesin) displaced away from the nucleotide. In all myosin motor x-ray structures, the switch 1 region is found to be adjacent to the nucleotide, forming in conjunction with the P-loop and switch 2 a closed phosphate tube (Yount et al., 1995) in which the phosphates are tightly bound. In G-protein x-ray structures, switch 1 is sensitive to both the bound nucleotide (Sprang, 1997) and nucleotide exchange factors (Goldberg, 1998; Boriack-Sjodin et al., 1998), and is located both adjacent to, and displaced from, the nucleotide triphosphate binding location.
Thus, structural comparisons between myosin, the G-proteins, and kinesin-family motors suggest the possibility of considerable domain flexibility in the switch 1 region of kinesin-family motors. Indeed, a disordered switch 1 region has recently been seen in the crystal structure of Kar3 containing the additional mutation of a universally conserved arginine in switch 1 to an alanine (Yun et al., 2001). Additionally, we have previously used molecular dynamics to suggest that the switch 1 region of the kinesin motors could adopt a closed conformation adjacent to the nucleotide triphosphates as seen in the structures of myosin and in some G-proteins, and that such a conformation was thermodynamically stable (Minehardt et al., 2001). Electron paramagnetic resonance spectroscopy (EPR) studies of the changes in the mobility of nucleotide-analog, and EPR probes bound at the active site of kinesin-family motors (Naber et al., 2002), have reported a conformational change at the active site upon binding to microtubules (MTs). Switch 1 was not directly monitored in the studies, but the conformational change observed was compatible with the closed switch 1 conformation proposed by Minehardt et al. (2001). This fully closed structure has been proposed to be essential for both nucleotide hydrolysis and for the correct coordination of the conserved glycine in switch 2 to the γ-phosphate of the nucleotide. By analogy with nucleotide-site conformational changes in both myosin and the G-proteins, a popular hypothesis is that this latter coordination is an essential element for motility (Vale and Milligan, 2000; Smith and Rayment, 1996; Kull and Endow, 2002; Woehlke, 2001; Holmes and Geeves, 2000; Cooke, 1997; Schief and Howard, 2001).
EPR spectroscopy has been a useful tool in monitoring conformational changes in motor proteins (Baumann et al., 2001; Cooke et al., 1982; Fajer, 1994; Baker et al., 1998; Naber et al., 1997; Gollub et al., 1999; Thomas et al., 1983; Berger and Thomas, 1994). In the present studies we use EPR spectroscopy as a probe of switch 1 conformational changes in kinesin. An EPR spin probe can be introduced onto the motor protein by covalent attachment to a cysteine residue in the protein. The motion of the attached probe is restricted by the adjacent protein surface. Conformational changes can thus be detected via changes in probe mobility, monitored as changes in the EPR spectrum.
Covalent attachment of an EPR probe at an endogenous cysteine suffers from two major deficiencies. First, the cysteine may not be at the precise location in the protein that one wishes to investigate. Second, the presence of multiple cysteines can result in multiple labels per protein, each with their own distinct spectral signature, dramatically complicating interpretation of spectral changes. Thus the use of endogenous residues has been augmented by site-directed spin labeling (SDSL) approaches (Serag et al., 2002; Isas et al., 2002; Hubbell et al., 1996). Endogenous, reactive cysteines are replaced with nonreactive amino acids (“Cys-lite” proteins (Rice et al., 1999)), and a single cysteine is then introduced at a specific desired location. The presence of a single reactive element simplifies spectral analysis and allows for more aggressive conditions for covalent labeling, enhancing EPR signal strength. SDSL has proved to be particularly powerful when x-ray crystal structures are available, and suggest not only a region involved in a potential conformational change, but also allowing structural fine-tuning in the specific choice of amino acid to be mutated. We take advantage of these factors in the present work.
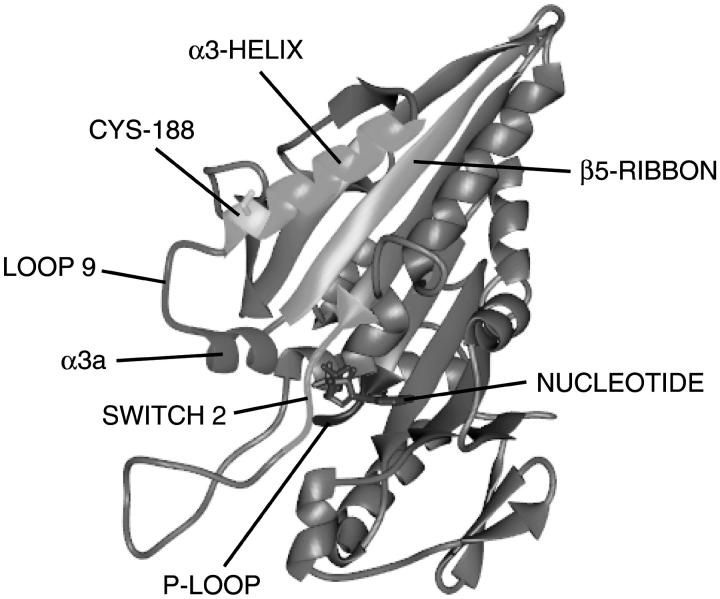
In kinesin, the switch 1 region is located between a β-ribbon (β5) that forms part of the central, core β-sheet of the protein and a four-turn α-helix (α3), part of which forms one edge of the nucleotide-binding pocket (Fig. 1). Ser-188 is a surface-exposed residue located at the junction of the switch 1 region and the α3-helix, adjacent to the nucleotide site in kinesin (Fig. 1). The residue is not conserved in kinesin-family motors. To further probe conformational changes in the switch 1 region, we have made use of the conservative mutation S188C for SDSL in a previously studied kinesin construct containing no other reactive cysteines (Rice et al., 1999). Previous use of this construct has been limited to labeling with undecagold to locate the position of the catalytic domain of kinesin on the microtubule, and a single fluorescence resonance energy transfer distance observation from kinesin already complexed with microtubules (Rice et al., 1999). There have been no previous spectroscopic studies directly monitoring conformational changes in the switch 1 region upon interaction with MTs. Here we demonstrate that EPR probes at the Cys-188 site show a conformational change in the switch 1 region upon binding to MTs, and that the conformational change differs in the di- and triphosphate states.
FIGURE 1.
Ribbon diagram of S188C kinesin. Human kinesin (Kull et al., 1996) with Cys-188 (yellow) at the junction of the α3-helix (cyan, aa 176–189) with the switch 1 region (magenta, aa 190–213). The side chain of Ser-188 projects out into the aqueous environment in the crystal structure. The nucleotide-binding domain contains the P-loop (blue), switch 1, and switch 2 (green) homologous to myosin-family motors and the G-proteins. The β5-ribbon, aa 205–216, is shown in orange.
METHODS
The mutation S188C was introduced into monomeric Cys-lite K349 kinesin, and the protein was bacterially expressed and purified as previously described (Rice et al., 1999); amino acids 1–349. Kinesin was initially dialyzed into buffer A containing 25 mM PIPES, 100 mM NaCl, 2 mM MgCl2, 1 mM EGTA, 50 μM ADP, pH 7.0, 4°C. The protein was spin labeled by reacting overnight at 4°C after addition of a twofold molar excess of 4-maleimido-2, 2, 6, 6-tetramethyl-1-piperidinyloxy (MSL) or 1-oxyl-2, 2, 5, 5-tetramethyl-Δ3-pyrroline-3-methyl methane thiosulfonate (MTSL). Repetitive steps of protein concentration via centrifugation through a 10 kDa cutoff sizing filter, and subsequent dilution with buffer A, were used to remove excess spin label. The final protein concentration was ∼100 μM. Protein concentration was determined by the method of Bradford (1976) using bovine serum albumin as a reference standard. The molecular weight of kinesin was taken as 39,700.
Tubulin was prepared from bovine brain tissue following the protocols of Ma and Taylor (1995) and stored in a buffer containing 100 mM PIPES, 1 mM MgCl2 1 mM EGTA, 1 mM Na2GTP, −80°C. For microtubule polymerization, thawed tubulin was spun at 100,000 g for 20 min, 4°C, to remove aggregated material, and 1 mM Na2GTP 10% DMSO and 2 mM MgCl2 were then added to the supernatant. Polymerization was induced by 30 min incubation at 37°C. Taxol (20 μM) was added and the microtubules were spun down at 100,000 g for 25 min, 25°C. The pellet was resuspended in a buffer containing 25 mM NaCl, 25 mM PIPES, 1 mM EGTA, 2 mM MgCl2, 20 μM taxol, pH 7.0, 25°C. The final concentration of the tubulin αβ-dimer was 200–250 μM. The molecular weight of the dimer was taken to be 110,000.
The microtubule-activated ATPase rates were determined using 1 μM kinesin, 10 μM microtubules in buffer A containing an additional 2 mM Na2ATP. Liberated phosphate was determined using the malachite green assay (Kodama et al., 1986) with ATPase time points taken every 30 s over a 150 s time period. The slope of a least-squares fit to the data gave the ATPase rate.
First derivative EPR spectra were accumulated with an ER/200D spectrometer (IBM Instruments, Danbury, CT) with the following instrument settings: microwave power, 25 mW; center field, 345.5 mT; modulation, 0.1 mT at a frequency of 100 kHz; gain, 0.1–2.0 × 10⁶. Between 10 and 25, 12.7 mT wide, 50 s sweeps were averaged for final data analysis. Kinesin (50 μM) in buffer A with added 5 mM Li4AMPPNP, 5 mM Na2ADP, or 5 mM Na2ADP and either 2 mM AlCl3 or 2 mM BeCl2 and 10 mM NaF was mounted in a 50 μL glass capillary and placed in a TE011 cavity. Temperature was maintained by passing cooled or heated air through the radiation slits in the cavity and monitored by a thermistor located close to the experimental sample. For spectra in the presence of microtubules, 30 μM kinesin and 90 μM MTs were added to ligand-modified buffer A. The mixture was spun at 100,000 g for 25 min, 25°C. The pellet was then mounted in a depression in a rexolite flat cell, surrounded by grease, covered with a glass coverslip to prevent dehydration, and placed in the TE011 cavity for data accumulation.
Spectra for MSL-labeled protein in the presence of ADP were deconvolved by first obtaining the pure components. An almost pure immobilized spectrum was observed experimentally in the presence of MTs, 2°C, and an almost pure mobile component was observed experimentally in the absence of MTs, 30°C. The small amounts of the other component in each of these were deleted by subtraction, and the resulting spectra taken as an approximately pure component for further analysis.
Taxol was obtained from Molecular Probes (Eugene, OR). MSL was obtained from Aldrich (Milwaukee, WI). MTSL was obtained from Toronto Research Chemicals (Toronto, Ontario, Canada). All other compounds (nucleotides, phosphate analogs, and buffer salts) were obtained from Sigma Chemical (St. Louis, MO).
RESULTS
To fix notation, KS188C will refer to the K349 Cys-lite kinesin monomer, with mutation S188C used in these studies. KS188C has a MT-activated ATPase rate (1 μM KS188C, 10 μM MT) of 15.4 ± 0.4 kinesin−1 s−1 (mean ± range, two observations). This is ∼75% of the value previously observed for Cys-lite K349 (Rice et al., 1999) when differences in ionic strength are taken into account. With MSL-labeled protein, MSL-KS188C, the MT-activated ATPase decreases to 9.8 ± 0.4 kinesin−1 s−1 (two observations), and for MTSL-KS188C the MT-activated ATPase is 8.3 ± 0.4 kinesin−1 s−1 (two observations). These values imply that spin probe-labeled protein retains catalytic competence, although the modification of the protein at Cys-188 does affect the rates of some step(s) in the cycle, emphasizing the importance of this region.
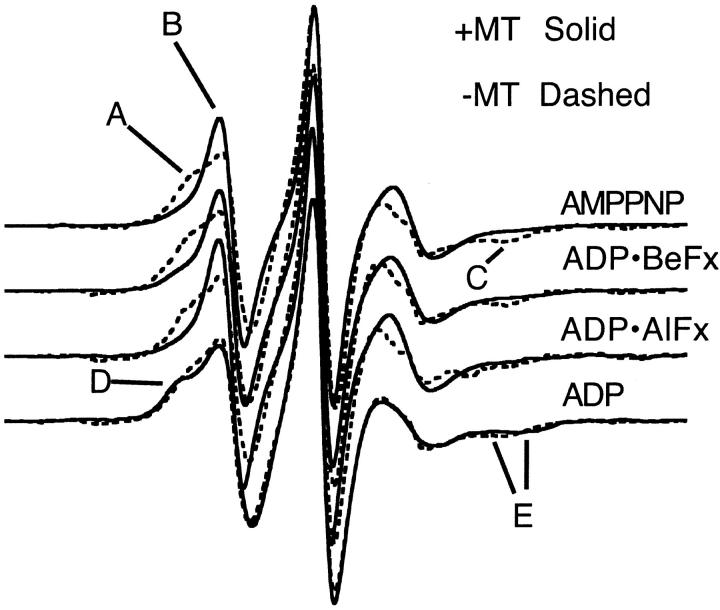
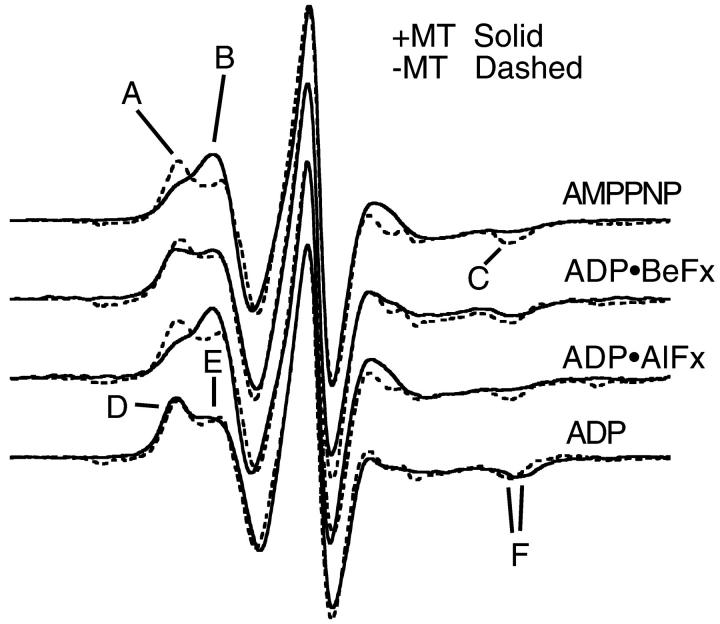
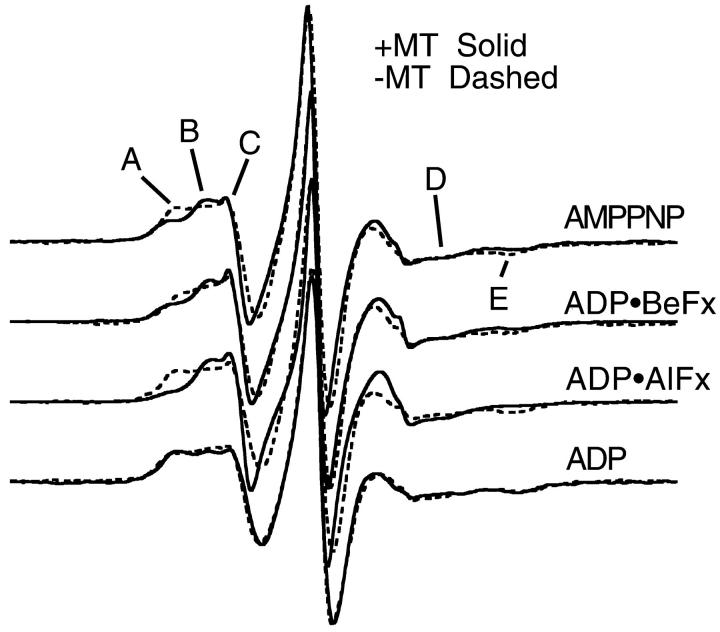
Fig. 2 demonstrates our fundamental results. The spectra in the absence (presence) of MTs are shown by dashed (solid) lines for MSL-labeled kinesin at 20°C. In the absence of MTs, the spectra appear independent of the state of the bound nucleotide. The spectra show that when MSL-KS188C•triphosphate analog binds to MTs, there is a shift of EPR probes from a more immobilized to a more mobile component. This is demonstrated by the shift in spectral intensity from the low-field component, A, to an up-field component, B, and by the decrease in intensity at the high-field dip, component C, in the AMPPNP, ADP•AlFx, and ADP•BeFx spectra when the spectra in the presence of MTs are compared with those in the absence of MTs. Additionally, the fact that these spectral components appear to occur at the same positions in the magnetic field suggests that the probes in all three triphosphate-analog states are reporting the same conformational change. A small spectral change is observed with ADP at the nucleotide site. When MSL-KS188C•ADP binds to MTs, there is a small outward shift of spectral intensity at both the low field (D) and high field (E) regions of the spectra. This implies that a fraction of the probes in the MSL-KS188C•ADP state now become more immobilized upon binding to MTs. Fig. 3 shows the results from MSL-labeled protein when the temperature is lowered to 5°C. The spectral changes are more pronounced than at 20°C. For the ATP-analog states, there is a significant inward shift in spectral intensity in the low-field components (A → B) and a decrease in intensity of the high-field dip (C). This again implies an increase in mobility of a fraction of the probes upon binding to MTs. There is, however, a small outward shift of the high-field dip (C) in the presence of ADP•BeFx, indicating that the magnitude of the mobility increase may be slightly less than with the other two triphosphate analogs. In the presence of ADP, the spectral change is smaller with a very small decrease in the mobility of some of the probes. Upon binding to MTs, there is a slight outward shift in spectral intensity in the low-field component (E → D) as shown by the change in the ratio of peak heights, and a corresponding outward shift in the high-field dip (F). These imply a shift to a more immobilized probe orientation.
FIGURE 2.
EPR spectra of MSL-labeled KS188C taken at 20°C in the presence and absence of microtubules. The horizontal axis is magnetic field (width = 12.7 mT), the vertical axis is the derivative of absorption. The top three spectra are in the presence of 5 mM ATP analog. The bottom spectra are in the presence of ADP. Locations A–C in the top three spectra, and locations D and E in the ADP spectrum, are discussed in the text. All spectra (Figs. 2–5) are normalized with respect to the central peak height to enhance the visual display of spectral differences in the low-field region.
FIGURE 3.
EPR spectra of MSL-KS188C taken at 5°C. The top three spectra are in the presence of ATP analogs. The bottom spectrum is in the presence of ADP.
Figs. 4 and 5 show that the spectral changes obtained in the presence and absence of MTs when Cys-188 is labeled with MTSL are more complex. In the absence of MTs at 20°C, there is a broad low-field shoulder, component A, which decreases in intensity in the presence of MTs for the triphosphate analogs. There is little change in the presence of ADP (Fig. 4). For all of the nucleotides, there is also an intensity decrease in the right-most portion of the low-field shoulder (C), with the appearance of a new peak with greater splitting (component B). Using the quantitative analysis and order parameter of Griffith and Jost (1976), the 4.37 ± 0.025 mT (four observations) splitting of this component can be modeled as motion within a cone with a vertex angle of 130°. Cone angles of mobility for the other two, more (A) and less (C) immobilized components of the spectra, cannot be defined as precisely. Thus at a minimum, the spectra indicate the presence of three distinct spectral components and potentially more.
FIGURE 4.
EPR spectra of MTSL-KS188C taken at 20°C. The top three spectra are in the presence of ATP analogs. The bottom spectrum is in the presence of ADP.
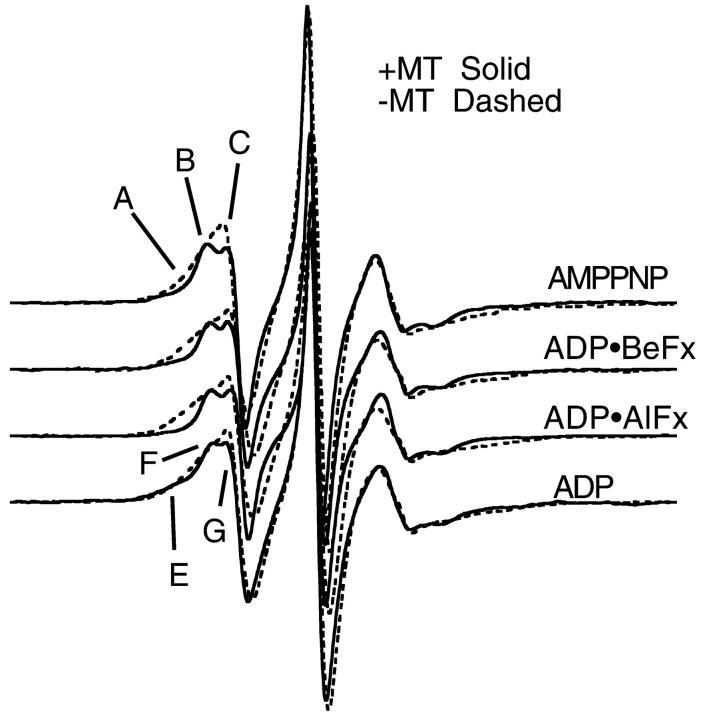
FIGURE 5.
EPR spectra of MTSL-KS188C taken at 5°C. The top three spectra are in the presence of ATP analogs. The bottom spectrum is in the presence of ADP.
At 5°C (Fig. 5), in the presence of triphosphate analogs, MTSL-KS188C shows the same basic spectral change as observed at 20°C. For the low-field peak, there is a shift in spectral intensity from a more immobilized component (A) to a component (B) of intermediate immobilization. This is clearest for MTSL-KS188C, where the A → E and B → D splittings of 6.64 ± 0.05 mT (two observations) and 4.52 ± 0.04 mT (four observations), respectively, corresponds to an increase in the cone angle of motion from 52° to 126°, with the larger splitting corresponding to the smaller cone angle. For MTSL-KS188C•ADP, spectral differences in the presence and absence of MTs show only a very small shift to a more immobilized conformation in the presence of MTs.
The effect of temperature
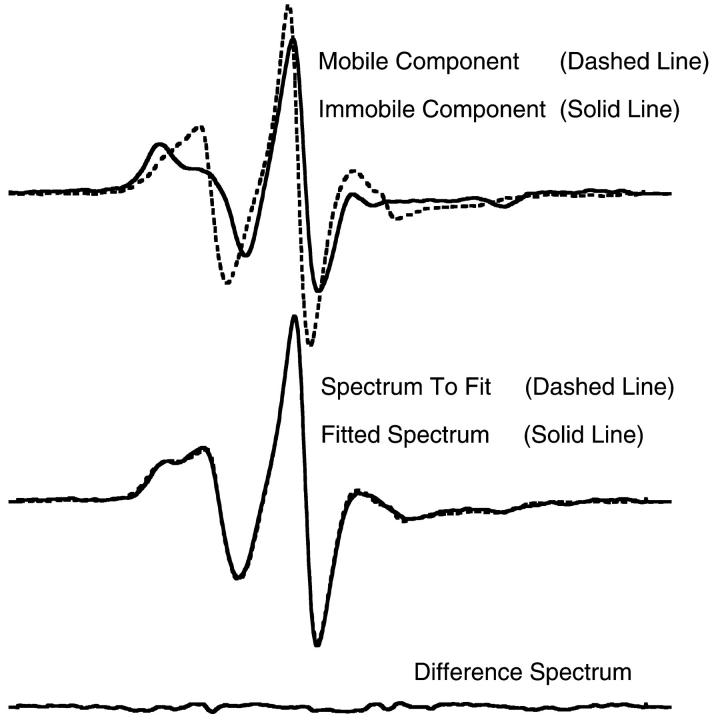
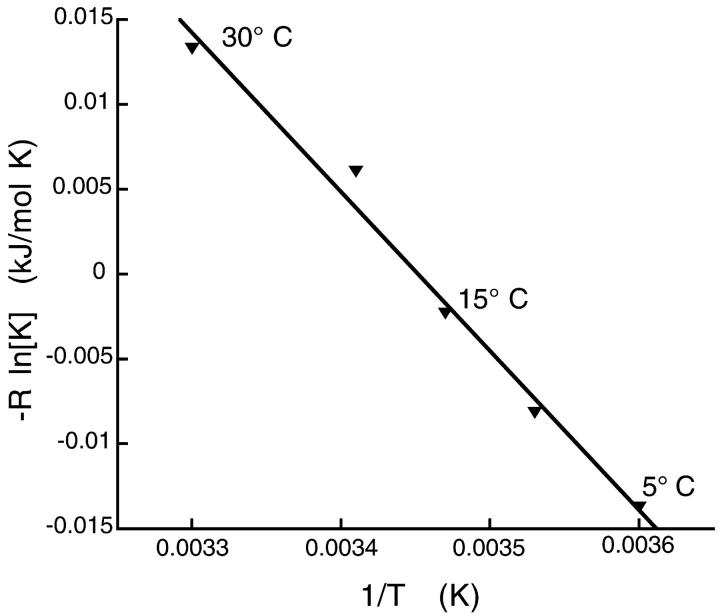
As noted, the spectra we have obtained are complex. Many are the sum of three or more distinct spectral components, suggesting transitions between three or more distinct protein states. These are difficult to deconvolute, confounding more quantitative analysis. However, for MSL-KS188C bound to MTs in the presence of ADP, the probe shows only two different spectral components. Investigating the relative fractions of these two components in the spectra of MT•MSL-KS188C•ADP as a function of temperature allows us to define better the thermodynamics associated with the transition between the two protein conformations. Fig. 6, top, shows the spectra taken as the immobile component (solid line), and the mobile component (dashed line), used in defining the spectral shift as temperature varied for MT•MSL-KS188C•ADP. Pure components were obtained as described in Methods. The spectra of MT•MSL-KS188C•ADP could then be expressed as a linear sum of fractions of the two spectra shown in Fig. 6, top. Fig. 6, middle (MT•MSL-KS188C•ADP, 15°C), shows such a linear summation. Fig. 6, bottom, shows the quality of the fit in Fig. 6, middle, giving the residual spectrum obtained by subtracting the fitted spectrum from the experimentally determined spectrum. Letting K = [immobile fraction]/[mobile fraction] be the equilibrium constant between the two conformations in the spectra of MT•MSL-KS188C•ADP as a function of temperature, Fig. 7 gives −Rln(K) for the titration data versus 1/T. Using the van't Hoff relationship, the slope of a least-squares linear fit to the data over the temperature range 5–30°C (r = 0.99) yields a mean value for ΔH0 = −96 kJ/mol and a mean ΔG of 2.2 kJ/mol. This value for ΔH0 implies a significant conformational change involving more than just a few amino acids. By comparison, the enthalpy of α-helix formation in water is ∼5 kJ/mol per residue (Hermans, 1966). It must be emphasized, however, that we do not know the precise secondary structure involved in the kinesin conformational change, and that the adjacent protein surface can also significantly influence the enthalpy. For the remaining spectra, a change of comparable magnitude appears to be occurring, but this cannot be quantitated due to the overlap of the spectral components.
FIGURE 6.
(Top) EPR spectra of MT•MSL-KS188C•ADP at 2°C (solid line) and MSL-KS188C•ADP at 30°C (dashed line), taken as the immobile and mobile components of the spectra of MT•MSL-KS188C•ADP as a function of temperature. (Middle) Spectrum of MT•MSL-KS188C•ADP at 15°C (dashed line) and the fit (solid line) as a linear combination of the spectra in top panel. (Bottom) Difference spectrum for spectra in middle panel.
FIGURE 7.
Plot of [immobile fraction]/[mobile fraction] (spectra of Fig. 6, top) versus 1/T for MSL-labeled MT•KS188C•ADP as a function of temperature. The spectral components representing the mobile and immobile probes were obtained as described in the Methods. The slope of the least-squares linear fit gives ΔH0.
DISCUSSION
We have examined the changes in mobility of two different EPR probes covalently bound to KS188C in triphosphate-analog and diphosphate states in the presence and absence of MTs. The resulting EPR spectra are complex in that some have three or more distinct components. To simplify the discussion of the data, we have assumed that a given spectral component represents a single probe conformation. However, we cannot rule out the possibility of multiple conformations giving similar spectral signatures. Thus we may be underestimating the number of distinct probe conformations involved. Nonetheless, taken in toto, the data unambiguously report a conformational change at Cys-188 when kinesin binds to MTs. Furthermore, the probes report different changes in mobility between ADP- and ATP-analog states. AMPPNP and ADP•BeFx are ATP analogs with the γ-phosphorous oxygens or fluorines in a tetrahedral orientation. ADP•AlFx is instead thought to mimic the γ-phosphate hydrolysis transition state intermediate. Both MTSL and MSL show a trend from more immobilized to less immobilized spectra upon binding to MTs for triphosphate analogs. Furthermore, for a given EPR probe at a given temperature, the triphosphate analogs report similar spectra irrespective of the type of coordination around the γ-phosphorous. For ADP the situation is reversed. Although small, the trend is from more mobile to less mobile probes.
Relationship to other studies
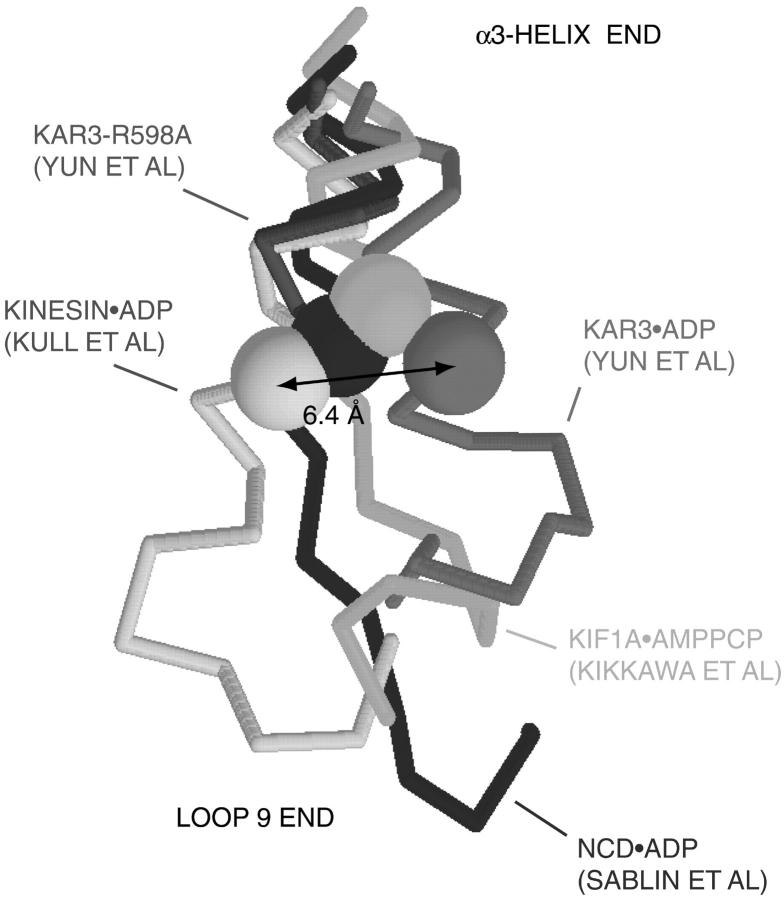
A number of crystal structures of kinesin-family motors have been solved and are compatible with the possibility of a conformational change at the Cys-188 position. Kinesin Ser-188 is at the junction of the α3-helix and loop 9. Loop 9 and the adjacent α3a-helix at the nucleotide site form the switch 1 region of kinesin-family motors (Fig. 1). Fig. 8 shows the α3-helix-loop 9 junction (Cα backbone only) from representative kinesin-family x-ray structures. The α3-helix is at the top; loop 9 is at the bottom. The residue homologous to kinesin Ser-188 is shown as a solid sphere. As is evident, the x-ray structures show considerable lateral motion at the Cys-188 position. In Kar3•ADP (Yun et al., 2001)/ncd•ADP (Sablin et al., 1996), it is displaced closest to/furthest from the nucleotide. Other x-ray structures lie between these extremes. Additionally, in the x-ray structure of Kar3 with the mutation, R598A (red), the α3-helix becomes disordered one amino acid (Asn-582) to the N-terminus (α3-helix side) of the location homologous to kinesin Ser-188 (Lys-583). This disorder continues into loop 9.
FIGURE 8.
An overlay of structures (Cα backbone) of representative kinesin-family motors is shown. The α3-helix is at the top; the contiguous loop 9 is at the bottom. Loop 9 is part of the switch 1 region. Color coding: kinesin aa 181–197, gray (Kull et al., 1996); ncd aa 530–546, blue (Sablin et al., 1996); kif1a aa 194–210, cyan; Kar3 aa 576–592, magenta (Yun et al., 2001); and Kar3-R598A (Yun et al., 2001), red. Kinesin Ser-188 and homologous residues (ncd Met-537, kif1a K201, Kar3 Lys-583) are shown as color-coded Cα space-filling spheres. For Kar3•ADP with the mutation R598A (red), the crystal structure becomes disordered one amino acid to the α3-helix side of the Lys-583 position. Loop 9 is disordered and the x-ray structure terminates.
The switch 1 region of kinesin has a structure homologous to similar regions in the G-proteins and in the myosin motors. This structural element was first identified in the G-proteins as having a conformation that is sensitive to the state of the nucleotide (Sprang, 1997). It is also sensitive to the binding of other proteins (Goldberg, 1998; Boriack-Sjodin et al., 1998). For example, nucleotide exchange factors can act by inducing a more open switch 1, thereby promoting nucleotide exchange. In myosin, the switch 1 region covers the triphosphate moiety of the nucleotide, forming a phosphate tube encasing the triphosphates. We have shown that nucleotide analogs that are too bulky to fit through the phosphate tube still bind to the nucleotide site of myosin (Pate et al., 1997), implying that the switch 1 region can adopt a more open structure. Crystal structure-constrained, electron microscopy reconstructions of S1-decorated actin filaments have likewise implied an open switch 1 region in myosin (Holmes et al., 2002).
The data discussed above led us to explore the possibility that the switch 1 region of kinesin-family motors, which in all crystal structures is more open than that of myosin, could close to cover the phosphates as seen in myosin. We explored this hypothesis using molecular dynamics. The simulations indicated the stability of a switch 1 region conformation similar to that found in myosin motors and the G-proteins (Minehardt et al., 2001), with the switch 1 region directly adjacent to the nucleotide, forming a phosphate tube in kinesin-family motors.
Kinesin-family motors generate biologically useful movement only in the presence of the polymer roadway. A fundamental difference between these previous crystallographic and molecular dynamics studies, and our present observations, is that MTs were not present in these earlier studies. Here we have use EPR spectroscopy to additionally investigate the influence of the polymer, and show that it is responsible for a conformational change adjacent to the nucleotide-binding site. Thus our results support previous observations of MT-induced conformational changes at the nucleotide site (Naber et al., 2002). By influencing the structure of the switch 1 region, the MT could be acting as a nucleotide exchange factor or could be promoting nucleotide hydrolysis. The rates of both exchange and hydrolysis are known to be enhanced by the binding of MTs.
In summary, EPR spectroscopy shows a conformational change at the nucleotide site of kinesin upon binding to MTs. Thermodynamic analysis implies a significant number of amino acids are involved.
References
- Baker, J. E., I. Brust-Mascher, S. Ramachandran, L. E. LaConte, and D. D. Thomas. 1998. A large and distinct rotation of the myosin light chain domain occurs upon muscle contraction. Proc. Natl. Acad. Sci. USA. 95:2944–2949. [DOI] [PMC free article] [PubMed] [Google Scholar]
- Baumann, B. A., B. D. Hambly, K. Hideg, and P. G. Fajer. 2001. The regulatory domain of the myosin head behaves as a rigid lever. Biochemistry. 40:7868–7873. [DOI] [PubMed] [Google Scholar]
- Berger, C. L., and D. D. Thomas. 1994. Rotational dynamics of actin-bound intermediates of the myosin adenosine triphosphatase cycle in myofibrils. Biophys. J. 67:250–261. [DOI] [PMC free article] [PubMed] [Google Scholar]
- Boriack-Sjodin, P. A., S. M. Margarit, D. Bar-Sagi, and J. Kuriyan. 1998. The structural basis of the activation of Ras by Sos. Nature. 394:337–343. [DOI] [PubMed] [Google Scholar]
- Bradford, M. M. 1976. A rapid and sensitive method for the quantitation of microgram quantities of protein utilizing the principle of protein-dye binding. Anal. Biochem. 72:248–254. [DOI] [PubMed] [Google Scholar]
- Cooke, R. 1997. Actomyosin interaction in striated muscle. Physiol. Rev. 77:671–697. [DOI] [PubMed] [Google Scholar]
- Cooke, R., M. S. Crowder, and D. D. Thomas. 1982. Orientation of spin labels attached to cross-bridges in contracting muscle fibres. Nature. 300:776–778. [DOI] [PubMed] [Google Scholar]
- Fajer, P. G. 1994. Determination of spin-label orientation within the myosin head. Proc. Natl. Acad. Sci. USA. 91:937–941. [DOI] [PMC free article] [PubMed] [Google Scholar]
- Goldberg, J. 1998. Structural basis for activation of ARF GTPase mechanisms of guanine nucleotide exchange and GTP-myristoyl switching. Cell. 95:237–248. [DOI] [PubMed] [Google Scholar]
- Gollub, J., C. R. Cremo, and R. Cooke. 1999. Phosphorylation regulates the ADP-induced rotation of the light chain domain of smooth muscle myosin. Biochemistry. 38:10107–10118. [DOI] [PubMed] [Google Scholar]
- Griffith, O. H., and P. C. Jost. 1976. Lipid spin labels in biological membranes. In Spin Labeling Theory and Applications. L. J. Berliner, editor. Academic Press, New York. 454–523.
- Gulick, A. M., H. Song, S. A. Endow, and I. Rayment. 1998. X-ray crystal structure of the yeast Kar3 motor domain complexed with Mg.ADP to 2.3 A resolution. Biochemistry. 37:1769–1776. [DOI] [PubMed] [Google Scholar]
- Hermans, J. 1966. Experimental free energy and enthalpy of formation of the alpha-helix. J. Phys. Chem. 70:510–515. [DOI] [PubMed] [Google Scholar]
- Holmes, K. C., and M. A. Geeves. 2000. The structural basis of muscle contraction. Philos. Trans. R. Soc. Lond. B Biol. Sci. 355:419–431. [DOI] [PMC free article] [PubMed] [Google Scholar]
- Holmes, K. C., J. Kull, and R. Schroeder. 2002. Switch 1 opens on strong binding to actin. Biophys. J. 82:16a. (Abstr.) [PubMed] [Google Scholar]
- Hubbell, W. L., H. S. McHaourab, C. Altenbach, and M. A. Lietzow. 1996. Watching proteins move using site-directed spin labeling. Structure. 4:779–783. [DOI] [PubMed] [Google Scholar]
- Isas, J. M., R. Langen, H. T. Haigler, and W. L. Hubbell. 2002. Structure and dynamics of a helical hairpin and loop region in annexin 12: a site-directed spin labeling study. Biochemistry. 41:1464–1473. [DOI] [PubMed] [Google Scholar]
- Kodama, T., K. Fukui, and K. Kometani. 1986. The initial phosphate burst in ATP hydrolysis by myosin and subfragment-1 as studied by a modified malachite green method for determination of inorganic phosphate. J. Biochem. (Tokyo). 99:1465–1472. [DOI] [PubMed] [Google Scholar]
- Kull, F. J., and S. A. Endow. 2002. Kinesin: switch I & II and the motor mechanism. J. Cell Sci. 115:15–23. [DOI] [PubMed] [Google Scholar]
- Kull, F. J., E. P. Sablin, R. Lau, R. J. Fletterick, and R. D. Vale. 1996. Crystal structure of the kinesin motor domain reveals a structural similarity to myosin. Nature. 380:550–555. [DOI] [PMC free article] [PubMed] [Google Scholar]
- Kull, F. J., R. D. Vale, and R. J. Fletterick. 1998. The case for a common ancestor: kinesin and myosin motors and G proteins. J. Muscle Res. Cell Motil. 19:877–886. [DOI] [PubMed] [Google Scholar]
- Ma, Y. Z., and E. W. Taylor. 1995. Mechanism of microtubule kinesin ATPase. Biochemistry. 34:13242–13251. [DOI] [PubMed] [Google Scholar]
- Minehardt, T. J., R. Cooke, E. Pate, and P. A. Kollman. 2001. Molecular dynamics study of the energetic, mechanistic, and structural implications of a closed phosphate tube in ncd. Biophys. J. 80:1151–1168. [DOI] [PMC free article] [PubMed] [Google Scholar]
- Naber, N., R. Cooke, and E. Pate. 1997. Binding of ncd to microtubules induces a conformational change near the junction of the motor domain with the neck. Biochemistry. 36:9681–9689. [DOI] [PubMed] [Google Scholar]
- Naber, N., T. Minehardt, J. Grammer, P. Kollman, R. Car, R. Yount, R. Cooke, and E. Pate. 2002. The nucleotide site of kinesin-family motors closes upon binding to microtubules. Biophys. J. 82:63a. (Abstr.) [DOI] [PubMed] [Google Scholar]
- Pate, E., N. Naber, M. Matuska, K. Franks-Skiba, and R. Cooke. 1997. Opening of the myosin nucleotide triphosphate binding domain during the ATPase cycle. Biochemistry. 36:12155–12166. [DOI] [PubMed] [Google Scholar]
- Rice, S., A. W. Lin, D. Safer, C. L. Hart, N. Naber, B. O. Carragher, S. M. Cain, E. Pechatnikova, E. M. Wilson-Kubalek, M. Whittaker, E. Pate, R. Cooke, E. W. Taylor, R. A. Milligan, and R. D. Vale. 1999. A structural change in the kinesin motor protein that drives motility. Nature. 402:778–784. [DOI] [PubMed] [Google Scholar]
- Sablin, E. P., F. J. Kull, R. Cooke, R. D. Vale, and R. J. Fletterick. 1996. Crystal structure of the motor domain of the kinesin-related motor ncd. Nature. 380:555–559. [DOI] [PubMed] [Google Scholar]
- Sack, S., J. Muller, A. Marx, M. Thormahlen, E. M. Mandelkow, S. Brady, and E. Mandelkow. 1997. X-ray structure of motor and neck domains from rat brain kinesin. Biochemistry. 36:16155–16165. [DOI] [PubMed] [Google Scholar]
- Schief, W. R., and J. Howard. 2001. Conformational changes during kinesin motility. Curr. Opin. Cell Biol. 13:19–28. [DOI] [PubMed] [Google Scholar]
- Serag, A. A., C. Altenbach, M. Gingery, W. L. Hubbell, and T. O. Yeates. 2002. Arrangement of subunits and ordering of beta-strands in an amyloid sheet. Nat. Struct. Biol. 9:734–739. [DOI] [PubMed] [Google Scholar]
- Smith, C. A., and I. Rayment. 1996. X-ray structure of the magnesium(II).ADP.vanadate complex of the Dictyostelium discoideum myosin motor domain to 1.9 A resolution. Biochemistry. 35:5404–5417. [DOI] [PubMed] [Google Scholar]
- Sprang, S. R. 1997. G proteins, effectors and GAPs: structure and mechanism. Curr. Opin. Struct. Biol. 7:849–856. [DOI] [PubMed] [Google Scholar]
- Thomas, D. D., R. Cooke, and V. A. Barnett. 1983. Orientation and rotational mobility of spin-labelled myosin heads in insect flight muscle in rigor. J. Muscle Res. Cell Motil. 4:367–378. [DOI] [PubMed] [Google Scholar]
- Vale, R. D. 1996. Switches, latches, and amplifiers: common themes of G proteins and molecular motors. J. Cell Biol. 135:291–302. [DOI] [PMC free article] [PubMed] [Google Scholar]
- Vale, R. D., and R. A. Milligan. 2000. The way things move: looking under the hood of molecular motor proteins. Science. 288:88–95. [DOI] [PubMed] [Google Scholar]
- Woehlke, G. 2001. A look into kinesin's powerhouse. FEBS Lett. 508:291–294. [DOI] [PubMed] [Google Scholar]
- Yount, R. G., D. Lawson, and I. Rayment. 1995. Is myosin a “back door“ enzyme? Biophys. J. 4(Suppl.):44–49. [PMC free article] [PubMed] [Google Scholar]
- Yun, M., X. Zhang, C. G. Park, H. W. Park, and S. A. Endow. 2001. A structural pathway for activation of the kinesin motor ATPase. EMBO J. 20:2611–2618. [DOI] [PMC free article] [PubMed] [Google Scholar]


