Abstract
Based on the importance of crystallizing membrane proteins in a rational way, cytochrome bc1 complex (BC1) was crystallized using polyethylene glycol (PEG) as a sole crystallization agent. Interaction between protein-detergent complexes of BC1 was estimated by dynamic light scattering, and was compared with the numerical calculation using the Derjaguin-Landau-Verwey-Overbeek potential plus a depletion potential, without considering specific surface properties of the protein-detergent complexes. The experiments and calculation were found to be consistent and we obtained a relation between PEG molecular weight M and the range of depletion zone δ as δ ∼ M0.48±0.02. The stability of liquid phase of BC1 solutions was controlled by a ratio of (the range of depletion zone)/(the radius of a BC1 particle), which was consistent with recent theoretical predictions. The crystallization was most successful under a condition where the stability of the liquid phase changed from stable to unstable. The PEG molecular weight that fulfilled this condition coincided with the one used empirically to crystallize BC1 in the past by a number of groups. These results are compared to the fact that membrane proteins were often successfully crystallized close to the detergent cloud point.
INTRODUCTION
Mixtures of spherical particles and linear polymers in solution exhibit various phase behaviors. The physics of such mixtures has been intensively studied using model systems of colloid sphere-polymer mixtures for a decade (Anderson and Lekkerkerker, 2002). As one of the most important applications of the model systems, protein crystallization using polymer reagents is being attracted interests. Although the applicability of the colloid-polymer model systems on the protein-polymer mixtures has been noticed (Lekkerkerker, 1997; Budayova et al., 1999), actual tests have begun very recently (Kulkarni et al., 2000; Finet and Tardieu, 2001; Tanaka and Ataka, 2002; Vivarès and Bonneté, 2002).
Polymers (especially polyethylene glycol, PEG) are empirically known as a very effective crystallization reagent for proteins (McPherson, 1999). Recently, several protein-PEG mixtures were studied (Kulkarni et al., 2000; Hitscherich et al., 2000; Finet and Tardieu, 2001; Bonneté et al., 2001; Casselyn et al., 2001; Tanaka and Ataka, 2002; Vivarès and Bonneté, 2002), and their crystallization mechanism, especially in terms of the intermolecular interaction, was compared with theories for the model systems. For example, it was shown that the addition of PEG brought the interactions into the well-known crystallization slot (George and Wilson, 1994; George et al., 1997) in the system of a soluble protein (Bonneté et al., 2001; Vivarès and Bonneté, 2002) and of a membrane protein (Hitscherich et al., 2000).
In model colloid-polymer systems, polymers induce attraction between particles by the so-called depletion interaction. Exclusion or depletion of polymers around particles causes entropy loss of polymers when particles disperse homogeneously, hence depletion zones around particles are favored to overlap to increase accessible volume for polymers. Simplest treatment of this phenomenon is the hard-body approximation of particles and polymers, and the ideal gas model for polymer distribution (Asakura and Oosawa, 1954; Kulkarni et al., 2000). This simple model has been used to predict the phase behavior of colloid-polymer mixtures (Gast et al., 1983; Lekkerkerker et al., 1992; Lekkerkerker, 1997) and recently to the interaction between soluble proteins (Tanaka and Ataka, 2002).
In this study, we test the simple depletion model on a membrane protein crystallization induced by PEG. An iron-containing protein that is important in cell respiration, cytochrome bc1 complex (BC1), is used for the study. We believe that the elucidation of the physical mechanism of PEG-induced membrane protein crystallization helps to construct rationalized prescription for the usage of PEG.
Compared to soluble proteins, the crystallization of membrane proteins is extremely difficult and a relatively small number of them have been crystallized so far despite their important biological roles. This is partly because of their complex solution structure. Membrane proteins are combined with detergents in solutions, and they form protein-detergent complexes (PDCs) (Garavito and Ferguson-Miller, 2001). Therefore, the interaction between the PDCs is determined by the solvent-exposed surfaces contributed by both protein and detergent. It is known that a subtle change of chemical structure of detergents used affects significantly the crystallization behavior of PDCs (Thiyagarajan and Tiede, 1994; Marone et al., 1999). Moreover, additives with small molecular weight (such as heptane triol) strongly affect the crystallization in such a way that they change the structure of PDCs themselves and interaction between PDCs (Timmins et al., 1991; Thiyagarajan and Tiede, 1994; Marone et al., 1999; Rosenow et al., 2001). In this study, however, we approximate PDC particles as simple spheres, ignoring their complex structure to focus on the effect of PEG on the interparticle interaction. Within this approximation, we show that a colloidal model calculation, using the Derjaguin-Landau-Verwey-Overbeek (DLVO) model plus the depletion interaction, explains experiments well. This approach to the PDC systems is rationalized by the fact that the colloidal behaviors of PDCs are qualitatively the same as those of micelles even in the presence of PEG (Hitscherich et al., 2000, 2001).
It is known that the crystallization of PDCs is enhanced under conditions that approach the cloud point of the detergent used (Rosenbusch, 1990; Zulauf, 1991). The measurements of the second virial coefficient showed that attractive interaction was induced when the solutions were brought to the proximity of the cloud point (Hitscherich et al., 2001; Loll et al., 2001). We show that, on the other hand, the crystallization of BC1 seems connected to the liquid-liquid phase separation (LLPS) of BC1 itself (not to the phase separation of detergents because it does not happen in our conditions). We discuss the connection between our observation and the fact that the crystallization is promoted at the proximity of the cloud point of detergents.
MATERIALS AND METHODS
Materials and sample preparation
Bovine heart cytochrome bc1 complex (BC1) was freshly prepared and used within two weeks to avoid denaturation. The method of purification was reported elsewhere (Onuma et al., 2002). In the previous study, we showed that complex phenomena occurred during crystallization of BC1 where Zn ions played an important role (Onuma et al., 2002). In this study, however, we concentrated on PEG-induced attraction in simpler Zn-free solutions.
Polyethylene glycol (PEG) of molecular weight M = 1500, 4000, 8000, and 20,000 (referred hereafter as PEG1500, PEG4000, PEG8000, and PEG20000) was purchased from Hampton Research. The concentration of PEG was measured as % (wt/vol). All solutions contained 0.5% (w/v) sucrose monolaurate as the detergent to solubilize BC1, and 0.036 mol/L potassium phosphate buffer (pH 8.0). High-purity deionized water at 18.2 MΩcm from a water purification system (Barnstead International) was used for all solutions.
Dynamic light scattering
Dynamic light scattering measurements were done using a DLS-7000 optical system (Otsuka Electronics, Osaka) with a 10 mW He-Ne laser at a wavelength of 633 nm. The autocorrelation functions of scattered light intensity were calculated by an ALV-5000/E (ALV, Langen) correlator system. The scattering angle was fixed at 90°. About 200 μL of a sample was placed in a cylindrical glass cell and was kept at 20 ± 0.1°C by circulating water.
Dynamic light scattering technique measures the autocorrelation function g(2)(q,t) of scattered light intensity, where q is the scattering vector and t is the time difference between two measurements of photon counting. The averaged translational diffusion coefficient D of particles is estimated from g(2)(q,t). We used the cumulant method of Koppel (1972) to analyze g(2)(q,t),
 |
(1) |
where  is the average decay rate and
  is variance.
In general, interaction between particles in solution modulates their translational diffusion coefficient D as (Pusey and Tough, 1985),
 |
(2) |
where D0 is the diffusion coefficient extrapolated to zero concentration, φ the volume fraction of particles, and the interaction parameter λ represents the magnitude and sign of the interaction. When λ is positive, the interaction is repulsive and D becomes larger than D0, and vice versa.
Note that for BC1 the relation between the molar concentration c (μmol/L) and φ is φ = 4.71 × 10⁻⁴c, by assuming a PDC particle as a sphere of 7.2 nm in radius, which was estimated as the hydrodynamic radius rH from D0 using Einstein-Stokes relation,
 |
(3) |
where kB is the Boltzmann's constant, T the absolute temperature, and η the solvent viscosity.
Scattering intensity from micelles were <1% even in the most dilute BC1 solutions in this study. Therefore, we ignored the existence of micelles to evaluate our data. This approximation was validated by the fact that the estimation of hydrodynamic radius of PDCs corresponded well to that of BC1 dimers as discussed below.
Model calculation
The value of λ can be calculated if we know a radial distribution function of particles g(r) (Pusey and Tough, 1985). The g(r) is given by the interparticle potential of mean force W(r) through
 |
(4) |
When the solution is in the dilution limit, the W(r) corresponds to the interparticle interaction potential U(r).
Interparticle interaction in colloid or protein solutions is often treated by the DLVO model, which takes the hard-body interaction Uh(r), the electrostatic interaction Ue(r), and the van der Waals interaction Uυ(r) into account (Eberstein et al., 1994). In this study, we added the depletion interaction Ud (Asakura and Oosawa, 1954) to the DLVO model for PEG-induced interaction.
The method of calculation of λ used in this study was described elsewhere (Tanaka and Ataka, 2002) in detail. Briefly, two major assumptions were made for the calculation. The first one was that the polymer volume fraction was low enough so that the osmotic pressure of polymers could be estimated by the ideal gas model. The other was that the volume fraction of PDCs was low enough as well so that the PEG concentration in the free volume (Ilett et al., 1995), which is the volume where the center of mass of polymers can occupy, was approximated by the total concentration of polymers within experimental error.
Optical microscopy
Crystallization and other phase behaviors were observed by an optical microscope (Axiovert S100, Carl Zeiss). Images were recorded by a digital charge-coupled device imaging system (SenSys, Photometrics).
Crystallization tests were conducted as follows. A BC1 solution and a PEG solution were mixed in an appropriate volume ratio and sealed in the cavity of a microscope slide. The samples were kept in an incubator at 20°C.
We also observed phase behaviors in the solutions where their concentrations were rapidly increased by evaporation. A BC1 solution containing PEG was placed in the cavity of a microscope slide and allowed to evaporate. To prevent too rapid evaporation, the solution was covered by silicone oil, which was permeable to water. The degree of concentration was monitored by weight. It took ∼20 min that the weight of the solution became half of the initial value.
RESULTS
In the absence of PEG
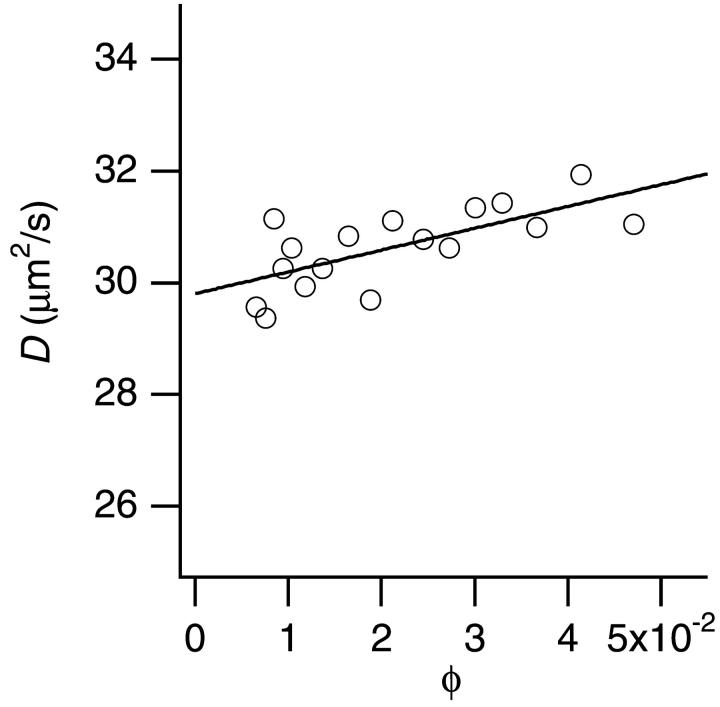
Fig. 1 plots the translational diffusion coefficient D versus φ of PDCs in the absence of PEG. The D depended linearly on the volume fraction φ, which confirmed the relation shown in Eq. 2 with λ = 1.3 ± 0.1. The hydrodynamic radius rH obtained from D0 was 7.2 ± 0.05 nm. BC1 is known to form dimers in crystal (Xia et al., 1997) or in solution (Onuma et al., 2002). The dimensions of the BC1 dimer solved by x-ray crystallography are ∼13 × 13 × 15.5 nm (Xia et al., 1997), whose average is 13.8 nm. Our slightly larger value of rH = 7.2 ± 0.05 nm well corresponds to the crystallographic size, if we consider the fact that the BC1 dimers are surrounded by detergent molecules. Therefore, we treated hereafter PDCs of BC1 dimers as spherical particles whose radius is 7.2 nm.
FIGURE 1.
The translational diffusion coefficient D of BC1 particles depending on BC1 volume fraction φ in the absence of PEG. The hydrodynamic radius rH calculated from D0 (D at φ = 0) was 7.2 ± 0.05 nm.
The change of D depending on φ as shown in Fig. 1 could be attributed to interparticle interaction (Eq. 2) and/or change of particle structure. In this study, however, we only considered the effect of the interaction since the linear dependence of D as shown in Fig. 1 is consistent with the theoretical expression of the interaction effect (Eq. 2).
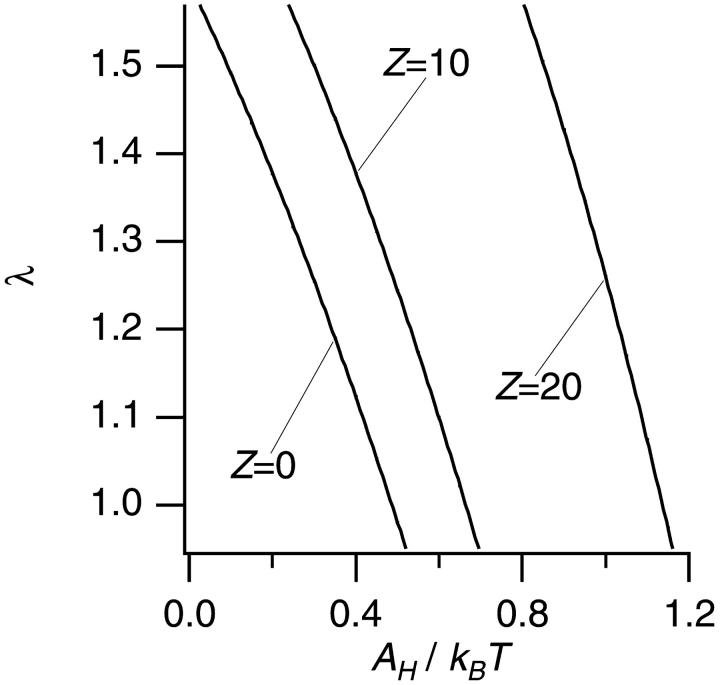
In the absence of PEG, a DLVO potential (Uh + Ue + Uυ) was used for the calculation of λ. The parameters which determine the shape of the DLVO potential are the radius a and the net surface charge Z of a PDC, the concentration of small ions, and the Hamaker constant AH that characterizes the intensity of the van der Waals potential. Among them, a = 7.2 nm and the concentration of small ions (∼0.036 mol/L) are known. Furthermore, since the isoelectric point (pI) of BC1 was calculated as ∼7.8 from its amino acid sequence, BC1 in our solution at pH 8.0 are expected not to be charged much. Note that we assumed all charged amino acid residues were exposed in solution, and did not interact with each other. We chose three values (0, 10, and 20) for Z and calculated λ depending on values of AH. Fig. 2 shows the λ versus AH at fixed Z (0, 10, and 20). From the plots in Fig. 2, we could obtain three possible combinations of AH and Z which were able to reproduce the experimental value of λ (λ = 1.3 ± 0.1): Z = 0 and AH = 0.3 kBT; Z = 10 and AH = 0.5 kBT; Z = 20 and AH = 1.0 kBT. These parameters were used for the calculation in the presence of PEG. However, each combination of Z and AH produced almost the same result for the PEG effect using Uh + Ue + U0 + Ud, since the Ud term dominated the calculation in the presence of PEG.
FIGURE 2.
The calculated λ depending on AH values at fixed Z of 0, 10, and 20 in the absence of PEG. The experimental value was λ = 1.3 ± 0.1.
In the presence of PEG
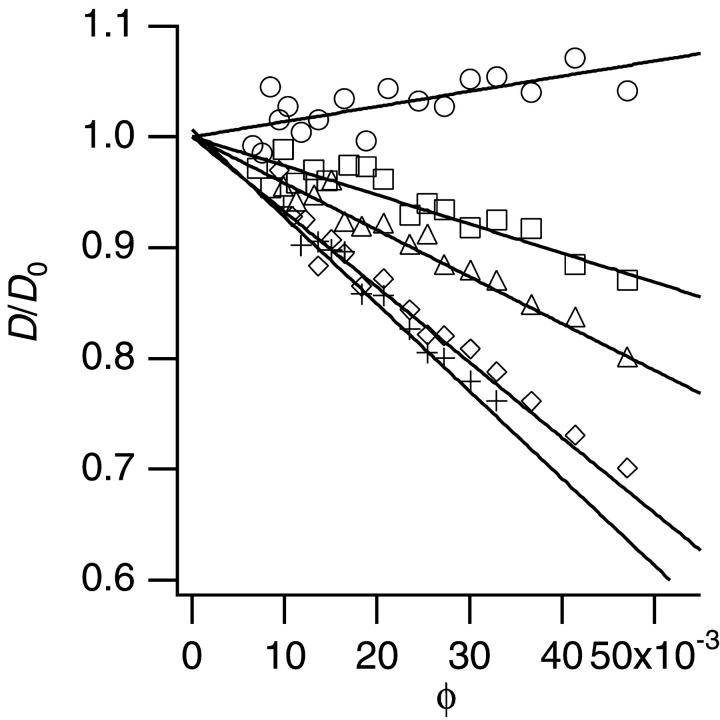
Fig. 3 shows an example of D/D0 versus φ depending on PEG concentration (M = 20,000). The data without PEG (o) are the same as the one already shown in Fig. 1. Other PEG with different molecular weight (M = 1500–8000) provided the similar plots as in Fig. 3. The dependence of D/D0 on φ was linear, and the larger the concentration of PEG, the smaller was the slope.
FIGURE 3.
The dependence of D normalized by D0 in the presence of PEG (M = 20,000). Each symbol represents each concentration of PEG: circles, 0%; squares, 1%; triangles, 2%; diamonds, 3%; and crosses, 4%.
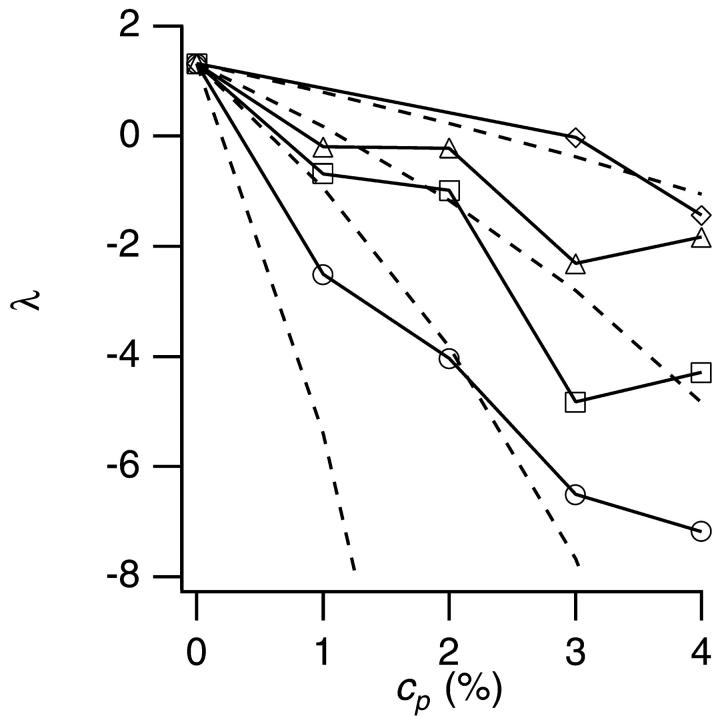
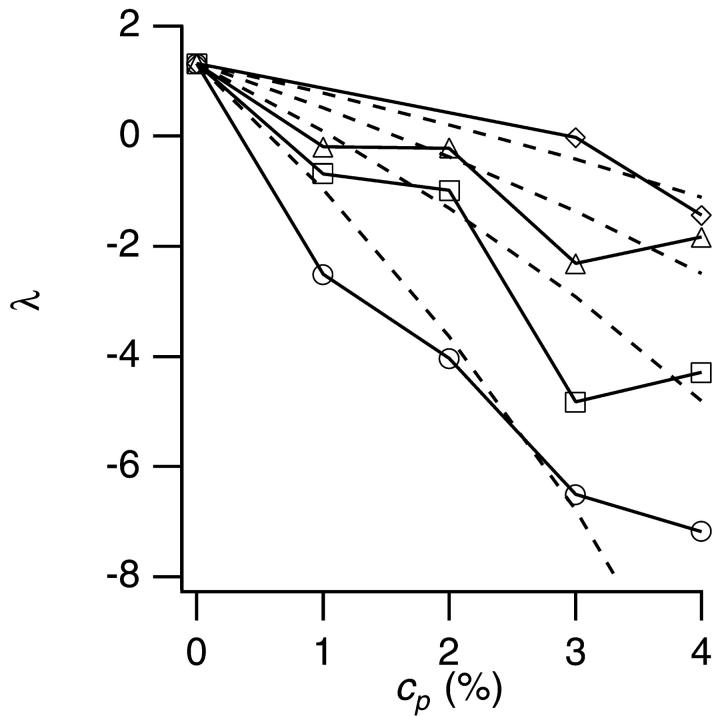
The linear dependence of D/D0 on φ as shown in Fig. 3 allowed us to estimate the interaction parameter λ from each slope. Fig. 4 shows the λ for each PEG (M = 1500–20,000). In the absence of PEG (cp = 0%), the λ was positive (λ = 1.3 as already shown in Fig. 1), which indicated the repulsion between particles. Addition of PEG decreased λ into negative values, which indicated that PEG induced attraction, and the larger the PEG molecular weight, the stronger the effect was.
FIGURE 4.
The interaction parameter λ versus PEG concentration cp. Symbols represent molecular weight of PEG: diamonds, 1500; triangles, 4000; squares, 8000; and circles, 20,000. The solid lines are the guide to eye. The broken curves show the results of calculation of λ using the assumption of δ = rg.
The broken curves in Fig. 4 show the model calculation of λ under an assumption that the range δ of the depletion zone was equal to the radius of gyration rg of PEG. We used an empirical relation (Kawaguchi et al., 1997) between rg and the molecular weight M, rg = 0.020 M0.58. The model succeeded in capturing the qualitative tendency of decrease of λ with increase of cp and M, but it failed to reproduce experiments quantitatively, especially when the molecular weight and concentration of PEG were large.
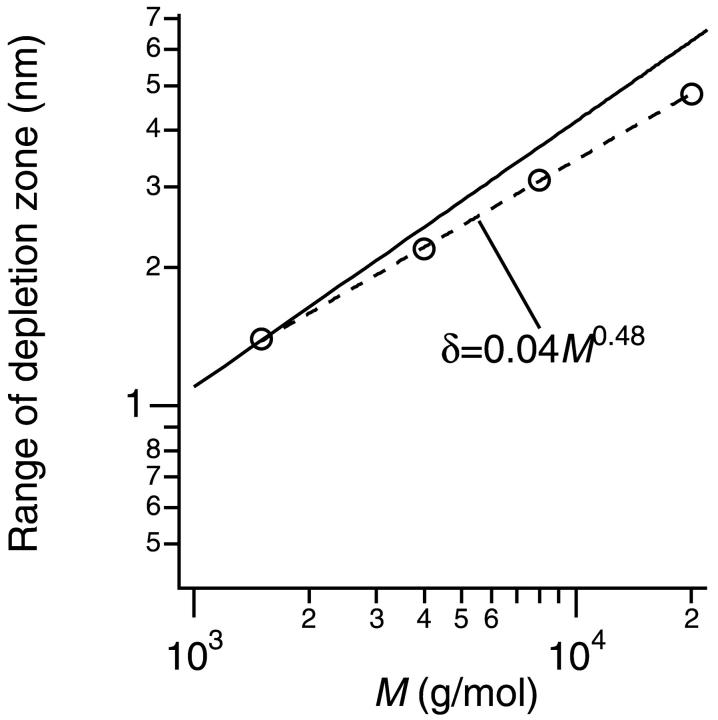
Next we adjusted the parameter δ in the calculation in such a way as to best reproduce the experiments. As shown in Fig. 5, this adjustment led to the quantitative agreement between the experiments and calculation. Note that we removed a point of PEG20000 at 4% for the procedure since PEG20000 at 4% was within the semidilute regime, and including this point to adjust δ was obviously unjustifiable. The obtained δ at each molecular weight of PEG was shown in Fig. 6 together with the rg (rg = 0.020 M0.58, solid line) of PEG. The broken line in Fig. 6 represents the fitting of δ with a power law function, δ = (0.04 ± 0.01)M0.48±0.02. Fig. 6 shows that the rg (solid line) overestimates the actual range of the depletion zone δ in our model.
FIGURE 5.
The interaction parameter λ versus PEG concentration cp together with calculation (broken curves). The calculation was done by adjusting the range of depletion zone δ to best reproduce the experiments.
FIGURE 6.
The range of depletion zone δ obtained from the fitting as shown in Fig. 5 versus the molecular weight M of PEG. The broken line was a fitting using a power law function, δ ∼ Mα. The solid line represents the relation between the radius of gyration rg and the molecular weight M of PEG (Kawaguchi et al., 1997), rg = 0.020 M0.58.
Liquid-liquid phase separation and crystallization
We could produce crystals by PEG of all molecular weight we used as shown in Fig. 7 though the crystal habit was observed to be different with each other. It tended to become thin and elongated through the decrease of the molecular weight of PEG.
FIGURE 7.
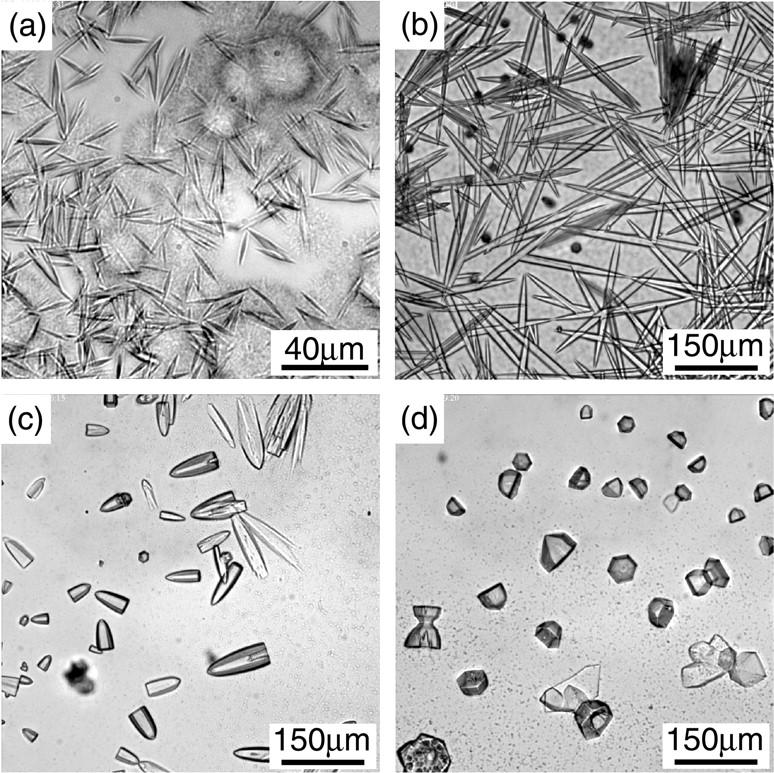
Crystallization induced by PEG. The conditions of the solutions were: (a) PEG1500 14%, φ = 0.024; (b) PEG4000 10%, φ = 0.042; (c) PEG8000 8%, φ = 0.024, and (d) PEG20000 8%, φ = 0.024.
In addition to the crystallization, we studied the phase behavior in highly supersaturated solutions. The solutions were rapidly concentrated by evaporation as described in the experimental section. Liquid-liquid phase separation (LLPS), which is often observed in supersaturated protein solutions (for example, Tanaka et al., 1997), occurred in solutions of PEG8000 (Fig. 8 c) and PEG20000 (Fig. 8 d). In these solutions, the liquid domains formed a connected spongelike structure which was similar to those observed in apoferritin solutions (Tanaka and Ataka, 2002) or lysozyme solutions (Tanaka et al., 2002). In PEG4000 solutions, on the other hand, the majority of precipitates was a large number of tiny needle-like crystals (thin needles in Fig. 8 b), although liquid droplets which fused with each other (Fig. 8 b) were sometimes observed coexisting with the crystals. In the PEG1500 solutions, many small droplets appeared as shown in Fig. 8 a. We could not identify whether these droplets were liquid or amorphous solid, though they looked solidlike since they did not coalesce with each other easily.
FIGURE 8.
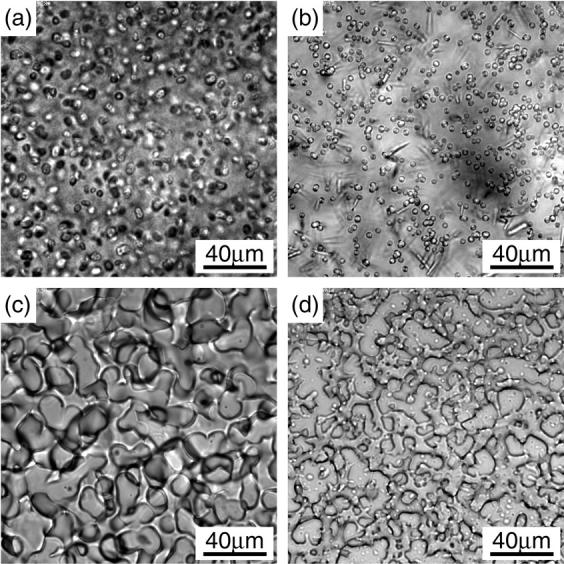
Phase separation caused by rapid concentration of solutions. The conditions before the concentration were: (a) PEG1500 16.5%, φ = 0.024; (b) PEG4000 10%, φ = 0.057; (c) PEG8000 8%, φ = 0.024; and (d) PEG20000 5%, φ = 0.014.
It is noteworthy that the phase behavior observed in this study including crystallization does not represent the final state of the system because of the denaturation of protein molecules. The denaturation became obvious about two weeks after sample preparation.
DISCUSSION
Interaction in the absence of PEG
In the absence of PEG, the interaction parameter λ obtained was 1.3. A theoretical prediction for the hard sphere system where only hard-body interaction is taken into account is 1.56 (Pusey and Tough, 1985), which is close to our value of λ. This suggests that the other components of the interparticle interaction such as electrostatic repulsion and van der Waals attraction are more or less balanced. Considering that our experiments were done at a pH close to pI, the electrostatic interaction was expected to be weak. Moreover, the van der Waals attraction is also expected not strong (AH ∼ kBT) in large protein systems (Finet and Tardieu, 2001; Tanaka and Ataka, 2002). Therefore, we believe that our estimation of Z = 0 – 20 and AH = 0.3 – 1.0 kBT based on Fig. 2 is reasonable.
These values are also compared to those of other proteins. Apoferritin (mol wt = 440,000 and pI = 4.5) at pH = 7.5 has Z = 63 and AH = 0.8 kBT (Tanaka and Ataka, 2002). Large value of the Z is attributed to the pH far from the pI. Lysozyme (mol wt = 14,300 and pI = 10.7) at pH = 4.2 − 4.5 has Z = 10.7 and AH = 8.1 kBT (Eberstein et al., 1994) or AH = 2.5 − 3.0 kBT (Tardieu et al., 1999). The rather large value of AH may relate to the fact that lysozyme can easily be crystallized only by the addition of salt, though it was reported that the attraction between lysozyme molecules were highly salt-dependent (Tardieu et al., 1999).
PEG-induced attraction and the depletion model
The calculation of λ using the combination of the DLVO and depletion potentials was fairly good for reproducing experimental values (Figs. 4 and 5). These results suggest that the depletion model is reasonable for PEG-induced attraction even in the PDC system of BC1. This is consistent with the idea that the interaction between PDCs in solution are dominated by the rather simple micelle-to-micelle interaction (Hitscherich et al., 2000, 2001; Loll et al., 2001). Although the simplest assumption of δ = rg ∼ M0.58 failed to explain experiments quantitatively, another power law δ ∼ M0.48±0.02 was successful. It is remarkable that the power law dependence of δ is almost the same as that we found recently in apoferritin-PEG system (δ ∼ M0.50; Tanaka and Ataka, 2002). Though the exact mechanism producing this power law is presently unclear, the similarity suggests that the PEG-induced interaction seems common between the two different (soluble and membrane protein) systems.
It is likely that the deviation of δ from rg is caused by the broad distribution (polydispersity) of PEG molecular weight. The nominal molecular weight for each PEG sample used in this study is listed in Table 1. The range of depletion zone may be estimated using the smallest molecular weight in the distribution. The radius of gyration  calculated with the smallest molecular weight are listed in Table 1 as well. As shown in Table 1, however, the
  are still larger than δ. The results of Table 1 are also discussed in the next subsection.
TABLE 1.
The parameters of PEG and the depletion potential
| M (g/mol) | rg (nm) |
 (nm) (nm) |
δ (nm) | δ/a |
|---|---|---|---|---|
| 1500 (1400–1600) | 1.4 | 1.3 | 1.3 | 0.18 |
| 4000 (3500–4500) | 2.5 | 2.3 | 2.1 | 0.29 |
| 8000 (7000–9000) | 3.7 | 3.4 | 3.0 | 0.42 |
| 20,000 (16,000–24,000) | 6.2 | 5.5 | 4.6 | 0.64 |
As a possible explanation, the deformation fluctuation of PEG molecules near protein particles may be a key to explain the power law, since the larger the PEG molecule is, the more obvious the deviation of δ from rg becomes.
Stability of liquid phase
The theory (Lekkerkerker et al., 1992) and experiments (Ilett et al., 1995) suggest that the stability of liquid phase in colloid systems is controlled by a ratio of (range of attraction)/(range of repulsion), and the liquid phase becomes stable when the ratio exceeds ∼0.3. In our system, the range of depletion zones δ and the radius of the PDCs a may be used for the ratio. In Table 1, we listed δ and δ/a. Judging from the experimental values of the ratio δ/a in Table 1, liquid phase is not expected to be stable in PEG1500 solutions (δ/a = 0.18), and on the other hand, it can be stable in PEG8000 and PEG20000 solutions (δ/a = 0.42 and 0.64 respectively). PEG4000 solutions (δ/a = 0.29) are on the boundary between them. The prediction of the stable liquid corresponds well to the microscopic observation (Fig. 8), where the stable liquid phase formed spongelike structure in both PEG8000 and PEG20000 solutions. The observed droplets in PEG1500 solutions were probably amorphous solids, judging from the small ratio (δ/a = 0.18) and from their property that they did not fuse with each other. In PEG4000 solutions, the liquid phase separation was rarely observed, and rapid crystallization was dominant. It is remarkable that the simple rule using δ/a was sufficient to explain the phase behavior of the complex PDC system. Moreover, as discussed in the next subsection, the boundary region between stable and unstable liquid phase is likely to be favorable to crystallization.
Crystallization and metastable liquid-liquid phase separation
The most effective PEG for the BC1 crystallization was PEG4000 in this study since it produced crystals even when we rapidly concentrated the solution (Fig. 8). Crystals can be formed in PEG4000 solution within a few minutes during concentration, whereas in other PEG solutions LLPS or amorphous precipitation occurs before crystallization as evidenced in Fig. 8. It was suggested (ten Wolde and Frenkel, 1997) that the critical fluctuation under the condition close to the critical point of LLPS could enhance the crystal nucleation when the LLPS is not stable but is hidden in the region of stable solid phase separation. In line with this theoretical prediction, we consider the actual behavior of the system of BC1-PEG mixtures as follows. 1), In PEG1500 solutions, liquid phase is unstable, hence amorphous solid or crystals appear under supersaturation. 2), In PEG4000 solutions, conditions close to LLPS promotes the crystal nucleation because the liquid phase in the solutions is metastable. 3), In PEG8000 and 20000 solutions, the liquid phase is stable. At the same time, crystals can be also stable. Therefore, three-phase coexistence “gas-liquid-crystal” is possible.
It is known that the crystallization of membrane proteins often occurred under conditions close to the cloud point of detergents used (Rosenbusch, 1990; Zulauf, 1991; Garavito and Ferguson-Miller, 2001). This clouding phenomena is a LLPS of detergent micelles. In a colloidal view point, micelles and PDCs are similar particles in size or shape and in fact it was reported that the interaction behavior of micelles was very similar to that of PDCs (Hitscherich et al., 2000, 2001; Loll et al., 2001). Therefore, the fact that the crystallization is enhanced in the proximity of the LLPS of micelles can be easily extended to the case that the LLPS of PDCs themselves takes place as our BC1 system. We believe that the physics of promotion of crystallization by LLPS is the same between the two cases. In our system, although there are no clouding phenomena of micelles under the crystallization conditions, the LLPS of PDCs occur and the best crystallization condition is the one where the liquid phase became metastable. It looks like, though its physical meanings are still unclear, the LLPS and crystallization are strongly related with each other.
BC1 was crystallized for the first time by two groups (Yue et al., 1991; Kubota et al., 1991) using PEG4000 as a main crystallization agent. Then crystal quality was improved, but still PEG4000 was mainly used (Kawamoto et al., 1994; Berry et al. 1995; Lee et al., 1995). The molecular weight of 4000 that was empirically chosen was reasonable for BC1 as discussed above. We suggest that the consideration based on the length scale of interaction such as the ratio (range of depletion potential)/(PDC radius) can help selecting the proper molecular weight of PEG for membrane protein crystallization as well as soluble proteins (Tanaka and Ataka, 2002). For example, the range of depletion potential roughly corresponds to the radius of gyration of PEG, which can be estimated from the molecular weight. If the radius of a PDC particle is known, then we suggest that the screening of the molecular weight of PEG should be started from the one whose radius of gyration is about one-third of the radius of the PDC, where liquid phase of PDCs becomes metastable.
Finally, crystals produced by PEG have different forms depending on the molecular weight of PEG as shown in Fig. 7. This suggests that the interaction between the PDCs in crystals is different depending on the PEG molecular weight. Theoretical phase diagrams for colloid-polymer mixtures (Lekkerkerker et al., 1992) predicted the partition of polymers between solution and crystal. Therefore, a part of the PEG molecules may be taken into crystals, and change the interaction between the PDCs in crystals.
CONCLUSIONS
We tested the depletion model on the crystallization of a membrane protein using cytochrome bc1 complex (BC1) and polyethylene glycol (PEG). The calculation of the interaction parameter λ using the DLVO potential plus the depletion potential reproduced experimental values obtained from dynamic light scattering. The relation between molecular weight M of PEG and the range of depletion zone δ was estimated as δ ∼ M0.48±0.02, which was very similar to the relation we found recently in apoferritin-PEG mixtures. We found that the phase behavior of BC1 solutions was controlled by a ratio of (the range of depletion zone)/(the radius of a BC1 particle), and BC1 crystallized most effectively at about a ratio of 0.3, which is the ratio where liquid phase becomes metastable. We considered that this result was related to the fact that the membrane protein crystallization often occurs in the proximity of the liquid-liquid phase separation of micelles in the solutions. We suggested that the consideration based on the depletion model and particle interaction can help to select the most effective molecular weight of PEG to crystallize a membrane protein. Although the precise relation between the stability of the liquid phase and crystallization is yet unclear, we think that the control of phase behavior by PEG molecular weight is a highly reasonable strategy for protein crystallization.
References
- Anderson, V. J., and H. N. W. Lekkerkerker. 2002. Insights into phase transition kinetics from colloid science. Nature. 416:811–815. [DOI] [PubMed] [Google Scholar]
- Asakura, S., and F. Oosawa. 1954. On interaction between two bodies immersed in a solution of macromolecules. J. Chem. Phys. 22:1255–1256. [Google Scholar]
- Berry, E. A., V. M. Shulmeister, L. S. Huang, and S. H. Kim. 1995. A new crystal form of bovine heart ubiquinol: cytochrome c oxidoreductase: determination of space group and unit-cell parameters. Acta Crystallogr. Sect. D Biol. Crystallogr. 51:235–239. [DOI] [PubMed] [Google Scholar]
- Bonneté, F., D. Vivarès, C. Robbert, and N. Colloch. 2001. Interactions in solution and crystallization of Aspergillus flavus urate oxidase. J. Crystal Growth. 232:330–339. [Google Scholar]
- Budayova, M., F. Bonneté, A. Tardieu, and P. Vachette. 1999. Interactions in solution of a large oligomeric protein. J. Crystal Growth. 196:210–219. [Google Scholar]
- Casselyn, M., J. Perez, A. Tardieu, P. Vachette, J. Witz, and H. Delacroix. 2001. Spherical plant viruses: interactions in solution, phase diagrams and crystallization of brome mosaic virus. Acta Crystallogr. Sect. D Biol. Crystallogr. 57:1799–1812. [DOI] [PubMed] [Google Scholar]
- Eberstein, W., Y. Georgalis, and W. Saenger. 1994. Molecular interactions in crystallizing lysozyme solutions studied by photon-correlation spectroscopy. J. Crystal Growth. 143:71–78. [Google Scholar]
- Finet, S., and A. Tardieu. 2001. α-crystallin interaction forces studied by small angle x-ray scattering and numerical simulations. J. Crystal Growth. 232:40–49. [Google Scholar]
- Garavito, R. M., and S. Ferguson-Miller. 2001. Detergents as tools in membrane biochemistry. J. Biol. Chem. 276:32403–32406. [DOI] [PubMed] [Google Scholar]
- Gast, A. P., C. K. Hall, and W. B. Russel. 1983. Polymer-induced phase separations in nonaqueous colloidal suspensions. J. Colloid Interface Sci. 96:251–267. [Google Scholar]
- George, A., and W. W. Wilson. 1994. Predicting protein crystallization from a dilute solution property. Acta Crystallogr. Sect. D Biol. Crystallogr. 50:361–365. [DOI] [PubMed] [Google Scholar]
- George, A., Y. Chiang, B. Guo, A. Arabshahi, Z. Cai, and W. W. Wilson. 1997. Second virial coefficient as predictor in protein crystal growth. Methods Enzymol. 276:100–110. [DOI] [PubMed] [Google Scholar]
- Hitscherich, C., Jr., J. Kaplan, M. Allaman, J. Wiencek, and P. J. Loll. 2000. Static light scattering studies of OmpF porin: implications for integral membrane protein crystallization. Protein Sci. 9:1559–1566. [DOI] [PMC free article] [PubMed] [Google Scholar]
- Hitscherich, C., Jr., V. Aseyev, J. Wiencek, and P. J. Loll. 2001. Effects of PEG on detergent micelles: implications for the crystallization of integral membrane proteins. Acta Crystallogr. Sect. D Biol. Crystallogr. 57:1020–1029. [DOI] [PubMed] [Google Scholar]
- Ilett, S. M., A. Orrock, W. C. K. Poon, and P. N. Pusey. 1995. Phase behavior of a model colloid-polymer mixture. Phys. Rev. E. 51:1344–1352. [DOI] [PubMed] [Google Scholar]
- Kawaguchi, S., G. Imai, J. Suzuki, A. Miyahara, and T. Kitano. 1997. Aqueous solution properties of oligo- and poly(ethylene oxide) by static light scattering and intrinsic viscosity. Polymer. 38:2885–2891. [Google Scholar]
- Kawamoto, M., T. Kubota, T. Matsunaga, K. Fukuyama, H. Matsubara, K. Shinzawa-Itoh, and S. Yoshikawa. 1994. New crystal forms and preliminary x-ray diffraction studies of mitochondrial cytochrome bc1 complex from bovine heart. J. Mol. Biol. 244:238–241. [DOI] [PubMed] [Google Scholar]
- Koppel, D. E. 1972. Analysis of macromolecular polydispersity in intensity correlation spectroscopy: the method of cumulants. J. Chem. Phys. 57:4814–4820. [Google Scholar]
- Kubota, T., M. Kawamoto, K. Fukuyama, K. Shinzawa-Itoh, S. Yoshikawa, and H. Matsubara. 1991. Crystallization and preliminary x-ray crystallographic studies of bovine heart mitochondrial cytochrome bc1 complex. J. Mol. Biol. 221:379–382. [DOI] [PubMed] [Google Scholar]
- Kulkarni, A. M., A. P. Chatterjee, K. S. Schweizer, and C. F. Zukoski. 2000. Effects of polyethylene glycol on protein interactions. J. Chem. Phys. 113:9863–9873. [Google Scholar]
- Lee, J. W., M. Chan, T. V. Law, H. J. Kwon, and B. K. Jap. 1995. Preliminary cryocrystallographic study of the mitochondrial cytochrome bc1 complex: improved crystallization and flash-cooling of a large membrane protein. J. Mol. Biol. 252:15–19. [DOI] [PubMed] [Google Scholar]
- Lekkerkerker, H. N. W. 1997. Strong, weak and metastable liquids. Physica A. 244:227–237. [Google Scholar]
- Lekkerkerker, H. N. W., W. C. K. Poon, P. N. Pusey, A. Stroobants, and P. B. Warren. 1992. Phase behaviour of colloid + polymer mixtures. Europhys. Lett. 20:559–564. [Google Scholar]
- Loll, P. J., M. Allaman, and J. Wiencek. 2001. Assessing the role of detergent-detergent interactions in membrane protein crystallization. J. Crystal Growth. 232:432–438. [Google Scholar]
- Marone, P. A., P. Thiyagarajan, A. M. Wagner, and D. M. Tiede. 1999. Effect of detergent alkyl chain length on crystallization of a detergent-solubilized membrane protein: correlation of protein-detergent particle size and particle-particle interaction with crystallization of the photosynthetic reaction center from Rhodobacter sphaeroides. J. Crystal Growth. 207:214–225. [Google Scholar]
- McPherson, A. 1999. Crystallization of Biological Macromolecules. Cold Spring Harbor Laboratory Press, New York.
- Onuma, K., T. Kubota, S. Tanaka, N. Kanzaki, A. Ito, and K. Tsutsui. 2002. Dynamic light scattering investigation in aqueous solutions of bc1-complex membrane protein. J. Phys. Chem. B. 106:4318–4324. [Google Scholar]
- Pusey, P. N., and R. J. A. Tough. 1985. Particle interactions. In Dynamic Light Scattering: Applications of Photon Correlation Spectroscopy. R. Pecora, editor. Plenum, New York.
- Rosenbusch, J. P. 1990. The critical role of detergents in the crystallization of membrane proteins. J. Struct. Biol. 104:134–138. [DOI] [PubMed] [Google Scholar]
- Rosenow, M. A., J. C. Williams, and J. P. Allen. 2001. Amphiphiles modify the properties of detergent solutions used in crystallization of membrane proteins. Acta Crystallogr. Sect. D Biol. Crystallogr. 57:925–927. [DOI] [PubMed] [Google Scholar]
- Tanaka, S., K. Ito, R. Hayakawa, and M. Ataka. 1997. Relation between the phase separation and the crystallization in protein solutions. Phys. Rev. E. 56:R67–R69. [Google Scholar]
- Tanaka, S., and M. Ataka. 2002. Protein crystallization induced by polyethylene glycol: a model study using apoferritin. J. Chem. Phys. 117:3504–3510. [Google Scholar]
- Tanaka, S., M. Ataka, and K. Ito. 2002. Pattern formation and coarsening during metastable phase separation in lysozyme solutions. Phys. Rev. E. 65:051804-1–051804-6. [DOI] [PubMed] [Google Scholar]
- Tardieu, A., A. Le Verge, M. Malfois, F. Bonneté, S. Finet, M. Riès-Kautt, and L. Belloni. 1999. Proteins in solution: from x-ray scattering intensities to interaction potentials. J. Crystal Growth. 196:193–203. [Google Scholar]
- ten Wolde, P. R., and D. Frenkel. 1997. Enhancement of protein crystal nucleation by critical density fluctuations. Science. 277:1975– 1978. [DOI] [PubMed] [Google Scholar]
- Thiyagarajan, P., and D. M. Tiede. 1994. Detergent micelle structure and micelle-micelle interactions determined by small-angle neutron scattering under solution conditions used for membrane protein crystallization. J. Phys. Chem. 98:10343–10351. [Google Scholar]
- Timmins, P. A., J. Hauk, T. Wacker, and W. Welte. 1991. The influence of heptane-1,2,3-triol on the size and shape of LDAO micelles. FEBS Lett. 280:115–120. [DOI] [PubMed] [Google Scholar]
- Vivarès, D., and F. Bonneté. 2002. X-ray scattering studies of Aspergillus flavus urate oxidase: toward a better understanding of PEG effects on the crystallization of large proteins. Acta Crystallogr. Sect. D Biol. Crystallogr. 58:472–479. [DOI] [PubMed] [Google Scholar]
- Xia, D., C.-A. Yu, H. Kim, J.-Z. Xia, A. M. Kachurin, L. Zhang, L. Yu, and J. Deisenhofer. 1997. Crystal structure of the cytochrome bc1 complex from bovine heart mitochondria. Science. 277:60–66. [DOI] [PubMed] [Google Scholar]
- Yue, W. H., Y. P. Zou, L. Yu, and C. A. Yu. 1991. Crystallization of mitochondrial ubiquinol-cytochrome c reductase. Biochemistry. 30:2303–2306. [DOI] [PubMed] [Google Scholar]
- Zulauf, M. 1991. Detergent phenomena in membrane protein crystallization. In Crystallization of Membrane Proteins. H. Michel, editor. CRC Press, Boca Raton, Florida. pp. 53–72.


