

Abstract
The most well-established structural feature of amyloid fibrils is the cross-β motif, an extended β-sheet structure formed by β-strands oriented perpendicular to the long fibril axis. Direct experimental identification of non-β-strand conformations in amyloid fibrils has not been reported previously. Here we report the results of solid-state NMR measurements on amyloid fibrils formed by the 40-residue β-amyloid peptide associated with Alzheimer's disease (Aβ1–40), prepared synthetically with pairs of 13C labels at consecutive backbone carbonyl sites. The measurements probe the peptide backbone conformation in residues 24-30, a segment where a non-β-strand conformation has been suggested by earlier sequence analysis, cross-linking experiments, and molecular modeling. Data obtained with the fpRFDR-CT, DQCSA, and 2D MAS exchange solid-state NMR techniques, which provide independent constraints on the φ and ψ backbone torsion angles between the labeled carbonyl sites, indicate non-β-strand conformations at G25, S26, and G29. These results represent the first site-specific identification and characterization of non-β-strand peptide conformations in an amyloid fibril.
INTRODUCTION
Amyloid fibrils are filamentous structures, with typical diameters of roughly 5–20 nm and lengths up to several microns, formed by numerous peptides and proteins with disparate sequences and molecular weights (Sunde and Blake, 1998). Current interest in amyloid fibrils arises from their occurrence in amyloid diseases (Sipe, 1992), including Alzheimer's disease, type-2 diabetes, Parkinson's disease, Huntington's disease, and prion diseases, and from fundamental questions regarding the molecular mechanism of amyloid formation and the nature of the intermolecular interactions that make the amyloid fibril a stable form for an extremely diverse class of polypeptides (Chiti et al., 1999; MacPhee and Dobson, 2000). Amyloid fibrils share certain defining properties, including an unbranched morphology in electron microscope (EM) images, pronounced and typically green optical birefringence after Congo Red staining, and an x-ray scattering pattern indicative of a “cross-β” structure, i.e., an extended β-sheet structure formed by intermolecular hydrogen bonding in which the β-strand segments run approximately perpendicular to and the hydrogen bonds run approximately parallel to the long axis of the fibril. Definitive evidence for the cross-β structure comes from x-ray diffraction studies (Kirschner et al., 1987; Inouye et al., 1993; Sunde et al., 1997) and more recently from EM (Serpell and Smith, 2000).
More detailed and site-specific structural information has been difficult to obtain in amyloid fibrils because of their inherently noncrystalline and insoluble nature. Recently, several groups have used solid-state NMR techniques to characterize the supramolecular organization of the β-sheets in amyloid fibrils, especially fibrils formed by the β-amyloid (Aβ) peptide associated with Alzheimer's disease (Antzutkin et al., 2000; Antzutkin et al., 2002; Balbach et al., 2002; Petkova et al., 2002) and several Aβ fragments that serve as important model systems (Lansbury et al., 1995; Benzinger et al., 1998; Gregory et al., 1998; Balbach et al., 2000; Benzinger et al., 2000; Burkoth et al., 2000). One unanticipated result from solid-state NMR spectroscopy is that the β-sheets in full-length Aβ fibrils and in certain Aβ fragment fibrils have a parallel, in-register structure (Benzinger et al., 1998; Gregory et al., 1998; Antzutkin et al., 2000; Benzinger et al., 2000; Burkoth et al., 2000; Antzutkin et al., 2002; Balbach et al., 2002), whereas the β-sheets in other Aβ fragment fibrils have antiparallel structures (Lansbury et al., 1995; Balbach et al., 2000). Linewidths in solid-state NMR spectra of amyloid fibrils indicate a high degree of structural order in certain segments of the peptide sequence (Balbach et al., 2000; Ishii, 2001; Petkova et al., 2002). In the case of full-length Aβ fibrils, NMR linewidths and intermolecular dipole-dipole couplings indicate a disordered N-terminal segment of ∼10 residues (Balbach et al., 2002; Petkova et al., 2002), consistent with proteolysis data (Roher et al., 1993; Saido et al., 1996; Kheterpal et al., 2001). 13C NMR chemical shifts have been used to identify specific peptide segments that form β-strands in amyloid fibrils (Balbach et al., 2000; Ishii, 2001; Laws et al., 2001; Petkova et al., 2002).
Although the cross-β structure is the predominant structural motif in amyloid fibrils, the dimensions of Aβ fibrils suggest that the full-length peptide (Aβ1-40, 40 residues; Aβ1-42, 42 residues) adopts a structure that includes non-β-strand conformations. The thinnest Aβ1-40 and Aβ1-42 fibrils observed in EM images have diameters of 6 ± 1 nm (Goldsbury et al., 2000; Antzutkin et al., 2002; Petkova et al., 2002). The length of a β-strand formed by M residues is approximately M × 0.34 nm. Given a 10-residue disordered N-terminal segment, a minimum diameter of 10 nm would be expected for Aβ1-40 and Aβ1-42 fibrils if the remainder of the peptide formed a single, continuous β-strand. Circular dichroism spectra and secondary structure predictions based on the Aβ amino acid sequence (Kirschner et al., 1987; Hilbich et al., 1991) have suggested a β-turn in residues 23-30 (sequence DVGSNKGA). A β-turn (Lazo and Downing, 1998; George and Howlett, 1999; Li et al., 1999) or other non-β-strand conformation (Tjernberg et al., 1999) in this segment has been incorporated into several structural models. Measurements of enzymatic N-terminal proteolysis of Aβ10-43 analogs with intramolecular disulfide linkages have been described as experimental support for a β-turn encompassing residues 26-29 (Hilbich et al., 1991).
In this paper, we report solid-state NMR data that demonstrate a non-β-strand conformation in residues 24-30 of Aβ1-40 fibrils and permit estimation of the φ and ψ torsion angles, which define the peptide backbone conformation, at specific sites in this segment. The measurements were carried out on a series of samples in which pairs of 13C labels were introduced at consecutive backbone carbonyl sites. Three solid-state NMR techniques that place independent constraints on the φ and ψ values between the two 13C labels were employed, namely constant-time finite-pulse radio-frequency-driven recoupling (fpRFDR-CT) (Ishii et al., 2001), double-quantum chemical shift anistropy (DQCSA) spectroscopy (Blanco and Tycko, 2001), and two-dimensional magic-angle spinning (2D MAS) exchange spectroscopy (Tycko et al., 1996; Weliky and Tycko, 1996; Tycko and Berger, 1999). These techniques have previously been demonstrated on model compounds and applied in structural studies of a variety of peptides and proteins, including amyloid fibrils (Long and Tycko, 1998; Weliky et al., 1999; Balbach et al., 2000; Blanco et al., 2001; Antzutkin et al., 2002; Balbach et al., 2002). The results in this paper represent the first site-specific characterization of non-β-sheet structure in an amyloid fibril.
MATERIALS AND METHODS
Peptide synthesis, purification, and fibrillization
Peptides with the human Aβ1-40 sequence DAEFRHDSGYEVHHQKLVFFAEDVGSNKGAIIGLMVGGVV were synthesized on an Applied Biosystems (Foster City, CA) Model 433A automated solid-phase peptide synthesizer, cleaved from the synthesis resin, and purified by high-performance liquid chromatography as previously described (Antzutkin et al., 2000; Balbach et al., 2002). Aβ1-40 was fibrillized by dissolution in deionized water at ∼1 mM concentration (estimated from lyophilized peptide weight), adjustment to pH 7.4 by dropwise addition of dilute NaOH (from an initial pH ≈ 3.3), addition of 0.01% NaN3, and incubation at room temperature with gentle rocking for 10–20 days. Solutions typically became noticeably viscous after several hours and gelled within several days. Incubated solutions were lyophilized for solid-state NMR measurements. The extent of fibrillization was assessed by one-dimensional (1D) 13C NMR spectroscopy (see below). Samples found to be incompletely fibrillized were reincubated for an additional 10–20 days. Typical solid-state NMR samples were 10 mg.
Samples were prepared with 13C labels at the backbone carbonyl sites of D23 and V24 (D23,V24-Aβ1-40), V24 and G25 (V24,G25-Aβ1-40), G25 and S26 (G25,S26-Aβ1-40), K28 and G29 (K28,G29-Aβ1-40), and G29 and A30 (sample G29,A30-Aβ1-40). Amino acids with carboxyl 13C labels were purchased from Cambridge Isotopes Laboratories (Cambridge, MA) and Isotec (Miamisburg, OH) either with protecting groups required for peptide synthesis or as the bare amino acids. Fluorenylmethoxycarbonyl (FMOC) and side-chain protection reactions were performed by Midwest Biotech (Fishers, Indiana) when required. Because 13C-labeled asparagine could not be obtained, samples labeled at the backbone carbonyl site of N27 could not be prepared.
Protection of 13C-labeled aspartate, performed by Midwest Biotech, resulted in a mixture of the desired product (N-α-FMOC-L-aspartic acid β-t-butyl ester) and an undesired isomer (N-α-FMOC-L-aspartic acid α-t-butyl ester) that incorporates into the peptide as β-aspartate with a 13C-labeled side chain. The undesired isomer was present at a level of ∼20% in D23,V24-Aβ1-40 after purification, based on 13C NMR (Fig. 1). Although substitution of β-aspartate for aspartate may introduce a local structural perturbation in peptide chains containing the undesired isomer in the D23,V24-Aβ1-40 sample, peptide chains containing this isomeric substitution did not contribute significantly to the fpRFDR-CT, DQCSA, and 2D MAS exchange measurements (because of the larger intramolecular 13C-13C distance and because of resolvable chemical shift differences) and hence did not affect any conclusions in this study regarding the conformation of Aβ1-40 in amyloid fibrils. We emphasize that this impurity was present only in the D23,V24-Aβ1-40 sample, and that data for this sample are not the basis for our report of non-β-strand conformations in Aβ1-40 fibrils (see below).
FIGURE 1.
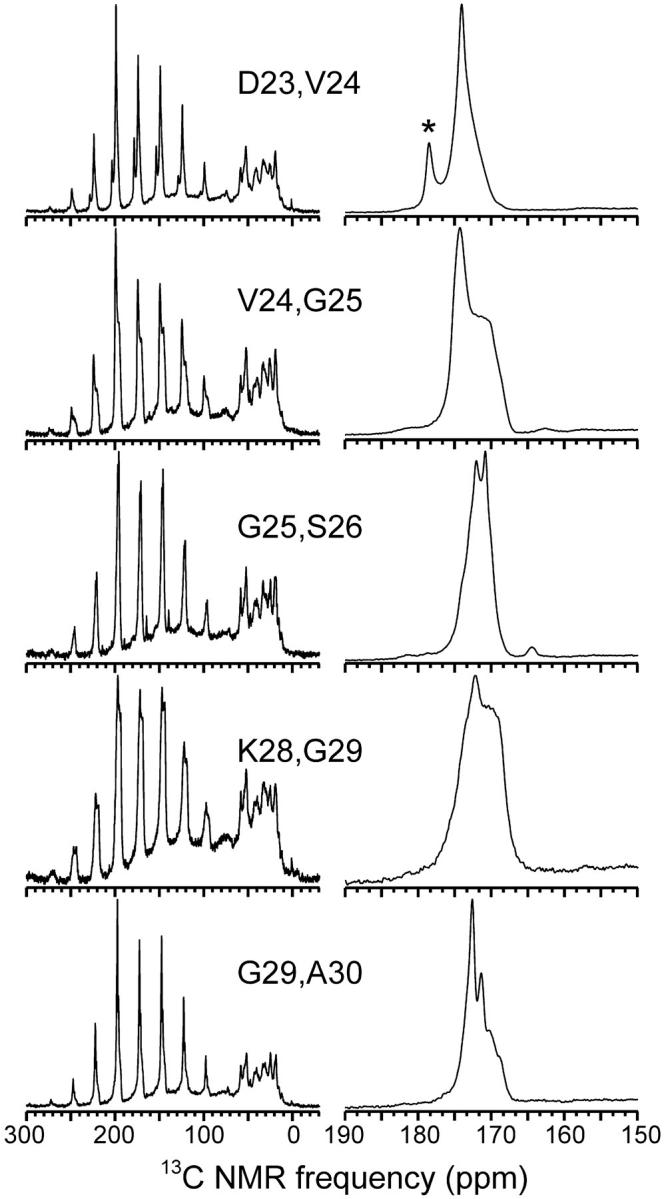
Solid-state 13C NMR spectra of Aβ1-40 fibril samples with 13C labels at the backbone carbonyl sites of the indicated residues, obtained with MAS, cross polarization from protons, and high-power proton decoupling. Spectra on the left were obtained at a 3.75-kHz MAS frequency. Strong spinning sidebands between 90 ppm and 250 ppm for the carbonyl signals indicate a rigid peptide backbone. Signals between 10 ppm and 60 ppm arise from natural-abundance aliphatic 13C nuclei. Spectra on the right, showing only the carbonyl region, were obtained at a 15-kHz MAS frequency. Asterisk in the D23,V24-Aβ1-40 spectrum indicates a labeled side-chain carboxylate signal from a β-aspartate impurity at residue 23 (see Materials and Methods).
Solid-state NMR measurements
1D 13C NMR spectra were obtained with cross-polarization, magic-angle spinning (MAS), and high-power proton decoupling, using a Varian (Palo Alto, CA) Chemagnetics Infinity spectrometer operating at a proton NMR frequency of 599.1 MHz and a homebuilt probe with a 2.5-mm Varian/Chemagnetics MAS module. Cross-polarization contact times were 1.5 ms. Decoupling fields were 120 kHz.
DQCSA and fpRFDR-CT NMR measurements were performed on Varian/Chemagnetics Infinity spectrometers operating at proton NMR frequencies of 400.6 MHz and 399.2 MHz, using Varian/Chemagnetics 3.2 mm MAS probes. DQCSA data were acquired as described by Blanco and Tycko (2001), using an MAS frequency of 5.0 kHz, DQ preparation and mixing periods of 6.4 ms, 13C π pulse lengths of 15.0 μs, and proton decoupling fields of 110 kHz during the RFDR sequence in these periods. DQ preparation and mixing periods were deliberately kept short to minimize possible effects of intermolecular couplings on the DQCSA data. The fpRFDR-CT data were acquired as described by Ishii et al. (2001), using an MAS frequency of 20.0 kHz, 13C π pulse lengths of 10.0 μs and proton decoupling fields of 110 kHz during the fpRFDR sequence, and with the parameters K = 3 and M + 2N = 96, in the notation of Ishii et al. Pulsed spin locking was used to enhance sensitivity in both fpRFDR-CT and DQCSA measurements, as described by Petkova and Tycko (2002). Two-dimensional MAS exchange measurements were performed on a Chemagnetics CMX spectrometer operating at a proton NMR frequency of 599.1 MHz, using the 2.5-mm MAS probe. Two-dimensional MAS exchange data were acquired as described by Weliky and Tycko (Tycko et al., 1996; Weliky and Tycko, 1996), using an MAS frequency of 3.78 kHz and 500-ms exchange periods. These data were processed in the manner of Hagemeyer et al. (Hagemeyer et al., 1989; Tycko and Berger, 1999). Radio-frequency pulses were actively synchronized with an MAS tachometer signal in fpRFDR-CT, DQCSA, and 2D MAS exchange measurements. Total experiment times were typically 8 h, 20 h, and 8 days for fpRFDR-CT, DQCSA, and 2D MAS exchange measurements, respectively.
NMR data analysis
DQCSA, fpRFDR-CT, and 2D MAS exchange data were analyzed by comparison with numerical simulations, performed with Fortran programs written specifically for this purpose (Tycko et al., 1996; Blanco and Tycko, 2001). Simulations of fpRFDR-CT data were carried out for a four-spin system (two carbonyl labels on two parallel chains), using an explicit evaluation of the quantum mechanical evolution operator for the full pulse sequence under MAS and including typical carbonyl CSA parameters as well as all dipole-dipole couplings. Four-spin fpRFDR-CT simulations for a full 5° grid in φ and ψ with 864 powder orientations required ∼110 h of processor time (Pentium III, 1 GHz). Six-spin simulations (three carbonyl labels on three parallel chains) were approximately six times slower and produced fpRFDR-CT curves that were not significantly different. Simulations of DQCSA and 2D MAS exchange data were carried out for a two-spin system (two carbonyl labels on one chain). DQCSA simulations also used an explicit evaluation of the evolution operator for the full pulse sequence under MAS. Two-dimensional MAS exchange simulations used numerical evaluations of integral expressions for the crosspeak intensities (Tycko et al., 1996; Tycko and Berger, 1999). Effects of intermolecular couplings on 2D MAS exchange and DQCSA data were ignored for the following reasons: 1), 2D MAS exchange data are sensitive only to the relative orientations, and not the displacements, of the labeled carbonyl groups. Crosspeaks arise only from exchange between sites with different orientations. Assuming that each peptide chain is labeled at a site A and a site B and that neighboring chains in the cross-β amyloid fibril structure are related by translational symmetry along the fibril axis, then exchange between sites A or sites B of neighboring chains generates no crosspeak intensity, whereas exchange between site A of one chain and site B of a neighboring chain generates the same crosspeak intensities as intramolecular exchange; 2), DQCSA data depend on the excitation of DQ coherences between carbonyl labels by an RFDR sequence (Gullion and Vega, 1992; Bennett et al., 1998a). The RFDR sequence only recouples two 13C sites under MAS if they have different isotropic shifts or different CSA tensor orientations. Again assuming translational symmetry, no DQ coherence can be directly excited between sites A or sites B of neighboring chains. Although DQ coherences can be excited between site A of one chain and site B of a neighboring chain, numerical four-spin simulations show that the contributions of such coherences to DQCSA signals are negligible under the conditions of our experiments.
In all simulations, a standard carbonyl 13C chemical shift anisotropy (CSA) tensor orientation was assumed, with the δ33 axis perpendicular to the carbonyl plane and the δ22 axis at 130° to the peptide C-N bond, as supported by experimental (Oas et al., 1987; Teng et al., 1992; Asakura et al., 1998) and ab initio quantum chemical (Walling et al., 1997) studies. CSA principal values were determined experimentally for each doubly labeled sample (see below).
The χ2 deviation plotted in Fig. 4 has the general form:
 |
where {Ei} are the experimental data values, {Si(φ,ψ)} are the simulated values for the given torsion angles, N is the number of values, σrms is uncertainty in the experimental data due to the root-mean-squared noise in the experimental spectra, and σsim is uncertainty in the simulations. For DQCSA and 2D MAS exchange simulations, σsim was taken to be negligible compared with σrms. For fpRFDR-CT simulations, σsim was taken to be 5% of the maximum experimental data value, reflecting the high signal-to-noise of the experimental spectra and uncertainty about effects of intermolecular couplings beyond the four spins included in these simulations. λ1(φ,ψ) is a scaling factor calculated to minimize χ2 for the given torsion angles, required because the intensity of the NMR signals is not measured on an absolute scale (Tycko et al., 1996). λ2(φ,ψ) is an offset parameter, also calculated to minimize χ2, that was included only in fpRFDR-CT analyses to account for contributions of natural-abundance 13C nuclei and residual unfibrillized Aβ1-40 to the data. Good agreement between simulations and experiments corresponds to the condition χ2 ∼ N.
FIGURE 4.
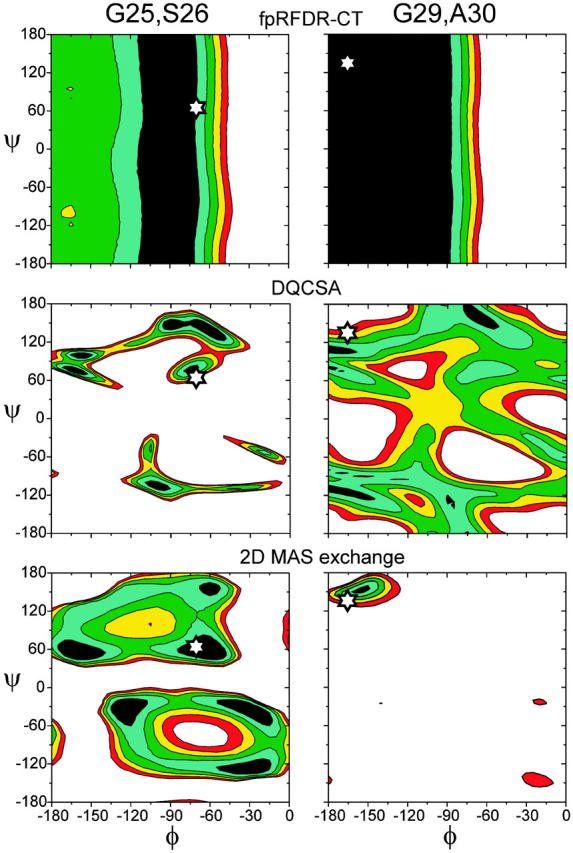
Contour plots of the χ2 deviation between experimental data and simulations for two of the doubly labeled Aβ1-40 fibril samples (see Materials and Methods for precise definition of χ2). For fpRFDR-CT measurements, dark blue regions indicate χ2 < 5, white regions indicate χ2 > 25, and contour levels increase in units of 5. For DQCSA measurements, dark blue regions indicate χ2 < 70, white regions indicate χ2 > 150, and contour levels increase in units of 20. For 2D MAS exchange measurements, dark blue regions indicate χ2 < 40, white regions indicate χ2 > 120, and contour levels increase in units of 20. White stars indicate the estimated φ and ψ values for S26 (left side) and A30 (right side), obtained from a consensus fit to the three measurements (see text).
RESULTS
One-dimensional 13C NMR spectroscopy
Fig. 1 shows 1D 13C MAS NMR spectra of the five doubly labeled Aβ1-40 fibril samples. As previously demonstrated (Antzutkin et al., 2000; Antzutkin et al., 2002; Balbach et al., 2002), nearly complete fibrillization of Aβ1-40 is indicated by the relative sharpness of the natural-abundance aliphatic 13C NMR signals (10–60 ppm spectral region), especially the pronounced splitting of the α-carbon signals into peaks at 52 ppm and 58 ppm. Two-dimensional 13C-13C exchange spectra of Aβ1-40 samples with uniformly labeled residues (Petkova et al., 2002) indicate that the peak at 58 ppm arises from the α-carbon signals of valine and isoleucine residues, which converge to this NMR frequency when β-strands form concomitantly with fibrillization.
Spectra at MAS frequency νR = 3.75 kHz (left side of Fig. 1) show the spinning sideband patterns expected for carbonyl 13C labels. CSA principal values determined from these spectra (Herzfeld and Berger, 1980) are given in Table 1. CSA principal values in Table 1 represent average values for the two labels in each sample except in the case of V24,G25-Aβ1-40, where signals from the two labels could be deconvolved to permit determination of the principal values of the individual sites. All CSA values are consistent with the absence of large-amplitude motions of the carbonyl groups, i.e., a rigid peptide backbone.
TABLE 1.
Chemical shift anisotropy parameters for 13C-labeled carbonyl carbons in Aβ1-40 fibrils, determined from analyses of spinning sideband intensities in spectra as in Fig. 1
| Sample | δ (ppm) | η |
|---|---|---|
| D23,V24-Aβ1-40 | 80.4 | 0.68 |
| V24,G25-Aβ1-40 (V24 carbonyl) | 86.9 | 0.70 |
| V24,G25-Aβ1-40 (G25 carbonyl) | 78.3 | 0.80 |
| G25,S26-Aβ1-40 | 78.4 | 0.77 |
| K28,G29-Aβ1-40 | 79.3 | 0.85 |
| G29,A30-Aβ1-40 | 79.2 | 0.75 |
Except in the case of V24,G25-Aβ1-40, values are averages for two labeled sites with unresolved 13C NMR signals.  and
and  , where δ11, δ22, and δ33 are the principal values of the chemical shift anisotropy tensor and
  Uncertainties in δ and η are approximately ±4%.
Significant variations in the carbonyl 13C lineshapes are observed (right side of Fig. 1). Due to overlap, it is not possible to extract the lineshape for each individual 13C-labeled site from these spectra. Certain sites (e.g., the A30 carbonyl) apparently have 13C NMR linewidths of ∼1.5 ppm, whereas other sites (especially the G25 and G29 carbonyls) have larger linewidths or exhibit multiple, partially resolved lines. These lineshapes appear to indicate a mixture of local structural uniformity at some sites and structural heterogeneity at other sites in the segment from D23 through A30. For comparison, carbonyl 13C NMR linewidths for V12, L17, F20, V24, L34, and V39 in Aβ1-40 fibril samples with single 13C labels have been found to be 1.3–3.0 ppm, with both F20 and L34 exhibiting two partially resolved carbonyl lines in 13C MAS spectra (Balbach et al., 2002). We associate the observation of multiple 13C NMR lines for single sites with the observation of multiple fibril morphologies in typical amyloid fibril preparations (Goldsbury et al., 2000; Jimenez et al., 2002). The degree of structural heterogeneity at the molecular level, especially the ranges of φ and ψ values, can not be determined in quantitative terms from these data.
Qualitative interpretation of structural data
As depicted in Fig. 2, 13C-labeling of two consecutive backbone carbonyl sites, at residues i-1 and i, permits the acquisition of solid-state NMR data that place constraints on the φ and ψ torsion angles of residue i. The fpRFDR-CT technique measures the 13C-13C magnetic dipole-dipole coupling, which depends on the 13C-13C distance and therefore on the φ angle. The DQCSA and 2D MAS exchange techniques measure the relative orientation of the two 13C CSA tensors, which depends on the relative orientation of the carbonyl groups and therefore on both φ and ψ. For all residues in any β-strand, the φ and ψ values are approximately −140° ± 20° and 140° ± 20°, respectively. Because of the uniformity of the φ and ψ values in a β-strand, if one prepares a series of doubly carbonyl-labeled peptide samples with 13C labels in a β-strand segment, one expects all samples in the series to yield nearly the same fpRFDR-CT, DQCSA, and 2D MAS exchange data. At a qualitative level, significant differences in these data from different samples would indicate a non-β-strand conformation.
FIGURE 2.

Illustration of the use of double carbonyl 13C labeling to determine polypeptide backbone torsion angles φ and ψ. A segment of a polyalanine chain is shown, with labeled sites in green. Directions of the principal axes of the carbonyl CSA tensors are shown. The δ33 principal axis is perpendicular to the δ11 and δ22 axes. The fpRFDR-CT solid-state NMR technique primarily measures the 13C-13C distance, which depends on φ. The DQCSA and 2D MAS exchange techniques measure the relative orientation of the two CSA tensors, which depends on both φ and ψ.
Fig. 3, a and b, present fpRFDR-CT and DQCSA data for the five doubly labeled Aβ1-40 fibril samples described above. Significant differences in the data from different samples are indeed observed, indicating that the φ and ψ values in the segment from D23 through A30 are not uniform in Aβ1-40 fibrils. In fpRFDR-CT measurements, one records the decay of the 13C NMR signal from the labeled sites with increasing dipolar dephasing time τD, due to the 13C-13C dipole-dipole couplings (Ishii et al., 2001). A more rapid decay indicates a shorter 13C-13C distance, implying a smaller value of |φ|. In Fig. 3 a, the most rapid fpRFDR-CT decay is observed for V24,G25-Aβ1-40 fibrils, whereas the slowest decays are observed for D23,V24-Aβ1-40 fibrils and G29,A30-Aβ1-40 fibrils. In DQCSA measurements, one records the decay of the double-quantum filtered 13C NMR signal with increasing CSA evolution time τCSA. The decay rate of DQCSA signals depends on φ and ψ in a complicated manner (Blanco and Tycko, 2001). According to simulations, the slowest DQCSA decays occur near φ = −60° and ψ = −65° (or φ = 60° and ψ = 65°). The most rapid decays occur near φ = ±180° or 0° and ψ = ±180° or 0°. In Fig. 3 b, the slowest DQCSA decay is observed for V24,G25-Aβ1-40 fibrils, whereas the most rapid decay is observed for G29,A30-Aβ1-40 fibrils.
FIGURE 3.
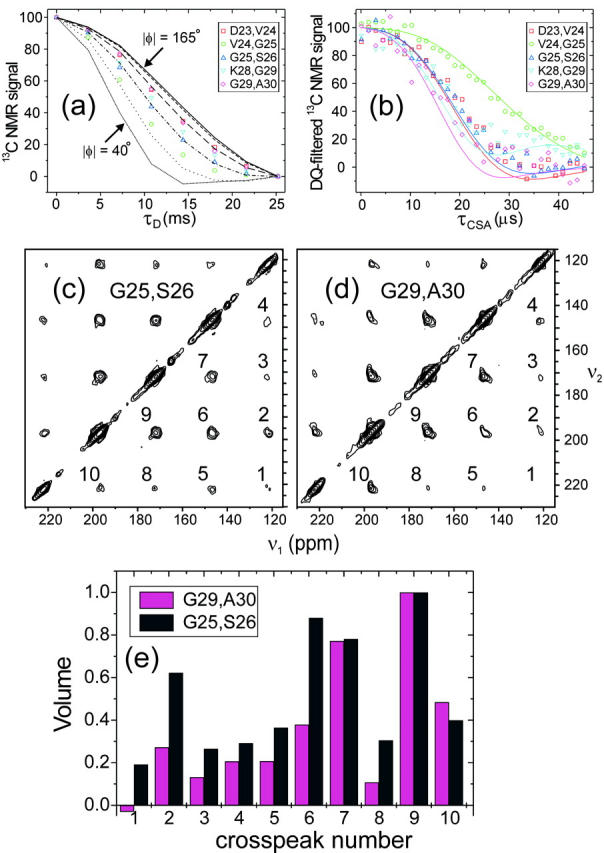
(a) Experimental fpRFDR-CT data for the five doubly labeled Aβ1-40 fibril samples. Curves are simulations for |φ| between 40° and 165°, in 25° increments. (b) Experimental DQCSA data. Color-coded curves are simulations for the φ and ψ values in Table 2. (c and d) Experimental 2D MAS exchange spectra for two of the samples, represented as contour plots with contour levels increasing by factors of 1.6. Crosspeaks connecting MAS sidebands are numbered. (e) Crosspeak volumes from the 2D MAS exchange spectra, after symmetrization, normalized to the volume of the strongest crosspeak. The significant differences among fpRFDR-CT data, DQCSA data, and 2D MAS exchange data for different samples indicate significant variations in the φ and ψ values, demonstrating the presence of non-β-strand conformations at certain sites in the segment from D23 to A30.
Fig. 3, c and d, show 2D MAS exchange spectra for the G25,S26-Aβ1-40 and G29,A30-Aβ1-40 fibril samples. In these spectra, the intensities of crosspeaks that connect spinning sideband signals of the two labeled carbonyl sites are complicated functions of both φ and ψ (Tycko et al., 1996; Tycko and Berger, 1999). Significant differences in crosspeak intensities for these two samples are apparent, with greater intensity in crosspeaks further from the diagonal in the case of G25,S26-Aβ1-40 fibrils.
Quantitative analysis of structural data
We analyze the fpRFDR-CT, DQCSA, and 2D MAS exchange data by simulating the data for all possible φ,ψ pairs (in 5° increments) and plotting the dependence of the χ2 deviation between experimental data and simulations on φ and ψ. As previously demonstrated for DQCSA and 2D MAS measurements on model peptides of known structure (Tycko et al., 1996; Weliky and Tycko, 1996; Blanco and Tycko, 2001), these simulations are sufficiently accurate that the absolute minimum value χmin2 occurs within ±10° of the correct φ and ψ values. In χ2 plots for DQCSA and 2D MAS exchange data, additional local minima χloc2 are typically observed at other φ and ψ values where the simulated data are similar to data for the correct φ and ψ values. When χmin2 ≈ χloc2, for example due to insufficient signal-to-noise in the experiments, the correct φ and ψ values can be determined by combining the results of independent techniques, which may then exhibit only a single common χ2 minimum at the correct values (Bennett et al., 1998b; Weliky et al., 1999; Balbach et al., 2000).
Representative χ2 contour plots, for G25,S26-Aβ1-40 fibrils and G29,A30-Aβ1-40 fibrils, are shown in Fig. 4. Ideally, the best-fit (i.e., minimum χ2) regions in the contour plots for fpRFDR-CT, DQCSA, and 2D MAS exchange data for a given sample would overlap in a single small area of the φ,ψ plane, which would then indicate the correct values of φ and ψ. As can be seen in Fig. 4, precise overlap of the best-fit regions for the DQCSA and 2D MAS exchange data is not observed. We attribute the absence of precise overlap to two factors: 1), Conformational heterogeneity in the non-β-strand segment of fibrillized Aβ1-40, as suggested by the relatively broad carbonyl 13C NMR lines for G25 and G29 discussed above. If a distribution of φ and ψ values were significantly populated, one would expect χmin2 for different techniques to shift in different directions, reducing or possibly eliminating the overlap; 2), Necessary approximations in the simulations, including the use of average CSA principal values for carbonyl 13C pairs with unresolved NMR signals, the assumption of a standard CSA tensor orientation for all carbonyl sites, and the neglect of intermolecular 13C-13C couplings (see Materials and Methods). Again, one would expect these approximations to produce different shifts in χmin2 for different techniques.
To extract estimates of φ and ψ from the χ2 contour plots, the following procedure was therefore adopted: 1), A range of allowed φ values was determined from the fpRFDR-CT contour plot, given by the condition χ2 < 10; 2), The χ2 minima in the DQCSA and 2D MAS exchange contour plots that lie within this φ range and were closest together in the φ,ψ plane were identified; 3), The average of the φ and ψ values at these two minima was taken as an estimate of the correct values. Estimates of φ and ψ determined with this procedure are summarized in Table 2. Backbone torsion angles for G25, S26, and G29 are found to be significantly different from β-strand values, whereas torsion angles for V24 and A30 are consistent with a β-strand conformation. These results are sensible in light of evidence from 13C NMR chemical shifts for β-strand segments formed by residues 12-24 and 30-36 (Petkova et al., 2002). Uncertainty in φ and ψ due to conformational heterogeneity, suggested by the 1D 13C NMR spectra as discussed above, cannot be determined quantitatively from the data obtained to date.
TABLE 2.
Backbone torsion angles (degrees) in Aβ1-40 fibrils, estimated from solid-state NMR data on doubly labeled samples as described in the text
| Residue | φ,ψ |
|---|---|
| V24 | −145,115 |
| G25 | −70,−40 |
| S26 | 68,−65 |
| G29 | −120,−125 |
| A30 | −165,133 |
Data are invariant to the substitution  Choice of signs here corresponds to the model in Fig. 5 a.
For reasons of symmetry (Tycko et al., 1996), fpRFDR-CT, DQCSA, and 2D MAS exchange data are invariant to the substitution  . Therefore,
  and only negative values of φ are plotted in Fig. 4. For V24 and A30, the choice of signs for φ and ψ in Table 2 is appropriate for a β-strand conformation. For G25, S26, and G29, the sign choices in Table 2 were selected after molecular modeling (see below). Solid-state NMR data in this paper do not rule out the opposite sign choices for G25, S26, and G29.
DISCUSSION
Molecular modeling
The data reported above do not permit a unique determination of the backbone structure of residues 24-30 in Aβ1-40 fibrils, both because the signs of φ and ψ are indeterminate and because these data do not constrain φ and ψ of N27 and K28. To permit visualization of the structural consequences of the non-β-strand conformations at G25, S26, and G29, Fig. 5 shows structural models for residues 20-33, assuming typical β-strand φ and ψ values for residues 20-23, 27, 28, and 31-33. 13C chemical shift data support a β-strand conformation at K28 (Petkova et al., 2002). Values for V24, G25, S26, G29, and A30 are taken from Table 2. Eight models are shown, generated with all possible sign choices for φ and ψ of G25, S26, and G29. No energy minimization or other optimization of these models was performed.
FIGURE 5.
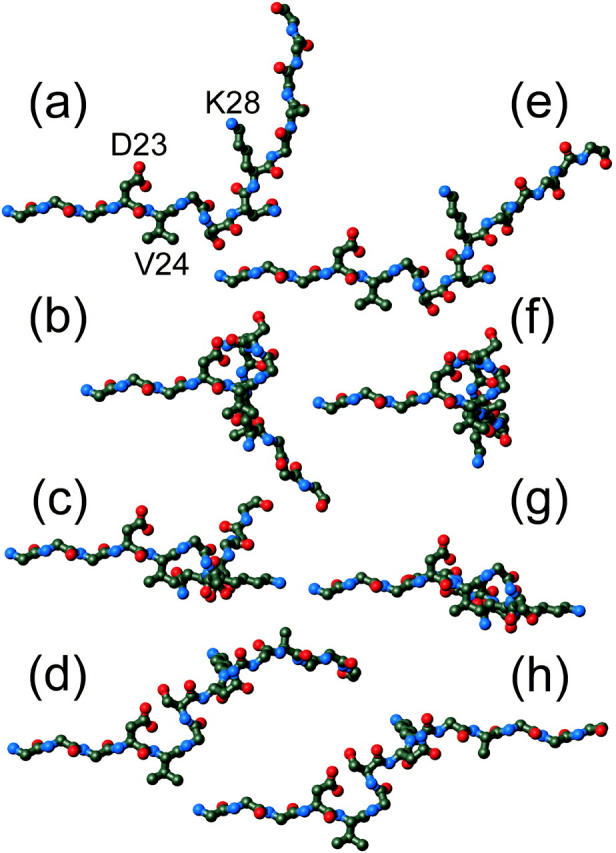
Possible conformations for residues 20-33 of Aβ1-40 in amyloid fibrils, based on the φ and ψ values for V24, G25, S26, G29, and A30 estimated from solid-state NMR measurements. Typical β-strand values (φ = −140°, ψ = 140°) are assigned to all other residues. The eight models represent all possible sign choices for φ and ψ of the non-β-strand residues G25, S26, and G29, given that the NMR data are invariant to the substitution  Only nonhydrogen atoms are shown. Side chains of residues 20–22 and 31–33 are omitted for clarity. To facilitate comparison, all models are shown with residues 20–24 at the same orientation. Side-chain conformations are not constrained by the data. (a) Conformation resulting from the values and sign choices in Table 2. (b) Sign reversal for G25. (c) Sign reversal for S26. (d) Sign reversal for G25 and S26. (e) Sign reversal for G29. (f) Sign reversal for G25 and G29. (g) Sign reversal for S26 and G29. (h) Sign reversal for G25, S26, and G29. (Figure created with MOLMOL (Koradi et al., 1996))
Although all models in Fig. 5 are equally consistent with data in this paper, they are not all consistent with constraints imposed by supramolecular structure. 13C chemical shift data have established that the segments flanking residues 24-30 form β-strands in Aβ1-40 fibrils (Petkova et al., 2002). Multiple quantum 13C NMR (Antzutkin et al., 2000) and 13C-13C dipolar recoupling data (Balbach et al., 2002) have established that these two β-strands form separate parallel β-sheets through intermolecular hydrogen bonding. To be compatible with a cross-β fibril structure, the two β-strands must be aligned so that all intermolecular hydrogen bonds are nearly parallel to a single axis (namely, the long axis of the fibril). Thus, all backbone carbonyl C-O bonds and amide N-H bonds in the β-strands must be nearly parallel to one another. Only the models in Fig. 5, a and h, satisfy this requirement. Of these two, only the model in Fig. 5 a produces the net bend in the direction of the peptide backbone required by the experimentally observed diameters of Aβ1-40 fibrils (see Introduction). For these reasons, the conformation in Fig. 5 a was used as a starting point for the recent development of a full structural model for Aβ1-40 fibrils by constrained energy minimization (Petkova et al., 2002). In addition, the backbone conformation in Fig. 5 a permits close contacts between the side-chain carboxylate and amino groups of D23 and K28, as supported by experimental measurements of 15N-13C dipole-dipole couplings that indicate internuclear distances on the order of 0.4 nm for these groups (Petkova et al., 2002).
Comparison with earlier structural models
Several models for full-length Aβ fibrils have included a β-hairpin with a turn in residues 25-28 (George and Howlett, 1999; Li et al., 1999) or 24-27 (Lazo and Downing, 1998). A true β-hairpin requires intramolecular hydrogen bonding between β-strands that flank the turn. However, 13C-13C dipolar recoupling data indicate intermolecular distances of 0.48 ± 0.05 nm (as required by intermolecular hydrogen bonding) between carbonyl or β-carbon sites of V12, L17, F20, A21, V24, A30, L34, and V39 in Aβ1-40 fibrils (Balbach et al., 2002). Multiple quantum 13C NMR data have shown that the β-carbons of both A21 and A30 must form groups of at least four with interatomic distances of ∼0.5 nm (Antzutkin et al., 2000). These data rule out a true β-hairpin with intramolecular hydrogen bonding. Thus, we believe that the non-β-strand conformations in residues 24-30 simply create a bend or hinge between two separate parallel β-sheets in Aβ1-40 fibrils (Petkova et al., 2002), reminiscent of the bends between β-strands in β-helical proteins (Yoder et al., 1993; Emsley et al., 1996) (although our data do not imply that Aβ fibrils necessarily have the β-helical structure suggested for amyloid fibrils by other groups (Lazo and Downing, 1998; Perutz et al., 2002; Wille et al., 2002)). A similar structural role for these residues occurs in Aβ fibril models proposed by Tjernberg et al. (1999) and by Ma and Nussinov (2002).
Concluding remarks
One might expect the presence of a non-β-strand segment in the middle of the Aβ1-40 sequence to have implications for the effects of amino acid substitutions on fibril structure or stability. Although a number of mutagenesis studies have been reported, most of these deal with effects of substitutions outside the region addressed by our measurements (Fraser et al., 1992; Hilbich et al., 1992; Pike et al., 1995; Esler et al., 1996; Murakami et al., 2002) or with amyloid fibrils formed by Aβ fragments that may not be representative of the full-length peptide (Kirschner et al., 1987; Fraser et al., 1994; Wood et al., 1995). A recent study by Morimoto et al. (2002) has shown that substitutions of proline at residues 24 and 26 in Aβ1-42 suppress aggregation and fibrillization, consistent with the fact that proline cannot adopt the φ and ψ angles given for V24 and S26 in Table 2. Mutations associated with familial Alzheimer's disease, including A21G, E22Q, E22K, E22G, and D23N, occur near the non-β-strand segment identified by our measurements. It is not yet clear whether kinetic, structural, thermodynamic, or purely biological factors lead to the association of these mutations with genetic predisposition to Alzheimer's disease.
Finally, the solid-state NMR data reported above demonstrate in a quantitative and site-specific manner that amyloid fibrils have structural complexity at the molecular level beyond the simple requirement of a cross-β motif. Determination of the full molecular structures of amyloid fibrils entirely from experimental data remains an important and difficult challenge. Nonetheless, we believe that this challenge can be met through a combination of solid-state NMR measurements that probe supramolecular organization, identify β-strand segments, characterize the conformation of non-β-strand segments, and establish intermolecular and intramolecular contacts, with assistance from EM and other physical techniques.
Acknowledgments
We thank Dr. Lewis K. Pannell for mass spectrometric analysis of peptide samples. We thank Dr. Andrey Kajava for suggesting the possibility of non-β-strand conformations in residues 23-29 of Aβ1-40 based on analogy with β-helical proteins. Numerical simulations of solid-state NMR experiments were performed on the Silicon Graphics Origin 2000 computers of the National Institutes of Health Center for Information Technology.
ONA acknowledges support from the Swedish Foundation for International Cooperation in Research and Higher Education and from the Swedish Natural Science Research Council. Development of solid-state NMR methodology used in this work was supported in part by a grant to RT from the National Institutes of Health Intramural AIDS Targeted Antiviral Program.
References
- Antzutkin, O. N., J. J. Balbach, R. D. Leapman, N. W. Rizzo, J. Reed, and R. Tycko. 2000. Multiple quantum solid-state NMR indicates a parallel, not antiparallel, organization of β-sheets in Alzheimer's β-amyloid fibrils. Proc. Natl. Acad. Sci. USA. 97:13045–13050. [DOI] [PMC free article] [PubMed] [Google Scholar]
- Antzutkin, O. N., R. D. Leapman, J. J. Balbach, and R. Tycko. 2002. Supramolecular structural constraints on Alzheimer's β-amyloid fibrils from electron microscopy and solid state nuclear magnetic resonance. Biochemistry. 41:15436–15450. [DOI] [PubMed] [Google Scholar]
- Asakura, T., Y. Yamazaki, K. W. Seng, and M. Demura. 1998. Determination of the mutual orientation of the 15N and 13C NMR chemical shift tensors of 13C-15N double labeled model peptides for silk fibroin from the dipolar-coupled powder patterns. J. Mol. Struct. 446:179–190. [Google Scholar]
- Balbach, J. J., Y. Ishii, O. N. Antzutkin, R. D. Leapman, N. W. Rizzo, F. Dyda, J. Reed, and R. Tycko. 2000. Amyloid fibril formation by Aβ16–22, a seven-residue fragment of the Alzheimer's β-amyloid peptide, and structural characterization by solid state NMR. Biochemistry. 39:13748–13759. [DOI] [PubMed] [Google Scholar]
- Balbach, J. J., A. T. Petkova, N. A. Oyler, O. N. Antzutkin, D. G. Gordon, S. C. Meredith, and R. Tycko. 2002. Supramolecular structure in full-length Alzheimer's β-amyloid fibrils: evidence for a parallel β-sheet organization from solid state NMR. Biophys. J. 83:1205–1216. [DOI] [PMC free article] [PubMed] [Google Scholar]
- Bennett, A. E., C. M. Rienstra, J. M. Griffiths, W. G. Zhen, P. T. Lansbury, and R. G. Griffin. 1998a. Homonuclear radio frequency-driven recoupling in rotating solids. J. Chem. Phys. 108:9463–9479. [Google Scholar]
- Bennett, A. E., D. P. Weliky, and R. Tycko. 1998b. Quantitative conformational measurements in solid state NMR by constant-time homonuclear dipolar recoupling. J. Am. Chem. Soc. 120:4897–4898. [Google Scholar]
- Benzinger, T. L. S., D. M. Gregory, T. S. Burkoth, H. Miller-Auer, D. G. Lynn, R. E. Botto, and S. C. Meredith. 1998. Propagating structure of Alzheimer's β-amyloid(10–35) is parallel β-sheet with residues in exact register. Proc. Natl. Acad. Sci. USA. 95:13407–13412. [DOI] [PMC free article] [PubMed] [Google Scholar]
- Benzinger, T. L. S., D. M. Gregory, T. S. Burkoth, H. Miller-Auer, D. G. Lynn, R. E. Botto, and S. C. Meredith. 2000. Two-dimensional structure of β-amyloid(10–35) fibrils. Biochemistry. 39:3491–3499. [DOI] [PubMed] [Google Scholar]
- Blanco, F. J., S. Hess, L. K. Pannell, N. W. Rizzo, and R. Tycko. 2001. Solid state NMR data support a helix-loop-helix structural model for the N-terminal half of HIV-1 Rev in fibrillar form. J. Mol. Biol. 313:845–859. [DOI] [PubMed] [Google Scholar]
- Blanco, F. J., and R. Tycko. 2001. Determination of polypeptide backbone dihedral angles in solid state NMR by double quantum 13C chemical shift anisotropy measurements. J. Magn. Reson. 149:131–138. [Google Scholar]
- Burkoth, T. S., T. L. S. Benzinger, V. Urban, D. M. Morgan, D. M. Gregory, P. Thiyagarajan, R. E. Botto, S. C. Meredith, and D. G. Lynn. 2000. Structure of the β-amyloid(10–35) fibril. J. Am. Chem. Soc. 122:7883–7889. [Google Scholar]
- Chiti, F., P. Webster, N. Taddei, A. Clark, M. Stefani, G. Ramponi, and C. M. Dobson. 1999. Designing conditions for in vitro formation of amyloid protofilaments and fibrils. Proc. Natl. Acad. Sci. USA. 96:3590–3594. [DOI] [PMC free article] [PubMed] [Google Scholar]
- Emsley, P., I. G. Charles, N. F. Fairweather, and N. W. Isaacs. 1996. Structure of Bordetella pertussis virulence factor P.69 pertactin. Nature. 381:90–92. [DOI] [PubMed] [Google Scholar]
- Esler, W. P., E. R. Stimson, J. R. Ghilardi, Y. A. Lu, A. M. Felix, H. V. Vinters, P. W. Mantyh, J. P. Lee, and J. E. Maggio. 1996. Point substitution in the central hydrophobic cluster of a human β-amyloid congener disrupts peptide folding and abolishes plaque competence. Biochemistry. 35:13914–13921. [DOI] [PubMed] [Google Scholar]
- Fraser, P. E., D. R. McLachlan, W. K. Surewicz, C. A. Mizzen, A. D. Snow, J. T. Nguyen, and D. A. Kirschner. 1994. Conformation and Fibrillogenesis of Alzheimer Aβ peptides with selected substitution of charged residues. J. Mol. Biol. 244:64–73. [DOI] [PubMed] [Google Scholar]
- Fraser, P. E., J. T. Nguyen, H. Inouye, W. K. Surewicz, D. J. Selkoe, M. B. Podlisny, and D. A. Kirschner. 1992. Fibril formation by primate, rodent, and Dutch-hemorrhagic analogs of Alzheimer amyloid β-protein. Biochemistry. 31:10716–10723. [DOI] [PubMed] [Google Scholar]
- George, A. R., and D. R. Howlett. 1999. Computationally derived structural models of the β-amyloid found in Alzheimer's disease plaques and the interaction with possible aggregation inhibitors. Biopolymers. 50:733–741. [DOI] [PubMed] [Google Scholar]
- Goldsbury, C. S., S. Wirtz, S. A. Muller, S. Sunderji, P. Wicki, U. Aebi, and P. Frey. 2000. Studies on the in vitro assembly of Aβ1–40: Implications for the search for Aβ fibril formation inhibitors. J. Struct. Biol. 130:217–231. [DOI] [PubMed] [Google Scholar]
- Gregory, D. M., T. L. S. Benzinger, T. S. Burkoth, H. Miller-Auer, D. G. Lynn, S. C. Meredith, and R. E. Botto. 1998. Dipolar recoupling NMR of biomolecular self-assemblies: determining inter- and intrastrand distances in fibrilized Alzheimer's β-amyloid peptide. Solid State Nucl. Magn. Reson. 13:149–166. [DOI] [PubMed] [Google Scholar]
- Gullion, T., and S. Vega. 1992. A simple magic angle spinning NMR experiment for the dephasing of rotational echoes of dipolar coupled homonuclear spin pairs. Chem. Phys. Lett. 194:423–428. [Google Scholar]
- Hagemeyer, A., K. Schmidt-Rohr, and H. W. Spiess. 1989. Two-dimensional nuclear magnetic resonance experiments for studying molecular order and dynamics in static and rotating solids. In Advances in Magnetic Resonance. W. S. Warren, editor. Academic Press, San Diego. 85–130.
- Herzfeld, J., and A. E. Berger. 1980. Sideband intensities in NMR spectra of samples spinning at the magic angle. J. Chem. Phys. 73:6021–6030. [Google Scholar]
- Hilbich, C., B. Kisterswoike, J. Reed, C. L. Masters, and K. Beyreuther. 1991. Aggregation and secondary structure of synthetic amyloid βA4 peptides of Alzheimer's disease. J. Mol. Biol. 218:149–163. [DOI] [PubMed] [Google Scholar]
- Hilbich, C., B. Kisterswoike, J. Reed, C. L. Masters, and K. Beyreuther. 1992. Substitutions of hydrophobic amino acids reduce the amyloidogenicity of Alzheimer's disease βA4 peptides. J. Mol. Biol. 228:460–473. [DOI] [PubMed] [Google Scholar]
- Inouye, H., P. E. Fraser, and D. A. Kirschner. 1993. Structure of β-crystallite assemblies formed by Alzheimer β-amyloid protein analogs: analysis by x-ray diffraction. Biophys. J. 64:502–519. [DOI] [PMC free article] [PubMed] [Google Scholar]
- Ishii, Y. 2001. 13C-13C dipolar recoupling under very fast magic angle spinning in solid-state nuclear magnetic resonance: applications to distance measurements, spectral assignments, and high-throughput secondary-structure determination. J. Chem. Phys. 114:8473–8483. [Google Scholar]
- Ishii, Y., J. J. Balbach, and R. Tycko. 2001. Measurement of dipole-coupled lineshapes in a many-spin system by constant-time two-dimensional solid state NMR with high-speed magic-angle spinning. Chem. Phys. 266:231–236. [Google Scholar]
- Jimenez, J. L., E. J. Nettleton, M. Bouchard, C. V. Robinson, C. M. Dobson, and H. R. Saibil. 2002. The protofilament structure of insulin amyloid fibrils. Proc. Natl. Acad. Sci. USA. 99:9196–9201. [DOI] [PMC free article] [PubMed] [Google Scholar]
- Kheterpal, I., A. Williams, C. Murphy, B. Bledsoe, and R. Wetzel. 2001. Structural features of the Aβ amyloid fibril elucidated by limited proteolysis. Biochemistry. 40:11757–11767. [DOI] [PubMed] [Google Scholar]
- Kirschner, D. A., H. Inouye, L. K. Duffy, A. Sinclair, M. Lind, and D. J. Selkoe. 1987. Synthetic peptide homologous to β-protein from Alzheimer's disease forms amyloid-like fibrils In vitro. Proc. Natl. Acad. Sci. USA. 84:6953–6957. [DOI] [PMC free article] [PubMed] [Google Scholar]
- Koradi, R., M. Billeter, and K. Wuthrich. 1996. MOLMOL: a program for display and analysis of macromolecular structures. J. Mol. Graph. 14:51–55. [DOI] [PubMed] [Google Scholar]
- Lansbury, P. T., P. R. Costa, J. M. Griffiths, E. J. Simon, M. Auger, K. J. Halverson, D. A. Kocisko, Z. S. Hendsch, T. T. Ashburn, R. G. S. Spencer, B. Tidor, and R. G. Griffin. 1995. Structural model for the β-amyloid fibril based on interstrand alignment of an antiparallel-sheet comprising a C-terminal peptide. Nat. Struct. Biol. 2:990–998. [DOI] [PubMed] [Google Scholar]
- Laws, D. D., H. M. L. Bitter, K. Liu, H. L. Ball, K. Kaneko, H. Wille, F. E. Cohen, S. B. Prusiner, A. Pines, and D. E. Wemmer. 2001. Solid-state NMR studies of the secondary structure of a mutant prion protein fragment of 55 residues that induces neurodegeneration. Proc. Natl. Acad. Sci. USA. 98:11686–11690. [DOI] [PMC free article] [PubMed] [Google Scholar]
- Lazo, N. D., and D. T. Downing. 1998. Amyloid fibrils may be assembled from β-helical protofibrils. Biochemistry. 37:1731–1735. [DOI] [PubMed] [Google Scholar]
- Li, L. P., T. A. Darden, L. Bartolotti, D. Kominos, and L. G. Pedersen. 1999. An atomic model for the pleated β-sheet structure of Aβ amyloid protofilaments. Biophys. J. 76:2871–2878. [DOI] [PMC free article] [PubMed] [Google Scholar]
- Long, H. W., and R. Tycko. 1998. Biopolymer conformational distributions from solid-state NMR: α-helix and 310-helix contents of a helical peptide. J. Am. Chem. Soc. 120:7039–7048. [Google Scholar]
- Ma, B. Y., and R. Nussinov. 2002. Stabilities and conformations of Alzheimer's β-amyloid peptide oligomers (Aβ16–22, Aβ16–35, and Aβ10–35): sequence effects. Proc. Natl. Acad. Sci. USA. 99:14126–14131. [DOI] [PMC free article] [PubMed] [Google Scholar]
- MacPhee, C. E., and C. M. Dobson. 2000. Formation of mixed fibrils demonstrates the generic nature and potential utility of amyloid nanostructures. J. Am. Chem. Soc. 122:12707–12713. [Google Scholar]
- Morimoto, A., K. Irie, K. Murakami, H. Ohigashi, M. Shindo, M. Nagao, T. Shimizu, and T. Shirasawa. 2002. Aggregation and neurotoxicity of mutant amyloid β (Aβ) peptides with proline replacement: importance of turn formation at positions 22 and 23. Biochem. Biophys. Res. Commun. 295:306–311. [DOI] [PubMed] [Google Scholar]
- Murakami, K., K. Irie, A. Morimoto, H. Ohigashi, M. Shindo, M. Nagao, T. Shimizu, and T. Shirasawa. 2002. Synthesis, aggregation, neurotoxicity, and secondary structure of various Aβ1–42 mutants of familial Alzheimer's disease at positions 21–23. Biochem. Biophys. Res. Commun. 294:5–10. [DOI] [PubMed] [Google Scholar]
- Oas, T. G., C. J. Hartzell, T. J. McMahon, G. P. Drobny, and F. W. Dahlquist. 1987. The carbonyl 13C chemical shift tensors of five peptides determined from 15N dipole-coupled chemical shift powder patterns. J. Am. Chem. Soc. 109:5956–5962. [Google Scholar]
- Perutz, M. F., J. T. Finch, J. Berriman, and A. Lesk. 2002. Amyloid fibers are water-filled nanotubes. Proc. Natl. Acad. Sci. USA. 99:5591–5595. [DOI] [PMC free article] [PubMed] [Google Scholar]
- Petkova, A. T., Y. Ishii, J. J. Balbach, O. N. Antzutkin, R. D. Leapman, F. Delaglio, and R. Tycko. 2002. A structural model for Alzheimer's β-amyloid fibrils based on experimental constraints from solid state NMR. Proc. Natl. Acad. Sci. USA. 99:16742–16747. [DOI] [PMC free article] [PubMed] [Google Scholar]
- Petkova, A. T., and R. Tycko. 2002. Sensitivity enhancement in structural measurements by solid state NMR through pulsed spin locking. J. Magn. Reson. 155:293–299. [DOI] [PubMed] [Google Scholar]
- Pike, C. J., A. J. Walencewicz-Wasserman, J. Kosmoski, D. H. Cribbs, C. G. Glabe, and C. W. Cotman. 1995. Structure-activity analyses of β-amyloid peptides: contributions of the β25–35 region to aggregation and neurotoxicity. J. Neurochem. 64:253–265. [DOI] [PubMed] [Google Scholar]
- Roher, A. E., J. D. Lowenson, S. Clarke, C. Wolkow, R. Wang, R. J. Cotter, I. M. Reardon, H. A. Zurcherneely, R. L. Heinrikson, M. J. Ball, and B. D. Greenberg. 1993. Structural alterations in the peptide backbone of β-amyloid core protein may account for its deposition and stability in Alzheimer's Disease. J. Biol. Chem. 268:3072–3083. [PubMed]
- Saido, T. C., W. Yamao-Harigaya, T. Iwatsubo, and S. Kawashima. 1996. Amino- and carboxyl-terminal heterogeneity of β-amyloid peptides deposited in human brain. Neurosci. Lett. 215:173–176. [DOI] [PubMed] [Google Scholar]
- Serpell, L. C., and J. M. Smith. 2000. Direct visualisation of the β-sheet structure of synthetic Alzheimer's amyloid. J. Mol. Biol. 299:225–231. [DOI] [PubMed] [Google Scholar]
- Sipe, J. D. 1992. Amyloidosis. Annu. Rev. Biochem. 61:947–975. [DOI] [PubMed] [Google Scholar]
- Sunde, M., and C. C. F. Blake. 1998. From the globular to the fibrous state: protein structure and structural conversion in amyloid formation. Q. Rev. Biophys. 31:1–39. [DOI] [PubMed] [Google Scholar]
- Sunde, M., L. C. Serpell, M. Bartlam, P. E. Fraser, M. B. Pepys, and C. C. F. Blake. 1997. Common core structure of amyloid fibrils by synchrotron x-ray diffraction. J. Mol. Biol. 273:729–739. [DOI] [PubMed] [Google Scholar]
- Teng, Q., M. Iqbal, and T. A. Cross. 1992. Determination of the 13C chemical-shift and 14N electric field gradient tensor orientations with respect to the molecular frame in a polypeptide. J. Am. Chem. Soc. 114:5312–5321. [Google Scholar]
- Tjernberg, L. O., D. J. E. Callaway, A. Tjernberg, S. Hahne, C. Lilliehook, L. Terenius, J. Thyberg, and C. Nordstedt. 1999. A molecular model of Alzheimer amyloid β-peptide fibril formation. J. Biol. Chem. 274:12619–12625. [DOI] [PubMed] [Google Scholar]
- Tycko, R., and A. E. Berger. 1999. Dual processing of two-dimensional exchange data in magic angle spinning NMR of solids. J. Magn. Reson. 141:141–147. [DOI] [PubMed] [Google Scholar]
- Tycko, R., D. P. Weliky, and A. E. Berger. 1996. Investigation of molecular structure in solids by two-dimensional NMR exchange spectroscopy with magic angle spinning. J. Chem. Phys. 105:7915–7930. [Google Scholar]
- Walling, A. E., R. E. Pargas, and A. C. de Dios. 1997. Chemical shift tensors in peptides: a quantum mechanical study. J. Phys. Chem. A. 101:7299–7303. [Google Scholar]
- Weliky, D. P., A. E. Bennett, A. Zvi, J. Anglister, P. J. Steinbach, and R. Tycko. 1999. Solid state NMR evidence for an antibody-dependent conformation of the V3 loop of HIV-1 gp120. Nat. Struct. Biol. 6:141–145. [DOI] [PubMed] [Google Scholar]
- Weliky, D. P., and R. Tycko. 1996. Determination of peptide conformations by two-dimensional magic angle spinning NMR exchange spectroscopy with rotor synchronization. J. Am. Chem. Soc. 118:8487–8488. [Google Scholar]
- Wille, H., M. D. Michelitsch, V. Guenebaut, S. Supattapone, A. Serban, F. E. Cohen, D. A. Agard, and S. B. Prusiner. 2002. Structural studies of the scrapie prion protein by electron crystallography. Proc. Natl. Acad. Sci. USA. 99:3563–3568. [DOI] [PMC free article] [PubMed] [Google Scholar]
- Wood, S. J., R. Wetzel, J. D. Martin, and M. R. Hurle. 1995. Prolines and amyloidogenicity in fragments of the Alzheimers peptide β/A4. Biochemistry. 34:724–730. [DOI] [PubMed] [Google Scholar]
- Yoder, M. D., N. T. Keen, and F. Jurnak. 1993. New domain motif: the structure of pectate lyase-C, a secreted plant virulence factor. Science. 260:1503–1507. [DOI] [PubMed] [Google Scholar]