

Abstract
We consider an age-maturity structured model arising from a blood cell proliferation problem. This model is “hybrid”, i.e., continuous in time and age but the maturity variable is discrete. This is due to the fact that we include the cell division marker carboxyfluorescein diacetate succinimidyl ester. We use our mathematical analysis in conjunction with experimental data taken from the division analysis of primitive murine bone marrow cells to characterize the maturation/proliferation process. Cell cycle parameters such as proliferative rate β, cell cycle duration τ, apoptosis rate γ, and loss rate μ can be evaluated from CarboxyFluorescein diacetate Succinimidyl Ester + cell tracking experiments. Our results indicate that after three days in vitro, primitive murine bone marrow cells have parameters β = 2.2 day−1, τ = 0.3 day, γ = 0.3 day−1, and μ = 0.05 day−1.
INTRODUCTION
The problem of trying to determine the connection between cellular proliferation and maturation in vitro and in vivo has intrigued cell biologists for decades. An obvious method of dealing with this is to use a biological marker that is incorporated into the cell and partitioned between daughter cells on division. Thus, one of the most common post-World War II techniques for studying cell division in vitro and in vivo was to use tritiated thymidine (3H-Tdr) that is incorporated in the DNA of dividing cells. Mathematical analyses of data from 3H-Tdr labeling have been carried out by Takahashi (1966) and Lebowitz and Rubinow (1969). Unfortunately, this approach cannot easily give an indication of the total amount of the division history of individual cells. Furthermore, it is known that 3H-Tdr can induce apoptosis (Yanokur et al., 2000), and thus the use of this marker may significantly perturb the experimental preparation.
Similarly, the diMethylthiaxol (MTT) reduction assay is able to quantify proliferation at a gross level, but has the complication of being sensitive to the activation state of cells (Mosmann, 1983). Bromodeoxyuridine (BrdU or BrdUrd) has been extensively used to quantify in vitro and in vivo cell division, (Bertuzzi et al., 2002; Forster et al., 1989; Gratzner, 1982; Houck and Loken, 1985; Bonhoeffer et al., 2000). However, this method is generally unable to distinguish the progeny of cells that have undergone several divisions from those that have undergone a single division.
Recently a new marker, the Carboxyfluorescein diacetate Succinimidyl Ester (CFSE), has made its appearance as an intracellular fluorescent label for lymphocytes. CFSE labels both resting and proliferating cells and divides equally between daughter cells upon cytokinesis in vitro as well as in vivo (Hodgkin et al., 1996; Lyons and Parish, 1994). CFSE shows remarkable fidelity in the distribution of label between daughter cells during division (Fazekas de St. Groth et al., 1999; Fulcher and Wong, 1999; Hasbold et al., 1998, 1999; Hasbold and Hodgkin, 2000; Lyons and Parish, 1994; Lyons, 1999; Mintern et al., 1999; Nordon et al., 1999; Parish, 1999; Sheehy et al., 2001;Warren, 1999). Moreover, changes in cell surface phenotype associated with differentiation are unaffected by CFSE labeling indicating that the relationship between cell division cycle number and differentiation can be determined. The main problem with using CFSE to track cellular division is that its fluorescence can only be detected up to and through seven or eight divisions due to label dilution (Oostendorp et al., 2000). Despite this defect, CFSE is of great interest as a tool for tracking cell proliferation and differentiation.
In this article we develop techniques to analyze CFSE + cell tracking data to obtain information about cell kinetics. We do this within the context of an extension of the G0 model of the cell cycle originally developed by Burns and Tannock (1970), which is equivalent to the model of Smith and Martin (1973). The cells in the population we consider are capable of both simultaneous proliferation and maturation (Mackey and Dörmer, 1982) where the cell maturity is related to the level of CFSE fluorescence. As illustrated in Fig. 1, these cells can be located in two different functional states. The cells can either be actively proliferating or in a resting G0 phase. Consequently, our model is structured with respect to both cellular age and maturity. The main difference between this and previous time-age-maturity models (Adimy and Pujo-Menjouet, 2001; Dyson et al., 1996; Mackey and Dörmer, 1982; Mackey and Rudnicki, 1994, 1999; Pujo-Menjouet and Rudnicki, 2000) and Dyson and co-workers (unpublished results, 2003) is that our model is hybrid in the sense that the age variable is continuous but the maturity variable represented by the number of cell divisions tracked through the CFSE fluorescence level is discrete.
FIGURE 1.

A schematic representation of the G0 stem cell model. Proliferating phase cells include those cells in G1 (the first gap), S (DNA synthesis), G2 (the second gap), and M (mitosis) while the resting phase cells are in the G0 phase. μ is the loss rate of resting phase (G0 cells due to death or differentiation, while γ represents a loss of proliferating phase cells due to apoptosis. β is the rate of cell reentry from G0 into the proliferative phase, and τ is the duration of the proliferative phase (see Burns and Tannock, 1970; Mackey, 1978, 1979a,b, 1997, for further details).
DESCRIPTION OF THE MODEL
We consider a population of cells that can both divide and mature and we follow a cell cohort during successive divisions. Our model is then naturally described by an age-maturity structured model not too dissimilar from those considered by others (Crabb et al., 1996a,b; Dyson et al., 1998, 2000a,b; Henry, 1976; Keyfitz, 1968; Mackey and Dörmer, 1982; Pujo-Menjouet, 2001). The novel part of the model presented here is related to the fact that the cellular population is continuously structured with respect to age, but the maturity variable (represented by the CFSE fluorescence) is discrete. A word of caution is in order here concerning the relation between division number and maturity. We suppose that at each division, cells reach a certain level of maturity where the maturity represents the concentration of what composes a cell such as proteins or other elements one can measure experimentally like the phenotypic under morphotypic or biochemical processes. A given cell population labeled at time t = 0 might initially contain cells with different maturity levels, and therefore the number of divisions that a cell underwent cannot be related to any particular maturity traits. Nevertheless, the term “maturity” is used to denote the number of divisions to keep the mathematical modeling carried out here within a general age-maturity structured model framework.
The proliferating phase cells are those in the cycle that are committed to DNA replication and cytokinesis (cell division) with the production of two daughter cells. The position of a cell in the proliferating phase is given by an age a which is assumed to range from a = 0 (the point of commitment through entry into the G0 phase) to a = τ (the point of cytokinesis). The cells in this phase may also be lost randomly due to apoptosis at a constant rate γ ≥ 0. Immediately after cytokinesis, both daughter cells are assumed to enter the resting G0 phase. The age in this population ranges from a = 0, when cells enter, to a = +∞. We consider two sources of loss in this G0 phase:
The first loss is random at a rate μ ≥ 0;
The second loss is the reintroduction of the cell into the proliferating phase with a rate β ≥ 0.
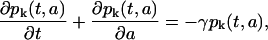
Let pk(t,a) be the density of the proliferating phase cell population and nk(t,a) be the density of the resting (G0) phase cells, where t is time, a is cellular age, and k represents the kth generation of a cell (after k divisions). Note that k is directly related to the average CFSE fluorescence per cell. Indeed, if we denote M the initial average CFSE fluorescence per cell, M/2 is the average fluorescence of the daughter cells after the first division and M/2k the fluorescence after kth divisions. The equations describing the model are, then,
 |
(1) |
 |
(2) |
Each of these equations is a conservation equation stating that the total rate of change of either the proliferative or resting phase cells at a given maturation level k is equal to the rate of cellular loss from the respective compartment.
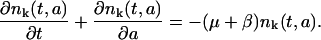
To reflect the biology of cellular division we take the boundary conditions to be
 |
(3) |
The first of these boundary conditions simply says that the flux of cells into the proliferative phase at age a = 0 in the kth generation is equal to the flux out of the resting phase due to the reentry rate β in the same generation. The second condition says that the flux of cells into the resting phase of the cell cycle at the kth generation is twice the flux of cells of the previous ((k − 1)th, the mother cell) generation out of the proliferative phase and into cytokinesis (at age a = τ).
Finally, we will consider as initial conditions a mixture of cells in the resting and proliferating phases. These initial conditions represent the distribution of age a of the cells at time t = 0, the moment where the CFSE + cells are isolated after having been CFSE-labeled (see Oostendorp et al., 2000, their Fig. 1). We need to give the initial distribution of cells in the proliferative and the resting phase, i.e., p0(0,a) and n0(0,a). From the formulation of the problem, the solution of the model defined by Eqs. 1 and 2 does not depend explicitly on n0(0,a) because only the total quantity of resting cells is required in the boundary conditions (Eq. 3). Note that the total resting cell number Nk(t) can be described by an ordinary differential equation, and the age structure is not strictly necessary as long as β and μ are age-independent. We can therefore take any arbitrary initial distribution for the resting G0 phase.
On the other hand, the solution of Eqs. 1 and 2 does depend on the initial distribution of the proliferating cells, because older cells are obviously more advanced in the cell cycle and will reenter the resting phase sooner than the younger ones. However, to be able to compute the model solutions explicitly, we have decided, with some loss of generality, to take the initial distribution in both compartments as shown below. This simplification will be of course more visible within the first few generations. In the Appendix, a generalization for any arbitrary initial condition is shown, but then the solution is not as tractable.
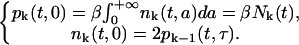
For clarity, we will divide the initial conditions into two parts: initial condition I (ICI) and initial condition II (ICII). ICI is the initial condition when all the cells at time 0 are in proliferative phase and ICII is the initial condition when all cells are in resting phase. As solutions with either IC are particular solutions of Eqs. 1 and 2, we can take any linear combination of these solutions to get a solution of the full model for any arbitrary initial condition.
The initial condition ICI is
 |
(4) |
The initial condition ICII is
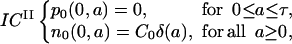 |
(5) |
In the initial conditions (Eqs. 4 and 5), C0 represents the initial number of cells. The function δ(a) is the standard Dirac delta function which represents the fact that all cells have initially an age a = 0, and is defined by the following properties:
 |
(6) |
It should be noted that the unit of pk and nk is cells per day. The model developed here is focused on fitting experimental data, and as the CFSE fluorescence profile figures usually do not give much information about absolute number of cells, the real value of C0 is irrelevant for the study. Therefore, we will use C0 = 1 as the initial CFSE + cell number. This will give a relative cell count with respect to the initial number of CFSE + cells in simulations.
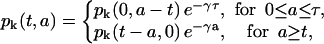
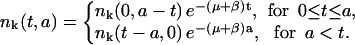
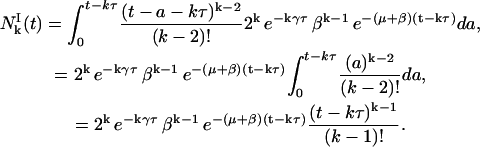
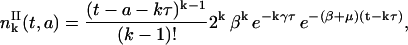
As we have derived in the Appendix, under the section called Computation of pk(t,a) and nk(t,a), the solution for the maturation-age problem defined by Eqs. 1 and 2 at the kth division of a cell cohort with ICI (Eq. 4) is
 |
(7) |
for k ≥ 1 and t − a ≥ kτ,
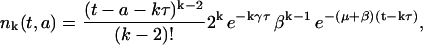 |
(8) |
for k ≥ 2 and t − a ≥ kτ. For k = 0 and 1, we have
 |
(9) |
and
 |
(10) |
Solution with Initial Conditions I (ICI) in the Appendix gives the derivation of this result, and Solution with Initial Conditions II (ICII) in the Appendix gives the solution of the model with ICII.
Note that for a given age a, the densities p and n have the functional form of a shifted gamma distribution (up to a multiplicative factor). The gamma distribution has been widely used in the population dynamics literature and is often related to a distribution of maturation times (Haurie et al., 1998; Hearn et al., 1998; Bernard et al., 2001). Therefore, the time required for a single cell to perform a fixed number of divisions follows a γ-distribution. Not only is this distribution easy to handle mathematically, but it also offers a good fit to experimental data. The model presented here gives an analytical explanation, based on physiologically relevant features, for the occurrence of the γ-distribution seen in many cell labeling experiments (Guerry et al., 1973; Deubelbeiss et al., 1975; Price et al., 1996; Basu et al., 2002).
Numerical illustrations
A quantitative analysis of lymphocyte proliferation using CFSE has been carried out by Hasbold and co-workers (Hasbold et al., 1999). The authors approximate the distribution of cell cycle durations by Gaussian distributions to fit the experimental data, assuming that the distribution of time until first division is Gaussian. They consider neither the resting G0 compartment, nor apoptosis. This model is simple and the results are consistent with the data. However, this method does not give any further information such as the proportion of proliferating and resting cells, the loss rate (due to death or differentiation) in each compartment, the reentry rate from the resting phase to the proliferating one, or the time τ required for each cell to divide. Another model by Zhang and co-workers uses discrete time steps to model the proportion of apoptotic, dividing, and quiescent cells in a hematopoietic cell population (Zhang et al., 2001). However, this model does not allow evaluation of kinetic parameters such as the reentry rate into proliferative phase.
Our model is more complicated, but the numerical fit of the model solutions to data allows us to give estimates of these parameters. The objective of this section is to present different aspects of our results. The section is divided into three subsections. In the subsection Comparison with Experimental Data, we compare our theoretical results with some existing experimental data on hematopoietic stem cell division in vitro. In the subsection Relation between Proliferating Cells and Resting Cells, we compare the predicted proportion of proliferating and resting cells and their evolution with respect to the total population. The subsection Asynchronous Evolution of Divided and Undivided Cells is focused on the description of the temporal dynamics of the cell population during a period of time (8 h–72 h).
It is important to note that, in the model presented in Description of the Model, we assume that the proliferating cells that are labeled by CFSE are only labeled at age a = 0 (ICI, Eq. 4), which is not the case in reality. Indeed, CFSE molecules are incorporated by all proliferating cells (Hodgkin et al., 1996; Lyons and Parish, 1994). In Solution with a General Initial Density Distribution, found in the Appendix, we present a generalization to take into account an arbitrary initial condition. Thus, for the numerical simulations done here, we will use a combination of ICI and ICII as an initial condition to make the computations as clear as possible so that the role of each parameter can be understood in a better way. The program used to make these numerical simulations is written with the software Matlab. It is publicly available and can be downloaded from http//www.cnd.mcgill.ca/∼sberna/cfse/cfse.html.
Comparison with experimental data
The data to which we have compared our results come from the work of Oostendorp and co-workers (Oostendorp et al., 2000; see Figs. 1 and 2 therein). Data were obtained from primitive murine bone marrow cells. The cells were cultured in vitro with a combination of growth factors: steel factor, fetal liver tyrosine kinase ligand 3, and interleukin-11 or hyper-interleukin-6. Cells were first labeled with CFSE and then incubated overnight before isolating CFSE + cells. Cells were then cultured for two or three days more (three or four days in total). Data were obtained by digitizing CFSE profiles from the original figures using the software CurveUnscan (SquarePoint Software, Gentilly, France). The parameters were estimated by fitting the model visually to experimental data.
FIGURE 2.

Comparison of CFSE fluorescence between the experimental data and theoretical results. This figure represents the CFSE profile after 3 days of culture (two days after isolating CFSE + cells). The first bar (black) represents the model predicted number of proliferating cells, the second one (dark) is for the predicted resting phase cells, the third bar (light) is the total cell population in the cell compartment and the fourth bar (white) is the experimental data. For comparison between the data and the model one should concentrate on the total population. Parameters: β = 2.24 day−1, τ = 0.307 day, γ = 0.30 day−1, and μ = 0.05 day−1. The initial proportion of cells in resting phase is 0.65. Experimental data taken from Oostendorp et al., (2000) (Fig. 1, panel 3).
The results in Fig. 2 show a consistent approximation of the experimental data by our solutions with the parameters: β = 2.24 day−1, τ = 0.307 day, γ = 0.30 day−1, and μ = 0.05 day−1. Cells have been sorted according to their CFSE fluorescence profile after three days of culture (two days after isolating CFSE + cells). Parameters γ and μ both represent cell loss, and their individual values cannot be based solely on CFSE tracking experiments. For this reason, we assumed that the loss rate μ in the resting phase is very small (order of 0.05 day−1) and took γ as the parameter to be fitted. The reentry rate β is similar to the estimations given in Mackey (1978, 1997). It is interesting to observe that after two days, some cells have reached the sixth division as shown in the experimental data on Fig. 2.
This example of a fit of the data with the model is relatively successful. However, there is a gap between the model predicted result and the experimental data for the cells of generation 0 (at the left-hand side of Fig. 2). We believe that this difference is primarily due to the fact that in our model, we assumed that the reentry rate β is a constant independent of any factors such as time, generation k or heterogeneity in cell population. In Fig. 3, we have plotted two populations of cells predicted by the model with the same parameters: τ = 0.25 day, γ = 0.90 day−1, and μ = 0.05 day−1, but a different reentry rate β. In the top panel, β = 0.08 day−1 which corresponds to a slowly cycling population and in the bottom panel, β = 2.30 day−1 which corresponds to a rapidly cycling one. It is clear that the data from the first generations are best represented by a slowly cycling population and the later generations with a faster cycling one.
FIGURE 3.

Representation of two subpopulations with the same parameters: τ = 0.25 day, γ = 0.90 day−1, and μ = 0.05 day−1, but a different reentry rate β. (Top) β = 0.08 day−1, which corresponds to a slowly cycling population of cells. (Bottom) β = 2.30 day−1 which corresponds to a rapidly cycling population. The experimental data come from Oostendorp et al. (2000) (Fig. 2, bottom). Bars as in Fig. 2.
If we sum the two subpopulations of Fig. 3 with a proportion of 0.40 for the slow cycling population and 0.60 for the fast cycling, the result presented in Fig. 4 is a very good approximation to the experimental data.
FIGURE 4.

Approximation of the experimental data after four days in culture (3 days after isolating CFSE + cells) from Oostendorp et al. (2000) (Fig. 2, bottom). Two subpopulations are represented in the present figure: one corresponding to the slowly cycling population (β = 0.08 day−1) and the other one corresponding to the rapidly cycling population (β = 2.30 day−1) parameters: β = 0.08 and 2.30 day−1, τ = 0.25 day, γ = 0.90 day−1, and μ = 0.05 day−1. The initial proportion of cells in resting phase was 0.90; the slowly cycling population constituting 0.40 of the total and the rapidly cycling one 0.60 of the total initial population. This figure represents the weighted sum of subpanels in Fig. 3. Bars as in Fig. 2.
Relation between proliferating cells and resting cells
In all the figures representing the simulations, our grayscale coding shows both the proliferating and resting cells for each generation. It is clear from these figures that a change of the proportion of cells in each phase occurs with time. It is interesting not only to compute numerically the proportion of cells in the resting and proliferating phases with respect to cell generation at a fixed time (Fig. 5), but also to simulate the evolution of these proportions over time for all generations together (Fig. 6).
FIGURE 5.

Model predicted numbers of proliferating and resting phase cells with respect to division number at t = 3 days based on the same parameter as in Fig. 2: β = 2.24 day−1, τ = 0.307 day, γ = 0.30 day−1, μ = 0.05 day−1, and an initial proportion of resting cells of 0.65. The CFSE fluorescence profile is shown in the top panel. In the lower panel, the proportion of cells in the two different compartments for each generation is given.
FIGURE 6.

Model predicted total number of proliferating and resting phase cells as a function of time for the same parameters as in Fig. 2, β = 2.24 day−1, τ = 0.307 day, γ = 0.30 day−1, μ = 0.05 day−1, and an initial proportion of resting cells of 1. The evolution curves are compared to other ones with a smaller reentry rate β = 1.6 day−1. As expected the proportion of resting phase cells gets larger as β decreases. The transient is due to the fact that proliferating cells take a time τ to divide and reenter in the resting phase. After time t = τ the curves stabilize rapidly.
In Fig. 5, we observe an increase in the fraction of cells in the resting cell population and a decrease of the proliferating fraction with respect to division number. The proportion of resting phase cells after several generations becomes larger than the proliferating cells. This would imply that in our model the resting phase plays a role of a cellular reservoir.
Without the structure of generations, the population model has the property of asynchronous exponential growth, i.e., the cell densities n and p converge to an invariant distribution in time (after multiplication by an exponential factor in time; see Webb, 1985; Arino et al., 1997; Sánchez and Webb, 2001). This property is reflected in Fig. 6, where it is shown that the proportion of proliferating and resting phase cells with respect to the total population clearly stabilizes over time. This behavior is expected because, in our simulations, the damped oscillations can be compared to the exchange of two fluids separated into two different boxes. Cells start proliferating very quickly, but then the resting compartment acts as a reservoir compartment where a majority of cells will remain after a certain time. However, when the model with the structure of generation is considered, the number of generations with nonzero populations is increasing over time, thus there is no asynchronous exponential growth with respect to the generation structure as we can see in Fig. 7.
FIGURE 7.

Predicted CFSE fluorescence of labeled cells between 8 h and 72 h based on our analysis with β = 2.24 d−1, τ = 0.307 d, γ = 0.30 d−1, μ = 0.05 d−1, and initial proportion of resting cells of 0.65. The peaks in each panel represent the total relative number of cells of each generation for different times. After two days (48 h) the CFSE profile corresponds to that of Fig. 2.
Asynchronous evolution of divided and undivided cells
Because our model is able to describe the evolution of a cohort of cells over time, we simulated this situation in Fig. 7 for time between 8 h and 72 h. The result shows the standard CFSE profile usually observed in vitro as well as in vivo (Lyons and Parish, 1994). This profile is sometimes referred to as the “asynchronous division shape” (Hasbold et al., 1999; Hodgkin et al., 1996): after several days, some cells remain undivided whereas some have divided several times. The term “asynchronous” here has a different meaning from the one of “asynchronous exponential growth” in the section Relation between Proliferating Cells and Resting Cells. This asynchrony is due to the fact that within a same generation, some cells remain in the resting phase G0 and some keep on proliferating. The progressive cell divisions can be tracked during several days (72 h in our simulation) giving rise to this typical asynchronous CFSE profile. As time goes on, the division profile takes a slightly asymmetric, left skewed shape.
CONCLUSION
The model we have developed here to describe the tracking of cell division using CFSE has two main advantages. First, our approach is simple and the computations to obtain the solutions are more technical than highly theoretical. This allows us to understand the role of each parameter in shaping the results, and gives a biological interpretation to our results. Secondly, our simulations are quite satisfactory in the sense that our estimations are consistent with the experimental data. These combine to give an understandable model that is easy to handle with respect to data analysis and which yields results consistent to the experimental results.
As noted at the beginning of the section Numerical Illustrations, this model is not the first attempt in the literature to describe a quantitative analysis of cell division using CFSE. Hasbold and co-workers, and Zhang and co-workers, have proposed simple models showing excellent agreement with the experimental data (Hasbold et al., 1999; Zhang et al., 2001). The model we present here gives a more detailed description of the mechanisms involved in the cell division such as the G0 resting phase, which is not taken in consideration in the study in Hasbold et al. (1999), and provides more information about the role of several parameters such as the reentry rate β, which is impossible to evaluate in Zhang et al. (2001).
Some points remain that could be improved. It is commonly believed that β depends on the total population N of resting cells in vivo (Adimy and Pujo-Menjouet, 2001; Mackey, 1978, 1997; Mackey and Rudnicki, 1994, 1999; Pujo-Menjouet and Rudnicki, 2000) and probably on the division history of the cell as well as the population heterogeneity. The usual shape of β is a decreasing function of the total population in the resting phase (a Hill function most of the time). Indeed, regarding our simulations, one can easily notice that the function β should not be considered as a constant. Our “hybrid” model would then be nonlinear and the explicit form of the solutions more difficult to obtain analytically. We believe that β plays a more important role than the one we gave it in our assumptions. The results of the parameters estimations in Figs. 3 and 4 have shown that β depends on characteristics of two subpopulations, characteristics that may depend on division history and/or population density. This nonlinear model will be the object of future investigations.
Even with these cautionary comments, the results presented here allow estimations on the range of the mean generation time. The mean generation time (MGT) is defined as the average time required for a cell to perform an entire cycle, i.e., from the beginning of the resting (G0) phase at a = 0 to the beginning of the next resting phase after cell division. In other words, this is the average time required to go through phases G0, G1, S, G2, and M successively. In term of our parameters, the MGT is Tg = τ + 1/β. This MGT is not affected by the loss rates μ and γ because only cells that survive through the resting and proliferative phases are taken into account. The MGT should not be interpreted as the average time spent by a cell in the resting and proliferating phases. In this case, the average time spent in the resting phase is 〈tn〉 = (β + μ)−1 and the average time in the proliferative phase is 〈tp〉 = (1 − γτ exp(−γτ)[1 − exp(−γτ)]−1)/γτ. It is interesting to note that in the example of two subpopulations (Figs. 3 and 4), the value of β = 0.08 day−1 corresponds to a MGT of Tg = 12.75 days and for the value β = 2.30 day−1, it is Tg = 0.68 day. The large difference between these two values suggests that the primitive murine bone marrow cell population analyzed here is heterogeneous and consists, after four days of culture, of a slowly cycling subpopulation and a rapidly cycling one, or perhaps a continuum between these two extremes. The existence of several subpopulations could be explained by the differentiation of some of the primitive cells initially in the culture. This interpretation is consistent with experimental data about the quiescence of primitive hematopoietic stem cells (Bradford et al., 1997) implying that more mature cells cycle more rapidly than primitive ones (Furukawa, 1998).
One of the main issues regarding the analysis of hematopoietic stem cell kinetics is their capability of repopulating a depleted bone marrow and this study provides a new theoretical framework to identify good candidates for cell transplant. The MGT is a critical parameter when the repopulating ability of a cell population is considered. The model presented here allows the characterization of different cell populations by estimating their kinetic properties using CFSE profile analysis.
The kinetics of stem cells is still poorly understood due to the lack of experimental tools and the apparent heterogeneity of stem cell populations. CFSE + cell tracking experiments along with a mathematical model of proliferation are a good example of the fruitful cooperation between experimental methods and theoretical models to gain insight into the complex behavior of self-renewing cell populations.
Acknowledgments
S.B. is supported by Mathematics of Information Technology and Complex Systems (Canada) and l'Institut des Sciences Mathématiques (Québec). L.P-.M. is supported by Mathematics of Information Technology and Complex Systems (Canada). M.C.M. is supported by the Natural Sciences and Engineering Research Council (NSERC Grant No. OGP-0036920, Canada), Mathematics of Information Technology and Complex Systems (Canada), and Le Fonds pour la Formation de Chercheurs et l'Aide à la Recherche (FCAR Grant No. 98ER1057, Québec).
APPENDIX
Computation of pk(t,a) and nk(t,a)
We present here the computation of the solution of Eqs. 1 and 2. First we solve Eqs. 1 and 2 with initial conditions I. From that solution, we then derive the solution with initial conditions II. In the following, we will denote pI and nI as the solution associated with ICI, and pII and nIIas the solution associated with ICII. Then, from those two particular solutions, we can write down a general form of solution associated with an arbitrary initial density distribution at time t = 0.
Solution with initial conditions I (ICI)
Here, we present the computation of results presented in the section called Description of the Model.
Using the method of characteristics, we can solve Eqs. 1 and 2 to obtain a general implicit solution for pk and nk.
 |
(11) |
and
 |
(12) |
Including the boundary conditions defined by Eq. 3 and ICI (Eq. 4) into these solutions, we have
 |
(13) |
and
 |
(14) |
leading, with Eq. 13, to
 |
(15) |
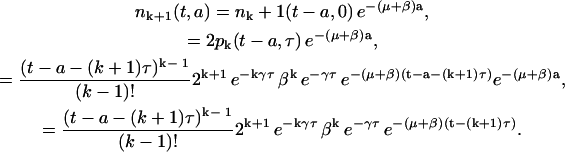
for the first cohort. All these functions are assumed to take a zero value outside the region of definition. To simplify reading, we will not write it explicitly. The function δ is the Dirac delta function as defined in Eq. 6. Define the total number of cells of maturity k at time t > 0 as
 |
and
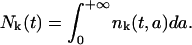 |
Then, it is easy to show that  for t ≥ τ, by integrating Eq. 15. This allows us to compute
  as follows:
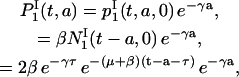 |
(16) |
for 0 ≤ a ≤ t − τ. Using the same argument, we find that
 |
(17) |
Note that  does not depend on a and Eq. 18 is valid only for a ≤ t − 2τ. Integrating with respect to age, we have
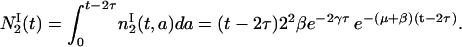 |
(18) |
Proceeding the same way as for Eq. 16, we obtain
 |
(19) |
We can inductively generalize this result for any general division number k. We have shown that Eqs. 16 and 18 are solutions of Eqs. 1 and 2 respectively for k = 1 and k = 2. Suppose that Eqs. 7 and 8 are solutions of Eqs. 1 and 2 for k > 1 and k > 2. Let us prove that Eqs. 7 and 8 are valid for k + 1. Starting with Eq. 8 we have, using the induction hypothesis on pk,
 |
(20) |
This completes the computation for nk+1, so Eq. 8 is satisfied. Let us show now that Eq. 7 holds. From Eqs. 3 and 11, we have
 |
(21) |
Moreover, we know that
 |
(22) |
Replacing  in Eq. 21, it is clear that Eq. 7 is satisfied and this completes the computation of
  and
and 
Solution with initial conditions II (ICII)
The computation of the solutions pII and nII is carried the same way as for pI and nI. The ICII is
 |
(23) |
and
 |
(24) |
and 0 for k ≥ 1. As already discussed, without loss of generality, we can set C0 = 1. Then we have for k = 0,
 |
(25) |
For k > 0, notice that,
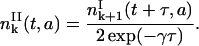 |
(26) |
Eq. 26 needs explanation. The solution  in Eq. 26 is deduced from the solution
  with ICI in the following way. Let us consider the initial cohort of proliferating cells
  starting at time t = 0 and age a = 0. This cohort will divide at a time t = τ and will be the initial condition
  In other words, all these cells will be at the beginning of the resting phase
  Because
  and
and  are equivalent up to a multiplicative constant, we can choose this constant so that
 |
(27) |
Further, since
 |
(28) |
it follows that,
 |
(29) |
Then the general Eq. 26 follows naturally. So,
 |
(30) |
for k ≥ 1 and t − a ≥ kτ. If we integrate Eq. 30 with respect to age, we find
 |
(31) |
for k ≥ 0. An equation similar to Eq. 26 holds for 
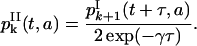 |
(32) |
Then
 |
(33) |
for k ≥ 0 and t − a ≥ kτ.
Solution with a general initial density distribution
We present here a formula giving the general solution of models 1 and 2 using a linear combination of particular solutions with ICI and ICII. As previously mentioned, the initial age density distribution of the resting cell population will not affect the solution after the first division, so we will only consider an arbitrary function g(a) representing the initial density distribution of cell in the proliferative phase. That is the density of proliferating cells at time t = 0 is
 |
(34) |
where g is an positive integrable function on the interval a∈[0,τ]. Without loss of generality, we can assume that  The density of proliferating cells with initial distribution g(a) is
 |
(35) |
and the density of resting phase cells is
 |
(36) |
For a complete description of the initial conditions, we only have to give the number of cells in the resting phase at time t = 0. Assume that the total number of cells at time t = 0 is 1, then the initial number of proliferating cells ρ plus the number of resting phase cells = 1. The complete general solution pk, nk is then
 |
(37) |
and
 |
(38) |
for k ≥ 0. It is worth noting that using different initial distributions g does not significantly influence the behavior of the solution, even for small times t. However, the solution is affected by the initial ratio ρ of proliferating cells.
References
- Adimy, M., and L. Pujo-Menjouet. 2001. A singular transport model describing cellular division. C. R. Acad. Sci. Paris, Série 1. 332:1071–1076. [Google Scholar]
- Arino, O., E. Sánchez, and G. Webb. 1997. Necessary and sufficient conditions for asynchronous exponential growth in age structured cell populations with quiescence. J. Math. Anal. Appl. 215:499–513. [Google Scholar]
- Basu, S., G. Hodgson, M. Katz, and A. R. Dunn. 2002. Evaluation of role of G-CSF in the production, survival, and release of neutrophils from bone marrow into circulation. Blood. 100:854–861. [DOI] [PubMed] [Google Scholar]
- Bernard, S., J. Bélair, and M. C. Mackey. 2001. Sufficient conditions for stability of linear differential equations with distributed delay. Discrete Contin. Dyn. Syst. Ser. B. 1:233–256. [Google Scholar]
- Bertuzzi, A., M. Faretta, A. Gandolfi, C. Sinisgalli, G. Starace, G. Valoti, and P. Ubezio. 2002. Kinetic heterogeneity of an experimental tumour revealed by BrdUrd incorporation and mathematical modelling. Bull. Math. Biol. 64:355–384. [DOI] [PubMed] [Google Scholar]
- Bonhoeffer, S., H. Mohri, D. Ho, and A. S. Perelson. 2000. Quantification of cell turnover kinetics using 5-bromo-2′-deoxyuridine1. J. Immunol. 164:5049–5054. [DOI] [PubMed] [Google Scholar]
- Bradford, G. B., B. Williams, R. Rossi, and I. Bertoncello. 1997. Quiescence, cycling, and turnover in the primitive hematopoietic stem cell compartment. Exp. Hematol. 25:445–453. [PubMed] [Google Scholar]
- Burns, F. J., and I. F. Tannock. 1970. On the existence of a G0 phase in the cell cycle. Cell Tissue Kinet. 3:321–334. [DOI] [PubMed] [Google Scholar]
- Crabb, R., J. Losson, and M. C. Mackey. 1996a. Dependence on initial conditions in nonlocal PDE's and hereditary dynamical systems. Proc. Inter. Conf. Nonlin. Anal. (Tampa Bay). 4:3125–3136. [Google Scholar]
- Crabb, R., M. C. Mackey, and A. Rey. 1996b. Propagating fronts, chaos and multistability in a cell replication model. Chaos. 3:477–492. [DOI] [PubMed] [Google Scholar]
- Deubelbeiss, K. A., J. T. Dancey, L. A. Harker, and C. A. Finch. 1975. Neutrophil kinetics in the dog. J. Clin. Invest. 55:833–839. [DOI] [PMC free article] [PubMed] [Google Scholar]
- Dyson, J., R. Villella-Bressan, and G. F. Webb. 1996. A singular transport equation modelling a proliferating maturity structured cell population. Can. Appl. Math. Quart. 4:65–95. [Google Scholar]
- Dyson, J., R. Villella-Bressan, and G. F. Webb. 1998. An age and maturity structured model of cell population dynamics. In Mathematical Models in Medical and Health Science. M. Horn, G. Simonnett, and G. F. Webb, editors. Vanderbilt University Press, Nashville, Tennessee. pp. 99–116.
- Dyson, J., R. Villella-Bressan, and G. F. Webb. 2000a. A nonlinear age and maturity structured model of population dynamics. I. Basic theory. J. Math. Anal. Appl. 242:93–104. [Google Scholar]
- Dyson, J., R. Villella-Bressan, and G. F. Webb. 2000b. A nonlinear age and maturity structured model of population dynamics. II. Chaos. J. Math. Anal. Appl. 242:255–270. [Google Scholar]
- Fazekas de St Groth, B., A. L. Smith, W.-P. Koh, L. Girgis, M. C. Cook, and P. Bertolino. 1999. Carboxyfluorescein diacetate succinimidyl ester and the virgin lymphocyte: a marriage made in heaven. Immunol. Cell Biol. 77:530–538. [DOI] [PubMed] [Google Scholar]
- Forster, I., P. Veira, and K. Rajewski. 1989. Flow cytometric analysis of cell proliferation dynamics in the B cell compartment of the mouse. Int. Immun. 1:321–331. [DOI] [PubMed] [Google Scholar]
- Fulcher, D. A., and S. W. J. Wong. 1999. Carboxyfluorescein succinimidyl ester-based proliferative assays for assessment of T cell function in the diagnostic laboratory. Immunol. Cell Biol. 77:559–564. [DOI] [PubMed] [Google Scholar]
- Furukawa, Y. 1998. Cell cycle regulation of hematopoietic stem cells. Hum. Cell. 11:81–92. [PubMed] [Google Scholar]
- Gratzner, H. G. 1982. Monoclonal antibody to 5-bromo- and 5-iododeoxyuridine: a new reagent for detection of DNA replication. Science. 218:474–475. [DOI] [PubMed] [Google Scholar]
- Guerry, D., D. C. Dale, M. Omine, S. Perry, and S. M. Wolff. 1973. Periodic hematopoiesis in human cyclic neutropenia. J. Clin. Inv. 52:3220–3230. [DOI] [PMC free article] [PubMed] [Google Scholar]
- Hasbold, J., A. V. Gett, J. S. Rush, E. Deenick, D. Avery, J. Jun, and P. D. Hodgkin. 1999. Quantitative analysis of lymphocyte differentiation and proliferation in vitro using carboxyfluorescein diacetate succinimidyl ester. Immunol. Cell Biol. 77:516–522. [DOI] [PubMed] [Google Scholar]
- Hasbold, J., and P. D. Hodgkin. 2000. Flow cytometric cell division tracking using nuclei. Cytometry. 40:230–237. [DOI] [PubMed] [Google Scholar]
- Hasbold, J., A. Lyons, M. Kehry, and P. Hodgkin. 1998. Cell division number regulates IgG1 and IgE switching of B-cells following stimulation by CD40 ligand and IL-4. Eur. J. Immunol. 28:1040–1051. [DOI] [PubMed] [Google Scholar]
- Haurie, C., D. C. Dale, and M. C. Mackey. 1998. Cyclical neutropenia and other periodic hematological disorders: a review of mechanisms and mathematical models. Blood. 92:2629–2640. [PubMed] [Google Scholar]
- Hearn, T., C. Haurie, and M. C. Mackey. 1998. Cyclical neutropenia and the peripheral control of white blood cell production. J. Theor. Biol. 192:167–181. [DOI] [PubMed] [Google Scholar]
- Henry, L. L. 1976. Population Analysis and Models. Edward Arnold, London.
- Hodgkin, P. D., J.-H. Lee, and A. B. Lyons. 1996. B-cell differentiation and isotype switching is related to division cycle number. J. Exp. Med. 184:277–281. [DOI] [PMC free article] [PubMed] [Google Scholar]
- Houck, D. W., and M. R. Loken. 1985. Simultaneous analysis of cell surface antigens, bromodeoxyuridine incorporation and DNA content. Cytometry. 6:531–538. [DOI] [PubMed] [Google Scholar]
- Keyfitz, N. 1968. Introduction to the Mathematics of Population. Addison-Wesley, Reading, Massachusetts.
- Lebowitz, J. L., and S. I. Rubinow. 1969. Grain count distributions in labeled cell populations. J. Theor. Biol. 23:99–123. [DOI] [PubMed] [Google Scholar]
- Lyons, A. B. 1999. Divided we stand: tracking cell proliferation with carboxyfluorescein diacetate succinimidyl ester. Immunol. Cell Biol. 77:509–515. [DOI] [PubMed] [Google Scholar]
- Lyons, A. B., and C. R. Parish. 1994. Determination of lymphocyte division by flow cytometry. J. Immunol. Methods. 171:131–137. [DOI] [PubMed] [Google Scholar]
- Mackey, M. C. 1979a. Dynamic haematological disorders of stem cell origin. In Biophysical and Biochemical Information Transfer in Recognition. J. G. Vassileva-Popova and E. V. Jensen, editors. Plenum Publishing, New York. 373–409.
- Mackey, M. C. 1979b. Periodic auto-immune hemolytic anemia: an induced dynamical disease. Bull. Math. Biol. 41:829–834. [DOI] [PubMed] [Google Scholar]
- Mackey, M. C. 1978. Unified hypothesis of the origin of aplastic anemia and periodic hematopoiesis. Blood. 51:941–956. [PubMed] [Google Scholar]
- Mackey, M. C. 1997. Mathematical models of hematopoietic cell replication and control. In The Art of Mathematical Modeling: Case Studies in Ecology, Physiology and Biofluids. H. G. Othmer, F. R. Adler, M. A. Lewis, and J. C. Dalton, editors. Prentice Hall, New Jersey. pp. 149–178.
- Mackey, M. C., and P. Dörmer. 1982. Continuous maturation of proliferating erythroid precursors. Cell Tissue Kinet. 15:381–392. [DOI] [PubMed] [Google Scholar]
- Mackey, M. C., and R. Rudnicki. 1994. Global stability in a delayed partial differential equation describing cellular replication. J. Math. Biol. 33:89–109. [DOI] [PubMed] [Google Scholar]
- Mackey, M. C., and R. Rudnicki. 1999. A new criterion for the global stability of simultaneous cell replication and maturation processes. J. Math. Biol. 38:195–219. [Google Scholar]
- Mintern, J., M. Li, G. M. Davey, E. Blanas, C. Kurts, F. R. Carbone, and W. R. Heath. 1999. The use of carboxyfluorescein diacetate succinimidyl ester to determine the site, duration and cell type responsible for antigen presentation in vivo. Immunol. Cell Biol. 77:539–543. [DOI] [PubMed] [Google Scholar]
- Mosmann, T. 1983. Rapid colorimetric assay for cellular growth and survival: application to proliferation and cytotoxicity assays. J. Immunol. Methods. 65:55–63. [DOI] [PubMed] [Google Scholar]
- Nordon, R. E., M. Nakamura, C. Ramirez, and R. Odell. 1999. Analysis of growth kinetics by division tracking. Immunol. Cell Biol. 77:523–529. [DOI] [PubMed] [Google Scholar]
- Oostendorp, R. A., J. Audet, and C. J. Eaves. 2000. High-resolution tracking of cell division suggests similar cell cycle kinetics of hematopoietic stem cells stimulated in vitro and in vivo. Blood. 95:855–862. [PubMed] [Google Scholar]
- Parish, C. R. 1999. Fluorescent dyes for lymphocyte migration and proliferation studies. Immunol. Cell Biol. 77:499–508. [DOI] [PubMed] [Google Scholar]
- Price, T. H., G. S. Chatta, and D. C. Dale. 1996. Effect of recombinant granulocyte colony stimulating factor on neutrophil kinetics in normal young and elderly humans. Blood. 88:335–340. [PubMed] [Google Scholar]
- Pujo-Menjouet, L. 2001. Contribution à l'étude d'une équation de transport à retards décrivant une dynamique de population cellulaire. Ph.D. thesis, Université de Pau et des Pays de l'Adour, France.
- Pujo-Menjouet, L., and R. Rudnicki. 2000. Global stability of cellular populations with unequal division. Can. Appl. Math. Quart. 8:99–102. [Google Scholar]
- Sánchez, E., and G. F. Webb. 2001. Semigroup theory for population dynamics. Lecture notes for 2001 Siguenza Summer School.
- Sheehy, M. E., A. B. McDermitt, S. N. Furlan, P. Klenerman, and D. F. Nixon. 2001. A novel technique for the fluorometric assessment of T lymphocyte antigen specific lysis. J. Immunol. Methods. 249:99–110. [DOI] [PubMed] [Google Scholar]
- Smith, J. A., and L. Martin. 1973. Do cells cycle? Proc. Natl. Acad. Sci. USA. 70:1263–1267. [DOI] [PMC free article] [PubMed] [Google Scholar]
- Takahashi, M. 1966. Theoretical basis for cell cycle analysis. I. Labelled mitosis wave method. J. Theor. Biol. 13:202–211. [DOI] [PubMed] [Google Scholar]
- Warren, H. S. 1999. Using carboxyfluorescein diacetate succinimidyl ester to monitor human NK cell division: analysis of the effect of activating and inhibitory class I MHC receptors. Immunol. Cell Biol. 77:544–551. [DOI] [PubMed] [Google Scholar]
- Webb, G. F. 1985. Theory of nonlinear age-dependent population dynamics. In Vol. 89 of the Series, Monographs and Textbooks in Pure and Applied Math. Dekker. New York and Basel, Switzerland.
- Yanokur, M., K. Takase, K. Yamamoto, and H. Teraoka. 2000. Cell death and cell-cycle arrest induced by incorporation of [3H] thymidine into human haemopoietic cell lines. Int. J. Radiat. Biol. 76:295–303. [DOI] [PubMed] [Google Scholar]
- Zhang, X.-W., J. Audet, J. M. Piret, and Y.-X. Li. 2001. Cell cycle distribution of primitive haematopoietic cells stimulated in vitro and in vivo. Cell Prolif. 34:321–330. [DOI] [PMC free article] [PubMed] [Google Scholar]