

Abstract
Explicit solvent and counterion molecular dynamics simulations have been carried out for a total of >80 ns on the bacterial and spinach chloroplast 5S rRNA Loop E motifs. The Loop E sequences form unique duplex architectures composed of seven consecutive non-Watson-Crick basepairs. The starting structure of spinach chloroplast Loop E was modeled using isostericity principles, and the simulations refined the geometries of the three non-Watson-Crick basepairs that differ from the consensus bacterial sequence. The deep groove of Loop E motifs provides unique sites for cation binding. Binding of Mg2+ rigidifies Loop E and stabilizes its major groove at an intermediate width. In the absence of Mg2+, the Loop E motifs show an unprecedented degree of inner-shell binding of monovalent cations that, in contrast to Mg2+, penetrate into the most negative regions inside the deep groove. The spinach chloroplast Loop E shows a marked tendency to compress its deep groove compared with the bacterial consensus. Structures with a narrow deep groove essentially collapse around a string of Na+ cations with long coordination times. The Loop E non-Watson-Crick basepairing is complemented by highly specific hydration sites ranging from water bridges to hydration pockets hosting 2 to 3 long-residing waters. The ordered hydration is intimately connected with RNA local conformational variations.
INTRODUCTION
Ribosomal 5S RNA (5S rRNA) is an integral component of the large ribosomal subunit in all known organisms with the exception of the small ribosomes of fungal and animal mitochondria. The atomic resolution crystal structures of archaeal and bacterial 50S subunits confirm the location of 5S RNA in the “central protuberance” of the 50S subunit and reveal RNA-RNA interactions of Loop E and Loop D of 5S with conserved regions of Domain II of 23S rRNA (Ban et al., 2000). The 5S rRNA of Escherichia coli interacts with ribosomal proteins L5, L18, and L25. L5 and L18 are conserved proteins with equivalents in archaeal, eukaryal, and organelle ribosomes (see http://www.expasy.ch/cgi-bin/lists?ribosomp.txt), whereas L25 is found in only some (but not all) bacteria (Nevskaya et al., 2000). Interestingly, the Loop E region of bacterial (and chloroplast) 5S rRNA is related but different from that of archaea and eukarya (Dallas and Moore, 1997). The bacterial Loop E comprises two submotifs that are related by dyadic rotational symmetry (Correll et al., 1997; Leontis and Westhof, 1998b). One submotif comprises basepairs 72/104, 73/103, and 74/102 and the other basepairs 98/78, 99/77, and 100/76 in the E. coli numbering (Fig. 1). The first submotif interacts with L25 whereas the second interacts with 23S rRNA. The Loop E of archaeal and eukaryal 5S rRNA, on the other hand, is identical to the sarcin/ricin motif (Szewczak and Moore, 1995; Wimberly et al., 1993), first identified as the conserved region of Domain VI of 23S rRNA that is sensitive to the action of ribotoxins sarcin and ricin (Endo and Wool, 1982). The sarcin/ricin motif shares with each of the bacterial Loop E submotifs a cross-strand stacked purine-purine motif (Correll et al., 1997, 1999; Dallas and Moore, 1997; Wimberly et al., 1993). In archaeal and eukaryal 5S rRNA, this motif interacts with 23S rRNA, as revealed by the atomic-resolution crystal structure of the 50S subunit of Haloarcula marismortui (Ban et al., 2000). 5S rRNA is an integral component of ribosomes that is thought to enhance protein synthesis by stabilization of the ribosome structure, but its exact role in protein synthesis is not known.
FIGURE 1.

Sequences of the simulated molecules. Left panel: bacterial (E. coli) 5S rRNA Loop E; right panel: spinach chloroplast 5S rRNA Loop E. Symbols identifying non-Watson-Crick basepairs were previously introduced (Csaszar et al., 2001) and are as follows: Circles represent Watson-Crick edges; squares represent Hoogsteen edges; and triangles represent Sugar-edges. Open symbols represent trans and filled symbols cis basepairs. Filled symbols labeled with B indicate cis bifurcated pairs and those labeled with W indicate water-inserted basepairs.
Chloroplasts are related evolutionarily to bacteria. Thus one expects their ribosomal RNAs to bear greater structural similarity to those of bacteria. The conformations of bacterial E. coli and spinach chloroplast 5S RNA have been compared by chemical and enzymatic probing (Romby et al., 1988; Westhof et al., 1989). The Loop E region of chloroplast 5S appears to be more flexible and accessible to chemical probes.
RNA-RNA and RNA-protein interactions are largely mediated by RNA motifs, defined as ordered, stacked arrays of non-Watson-Crick basepairs (Leontis and Westhof, 1998b, 2001). To properly understand the role of non-Watson Crick regions of RNA, it is crucial to study the relation between the base sequence and the RNA structure and the way it is mediated by non-Watson Crick interactions.
Besides the experimental approaches, molecular interactions in RNA molecules can be studied by a variety of advanced molecular modeling tools (Auffinger and Westhof, 1998, 2001; Beveridge and McConnell, 2000; Brandl et al., 2000; Cheatham and Kollman, 2000; Cheatham and Young, 2000; Chin et al., 1999; Guo et al., 2000; Hermann et al., 1997; Hermann and Westhof, 1998; Lahiri and Nilsson, 2000; Nagan et al., 1999, 2000; Sarzynska et al., 2000; Schneider and Suhnel, 2000; Schneider et al., 2001; Sponer et al., 2001; Williams and Hall, 1999; Zacharias, 2000). This reflects the enormous progress of computer hardware and software in the last decade, during which the actual performance of computers increased by at least three orders of magnitude. Modern computational techniques for simulating macromolecular dynamics complement the information provided by atomic-resolution experiments and bring valuable insights into the relation between molecular structures and energies. Molecular dynamics (MD) simulations with improved treatment of long-range electrostatic forces were introduced several years ago (Cheatham and Kollman, 2000; Cheatham and Young, 2000; Essmann et al., 1995; McConnell and Beveridge, 2000) and provide more realistic, dynamic views of RNA molecules than previously possible. In this paper we present extended MD investigations carried out with explicit solvent molecules and counterions. Contemporary simulations are still affected by numerous approximations inherent in the empirical forcefields in practical use and the limited nanosecond timescale of the simulations (Cheatham and Kollman, 2000; Cheatham and Young, 2000; Sponer et al., 2000b, 2001). Nevertheless, modern computer simulations are capable of bringing unique insights into the structure and dynamics of RNA molecules that cannot be obtained by other techniques. Because the presently available molecular modeling forcefields provide a well-balanced description of stacking and H-bonding of nucleic acid bases (Hobza et al., 1997; Sponer et al., 2001), MD simulations represent a promising tool to reveal the behavior (stability, dynamics, solvent and ion-binding properties) of non-Watson-Crick interactions in RNA molecules (Csaszar et al., 2001; Spackova et al., 2000). The Loop E is a salient example of a uniquely structured non-Watson-Crick motif, as it contains seven consecutive non-Watson-Crick basepairs. Thus, the structure, dynamics, hydration, and cation binding of non-Watson-Crick basepairs comprise the main focus of this investigation. Further, we utilize MD simulations to refine the structure of the spinach chloroplast Loop E, for which there is no atomic resolution structure yet available and which is sufficiently different from bacterial Loop E motifs in sequence but evolutionarily related to it. The initial model for the simulation of the Loop E of chloroplast RNA was proposed based on homology modeling (Leontis and Westhof, 1998a; 1998b). Thus, another aim of this study is to test the usefulness of the MD technique in evaluating the dynamics and energetics of molecular models of RNA motifs constructed by phylogenetic analysis and isostericity principles.
METHODS
The simulations were carried out using the AMBER-6.0 program (Pearlman et al., 1995) with the Cornell et al. forcefield (Cornell et al., 1995). The starting structures were prepared as specified in Results. Where not specified otherwise, the RNA molecules were neutralized with sodium counterions that were placed by the xleap module of AMBER-6.0 at the most negative positions close to the RNA solute. In some simulations the Mg2+ ions observed in the crystal structure were utilized, and neutralization of the system was completed by adding sufficient Na+ counterions to neutralize the solute. The following parameters were used for simulating cations: Na+ radius 1.868 Å and well depth 0.00277 kcal/mol, Mg2+ radius 0.7926 Å and well depth 0.8947 kcal/mol (Ross and Hardin, 1994). A cubic box of the TIP3P water molecules was added around the RNA to a depth 10 Å on each side of the solute. The Sander module of AMBER-6.0 was used for all minimizations, equilibrations, and molecular dynamics simulations. The systems were first minimized (500 steps) with all RNA H-bonds restrained with harmonic force constants of 5 kcal/mol for H-bond compression and 15 kcal/mol for H-bond extension, while ions, water, and the rest of the RNA were allowed to relax. This was followed by 100 ps of dynamics maintaining constraints on the H-bond. The system was then heated from 50 K up to 300 K in 100 ps. All MD simulations were performed using the particle mesh Ewald (PME) method for calculating long-range electrostatic forces. The production runs were carried out at 300 K with constant-pressure boundary conditions and PME. Simulations were performed using the Berendsen temperature coupling algorithm (with a time constant of 0.2 ps). The center of mass velocity was periodically removed during the production dynamics at intervals of 10 ps (Harvey et al., 1998). The standard simulation protocol has been described in greater detail in a recent study (Csaszar et al., 2001).
To enhance sampling, some simulations were carried out at an elevated temperature (400 K). The system was gradually heated from 300 K to 400 K during the first 100 ps using NPT conditions (constant pressure ensemble). The production run was then continued at 400 K using either NPT or NVT (constant volume ensemble). There are no clear guidelines whether NVT or NPT simulations should be preferred, and, in fact, both approaches have drawbacks (Zhou et al., 2001). The pair additive forcefield is not parameterized for elevated temperatures and therefore leads, in the case of the NPT simulation, to reduced water density, increased diffusion, and then regions with low solvent density (bubbles) that might disrupt the structure. The NVT simulations imply high pressure that in certain cases may stabilize the structure (Zhou et al., 2001). The outcome of the elevated temperature simulations is also limited by the fact that at elevated temperature the system is not represented by a Boltzmann distribution equivalent to prolongation of a room temperature simulation, i.e., the sampling is not equivalent. Nonetheless, elevated temperature simulations provide insights into labile parts of the simulated structures.
As another method to test the stability of the system, we have carried out “no-salt” simulations, in which cations were omitted from the simulation box. The missing counterions were substituted by a net-neutralizing plasma representing a uniform neutralizing charge distribution over the box. This feature is implemented in the AMBER program package for its use with the PME method and guarantees the neutrality of the system (Darden et al., 1998).
Trajectories were analyzed using the CARNAL module of AMBER, and structures were visualized using VMD (molecular visualization program, http://www.ks.uiuc.edu/Research/vmd/) (Humphrey et al., 1996). Figures were prepared using VMD, the Chem3D and ChemDraw Pro programs (CambridgeSoft, Cambridge, MA). Hydration and distribution of ions were calculated with the ptraj module of AMBER-6.0 and graphics using UCSF MidasPlus (University of California, San Francisco, CA) (Ferrin et al., 1988). Systematic monitoring of the solute-to-water distances was carried out using the CARNAL module of AMBER. All direct solute-solvent contacts were detected for the whole trajectory and then analyzed in detail. All cation-binding sites with occupancies higher then 5% were analyzed in detail. Molecular electrostatic potentials were calculated using the program DELPHI (Gilson et al., 1998), solving the nonlinear Poisson-Boltzmann equation with implicitly represented solvent and ionic strength. Visualization of the potential maps was carried out using the program Insight II (Biosym/MSI, San Diego, CA).
RESULTS
We have carried out a set of simulations on two duplex RNA fragments, each having a length of 11 basepairs (Fig. 1). They correspond in sequence to the Loop E motifs of 5S rRNA from E. coli (Ebac) and from spinach chloroplast (Echl). The fragments consist of seven consecutive non-Watson-Crick basepairs capped by a standard (Watson-Crick) basepair on one end and a wobble G/U basepair on the other. A summary of the simulations we carried out is provided in Table 1. A total of 83.7 ns of simulations were carried out.
TABLE 1.
Summary of simulations carried out in this work
| Name of simulation | Length of simulation (ns) | Loop E from: | Presence of ions |
|---|---|---|---|
| EbacMg | 9.7 | E. coli | 5 Mg2+ and 10 Na+ |
| EbacNa1 | 8.8 | E. coli | 20 Na+ |
| EbacNa2 | 8.8 | E. coli | 20 Na+ |
| EchlMg | 10 | Spinach chloroplast | 5 Mg2+ and 10 Na+ |
| EchlNa | 7.4 | Spinach chloroplast | 20 Na+ |
| Nosalt-Ebac | 10 | E. coli | Neutralising plasma |
| Nosalt-Echl | 5 | Spinach chloroplast | Neutralising plasma |
| Ebac-refold with Mg2+* | 4 | E. coli | 5 Mg2+ and 10 Na+ |
| Ebac-refold with Na+* | 6 | E. coli | 20 Na+ |
| Ebac-relax with Na+† | 3.5 | E. coli | 20 Na+ |
| 400K_Ebac-ntp‡ | 2.5 | E. coli | 5 Mg2+ and 10 Na+ |
| 400K_Echl-ntp‡ | 3 | Spinach chloroplast | 5 Mg2+ and 10 Na+ |
| 400K_Echl-ntv‡ | 5 | Spinach chloroplast | 5 Mg2+ and 10 Na+ |
This simulation has been started with partly unfolded geometry obtained at 1 ns of the no-salt simulation.
This simulation has been started with narrow deep groove geometry obtained in the course of the Ebac-refold with Mg2+ simulation.
Elevated temperature simulation.
Bacterial Loop E
The first molecule (referred to as ”Ebac,” Fig. 1, left panel) was taken directly from the 1.5 Å resolution crystal structure of a fragment of E. coli 5S rRNA corresponding to Loop E (NDB file URL064), omitting two unpaired, overhanging guanines present in the crystal (Correll et al., 1997). The Ebac molecule differs from the 5S rRNA bacterial consensus sequence only by reversal of the G79-C13 Watson-Crick basepair. (The numbering is that of the E. coli sequence.) Bacterial Loop E motifs are symmetrical “internal loops” comprising seven consecutive non-Watson-Crick basepairs that display twofold rotational symmetry about an axis passing through the fourth basepair (Fig. 1, A101/G75), which is a symmetrical water-inserted, cis Watson-Crick A/G pair (Leontis and Westhof, 1998a). The three basepairs on either side of the central basepair form isosteric 3-bp submotifs consisting of trans Hoogsteen/Sugar-edge (sheared) A/G, trans Watson-Crick/Hoogsteen (“reverse Hoogsteen”) U/A, and cis bifurcated basepairs. In Fig. 1, we use a recently introduced method for annotating the non-Watson-Crick basepairs (Csaszar et al., 2001). Each submotif is characterized by substantial cross-strand stacking of the conserved adenosines (“A-stack”) of the first two basepairs of each submotif (Correll et al., 1997, 1998, 1999; Dallas and Moore, 1997; Wimberly et al., 1993).
The crystal structure reveals ordered water molecules in the A-stack regions and a kink of the backbone at the adenine residue of the trans Watson-Crick/Hoogsteen U/A basepairs of each submotif. There are five hexacoordinated Mg2+ cations bound to the major (deep) groove of the Loop E crystal structure, interacting with bases and anionic phosphate oxygens. Three of these cations directly interact with the RNA atoms (inner-shell binding), and the remaining two interact with the solute molecule via water molecules (outer-shell binding). Two of the Mg2+ ions in the crystal are closely spaced (2.7 Å) and may represent a single cation with two alternating binding sites (Hermann and Patel, 1999). Nevertheless, when carrying out simulations, we initially included all ions according to the crystal data, with the expectation that the simulation would redistribute them and release excessive ions (Hermann et al., 1998). We initially carried out three simulations of this molecule (Table 1): Simulation EbacMg (9.7 ns, all five “crystal” Mg2+ cations present together with 10 additional Na+ to achieve charge neutralization), simulation EbacNa1 (8.8 ns), and simulation EbacNa2 (8.8 ns). In simulations EbacNa1 and EbacNa2, the Mg2+ cations were removed and the molecules were neutralized solely by Na+ ions. For the EbacNa1 and EbacMg simulations the xleap module of AMBER was used to place the Na+ cations around the solute molecule at positions of lowest electrostatic potential. For simulation EbacNa2, the Na+ cations were initially shifted deep into the solvent, at least 5 Å away any solute atom, to produce an entirely different initial Na+ distribution compared with EbacNa1.
Spinach chloroplast Loop E
The other molecule studied, Echl, differs from Ebac at three basepairs (Fig. 1, right panel). The sequence is that of the Loop E region of spinach chloroplast 5S rRNA. It contains five consecutive adenines in one of its strands and thus appears very different, at least superficially, from the Loop E of evolutionarily related bacteria. No atomic resolution experimental structure is available for this molecule. However, on the basis of careful considerations of isostericity, we proposed that the structure of Loop E of spinach chloroplast should be similar to that of bacterial Loop E. Thus, the corresponding bases should form the same type of non-Watson-Crick basepairs. Therefore we paired C74 and A102 in the chloroplast sequence in a manner that is isosteric to bifurcated U74/G102 in the crystal structure (URL064) and likewise A76 with A100 in the same bifurcated geometry observed for G76/G100 in the crystal structure (Leontis and Westhof, 1998a). A78 and A98 were paired to be isosteric to trans Hoogsteen/Sugar-edge A78/G98 (Figs. 1 and 2). trans Hoogsteen/Sugar-edge A/A isosteric to A/G is known from several crystal structures (Ban et al., 2000; Carter et al., 2000; Cate et al., 1996; Harms et al., 2001; Ramakrishnan and Moore, 2000; Schluenzen et al., 2000; Wimberly et al., 2000). This procedure defined the initial geometry of the altered basepairs of chloroplast Loop E, which are shown next to the corresponding E. coli basepairs in Fig. 2. Two simulations, designated EchlMg (10 ns) and EchlNa (7.4 ns), were carried out. In the first simulation, five Mg2+ cations were included and in the second only neutralizing Na+ ions were utilized, initially positioned at the most negative sites around the molecule. For chloroplast Loop E simulations, the starting positions of Mg2+ were taken from the bacterial Loop E crystal structure.
FIGURE 2.

Structures of corresponding non-Watson-Crick basepairs in the bacterial Loop E and in spinach chloroplast Loop E. The bacterial basepairs (left) are taken from the high-resolution crystal structure (NDB file URL064) whereas the corresponding chloroplast basepairs are shown as initially modeled based on isosteric considerations (Leontis and Westhof, 1998b). (Top) Cis bifurcated G/U and A/C. Middle two rows: Water-inserted cis Watson-Crick G/A followed by cis bifurcated G/G and A/A. (Bottom) trans Hoogsteen/Sugar-edge (sheared) G/A and A/A.
Overall structure and stability of the simulated molecules
Most simulations produced very stable trajectories with low root mean square deviations (RMSd) with respect to the starting structures (Fig. 3, a and b). The smallest RMSd was observed for the EbacMg simulation. Instability developed in the EchlMg simulation after ∼5 ns, as will be described in detail below.
FIGURE 3.

Loop E dynamics. Root mean square deviations (RMSd) and selected H-bond distances along the trajectories. (a) and (b): RMSd of the simulated structures with respect to the starting geometries. The “Ebac refold with Mg2+” trajectory RMSd is calculated with respect to the crystal geometry and will be discussed later. RMSd for the Echl sequence is slightly increased by unoptimized initial geometries of three substituted basepairs. (c) EbacNa1 simulation: the U77/A99 basepair exhibited two major opening events (at 2.6–4.3 ns and 4.8–7.7 ns) while the symmetry-related A73/U103 was entirely stable. (d) EchlMg simulation: opening event of A76-A100 basepair correlated with release of Mg4 at 4.3 ns and major changes of the deep groove (see the text for further details).
Major groove width
The individual simulations can be well characterized by the width of the major (deep) groove. The EbacMg simulation shows a subtle narrowing of the deep groove compared to the crystal structure (Table 2). Reduction of the P75 to P98 interphosphate distance leads initially to some asymmetry in the groove width, not seen in the crystal, which however disappears by the end of the simulation (Table 2). The absence of Mg2+ cations in simulations EbacNa1 and EbacNa2 caused a substantial widening of the major groove despite penetration of Na+ ions into the areas previously occupied by Mg2+ (see below). The difference is typically 2 to 3 Å compared to the EbacMg simulation. The width of the deep groove shows substantial variability along the trajectory, i.e., the deep groove is “breathing.” When considering a series of structures averaged over 0.5–1.0 ns intervals, we found deep groove widths ranging from essentially the crystal values up to a widening of ∼4 Å (groove width is defined using four P-P distances; see Table 2).
TABLE 2.
Interphosphate distances (angstrom) across the major groove of structures averaged over selected periods. The last column shows the averaged difference compared to the crystal
| Simulation | Averaging period (ns) | P72 – P101 (Å) | P73 – P100 (Å) | P74 – P99 (Å) | P75 – P98 (Å) | Relative width (Å) |
|---|---|---|---|---|---|---|
| X-ray | — | 11.0 | 8.6 | 7.9 | 10.4 | 0 |
| EbacMg | 4.0–5.0 | 8.6 | 7.4 | 7.7 | 10.3 | −1.0 |
| EbacMg | 7.0–8.0 | 8.6 | 7.6 | 9.1 | 11.7 | −0.2 |
| EbacMg | 8.0–9.3 | 10.8 | 8.8 | 8.2 | 10.7 | +0.2 |
| EbacMg | 9.3–9.7 | 13.2 | 10.1 | 9.1 | 10.5 | +1.3 |
| EbacMg | 2.0–9.7 | 9.6 | 7.9 | 8.3 | 10.8 | −0.5 |
| EbacNa1 | 4.0–4.5 | 12.2 | 11.1 | 10.6 | 12.2 | +2.1 |
| EbacNa1 | 5.0–5.5 | 14.0 | 12.1 | 11.2 | 13.2 | +3.2 |
| EbacNa1 | 6.5–7.0 | 14.1 | 13.0 | 13.2 | 15.1 | +4.4 |
| EbacNa1 | 7.0–7.5 | 11.4 | 10.7 | 11.8 | 13.8 | +2.5 |
| EbacNa1 | 2.0–8.8 | 12.1 | 10.2 | 10.2 | 12.5 | +1.8 |
| EbacNa2 | 4.7–5.2 | 11.7 | 9.8 | 9.9 | 12.4 | +1.5 |
| EbacNa2 | 5.5–6.0 | 10.3 | 8.3 | 7.8 | 11.0 | −0.1 |
| EbacNa2 | 7.0–7.7 | 9.5 | 8.6 | 10.0 | 12.7 | +0.7 |
| EbacNa2 | 2.0–8.8 | 11.9 | 10.3 | 10.5 | 12.1 | +1.7 |
| EchlMg | 2.0–10.0 | 8.7 | 6.9 | 8.2 | 10.7 | −0.9 |
| EchlNa | 2.0–7.4 | 10.1 | 6.9 | 6.4 | 6.8 | −1.9 |
The chloroplast simulation EchlMg initially shows a modest narrowing of the deep groove compared to the EbacMg simulation. After ∼4.5 ns, the deep groove, measured from P75 to P98, widens very substantially, after a considerable Mg2+ relocation event. The P75–P98 distance temporarily increased to 16 Å, and this widening was only partly repaired by the end of the simulation. We will comment on this development in detail below. During simulation EchlNa, carried out in the absence of Mg2+ cations, the deep groove narrowed significantly relative to the crystal structure (Table 2), in contrast to developments in the two EbacNa simulations. Moreover, the groove width developed an asymmetry that is related to the H-bonding of some of the mutated basepairs (see below). This narrowing is accompanied by the tight binding of three adjacent Na+ cations in the deep groove (see below).
To provide additional structural information, the Supplementary Material section of this article presents PDB files of averaged simulated structures for key simulations and selected helical parameters (Fig. S4) calculated via the 3DNA code (Lu et al., 2000). Definition of structural parameters for non-Watson-Crick segments is, however, less straightforward compared with regular Watson-Crick segments, and there is no consensus yet on how to treat the parameters of steps with noncanonical pairs consistently. Nevertheless, the structural data clearly illustrate substantial variability of the helical twist along the Loop E, especially in the A-stack regions, and a clear structural similarity between the bacterial and chloroplast Loop E molecules.
To highlight the dynamics of the molecules, we carried out a principal component analysis (PCA) of the simulated trajectories. PCA identifies the main collective deformation modes of the simulated molecules (Sherer et al., 1999; Wlodek et al., 1997).
The leading PCA modes are depicted and commented on in the Supplementary Material. PCA analysis highlights substantial oscillations of the interphosphate distances across the deep groove as described in the main text. In addition, PCA indicates that these deep groove width changes are correlated with bending motions between the central non-Watson-Crick and flanking canonical segments (Figs. S1–S3). The bending is primarily localized to the outermost A104/G72 and G98/A78 sheared basepairs of the non-Watson-Crick segment, i.e.; the A-stacks. This motion in fact resembles the dynamics of DNA zipper motifs (Spackova et al., 2000) where dynamical bending occurs at the junction between the central zipper and flanking Watson-Crick segments and is localized exclusively to the sheared G/A basepairs. The sheared G/A basepair is intrinsically very flexible (Spackova et al., 2000; Sponer et al., 1996), and the high degree of its stacking with adjacent basepairs (Chou and Chin, 2001) likely helps to mediate the intersegment bending motion. Nevertheless, the eigenvalues of the leading PCA components of the present Loop E simulations are quite small (around 0.2) indicating that there is no single dominant mode of the motion. In fact, when visually inspecting the trajectories (see Supplementary Material), we have clearly seen the groove width oscillations. However, the coupled bending motions suggested by the filtered PCA trajectories were almost unnoticeable in real trajectories.
Basepairing, water bridges, and ordered hydration in bacterial Loop E
The standard basepairs were remarkably stable in all simulations, except that the terminal basepairs showed somewhat increased fluctuations, as is usual in simulations. Thus standard basepairs are not discussed in the following.
The Ebac crystal structure contains the following seven non-Watson-crick basepairs (Fig. 1), forming two submotifs (see above): A104/G72 and A78/G98 form trans Hoogsteen/Sugar-edge (sheared) basepairs with A(N7)-G(N2) and A(N6)-G(N3) H-bonds. U103/A73 and U77/A99 form trans Watson-Crick/Hoogsteen basepairs with U(O2)-A(N6) and U(N3)-A(N7) H-bonds. G102/U74 differs from the normal wobble arrangement by forming a cis bifurcated interaction that is isosteric to G76/G100. U74(O4) H-bonds with N1 and N2 of G102, and in the crystal structure, water molecules appear to bridge between G(O6) and U(C5) and between G(N2) and U(N3). In G76/G100, G100 is equivalent to U74. G100(O6) forms bifurcated H-bonds to G76(N1) and G76(N2) and water molecules bridge between G76(O6) and G100(N7). Another water bridge occurs between G100(N2) and G100(N1) in the crystal structure. The G75/A101 basepair is a water inserted cis Watson-Crick pair involving a single base-to-base H-bond, A(N6)-G(O6), and a water bridging between A(N1) and G(N1) (Fig. 2).
In the 9.7-ns magnesium-containing simulation, EbacMg, the non-Watson-Crick basepairs were remarkably stable. In agreement with the crystal data, water bridges in the G75/A101 and G76/G100 basepairs (Fig. 4, a and b) are stable during the simulation. These hydration sites show close to 100% occupancies and prolonged residency times of individual water molecules ranging between 0.5 and 0.8 ns compared with residency times of 0.05 to 0.4 ns for ordinary hydration sites (Auffinger and Westhof, 2001; Csaszar et al., 2001; Feig and Pettitt, 1998, 1999; Nagan et al., 1999; Schneider et al., 2001; Spackova et al., 2000).
FIGURE 4.

Selected hydration patterns (stereo) seen in EbacMg simulation. Note that intramolecular water geometries appear deformed due to some period of time-averaging. (a) Water-mediated cis Watson-Crick basepair from average MD structure: right, residue G75; left, residue A101. (b) Water-mediated cis bifurcated basepair from average MD structure: right, residue G76; left, residue G100. (c) Typical hydration event in the five-center G102(O6) hydration pocket (see the text). Two water molecules (each with a residency time of 4 ns) are bound to G102(O6) while establishing additional contacts to U103(O4) and C5(U74). The third water molecule on the bottom of the picture is not bound to G102(O6) but nevertheless oscillates in the region (contacting other groups) for 1 ns.
In contrast to the crystal data, we did not identify in the simulation any substantial water density corresponding to a water bridge between G102(N2) and U74(N3) in the shallow (minor) groove of the cis bifurcated G102/U74 pair. Rather, there is a disordered hydration site with residency times averaging only ∼0.05 ns. In fact, the water molecule seen in the crystal cannot be oriented correctly to H-bond simultaneously with either of the hydrogen atoms of the G102(N2) amino group and U74(N1). However, a complex five-center hydration pocket centered around G102(O6) is identified in the deep (major) groove. We found a number of long-residing water molecules in this region of the RNA with residency times up to 4 ns (Fig. 4 c). Typically, two long-residing water molecules are bound to the primary G102(O6) hydration position simultaneously. The hydration of G102(O6) was sometimes interrupted for periods of approximately 0.05–0.1 ns, during which individual water molecules moved as far as 6 Å away from G102(O6) before returning again. While a water molecule remained bound to G102(O6), it typically alternated among four secondary binding sites, namely A73(O5′), A73(O2P), U103(O4), and U74(C5), with movements occurring on a timescale of 0.5 to 0.8 ns. Additional water molecules were often immobilized in the area up to 3 to 6 Å away from G102(O6), as shown in Fig. 4 c. Electron density corresponding to this hydration site is visible in the crystal, but it was not assumed to be of primary importance (Correll et al., 1997). Alteration of several secondary binding sites may broaden the experimental electron density.
Major hydration sites were seen in the upper A-stack (Fig. 5 a). The first one, as in the crystal structure, is between G72(N2) and A104(O2P) with residency times of 0.5–0.8 ns. At the other edge of G72, atoms G72(O6), G102(O2P), and U103(O2P) form a three-center hydration pocket with occupancy close to 100% and residency times up to 2 ns. We did not identify a primary binding site in this case and, in fact, two long residing water molecules typically occupy the pocket simultaneously. For example, we observed a single water molecule bound for 2 ns between G72(O6) and G102(O2P) with a short 0.3 ns switch to U103(O2P). During the same period U103(O2P) was hydrated by another water molecule with a partial binding to G72(O6). In the other A-stack, a water molecule was localized between N1 and N2 of G98, with residency times of 0.5–0.8 ns (Fig. 5 c). In this case, Mg2+ binding prevented hydration of G98(O6).
FIGURE 5.

Examples of sequence-dependent ordered hydration patterns recurrently seen in A-stacks in different simulations. (a) Upper A-stack, EbacMg simulation; (b) upper A-stack, EchlNa simulation; (c) lower A-stack, EbacMg simulation; and (d) lower A-stack, EchlNa simulation.
A weak hydration site was seen in the U77/A99 pair, situated between U77(O2) and A99(N6). While the residency times of individual water molecules were low (0.05–0.1 ns), the occupancy is also reduced (only ∼70%). Furthermore, this hydration site does not substitute for a conventional H-bond between U77(O2) and A99(N6). In fact, A99(N6) does not have properly oriented hydrogens for optimal water binding. Thus it is not a water-mediated basepair. A similar site (out of the baseplanes) developed in the symmetry-related A73/U103 basepair.
All basepairs remained essentially planar in the Ebac simulations, with the exception of the trans Watson-Crick/Hoogsteen pairs, U103/A73 and U77/A99. These two basepairs showed a moderate tendency to buckle with the basepair centers pointed toward the adjacent (sheared) G/A basepairs, which is likely due to an adjustment of base stacking. Some nonplanarity is seen also in the crystal structure, especially for the lower A-stack. Averaged structures of both G/A sheared basepairs, however, are planar. Note that sheared G/A basepairs are intrinsically nonplanar (in complete isolation), though with two symmetry-related minima that may result in planarity of the time-averaged structures (Spackova et al., 2000; Sponer and Hobza, 1994b; Sponer et al., 1996). Thus, the marked nonplanarity of this basepair observed in DNA structures (Chou and Chin 2001; Shepard et al., 1998; Spackova et al., 2000) was not seen either in the Loop E crystal structures or our simulations, which reproduced the crystal structures.
In the Supplementary Material section, we present tables (Table S2, a and b) with a complete set of averaged basepair H-bond lengths and their fluctuations calculated for the primary simulations. It is to be noted that except for the basepair opening events discussed in the text, all other basepairs showed only modest fluctuations, essentially similar to those reported, for example, in our preceding study of the beet western yellow virus (BWYV) frameshifting pseudoknot (Csaszar et al., 2001).
Bacterial Loop E in the presence of Na+
Removal of the Mg2+ cations (EbacNa1 and EbacNa2 simulations) did not affect the water bridges in the G75/A101 and G76/G100 basepairs, which remained intact. Conversely, no water bridge developed between G102(N2) and U74(N3), and only weak hydration remained between U77(O2)-A99(N6). The major hydration pocket around G102(O6) was substantially modified, however, due to a marked widening of the major (deep) groove (Table 2). For example, the A73(O2P)-G102(O6) distance increased from ∼6.0 Å to ∼8.0 Å, thus opening the hydration pocket. The region around G102(O6) remained hydrated in the absence of magnesium ions, but residency times of individual water molecules decreased to 0.1–0.4 ns, i.e., by an order of magnitude. In the upper A-stack, the 72(N2)-104(O2P) distance increased from 5.05 ± 0.47 Å to 5.47 ± 0.5 Å upon removal of magnesium (simulations EbacNa1 and EbacNa2, compared to simulation EbacMg). Then the water molecule originally bridging 72(N2) and 104(O2P) shifted closer to 104(O2P), providing space for an additional water molecule between 72(N1) and 72(N2) (very similar to that shown in Fig. 5 b). The residency times for both hydration sites are 0.5–0.8 ns. The tight binding 72(O6)-102(O2P)-103(O2P) hydration pocket disappeared.
Removal of the Mg2+ cations resulted in a minor increase in basepair H-bond fluctuations. The U77/A99 basepair exhibited two major opening events (at 2.6–4.3 ns and 4.8–7.7 ns) in the EbacNa1 simulation (Fig. 3 c). During these opening events, the U(N3)-A(N7) H-bond was disrupted while the N6-O2 H-bond remained intact. A water bridge formed between U77(N3)-A99(N7) which evidently stabilized the open state of this pair (Banavali and MacKerell, 2002; Cubero et al., 2000; Varnai and Lavery, 2002). Such opening events were not seen for the symmetry-related A73-U103 basepair or in the EbacNa2 and EbacMg simulations and are reminiscent of transient basepairing opening events we observed in nanosecond simulations of a frameshifting pseudoknot (Csaszar et al., 2001).
Noncanonical basepairing, water bridges, and ordered hydration in spinach Loop E
To set up the spinach chloroplast simulations, we replaced three non-Watson-Crick basepairs in the crystal structure of bacterial Loop E with isosteric equivalents suggested by molecular modeling (Leontis and Westhof, 1998b). As described above, the cis bifurcated C74/A102 basepair was modeled isosteric to U74/G102 and involves a contact between C74(N4) and A102(N1). Both the EchlMg and EchlNa simulations refined this geometry in such a way that the A102(N1)-C74(N4) distance stabilized at 3.1 Å, with an almost linear hydrogen bond (Fig. 6 a). The simulated basepair further shows a repulsive contact between the C74(C5-H5) and A102(H6-N6) groups with a C–N distance of 4.1 to 4.2 Å.
FIGURE 6.

Average geometries of those basepairs in chloroplast Loop E that differ from the consensus bacterial Loop E basepairs, as refined in the course of the MD simulations. (a) Bifurcated A102/C74, which corresponds to bacterial G102/U74; (b) A98/A78, which corresponds to bacterial G98/A78; (c) essentially unpaired A100/A76 in EchlMg simulation; and (d) well paired A100/A76 from the EchlNa simulation. A100/A76 corresponds to bacterial G100/G76.
The trans Hoogsteen/Sugar-edge (sheared) A78/A98 basepair adopted stable pairing in both simulations (Fig. 6 b), with H-bonding between A78(N6) and A98(N3) supplemented by an attractive A98(C2-H2)-A78(N7) contact with N … C and H … N distances of ∼3.4 Å and 2.60 Å, respectively. The basepair was firmly established around 2 ns into the simulation. The basepair was further stabilized by shortening of the A98(N6) to U77(O2P) distance from 5.6 Å at the beginning of the simulation to 2.9 Å to form an H-bond with N-H…O angle of (135–150)° and H … O distance of ∼1.9 Å. This altered A-stack was further stabilized by ordered hydration. A major single-water hydration site developed between G79(N7) and A78(O2P) in the EchlMg simulation, partly involving also A78(N7) (not shown). A related hydration site developed in the EchlNa simulation between A98(N1) and U77(O5′) (Fig. 5 d). Both sites exhibited water residency times ∼2 ns and were established once the basepairs stopped fluctuating after ∼1.5–2 ns.
Stabilization of the cis bifurcated A76/A100 basepair (corresponding to G76/G100 in the bacterial sequence) was also expected to occur via a bifurcated A100(N6)-A76(N1) contact (Fig. 2). However, the A100-A76 basepair failed to form a stabilizing H-bond in the presence of Mg2+ (Fig. 6 c). During the first 5 ns of the simulation, the A100(N6)-A76(N1) distance was ∼3.4 Å with the H62-N1 distance ∼2.6 Å. The A100(N7)-A76(N6) distance was ∼5.2 Å, and no water bridge was observed stabilizing the basepair. The basepair fluctuated and showed one major opening event correlated with a release of one of the bound Mg2+ cations into the solvent at 4.3 ns (see below). Shortly after release of the Mg2+ cation the part of the structure around ill-paired A76/A100 considerably widened. The deep groove locally reached a width of 16 Å with marked perturbation of the structure and then partly relaxed (see above) (Fig. 3 d). The A100(N6)-A76(N1) and A100(N7)-A76(N6) distances increased to ∼4.1 Å and 6.6 Å, respectively, after these changes. The A76/A100 basepairs adopted a considerably better geometry in the simulation EchlNa (Fig. 6 d), with the formation of an H-bond between A76(N1) and A100(N6). The A76(N6) and A100(N7) atoms also approach each other but stop short of completing a full H-bond with N … N distance of 3.6 Å. Rather surprisingly, no water mediation was seen. Forming the A100/A76 basepairs leads to a marked compression of the deep groove in this region of the molecule (Table 2).
To demonstrate that the A76/A100 basepair in the EchlMg simulation is not bound, we calculated the base-base interaction energy term for the geometry seen in the first part of the trajectory using the high quality quantum-chemical MP2/aug-cc-pVTZ method (Sponer and Hobza, 2000). The calculated base-base interaction energy was only −3.7 kcal/mol. Note that typical base-base H-bonding interaction energies range from −10 to −28 kcal/mol (Sponer et al., 2001). For comparison, complete optimization of this A-A basepair, obtained by removing all intermolecular constraints, leads to an interbase attraction of −11.8 kcal/mol and two full H-bonds, N1-N6 and N6-N7, corresponding to the trans Watson-Crick/Hoogsteen basepairing geometry. In fact, for the averaged A100/A76 basepair obtained from the EchlNa simulation we calculated an interbase interaction energy of −10.4 kcal/mol, not far from the optimal basepairing value.
The remaining basepairs of chloroplast Loop E are identical to the bacterial version and showed very similar behavior during the simulations. We observed the expected true water bridge between A101(N1) and G75(N1) and fluctuating water contacting U77(O2) and A99(N6). The EchlMg simulation revealed two hydration sites with full occupancy at G72: the G72(N2)-A104(O2P) bridge with water residency times of 1 to 2 ns, and the G72(O6)-A102(O2P)-U103(O2P) three-center pocket with water residency times of 0.4 to 3.5 ns. The hydration structure is fairly similar to that seen for the EbacMg simulation. The G72(O6)-A102(O2P) distance increased from ∼4.2 Å to 5.2 Å in the EchlNa simulation, accompanied by a weak (∼50% occupancy) G72(N2)-A104(O2P) hydration and fully occupied site G72(N2)-G72(N1) with residency times 0.1–0.4 ns.
All basepairs in the Echl simulations were essentially planar except for A73/U103 and U77/A99, which buckled exactly as in the Ebac simulations. In addition, buckling developed in the mutated trans Hoogsteen/Sugar-edge (sheared) A78/A98 basepair, in the EchlNa but not in the EchlMg simulation. The A78/A98 basepair buckled in the opposite direction to U77/A99. Note that the local variation of the A98 base position in the two simulations was also reflected by differences in ordered hydration sites stabilizing this region (see above).
In the initial homology analysis of the chloroplast Loop E molecule, we have also considered the option that some of the substituted bases can lead to formation of protonated basepairs (Bink et al., 2002; Jang et al., 1998; Pan et al., 1998). We found that no protonation is possible of A(N1), A(N3), or C(N3) while keeping the overall basepair arrangements similar or isosteric with the bacterial Loop E. As evident from Figs. 2 and 6, protonation of A76(N1) would impair any isosteric basepairing whereas protonation of A100(N1) would occur outside the pairing region. In the case of the A98/A78 basepair, all A(N1) and A(N3) positions are completely away from the basepairing region necessary for isosteric pairing. Finally, in case of the A102/C74 basepair, protonation of A102 would impair the basepairing while C74(N3) does not participate in the basepairing. In the modeled basepair C74/A102, the non-Watson-Crick geometry is a bifurcated one, and stable H-bonding is established without protonation of A or C. Formation of the protonated basepair would require flipping of the cytosine base around its glycosidic bond to unlikely syn conformation and its additional in-plane rotation, thus completely changing the local geometry. In other words, all protonations would change the shape of the molecule, and this likely is not compatible with maintaining of its function. We have no need to consider any base protonation as we found very plausible isosteric basepairing in all three substituted sites with canonical bases. We ultimately cannot rule out (based on the simulations) that a protonation in chloroplast Loop E occurs. However, we consider this option as very remote, and the shape of the molecule would not be conserved then. That would contradict the basic conclusion from previous phylogenetic analysis suggesting that essentially only isosteric substitutions are viable. In fact, in the C74/A102 basepair simple flipping of the cytosine base around its glycosidic bond would lead to a stable basepairing without the protonation, keeping the C(N4)-A(N1) H-bond and establishing a new one between A(N6) and C(N3). However, syn orientation of cytosine is very unlikely and also would lead to a complete interchange of the pyrimidine exocyclic groups (compared to U74) protruding into the grooves. We would like to specifically note that the wobble C/A(+) protonated basepair (Bink et al., 2002; Jang et al., 1998; Pan et al., 1998) is distinctly different from the bifurcated geometry we modeled as isosteric to the G/U bifurcated basepair of bacterial Loop E, and thus is not suitable for the Loop E segment. Although the isosteric modeling does not suggest adenine protonation, it is entirely possible that some of the adenines may be protonated at lower pH, especially those sites not involved in basepairing. The negative potential around the molecule may increase the pKa values for adenine protonation. Actually, increased pKa values (4.8–5.8) of eight adenines participating in the 6 bp non-Watson-Crick internal loop of domain B of the hairpin ribozyme have been recently reported. Nevertheless, even in this case no protonated basepairs are seen (Ravindranathan et al., 2000). As we have shown elsewhere (Leontis and Westhof, 2001), any two bases can basepair stably in RNA, utilizing a number of different geometries. For C/A or A/A basepairs, a small number of these geometries require protonation, but most do not.
Dynamics of Mg2+ cations
The starting structure in simulation EbacMg contained five Mg2+ cations, those found in the crystal structure, URL064 (Fig. 7). Mg1 has water mediated contacts to G106(O6), G105(O6), and G105(N7) and is entirely stable in the simulation. Mg2 forms an inner-shell contact to A101(O2P) while Mg3 forms an inner-shell contact with G100(O2P). The crystal distance between these two Mg2+ ions is only 2.7 Å. Not surprisingly, these cations separated during the simulation, to a distance of 6.4 Å, though they remained coordinated to the same phosphates (Hermann and Patel, 1999). This exerted some effect on the phosphate positions, initially producing an asymmetry of the interphosphate distances compared to the crystal, which disappeared, however, by the end of the simulation (see above). Mg4 is initially bound through water molecules to G75(N7), G76(O6), U74(O2P), G75(O2P), and A99(O2P). It temporarily lost contact with G75(N7) and G76(O6) between 8.8 and 9.3 ns and moved a little toward the solvent, but then it returned to its original position. Its binding to A99(O2P), U74(O2P), and G75(O2P) was not affected by this event. The return of the cation could still be due to the nanosecond timescale of the simulations. Nevertheless, the fluctuation could indicate that this cation is relatively less stable compared to the other magnesium binding positions. The cation has enough space to move along and away from the solute. Since we apply periodic boundary conditions, the cation can leave the primary box entirely; in addition, a 10-Å extension of the solvent box beyond the RNA molecule in all directions is sufficient for large-scale movement of the cation within the box. This was the largest fluctuation seen for Mg2+ cations in the 9.7 ns EbacMg simulation. Mg5 is directly bound to G98(O6) and is entirely stable over the course of the simulation.
FIGURE 7.

Position of five Mg2+ cations as seen in the Ebac crystal structure. Electrostatic potential map calculated at contour levels −20 kT (dark gray) and −18 kT (gray).
In the EchlMg simulation the magnesium ions were also positioned as in the crystal structure. As in the EbacMg, Mg1 has water mediated contacts to G106(O6) and G105(O6/N7), and its position during the simulation was entirely stable showing only a minor shift toward G105(N7/O2P). Mg2 forms inner-shell contact to A101(O2P) while Mg3 forms inner-shell contact with G100(O2P). Again, as in the EbacMg simulation, the Mg2–Mg3 distance increased in the course of the simulation (to 5.3 Å in EchlMg), while both magnesium ions remained coordinated to the same phosphates. Mg5, which is directly bound to G98(O6) in bacterial Loop E, does not remain close to A98(N6) in the chloroplast Loop E, but migrates to U77(O4) where it forms a stable inner-shell binding complex. Mg4, which is bound through water molecules to G75(N7) of the bacterial Loop E, fluctuates in chloroplast Loop E in its corresponding position near A76(N7) and is released to the solvent after 4.3 ns of simulation. This event is correlated with large fluctuations in the A76/A100 basepair (Fig. 3 d). After release of Mg4, the A76(N7) position was contacted by Mg5. The Mg4 cation returned to the RNA at 9 ns, adopting a new position between C74(O2P) and A99(O2P).
During the simulations, no exchange was observed of the water molecules in the first hydration spheres of any of the magnesium ions. This is entirely consistent with the fact that, for Mg2+, mean residence times of water in the first hydration shell are ∼1 microsecond (Burgess, 1988).
Extensive binding of structural Na+ cations
As in our preceding studies (Spackova et al., 2000; Csaszar et al., 2001), all occupancies and residency times reported here mean single site (atom) inner-shell Na+ binding events (with binding distances of ∼2.4 Å) while obviously neglecting subpicosecond fluctuations. It should be noted that some authors use less strict criteria to identify Na+ binding, including multiple-site or outer-shell binding and enhancing substantially their calculated occupancies. The concentration of cations in all our simulations is ∼0.15 M. We saw few Na+ binding events in the Mg2+ containing simulations, where 5 Mg2+ and 10 Na+ cations were present. In the simulation EchlMg, the best developed position of Na+ binding was detected at N1 of mutated A98 with a surprisingly high occupancy of 48%. Other contacts occurred at various O2P and O6 sites, such as G79(O6) 47% and A78 (O2P) 38%.
More extensive binding of Na+ cations occurred in the absence of Mg2+. The seven most prominent sodium binding sites seen during the first 5 ns of simulations EbacNa1 and EbacNa2 are summarized in Table 3. The EbacNa1 and EbacNa2 simulations resulted in similar distributions of bound Na+ despite the markedly different initial distributions of Na+ ions, as described above. Na+ ions show large mobility, some of them visiting 5 or 6 different solute atoms in simulation (Fig. 8).
TABLE 3.
Seven highest occupied Na+ binding sites in simulations EbacNa1 and EbacNa2 (over a 5-ns period)
| EbacNa1
|
EbacNa2
|
||||
|---|---|---|---|---|---|
| Na+ position | Occupancy % | Number of Na+ visiting the site | Na+ position | Occupancy % | Number of Na+ visiting the site |
| 101 A (N7) | 76.3 | 2 | 101 A (N7) | 71.5 | 2 |
| 72 G (O6) | 51.5 | 1 | 72 G (O6) | 29.3 | 1 |
| 75 G (N7) | 60.5 | 3 | 75 G (N7) | 57.3 | 2 |
| 102 G (O2P) | 46.6 | 1 | 102 G (O2P) | 29.3 | 1 |
| 102 G (N7) | 30.4 | 2 | 102 G (N7) | 31.9 | 1 |
| 105 G (N7) | 39.0 | 1 | 102 G (O6) | 17.3 | 1 |
| 100 G (N7) | 13.7 | 2 | 76 G (N7) | 53.6 | 3 |
FIGURE 8.

Sketch illustrating the degree of sampling of monovalent cations in the simulation. Example of relocations of one of the Na+ cations during a 5-ns portion of trajectory EbacNa1. The longest inner-shell binding (0.5 ns) occurred at the 106(N7) site.
In the chloroplast simulation EchlNa, four Na+ cations occupied the compressed major groove (see above) for almost the entire simulation. Three of them directly interact with mutated bases (Fig. 9), namely positions A102(N7), G75(N7)/A76(N7), and A98(N7), from 0.05, 0.4, and 2.0 ns into the simulation, respectively. The A102(N7) cation site was occupied by a single cation for the whole simulation. Around 7 ns into the simulation, cations residing at positions A76(N7)/G75(N7) and A98(N7) were released into the solvent and immediately replaced by other Na+ cations. Nevertheless, these did not penetrate as deeply into the groove, perhaps due to the very narrow groove geometry, remaining bound to A98(O2P) and G75(O2P)-A99(O2P). Yet another Na+ ion bridged phosphate atoms C74(O2P) and A99(O2P) from 0.45 ns into the simulation until 3.5 ns, when it was expelled. After this another sodium oscillated near the OP atoms of residues A73, C74, A99, and A100 until the end of the simulation.
FIGURE 9.

String of tightly bound Na+ cations stabilizing the narrow major groove conformation of chloroplast Loop E in absence of Mg2+. Substituted bases are highlighted.
A-stack motif backbone arrangement
The simulations essentially retained the A-stack backbone structure seen in the crystal, including the anomalous backbone torsion angle values of β = 70° (the usual value is 180° in A-type helices) and γ = 180° (usually γ = 60°) between nucleotides G72/A73 and G98/A99. An ∼30° difference occurred for the α angle (α = −100° in the A-stack whereas the common value is α = −70°). Both A-stacks cause compression of the major groove progressing in the 3′ direction and widening toward the 5′ end as measured with respect to the A-stack.
Electrostatic potential calculations
Molecular electrostatic potential calculations were carried out on the RNA by solving the nonlinear Poisson equation in the absence of salt. Inclusion of salt in the calculations reduces the depth of all minima in the potential energy, but their position and shape are essentially unchanged and therefore these results are not shown. For a more detailed analysis of the electrostatic potentials in RNA molecules see Chin et al., 1999 and Hermann and Westhof, 1998.
The most negative sites around the crystal geometry of Ebac occur in the deep (major) groove, as expected. The first negative peak forms at −21.6 kT with a broad negative region occurring at a depth of −20 kT (see Fig. 7 above). The Loop E deep groove has a substantially more negative electrostatic potential than that of the BWYV frameshifting pseudoknot, where the deepest minimum occurred at −17.5 kT, again using no salt conditions (Csaszar et al., 2001). The (hydrated) Mg2+ cations are sterically restricted to regions a little outside the most negative region, which is considerably deeper inside the groove. The movements of the Mg2+ cations inside the groove may also be restricted by electrostatic repulsion between proximal cations. The calculated potential was not found to be significantly different for the averaged structure obtained from EbacMg simulation, which exhibits three negative sites at a contour level of −20 kT to −20.5 kT that spread out into a wide negative region at −19 kT. One negative peak occurs at G102(N7), close to the Mg2 binding site. The most negative site is around G75(O6) which is close to the Mg4 site between atoms G75(N7) and G76(N7). These atoms are more accessible for Mg2+ binding than G75(O6). The third deep well occurs close to G100(N7). All of these negative peaks are deeper in the groove compared with the actual positions of the Mg2+ ions. Our results appear to well correlate with a Brownian-dynamics study by Hermann and Westhof (Hermann and Westhof 1998). In the simulations EbacNa, the most negative peak is shifted to −17.5 kT due to major groove widening.
For the starting structure for the chloroplast Loop E simulation we calculated the electrostatic potential minimum to be −17.3 kT in the major groove. The negative potential peak deepened in the course of the EchlMg simulation to −19.6 kT. There are again three negative sites visible at contour level −19 kT merging into a wide region at −18 kT contour level. The most negative site is around A102(N7), followed by a site near G100(N7). The less negative potentials compared to the EbacMg structure are due to the substitution of guanine by adenine in Echl. The most negative potential deepens to −22.3 kT in the simulation EchlNa. This is due to structural adjustments of the deep groove caused by formation of the Na+ spine (see above), leading to the most negative potential seen in all simulations. The deepest potential well occurs at A76(N7) and coincides with one of the Na+ binding sites. Other Na+ cations are also located in salient negative potential locations.
Simulations carried out at elevated temperatures
For a further assessment of the stabilities of Loop E motifs, we carried out three simulations at elevated temperature (see Table 1). During the 2.5 ns 400 K constant pressure simulation of the Ebac molecule carried out in the presence of Mg2+ ions, one terminal basepair was disrupted by 2 ns, perturbing two adjacent basepairs. All Mg2+ cations remained bound to the solute molecule. Similar perturbations at the other end of the molecule occurred during the 3 ns 400 K constant pressure simulation of Echl carried out in the presence of Mg2+.
During the 400 K constant volume simulation, also carried out in presence of Mg2+, little perturbation of the Echl system was observed during the first 2 ns. However, after 2 ns, a large instability in one canonically paired segment propagated into the non-Watson-Crick basepaired region, and by 5 ns essentially all basepairs were disrupted or perturbed, although the strands remained in contact. As all the instabilities were initiated at the terminal segments we could not determine the weakest basepairs within the non-Watson-Crick motifs.
Unfolding the Loop E in absence of salt
We also carried out a 10-ns simulation of Ebac under no-salt conditions with only explicit solvent molecules screening the phosphate repulsion (no added cations, see Methods). We observed a rapid widening of the major groove to ∼15 Å within the first nanosecond. The final major groove width of 20–22 Å was achieved by approximately 2 ns and was followed by no further changes. A number of basepairs adopted altered and more open geometries. In particular, the trans Watson-Crick/Hoogsteen U/A pairs transform into trans Sugar-edge/Hoogsteen (sheared) U/A pairs in which A(N6) is H-bonded to U(O2) and U(O2′) (see Fig. S5 in Supplementary Material). The bifurcated pairs also adopt geometries in the sheared family of geometries. Interestingly, all bases remain paired to their original partner until the end of the simulation. This demonstrates that Loop E motifs exhibit a structural resilience based on flexibility in the basepairing geometries that allows for a wide range of major groove widths. This result is also interesting in regard to possible pathways for unfolding of RNA molecules that contain such motifs.
The deep (major) groove of the Echl molecule also showed immediate widening during the 5 ns no-salt simulation we carried out. However, the basepairing and the A-stacks were largely disrupted/deformed. This may be partly attributed to the fact that the starting geometry for the chloroplast structure was not optimized, but likely also reflects the inherently weaker basepairing of the chloroplast Loop E sequence.
The purpose of carrying out the no-salt simulations was to test the flexibility of the molecule and to increase the rate of sampling of alternative geometries. Although the no-salt simulation might appear at first sight far-fetched or unrealistic, such simulations are justified as equally well as the more common simulations carried out at elevated temperature. Although the no-salt environment is not realistic, the solute molecule remains controlled by its internal forcefield and enveloped by solvent waters that continue to provide significant electrostatic screening and full solvent friction. Thus, the deformations are not uncontrolled distortions, and the molecule moves through a low free energy valley as defined by the forcefield. In addition, although true no-salt situation is only an idealized, limiting case, low-salt conditions are not unrealistic and the no-salt simulation actually should identify (in the initial stages) the path of structural changes upon reducing the electrostatic screening. Actually, in this study, we obtained more insights from the no-salt simulations than from the elevated temperature simulations.
Refolding the molecule by adding salt back
We selected the widened Ebac structure obtained after 1 ns of simulation in the absence of salt as the starting coordinates for a new simulation to test refolding induced by addition of 20 Na+ cations. The ions were added via the Leap module. Neutralization with sodium ions alone, however, did not initiate any refolding of the molecule during 3.5 ns, and the major groove remained as wide as 15 Å. When this was repeated in a subsequent simulation using 10 Na+ and 5 Mg2+ cations to neutralize the RNA, gradual major groove compression was achieved (cf. Fig. 3 a above). By the end of this simulation, the structure displayed the very narrow deep groove architecture previously seen only for Echl, narrower, in fact, than in any preceding simulation with Ebac. Most significantly, all the non-Watson-Crick basepairs returned to their crystallographic geometries. The Mg2+ cations were initially positioned several angstroms from the solute. Nonetheless, during the preequilibration minimization one of the Mg2+ ions established inner-shell binding with G75(O2P). (Such mobility during initial relaxation is never seen for Na+ cations.) This Mg2+ cation remained bound to this position during the entire 4-ns simulation. About 1 ns into the simulation, a hexahydrated Mg2+ bound to A73(O2P) and G100(O2P), pulling the two strands closer to each other. The cation was expelled back into the solvent at 3.5 ns, seemingly because the groove was already too narrow for its stable binding.
We used the last snapshot of the preceding simulation as the starting geometry for a new simulation in which all Mg2+ cations were removed and the solute was neutralized exclusively by Na+. After ∼2 ns of simulation the groove widened once again and the final outcome of the 3.5-ns simulation was very similar to simulations EbacNa1 and EbacNa2. Thus, the large-scale deformation induced by the no-salt simulation was completely repaired.
DISCUSSION
We have carried out a set of explicit solvent simulations of two Loop E motifs comprising seven consecutive non-Watson-Crick basepairs. Five simulations were utilized for basic characterization of the molecules while ten additional simulations were designed to verify selected results and to enhance sampling. The combined length of all simulations exceeds 80 ns.
Cation binding and major groove width
The major groove of bacterial Loop E (Ebac) shows a broad and deep minimum of electrostatic potential, which helps to understand the extensive binding of Mg2+ cations seen in the crystal structures (Correll et al., 1997; Hermann and Westhof, 1998; Lu and Steitz, 2000). The Mg2+ cations do not, however, bind directly to the most negative sites, as these are too deeply buried inside the groove. The chloroplast Loop E (Echl) shows, in the proposed Ebac crystal-like geometry, somewhat less negative electrostatic potential due to substitution of several guanines by adenines. Our work shows that the magnitude of the negative electrostatic potential in the major groove of Loop E is clearly regulated by the groove width. Narrowing of the groove substantially strengthens the negative potential, which is further enhanced by local geometry adjustments induced by tight cation binding (e.g., chloroplast Loop E in absence of Mg2+). When comparing structures with different deep groove widths, we did not find any salient geometrical parameter regulating the deep groove width, except for rather modest changes of backbone angles and, in the case of the no-salt simulations, changes in basepairing. Reversible changes of basepairing allow the maintenance of stable pairing in structures with extreme widening of the deep groove, as demonstrated by the no-salt simulations. We did not see larger changes in the shallow (minor) groove width.
Our simulation timescale does not guarantee a complete sampling. We thermally sampled within a range of a few kcal/mol of free energies in 10 ns as an ideal two-state system surmounts ∼5 kcal/mol each 1–1.5 ns (unless a highly improbable sequence of events occurs). Nevertheless, some conclusions can be drawn. Full binding of the Mg2+ cations stabilizes the major groove width at the crystal (intermediate) value and rigidifies the bacterial Loop E motif. In the absence of Mg2+, Loop E motifs show unprecedented degrees of inner-shell binding of Na+ cations and can adopt a wide range of major groove widths, depending on the base sequence and detailed balance of the counterion distribution. The Na+ cations are capable of penetrating into the most negative regions inside the major groove, where multiple binding sites display inner-shell occupancies above 50% (Figs. 8 and 9, Table 3). In simulations of Echl, we observed a narrowing of the major groove that essentially collapsed around a string of Na+ cations bound almost permanently on the simulation timescale. We are not aware of any preceding MD study showing such a high Na+ coordination and large structural effect on nucleic acid geometry, except for simulations carried out for guanine quadruplex molecules (Spackova et al., 1999, 2001). One simulation suggests that a partial occupancy of the major groove by Mg2+ may support major groove compression in the case of Ebac. Nevertheless, the Ebac simulations carried out in the absence of Mg2+ typically widen the deep groove though there is extensive Na+ binding in the deep groove. The base changes around the lower A-stack of the Echl sequence clearly support (nonsymmetrical) narrowing of the deep groove compared to the Ebac sequence.
When assessing the significance of modeling of cation binding, one has to consider two limitations of current techniques. First, the pair-additive forcefield provides only an approximate description of the cation interactions, neglecting substantial polarization and charge transfer effects (Haider et al., 2002; Sponer et al., 2000a, 2000b). These include strong polarization of the first-shell water molecules around Mg2+ and polarization strengthening of certain basepairs (Sponer et al., 2000b). The neglected polarization effects should influence the binding strength and especially the balance of interactions between Mg2+, solvent, and various solute groups (Sponer et al., 2000b). The simulations nevertheless accurately represent the electrostatic effects, which, for the present system and timescale, appear to be the dominating contributions. In the case of the Na+ cations, we suggest that the outcomes of simulations are considerably less affected by forcefield approximations.
The second limitation is the nanosecond timescale of the simulations. The timescale is not sufficient to achieve a thorough sampling of the motions of the magnesium hexahydrates. Therefore, when making such simulations, we are largely restricted to investigate the structural effect of Mg2+ in the experimentally determined sites and coordination patterns. We cannot even study exchange between inner- and outer-shell binding. As noted above, the typical timescale for an exchange of ligands in the first coordination shell of magnesium is around 1 microsecond. Nonetheless, the simulations appear to reproduce the structural effects of the Mg2+ cations bound in the known x-ray geometries of the bacterial Loop E. More complicated is the evaluation of the chloroplast Loop E simulation in the presence of Mg2+. Due to lack of experimental information about Mg2+ locations in chloroplast Loop E, we had to initiate the simulations with exactly the same Mg2+ distribution as seen in the bacterial Loop E crystal. Obviously, the optimal binding of Mg2+ to the chloroplast Loop E sequence would likely differ from that of bacterial Loop E, but the simulation timescale is not sufficient to achieve any marked redistribution of the divalent cations except for elimination of entirely unstable binding positions. The unrelaxed Mg2+ binding pattern can easily lead to deformation of the spinach chloroplast Loop E structure.
In contrast, the simulations achieve a rather significant sampling of the Na+ binding positions, with a number of sodium exchange events observed in common binding sites, as previously noticed also for simulations of the RNA frameshifting pseudoknot (Csaszar et al., 2001). This is illustrated, among other observations, by the very similar outcomes of the EbacNa1, EbacNa2, and Ebac-relax simulations, which started from entirely different initial Na+ distributions. We nevertheless do not suggest that the Na+ distributions seen on a scale of ∼10 ns represent a fully equilibrated distribution.
Variability of ordered hydration sites
The present simulations, together with our preceding studies and some other reports (Csaszar et al., 2001; Guo et al., 2000; Hermann et al., 1997; Nagan et al., 1999; Schneider et al., 2001; Spackova et al., 2000, 2003; Starikov and Nilsson, 2002), provide an interesting insight into specific RNA and DNA hydration. In MD simulations, common hydration sites in DNA and RNA molecules exhibit short water residency times on the order of 0.05 to 0.3 ns. However, the complex shapes of RNA motifs are often accompanied by formation of unusual hydration sites with long-residing water molecules and essentially 100% site occupancy. The simulations thus complement the information provided by x-ray crystallography, as x-ray experiments do not provide the timescale and fluctuations of individual hydration events. The complex hydration sites typically involve strong H-bond acceptors as they often coincide with regions of very negative molecular electrostatic potentials. Also important for formation of hydration sites are steric effects, such as restricted space in hydration pockets, optimal intergroup distances, and places with hindered access. The highly structured hydration also competes with cation binding. Thus, the steric details of the site may be quite important for discrimination between ion and water binding. One type of anomalous hydration is represented by water mediated non-Watson-Crick basepairs (Correll et al., 1997; Holbrook et al., 1991), as studied here and previously in detail by Suhnel's group (Brandl et al., 2000; Schneider et al., 2001). Typical water residency time in water-mediated basepairs is 0.5–0.8 ns. We have confirmed the presence of two water-mediated basepairs seen in the crystal, namely G75/A101 and G76/G100, with residency times of individual bridging water molecules ranging between 0.5 and 0.8 ns. The simulations argue against the third water bridge suggested by x-ray crystallography, namely G102(N2)-U74(N3). The G102/U74 basepair retained its x-ray geometry, but without developing a comparable water bridge. In fact, when considering the positions of hydrogen atoms, the crystal geometry is unsuitable for formation of a water bridge. Water bridges may also involve phosphate and sugar atoms and in this case residency times of several ns can be achieved (Csaszar et al., 2001). A more complicated picture of hydration is observed in various hydration pockets, which consist of three to five closely spaced acceptor/donor groups (Figs. 4 and 5). In these pockets, water residency times can easily extend to the order of 1 to 5 ns. In some of the hydration pockets, the water molecule can adopt a well determined geometry, as in phosphate clusters in the BWYV RNA pseudoknot (Csaszar et al., 2001). In other pockets there is one primary binding atom (O6 of G102 in the Loop E molecule) while there is a faster exchange of the water interactions with the secondary hydration sites. Some hydration pockets can embed rattling water molecules with no dominant binding atom and disordered water orientation, as seen in the junction site of the BWYV pseudoknot (Csaszar et al., 2001). The formation and detailed structure of long-residing hydration pockets is intimately connected with local conformational variations of the solute molecule. Thus, a given site may develop distinct hydration patterns depending on its local geometry, as seen for hydration pockets studied in the Loop E, in a DNA zipper molecule (Spackova et al., 2000), and in DNA-DAPI minor-groove binding complexes (Spackova et al., 2003). Changes of local solute structure cause shifts of the hydration sites and may even abolish the long-residency hydration, as seen above for the pocket around G102(O6). Formation of anomalous hydration sites readily occurs even in duplex regions, provided non-Watson Crick basepairing creates a complex molecular shape (Spackova et al., 2000). Evidently, hydration of non-Watson-Crick duplex segments can be more complex compared with Watson-Crick double helices analyzed in detail by other groups (Auffinger and Westhof, 2000, 2001; Feig and Pettitt, 1998, 1999).
Base mutations
The simulations were used to refine a homology model of the structure of spinach chloroplast 5S Loop E, which differs from the consensus bacterial Loop E at three basepair positions. The model was constructed on the basis of isosteric substitutions suggested by phylogenetically based sequence analysis (Leontis and Westhof, 1998b). This represents a test of the idea that all-atom simulations can become a tool to predict and refine the geometries of conserved RNA motifs comprising isosteric basepairs in the absence of atomic resolution experimental data.
The simulations swiftly identified meaningful geometries for two mutated basepairs. The A78/A98 basepair is stabilized by an A78(N6)-A98(N3) H-bond supplemented by an attractive C-H … N type contact between A98(C2) and A78(N7). The basepair is further stabilized by H-bonding between A98(N6) and U77(O2P) and by ordered long-residency hydration. The C74/A102 basepair shows a single A102(N1)-C74(N4) H-bond complemented by a rather repulsive C74(C5H5)-A98(N6H6) interaction. This contact could be improved considering the partial sp3 pyramidalization of the adenine amino group, exposing the lone electron pair above the amino group nitrogen to the C-H group and eliminating the interhydrogen repulsion. The adenine nucleobase is well known as the possible site for amino-acceptor interactions, since the negative region above its amino nitrogen is more developed compared with guanine and cytosine (Luisi et al., 1998; Sponer and Hobza, 1994a, b; Sponer et al., 1996, 2001). Although the contemporary forcefields provide certain flexibility for amino group hydrogens, true pyramidalization effects are still neglected (Sarzynska et al., 2000; Sponer et al., 2001).
The simulation of chloroplast Loop E carried out in the presence of Mg2+ did not result in pairing of A76 with A100. There is no H-bonding and no water molecule bridging the bases, and the calculated interaction energy between the bases was found to be negligible. However, in the absence of Mg2+, this basepair swiftly adopted a reasonable geometry with a full A76(N1)-A100(N6) H-bond and a longer A76(N6)-A100(N7) contact. We assume the second geometry represents the genuine structure of the A76/A100 basepair in the chloroplast Loop E motif for the following reasons. As explained above, the Mg2+ distribution around the chloroplast Loop E has been taken from the bacterial Loop E crystal and likely does not represent an equilibrated Mg2+ distribution for chloroplast Loop E. As the simulation timescale is inadequate to achieve proper redistribution of the Mg2+ ions, the bacterial Loop E Mg2+ distribution may cause deformations of the spinach chloroplast Loop E molecule. We assume that this is the most likely explanation of the lack of A76/A100 pairing and the large structural perturbation at the A76/A100 basepair that propagates into the adjacent region seen in the chloroplast Loop E in presence of Mg2+. Therefore, one has to be very careful when attempting simulations with divalent cations, as they are unable to adopt proper position and binding on presently accessible timescales and may exert large-scale perturbations of the solute structure. Thus, we suggest that the Na+ simulation of chloroplast Loop E is considerably more realistic. Further, we note that the correct A76/A100 pairing requires narrowing of the major groove, which may be a factor opposing extensive Mg2+ binding in this region. Given the limited Mg2+ sampling, our simulations do not argue against Mg2+ binding to the Echl sequence; they do, however, indicate that the Mg2+ binding pattern of the Echl sequence is locally different from that seen for Ebac.
CONCLUDING REMARKS
The present explicit-solvent MD simulations reveal that the non-Watson-Crick RNA Loop E regions comprise a wide variety of highly specific hydration sites with residency times of individual water molecules 10–20 times longer compared with hydration sites commonly reported in MD simulations to date. The fine structure of these hydration sites is interrelated with the local conformational variations and substates adopted by the RNA motif as evidenced, for example, in the A-stacks of the Loop E motif. We suggest that long-residency hydration sites, although almost unnoticed in MD simulations to date, frequently accompany RNA motifs and complex RNA tertiary structures. Revelation of such hydration sites requires expansion of the simulations significantly beyond one nanosecond and careful analysis of the water binding at individual sites.
The x-ray structure of bacterial Loop E is well maintained in the simulations carried out in the presence of the experimentally observed hexacoordinated magnesium cations. In the absence of the magnesium cations, the Loop E motif reproducibly shows binding of monovalent cations to an extent that has not been previously reported in nucleic acid simulations. Thus, the deep groove of the Loop E provides a distinct RNA motif for extensive cation binding. In the absence of magnesium (but presence of sodium counterions), the bacterial Loop E undergoes more fluctuations and tends to modestly open the deep groove with no additional structural changes.
MD simulations were used to test the stability of an atomic resolution model of the Loop E motif of the spinach chloroplast constructed by homology. Stable basepairing that is isosteric with the bacterial Loop E was achieved for all three substituted basepairs and represents a substantial relaxation of the geometry with respect to the starting structure. Compared to bacterial Loop E, the chloroplast Loop E shows a marked tendency for an asymmetric compression of its deep groove, as a result of the base substitutions. We suggest that explicit solvent MD simulation, when carefully applied, is a useful tool to evaluate structures of non-Watson-Crick RNA regions proposed using homology approaches. Nevertheless, the use of MD simulations to exhaustively search conformational space to predict RNA motifs (defined as contiguous non-Watson-Crick basepairs) in an automated way is not yet feasible. The simulations would not spontaneously locate the correct geometry in cases where the starting structure is far from the correct geometry or separated by too large a free energy barrier. This is clearly demonstrated by the simulation carried out in the presence of magnesium when one of the modified basepairs was not completed even after 10 ns. As we explained above, the simulated chloroplast Loop E Mg2+ distribution was taken from the bacterial Loop E crystal and thus was not optimized for the chloroplast Loop E. As the simulation timescale is not sufficient to significantly redistribute the Mg2+ cations, the solute structure can be significantly affected by the Mg2+ cations. The simulations are also not capable of spontaneously achieving syn to anti rotations of the bases about the glycosidic bonds. Thus, the homology modeling is the necessary first step to investigate the pairing options. On the other hand, once the basepairing geometry is predetermined by the homology modeling, the simulations are capable of achieving rather substantial in-plane motions (rotations and shifts) of the bases and complete the basepairing. When no substantial barrier is present between the starting and correct pairing geometries, the basepairing is refined within a few nanoseconds. Thus, although the presently available computational approaches do not guarantee that the correct basepairing is always determined, we suggest that in many cases the homology modeling and simulations would be sufficient to indicate valid structures. Significant improvement of the sampling could be achieved in the future by application of the Locally Enhanced Sampling technique (LES) (Cui and Simmerling, 2002) or by using continuum solvent simulations (Zacharias, 2000). Further, a posteriori continuum solvent analysis of the trajectories (MM_PBSA method) (Srinivasan et al., 1998) could be used to estimate relative free energies of different conformations of the molecule that are stable and do not interconvert in the standard explicit solvent simulations. In principle, the MM_PBSA approach can be extended in such a way that a subset of the most important structural water molecules is included explicitly (Spackova et al., 2003). Nevertheless, all these recent techniques introduce additional substantial approximations compared to the conventional PME MD explicit solvent simulations, and their careful testing is required before attempting routine predictions of the structure of RNA motifs.
Supplementary Material
An online supplement to this article is available at http://www.biophysj.org.
Supplementary Material
Acknowledgments
Note added in proof: After this paper was accepted, the 3D structure of Loop E of Chloroplast 5S rRNA was determined by NMR using NOE, j-coupling, and chemical shift constraints, as well as residual dipolar couplings (Vallurupalli, P., and P. B. Moore, 2003. The solution structure of the loop E region of the 5S rRNA from spinach chloroplasts J. Mol. Biol. 325:843–856). The NMR structure confirms all our predictions regarding the geometric families to which each non-Watson basepair belongs. The RMSD of the average structure of Chloroplast Loop E from our MD simulations and the NMR structures was calculated as under 2 Angstroms.
We are very grateful to the referees for their careful evaluation of the paper and the number of valuable comments.
This work was supported by grants LN00A016, MSMT CR, NIH grant 2R15 GM55898, and NSF REU grant CHE-9732563. Our special thanks go to the Supercomputer Center, Brno, where all simulations were carried out.
References
- Auffinger, P., and E. Westhof. 1998. Simulations of the molecular dynamics of nucleic acids. Curr. Opin. Struct. Biol. 8:227–236. [DOI] [PubMed] [Google Scholar]
- Auffinger, P., and E. Westhof. 2000. RNA solvation: a molecular dynamics simulation perspective. Biopolymers. 56:266–274. [DOI] [PubMed] [Google Scholar]
- Auffinger, P., and E. Westhof. 2001. Water and ion binding around r(UpA)12 and d(TpA)12 oligomers: comparison with RNA and DNA (CpG)12 duplexes. J. Mol. Biol. 305:1057–1072. [DOI] [PubMed] [Google Scholar]
- Ban, N., P. Nissen, J. Hansen, P. B. Moore, and T. A. Steitz. 2000. The complete atomic structure of the large ribosomal subunit at 2.4 angstrom resolution. Science. 289:905–920. [DOI] [PubMed] [Google Scholar]
- Banavali, N. K., and A. D. MacKerell. 2002. Free energy and structural pathways of base flipping in a DNA GCGC containing sequence. J. Mol. Biol. 319:141–160. [DOI] [PubMed] [Google Scholar]
- Beveridge, D. L., and K. J. McConnell. 2000. Nucleic acids: theory and computer simulation, Y2K. Curr. Opin. Struct. Biol. 10:182–196. [DOI] [PubMed] [Google Scholar]
- Bink, H. H. J., K. Hellendoorn, J. van der Meulen, and C. W. Pleij. 2002. Protonation of non-Watson-Crick base pairs and encapsidation of turnip yellow mosaic virus RNA. Proc. Natl. Acad. Sci. USA. 99:13465–13470. [DOI] [PMC free article] [PubMed] [Google Scholar]
- Brandl, M., M. Meyer, and J. Suhnel. 2000. Water-mediated base pairs in RNA. A quantum-chemical study. J. Phys. Chem. 104:11177–11187. [Google Scholar]
- Burgess, J. 1988. Ions in Solution. Ellis Horwood, Chichester.
- Carter, A. P., W. M. Clemons, D. E. Brodersen, R. J. Morgan-Warren, B. T. Wimberly, and V. Ramakrishnan. 2000. Functional insights from the structure of the 30S ribosomal subunit and its interactions with antibiotics. Nature. 407:340–348. [DOI] [PubMed] [Google Scholar]
- Cate, J. H., A. R. Gooding, E. Podell, K. Zhou, B. L. Golden, C. E. Kundrot, T. R. Cech, and J. A. Doudna. 1996. Crystal structure of a group I ribozyme domain: principles of RNA packing. Science. 273:1678–1685. [DOI] [PubMed] [Google Scholar]
- Cheatham III, T. E., and P. A. Kollman. 2000. Molecular dynamics simulation of nucleic acids. Annu. Rev. Phys. Chem. 51:435–471. [DOI] [PubMed] [Google Scholar]
- Cheatham III, T. E., and M. A. Young. 2000. Molecular dynamics simulation of nucleic acids: successes, limitations, and promise. Biopolymers. 56:232–256. [DOI] [PubMed] [Google Scholar]
- Chin, K., K. A. Sharp, B. Honig, and A. M. Pyle. 1999. Calculating the electrostatic properties of RNA provides new insights into molecular interactions and function. Nat. Struct. Biol. 6:1055–1061. [DOI] [PubMed] [Google Scholar]
- Chou, S. H., and K. H. Chin. 2001. Zipper-like Watson-Crick base-pairs. J. Mol. Biol. 312:753–768. [DOI] [PubMed] [Google Scholar]
- Cornell, W. D., P. Ciepak, C. I. Bayly, I. R. Gould, K. M. Merz, D. M. Ferguson, Jr., D. C. Spellmeyer, T. Fox, J. W. Caldwell, and P. A. Kollman. 1995. A 2nd generation force-field for the simulation of proteins, nucleic-acids, and organic-molecules. J. Am. Chem. Soc. 117:5179–5197. [Google Scholar]
- Correll, C. C., B. Freeborn, P. B. Moore, and T. A. Steitz. 1997. Metals, motifs and recognition in the crystal structure of 5S rRNA domain. Cell. 91:705–712. [DOI] [PubMed] [Google Scholar]
- Correll, C. C., A. Munishkin, Y. L. Chan, Z. Ren, I. G. Wool, and T. A. Steitz. 1998. Crystal structure of the ribosomal RNA domain essential for binding elongation factors. Proc. Natl. Acad. Sci. USA. 95:13436–13441. [DOI] [PMC free article] [PubMed] [Google Scholar]
- Correll, C. C., I. G. Wool, and A. Munishkin. 1999. The two faces of the Escherichia coli 23 S rRNA sarcin/ricin domain: the structure at 1.11 angstrom resolution. J. Mol. Biol. 292:275–287. [DOI] [PubMed] [Google Scholar]
- Csaszar, K., N. Spackova, R. Stefl, J. Sponer, and N. B. Leontis. 2001. Molecular dynamics of the frame-shifting pseudoknot from beet western yellows virus: the role of non-Watson-Crick base-pairing, ordered hydration, cation binding and base mutations on stability and unfolding. J. Mol. Biol. 313:1073–1091. [DOI] [PubMed] [Google Scholar]
- Cubero, E., C. A. Laughton, F. J. Luque, and M. Orozco. 2000. Molecular dynamics study of oligonucleotides containing difluorotoluene. J. Am. Chem. Soc. 122:6891–6899. [Google Scholar]
- Cui, G. L., and C. Simmerling. 2002. Conformational heterogeneity observed in simulations of a pyrene-substituted DNA. J. Am. Chem. Soc. 124:12154–12164. [DOI] [PubMed] [Google Scholar]
- Dallas, A., and P. B. Moore. 1997. The loop E-loop D region of Escherichia coli 5S rRNA: the solution structure reveals an unusual loop that may be important for binding ribosomal proteins. Structure. 5:1639–1653. [DOI] [PubMed] [Google Scholar]
- Darden, T., D. Pearlman, and L. Pedersen. 1998. Ionic charging free energies: spherical versus periodic boundary condition. J. Phys. Chem. 109:10921–10935. [Google Scholar]
- Endo, Y., and I. G. Wool. 1982. The site of action of alpha-sarcin on eukaryotic ribosomes. The sequence at the alpha-sarcin cleavage site in 28 S ribosomal ribonucleic acid. J. Biol. Chem. 257:9054–9060. [PubMed] [Google Scholar]
- Essmann, U., L. Perera, M. L. Berkowitz, T. Darden, H. Lee, and G. Pedersen. 1995. A smooth particle mesh Ewald method. J. Chem. Phys. 103:8577–8593. [Google Scholar]
- Feig, M., and B. M. Pettitt. 1998. A molecular simulation picture of DNA hydration around A- and B-DNA. Biopolymers. 48:199–209. [DOI] [PubMed] [Google Scholar]
- Feig, M., and B. M. Pettitt. 1999. Sodium and chlorine ions as part of the DNA solvation shell. Biophys. J. 77:1769–1781. [DOI] [PMC free article] [PubMed] [Google Scholar]
- Ferrin, T. E., C. C. Huang, L. E. Jarvis, and R. Langridge. 1988. The MIDAS display system. J. Mol. Graph. 6:13–27. [Google Scholar]
- Gilson, M. K., K. A. Sharp, and B. H. Honig. 1998. Calculating the electrostatic potential of molecules in solution: method and error assessment. J. Comput. Chem. 9:327–335. [Google Scholar]
- Guo, J. X., I. Daizadeh, and W. Gmeiner. 2000. Structure of the Sm binding site from human U4 snRNA derived from a 3 ns PME molecular dynamics simulation. J. Biomol. Struct. Dyn. 18:335–344. [DOI] [PubMed] [Google Scholar]
- Haider, S., G. N. Parkinson, and S. Neidle. 2002. Crystal structure of the potassium form of an Oxytricha nova G-quadruplex. J. Mol. Biol. 320:189–200. [DOI] [PubMed] [Google Scholar]
- Harms, J., F. Schluenzen, R. Zarivach, A. Bashan, S. Gat, I. Agmon, H. Bartels, F. Franceschi, and A. Yonath. 2001. High resolution structure of the large ribosomal subunit from a mesophilic Eubacterium. Cell. 107:679–688. [DOI] [PubMed] [Google Scholar]
- Harvey, S. C., R. K. Z. Tan, and T. E. Cheatham, III. 1998. The flying ice cube: velocity rescaling in molecular dynamics leads to violation of energy equipartition. J. Comput. Chem. 19:726–740. [Google Scholar]
- Hermann, T., P. Auffinger, W. G. Scott, and E. Westhof. 1997. Evidence for a hydroxide ion bridging two magnesium ions at the active site of the hammerhead ribozyme. Nucleic Acids Res. 25:3421–3427. [DOI] [PMC free article] [PubMed] [Google Scholar]
- Hermann, T., and E. Westhof. 1998. Exploration of metal ion binding sites in RNA folds by Brownian-dynamics simulations. Structure. 6:1303–1314. [DOI] [PubMed] [Google Scholar]
- Hermann, T., P. Auffinger, and E. Westhof. 1998. Molecular dynamics investigations of hammerhead ribozyme RNA. Eur. Biophys. J. 27:153–165. [DOI] [PubMed] [Google Scholar]
- Hermann, T., and D. J. Patel. 1999. Stitching together RNA tertiary architectures. J. Mol. Biol. 294:829–849. [DOI] [PubMed] [Google Scholar]
- Hobza, P., M. Kabelac, J. Sponer, P. Mejzlik, and J. Vondrasek. 1997. Performance of empirical potentials (AMBER, CFF95, CVFF, CHARMM, OPLS, POLTEV), semiempirical quantum chemical methods (AM1, MNDO/M, PM3), and ab initio Hartree-Fock method for interaction of DNA bases: comparison with nonempirical beyond Hartree-Fock results. J. Comput. Chem. 18:1136–1150. [Google Scholar]
- Holbrook, S. R., C. J. Cheong, I. Tinoco, and S. H. Kim. 1991. Crystal structure of an RNA double helix incorporating a track of non-Watson-Crick base pairs. Nature. 353:579–581. [DOI] [PubMed] [Google Scholar]
- Humphrey, W., A. Dalke, and K. Schulten. 1996. VMD: visual molecular dynamics. J. Mol. Graph. 14:33–38. [DOI] [PubMed] [Google Scholar]
- Jang, S. B., L. W. Hung, Y. I. Chi, E. L. Holbrook, R. J. Carter, and S. R. Holbrook. 1998. Structure of an RNA internal loop consisting of tandem C-A(+) base pairs. Biochemistry. 37:11726–11731. [DOI] [PubMed] [Google Scholar]
- Lahiri, A., and L. Nilsson. 2000. Molecular dynamics of the anticodon domain of yeast tRNAPhe: codon-anticodon interaction. Biophys. J. 79:2276–2289. [DOI] [PMC free article] [PubMed] [Google Scholar]
- Leontis, N. B., and E. Westhof. 1998a. The 5S rRNA loop E: chemical probing and phylogenetic data versus crystal structure. RNA. 4:1134–1153. [DOI] [PMC free article] [PubMed] [Google Scholar]
- Leontis, N. B., and E. Westhof. 1998b. Conserved geometrical base-pairing patterns in RNA. Q. Rev. Biophys. 31:399–455. [DOI] [PubMed] [Google Scholar]
- Leontis, N. B., and E. Westhof. 2001. Geometric nomenclature and classification of RNA base pairs. RNA. 7:499–512. [DOI] [PMC free article] [PubMed] [Google Scholar]
- Lu, M., and T. A. Steitz. 2000. Structure of Escherichia coli ribosomal protein L25 complexed with a 5S rRNA fragment at 1.8-angstrom resolution. Proc. Natl. Acad. Sci. USA. 97:2023–2028. [DOI] [PMC free article] [PubMed] [Google Scholar]
- Lu, X. J., Z. Shakked, and W. K. Olson. 2000. A-form conformational motifs in ligand-bound DNA structures. J. Mol. Biol. 300:819–840. [DOI] [PubMed] [Google Scholar]
- Luisi, B., M. Orozco, J. Sponer, F. J. Luque, and Z. Shakked. 1998. On the potential role of the amino nitrogen atom as a hydrogen acceptor in macromolecules. J. Mol. Biol. 279:1123–1136. [DOI] [PubMed] [Google Scholar]
- McConnell, K. J., and D. L. Beveridge. 2000. DNA structure: what's in charge? J. Mol. Biol. 304:803–820. [DOI] [PubMed] [Google Scholar]
- Nagan, M. C., S. S. Kerimo, K. Musier-Forsyth, and C. J. Cramer. 1999. Wild-type RNA microhelix (Ala) and 3:70 variants: molecular dynamics analysis of local helical structure and tightly bound water. J. Am. Chem. Soc. 121:7310–7317. [Google Scholar]
- Nagan, M. C., P. Beuning, K. Musier-Forsyth, and C. J. Cramer. 2000. Importance of discriminator base stacking interactions: molecular dynamics analysis of A73 microhelix (Ala) variants. Nucleic Acids Res. 28:2527–2534. [DOI] [PMC free article] [PubMed] [Google Scholar]
- Nevskaya, N., S. Tischenko, R. Fedorov, S. Al-Karadaghi, A. Liljas, A. Kraft, W. Piendl, M. Garber, and S. Nikonov. 2000. Archaeal ribosomal protein L1: the structure provides new insights into RNA binding of the L1 protein family. Struct. Fold. Des. 8:363–371. [DOI] [PubMed] [Google Scholar]
- Pan, B. C., S. N. Mitra, and M. Sundaralingam. 1998. Structure of a 16-mer RNA duplex r(GCAGACUUAAAUCUGC)2 with wobble C center.A(+) mismatches. J. Mol. Biol. 283:977–984. [DOI] [PubMed] [Google Scholar]
- Pearlman, D. A., D. A. Case, J. W. Caldwell, W. S. Ross, T. E. Cheatham III, and S. DeBolt. 1995. AMBER, a package of computer programs for applying molecular mechanics, normal mode analysis, molecular dynamics and free energy calculations to simulate the structural and energetic properties of molecules. Comput. Phys. Commun. 91:1–41. [Google Scholar]
- Ramakrishnan, V., and P. B. Moore. 2000. Atomic structures at last: the ribosome in 2000. Curr. Opin. Struct. Biol. 11:144–154. [DOI] [PubMed] [Google Scholar]
- Ravindranathan, S., S. E. Butcher, and J. Feigon. 2000. Adenine protonation in domain B of the hairpin ribozyme. Biochemistry. 39:16026–16032. [DOI] [PubMed] [Google Scholar]
- Romby, P., E. Westhof, R. Toukifimpa, R. Mache, J. P. Ebel, C. Ehresmann, and B. Ehresmann. 1988. Higher order structure of chloroplastic 5S ribosomal RNA from spinach. Biochemistry. 27:4721–4730. [DOI] [PubMed] [Google Scholar]
- Ross, W. S., and C. C. Hardin. 1994. Ion-induced stabilization of the G-DNA quadruplex: free-energy perturbation studies. J. Am. Chem. Soc. 116:6070–6080. [Google Scholar]
- Sarzynska, J., T. Kulinski, and L. Nilsson. 2000. Conformational dynamics of a 5S rRNA hairpin domain containing Loop D and a single nucleotide bulge. Biophys. J. 79:1213–1227. [DOI] [PMC free article] [PubMed] [Google Scholar]
- Schluenzen, F., A. Tocilj, R. Zarivach, J. Harms, M. Gluehmann, D. Janell, A. Bashan, H. Bartels, I. Agmon, F. Franceschi, and A. Yonath. 2000. Structure of functionally activated small ribosomal subunit at 3.3 angstroms resolution. Cell. 102:615–623. [DOI] [PubMed] [Google Scholar]
- Schneider, C., and J. Suhnel. 2000. A molecular dynamics simulation study of coaxial stacking in RNA. J. Biomol. Struct. Dyn. 18:345–352. [DOI] [PubMed] [Google Scholar]
- Schneider, C., M. Brandl, and J. Suhnel. 2001. Molecular dynamics simulation reveals conformational switching of water- mediated uracil-cytosine base-pairs in an RNA duplex. J. Mol. Biol. 305:659–667. [DOI] [PubMed] [Google Scholar]
- Shepard, W., W. B. T. Cruse, R. Fourme, E. de la Fortelle, and T. Prange. 1998. A zipper-like duplex in DNA: the crystal structure of d(GCGAAAGCT) at 2.1 angstrom resolution. Structure. 6:849–861. [DOI] [PubMed] [Google Scholar]
- Sherer, E. C., S. A. Harris, R. Soliva, H. Orozco, and C. A. Laughton. 1999. Molecular dynamics studies of DNA A-tract structure and flexibility. J. Am. Chem. Soc. 121:5981–5991. [Google Scholar]
- Spackova, N., I. Berger, and J. Sponer. 1999. Nanosecond molecular dynamics simulations of parallel and antiparallel guanine quadruplex DNA molecules. J. Am. Chem. Soc. 121:5519–5534. [Google Scholar]
- Spackova, N., I. Berger, and J. Sponer. 2000. Nanosecond molecular dynamics of zipper-like DNA duplex structures containing sheared G.A mismatch pairs. J. Am. Chem. Soc. 122:7564–7572. [Google Scholar]
- Spackova, N., I. Berger, and J. Sponer. 2001. Structural dynamics and cation interactions of DNA quadruplex molecules containing mixed guanine/cytosine quartets revealed by large-scale MD simulations. J. Am. Chem. Soc. 123:3295–3307. [DOI] [PubMed] [Google Scholar]
- Spackova, N., T. E. Cheatham III., F. Ryjacek, F. Lankas, L. van Meervelt, P. Hobza, and J. Sponer. 2003. Molecular dynamics simulations and thermodynamics analysis of DNA-drug complexes. I. Minor groove binding between 4′,6-diamidino-2-phenylindole (DAPI) and DNA duplexes in solution. J. Am. Chem. Soc. 125:1759–1769. [DOI] [PubMed] [Google Scholar]
- Sponer, J., and P. Hobza. 1994a. Bifurcated hydrogen bonds in DNA crystal structures. An ab initio quantum chemical study. J. Am. Chem. Soc. 116:709–714. [Google Scholar]
- Sponer, J., and P. Hobza. 1994b. Nonplanar geometries of DNA bases. Second order Moller-Plesset study. J. Phys. Chem. 98:3161–3164. [Google Scholar]
- Sponer, J., J. Florian, J. Leszczynski, and P. Hobza. 1996. Nonplanar DNA base pairs. J. Biomol. Struct. Dyn. 13:827–833. [DOI] [PubMed] [Google Scholar]
- Sponer, J., J. E. Sponer, and J. Leszczynski. 2000a. Cation-pi and amino-acceptor interactions between hydrated metal cations and DNA bases. A quantum-chemical view. J. Biomol. Struct. Dyn. 17:1087–1096. [DOI] [PubMed] [Google Scholar]
- Sponer, J., M. Sabat, L. Gorb, J. Leszczynski, B. Lippert, and P. Hobza. 2000b. The effect of metal binding to the N7 site of purine nucleotides on their structure, energy, and involvement in base pairing. J. Phys. Chem. B. 104:7535–7544. [Google Scholar]
- Sponer, J., and P. Hobza. 2000. Interaction energies of hydrogen-bonded formamide dimer, formamidine dimer, and selected DNA base pairs obtained with large basis sets of atomic orbitals. J. Phys. Chem. 104:4592–4597. [Google Scholar]
- Sponer, J., J. Leszczynski, and P. Hobza. 2001. Electronic properties, hydrogen bonding, stacking, and cation binding of DNA and RNA bases. Biopolymers. 61:3–31. [DOI] [PubMed] [Google Scholar]
- Srinivasan, J., T. E. Cheatham III, P. Cieplak, P. A. Kollman, and D. A. Case. 1998. Continuum solvent studies of the stability of DNA, RNA, and phosphoramidate: DNA helices. J. Am. Chem. Soc. 120:9401–9409. [Google Scholar]
- Starikov, E. B., and L. Nilsson. 2002. Structural basis of biotin-RNA aptamer binding: a theoretical study. Chem. Phys. Lett. 363:39–44. [Google Scholar]
- Szewczak, A. A., and P. B. Moore. 1995. The sarcin/ricin loop, a modular RNA. J. Mol. Biol. 247:81–98. [DOI] [PubMed] [Google Scholar]
- Varnai, P., and R. Lavery. 2002. Base flipping in DNA: pathways and energetics studied with molecular dynamic simulations. J. Am. Chem. Soc. 124:7272–7273. [DOI] [PubMed] [Google Scholar]
- Westhof, E., P. Romby, P. J. Romaniuk, J. P. Ebel, C. Ehresmann, and B. Ehresmann. 1989. Computer modeling from solution data of spinach chloroplast and of Xenopus laevis somatic and oocyte 5 S rRNAs. J. Mol. Biol. 207:417–431. [DOI] [PubMed] [Google Scholar]
- Williams, D. J., and K. B. Hall. 1999. Unrestrained stochastic dynamics simulations of the UUCG tetraloop using an implicit solvation model. Biophys. J. 76:3192–3205. [DOI] [PMC free article] [PubMed] [Google Scholar]
- Wimberly, B., G. Varani, and I. Tinoco. 1993. The conformation of loop E of eukaryotic 5S ribosomal RNA. Biochemistry. 32:1078–1087. [DOI] [PubMed] [Google Scholar]
- Wimberly, B. T., D. E. Brodersen, W. M. Clemons, R. J. Morgan-Warren, A. P. Carter, C. Vonrhein, T. Hartsch, and V. Ramakrishnan. 2000. Structure of the 30S ribosomal subunit. Nature. 407:327–339. [DOI] [PubMed] [Google Scholar]
- Wlodek, S. T., T. W. Clark, L. R. Scott, and J. A. McCammon. 1997. Molecular dynamics of acetylcholinesterase dimer complexed with tacrine. J. Am. Chem. Soc. 119:9513–9522. [Google Scholar]
- Zacharias, M. 2000. Simulation of the structure and dynamics of nonhelical RNA motifs. Curr. Opin. Struct. Biol. 10:311–317. [DOI] [PubMed] [Google Scholar]
- Zhou, R., B. J. Berne, and R. Germain. 2001. The free energy landscape for beta hairpin folding in explicit water. Proc. Natl. Acad. Sci. USA. 18:14931–14936. [DOI] [PMC free article] [PubMed] [Google Scholar]
Associated Data
This section collects any data citations, data availability statements, or supplementary materials included in this article.
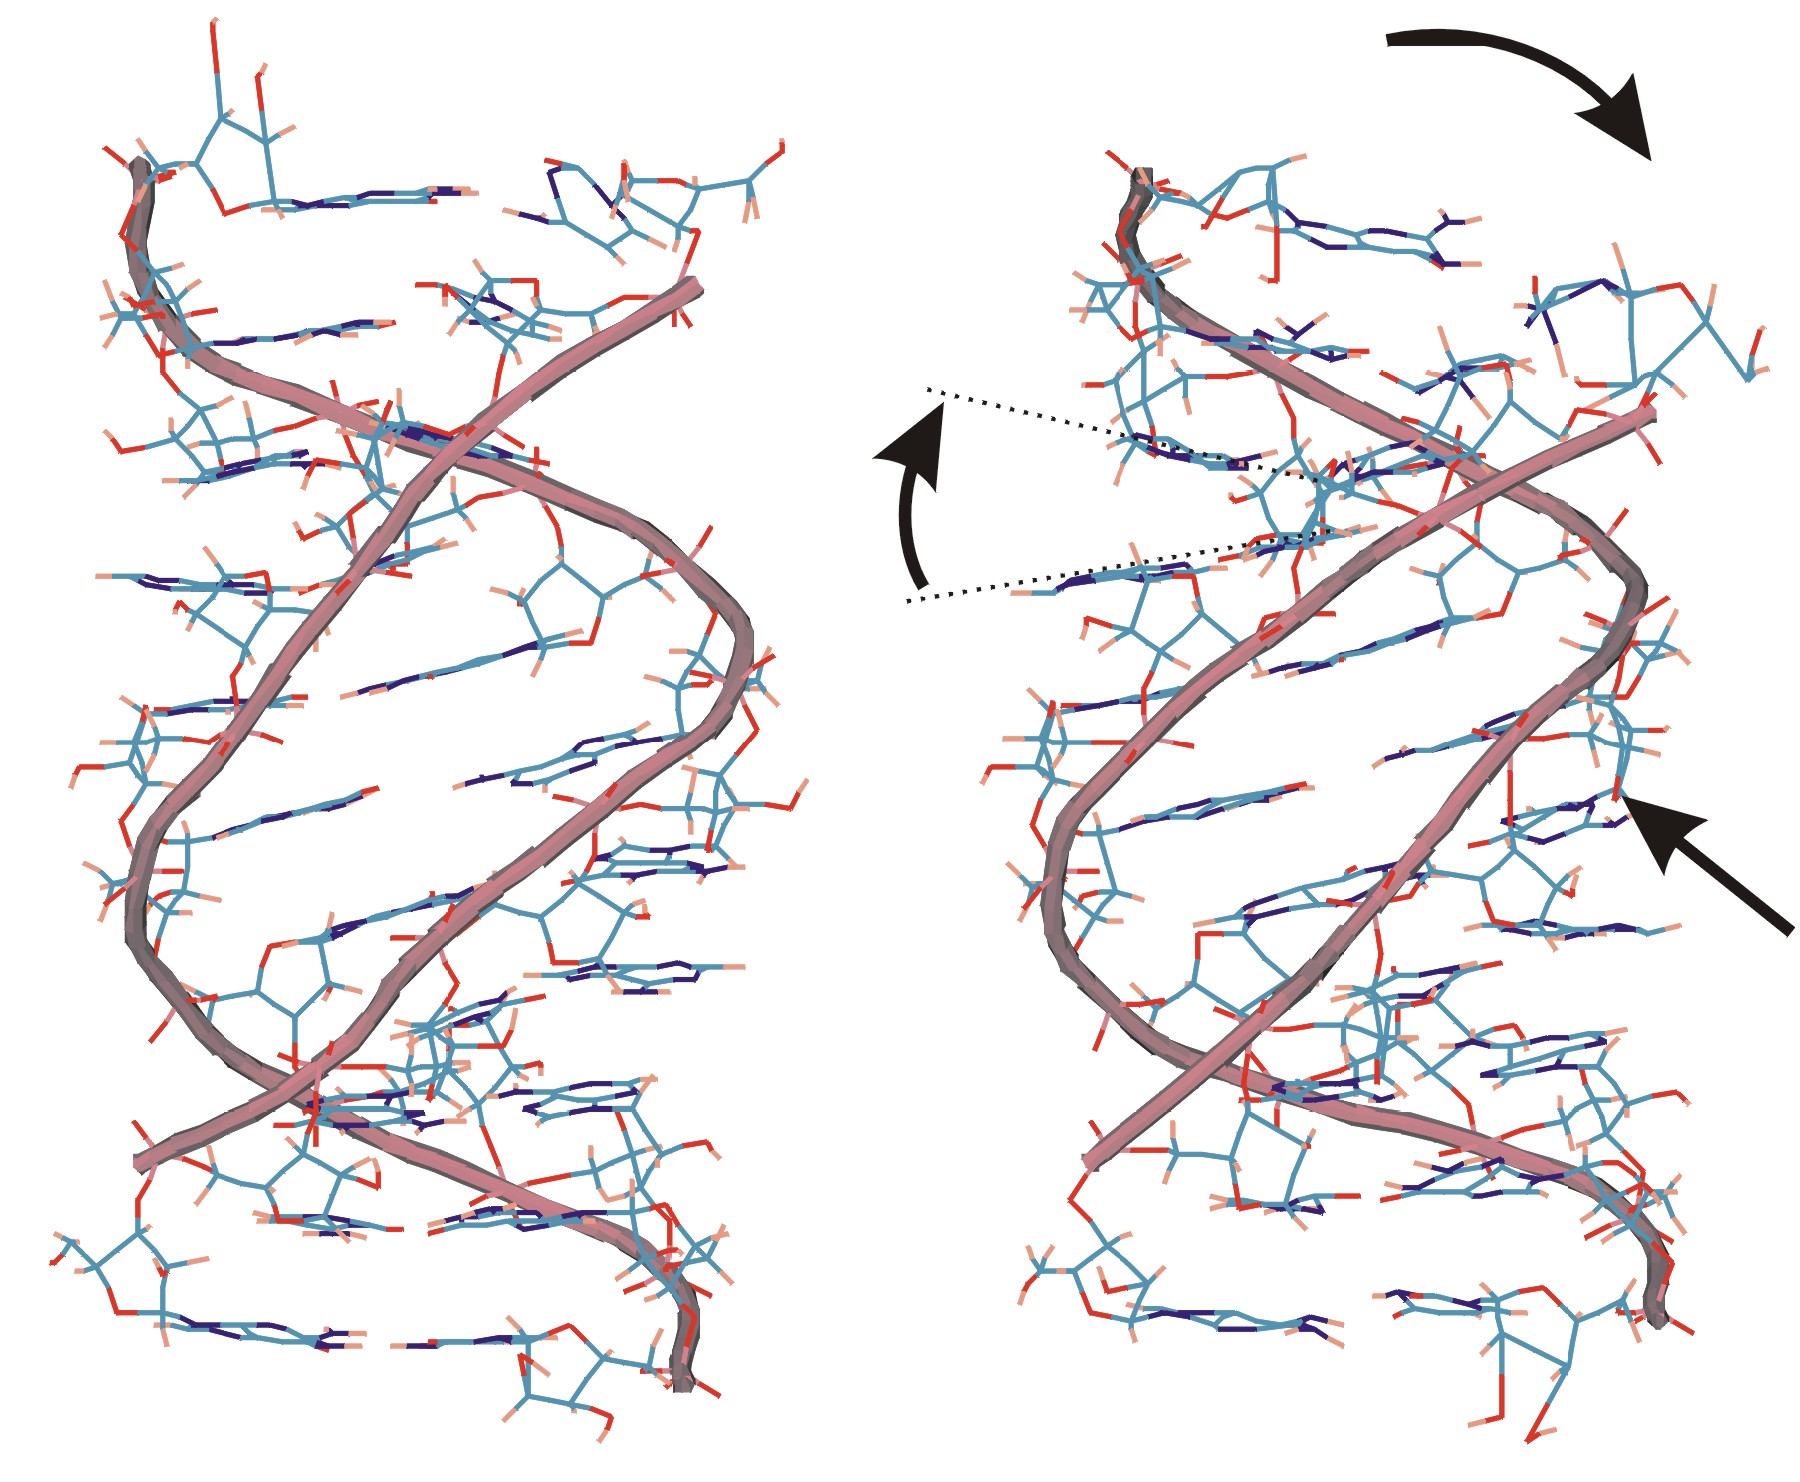
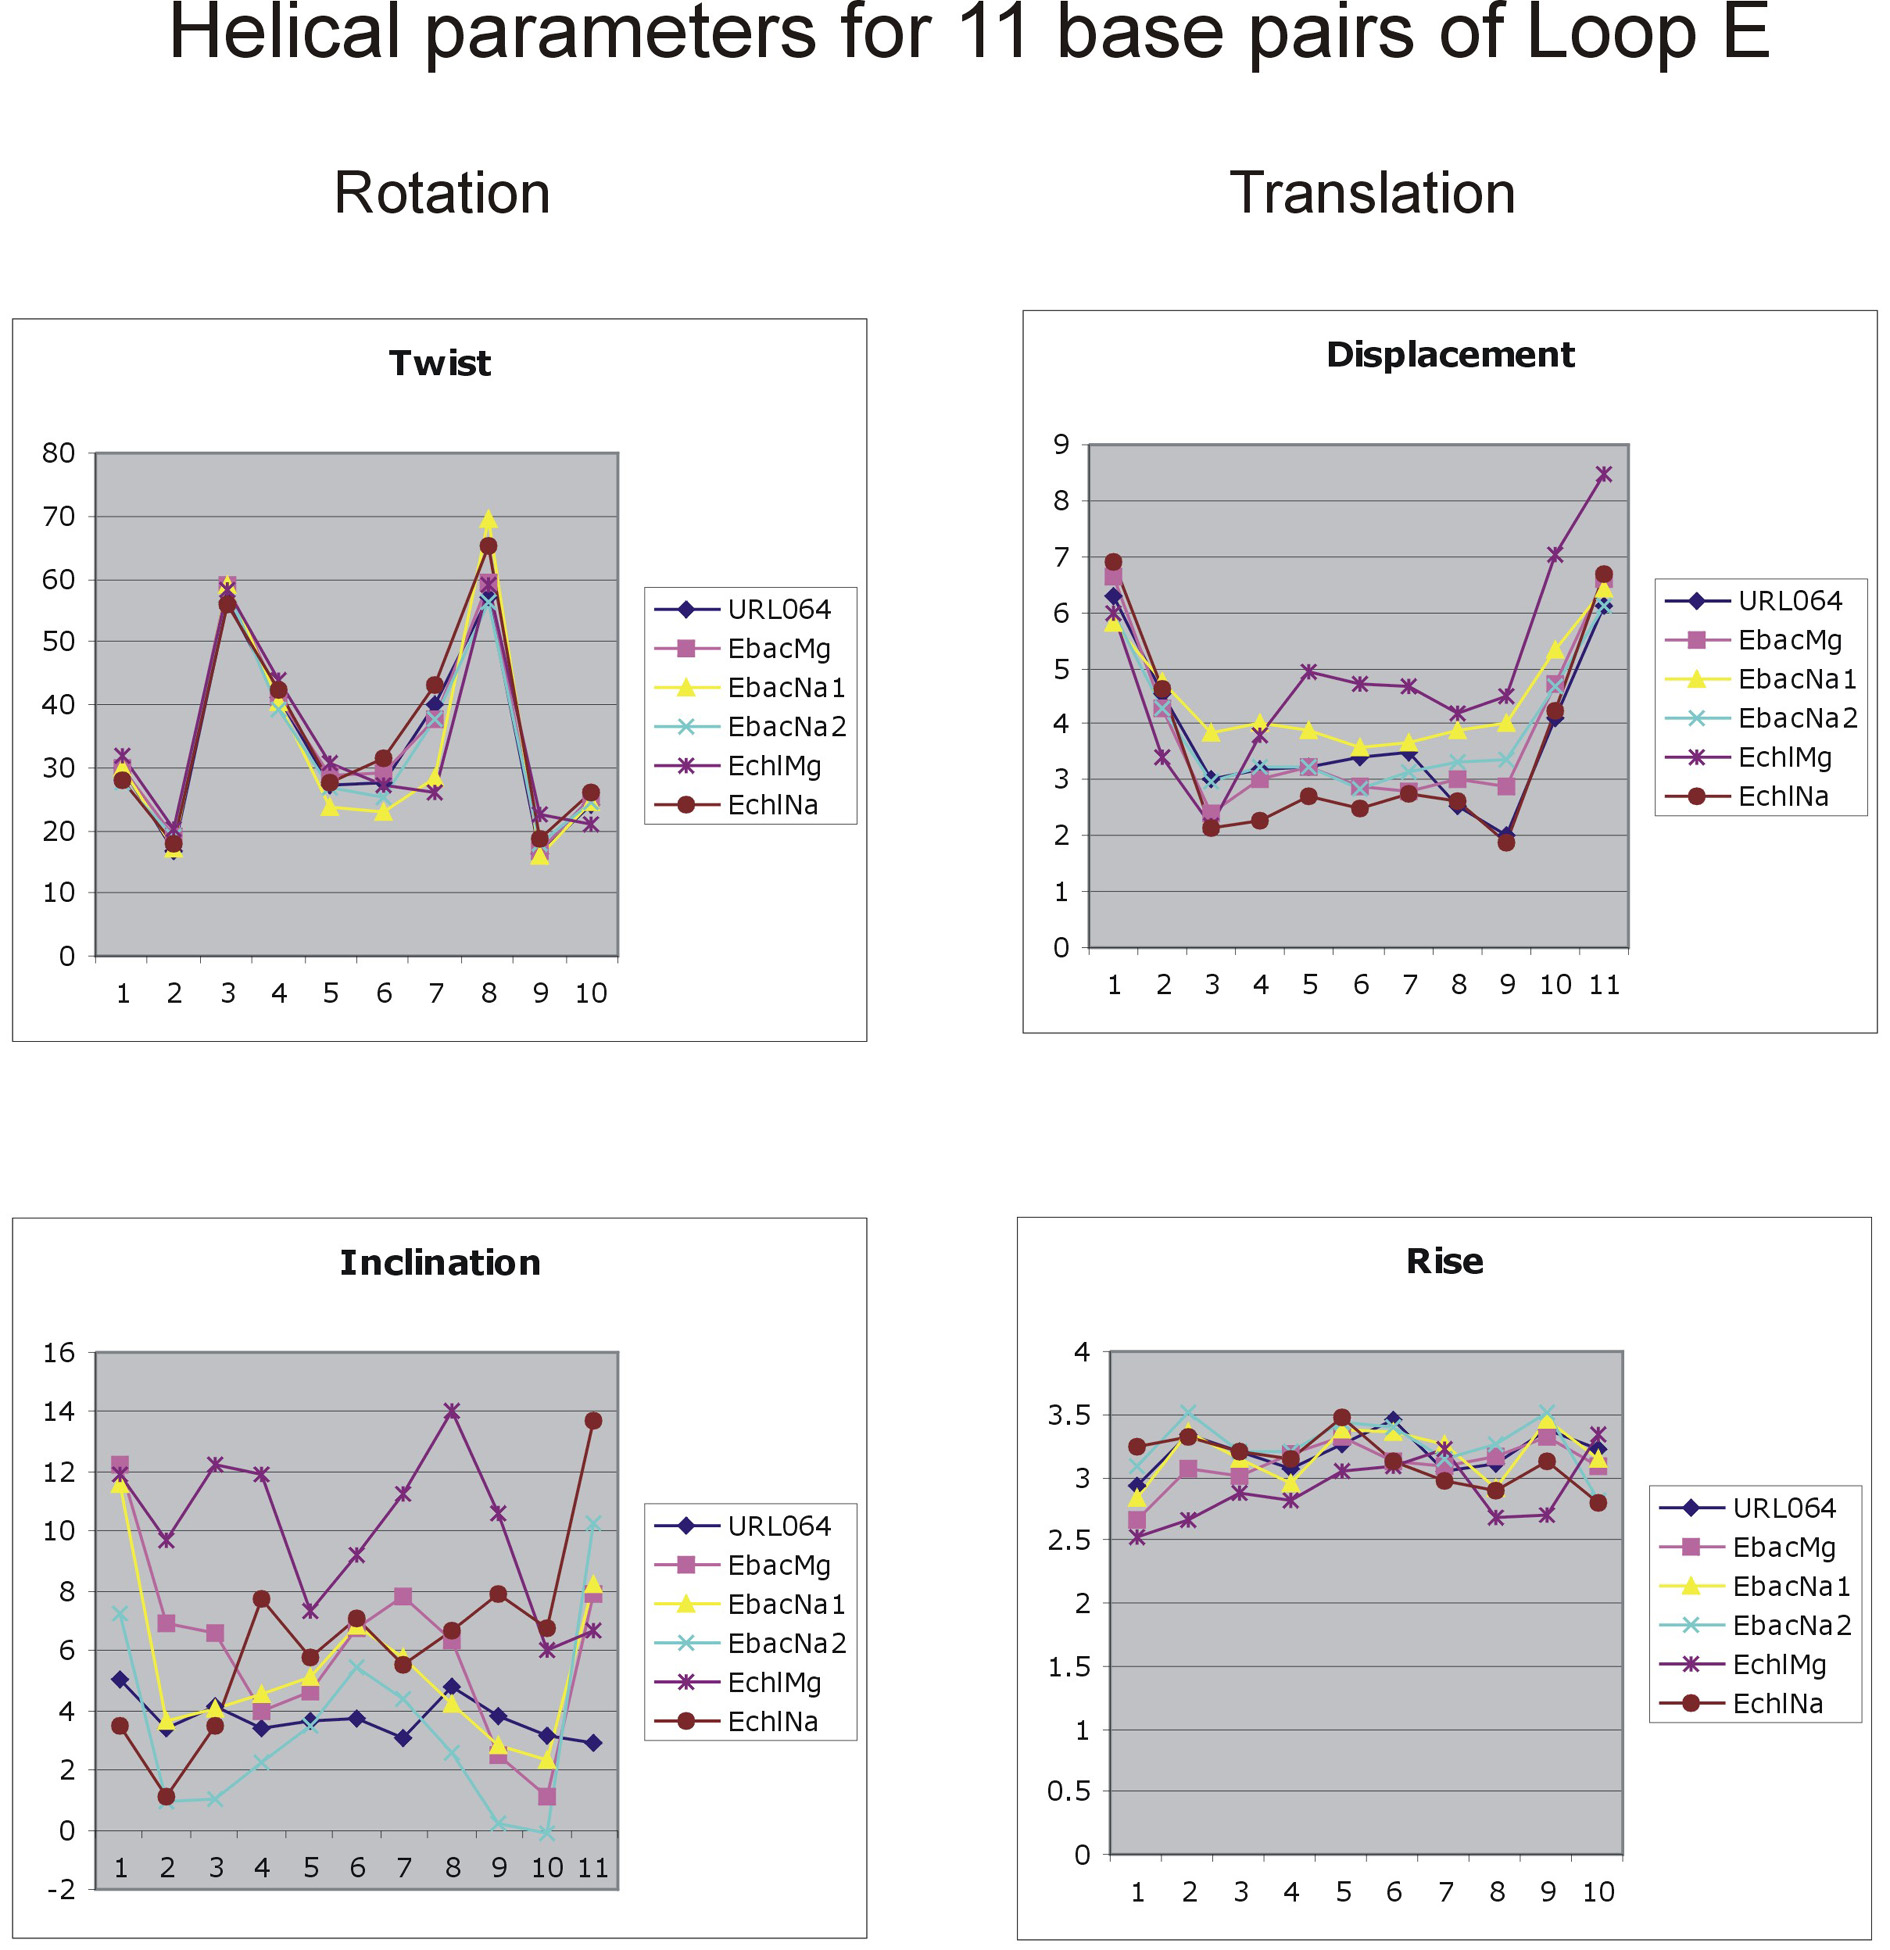