Abstract
We study the influence of truncating the electrostatic interactions in a fully hydrated pure dipalmitoylphosphatidylcholine (DPPC) bilayer through 20 ns molecular dynamics simulations. The computations in which the electrostatic interactions were truncated are compared to similar simulations using the particle-mesh Ewald (PME) technique. All examined truncation distances (1.8–2.5 nm) lead to major effects on the bilayer properties, such as enhanced order of acyl chains together with decreased areas per lipid. The results obtained using PME, on the other hand, are consistent with experiments. These artifacts are interpreted in terms of radial distribution functions g(r) of molecules and molecular groups in the bilayer plane. Pronounced maxima or minima in g(r) appear exactly at the cutoff distance indicating that the truncation gives rise to artificial ordering between the polar phosphatidyl and choline groups of the DPPC molecules. In systems described using PME, such artificial ordering is not present.
INTRODUCTION
One of the great challenges in biophysics is to understand the basic principles that govern lipid bilayer mixtures. Lipid bilayers, or membranes, govern and mediate various biologically relevant processes on the cellular level. Transfer of ions through membranes and the function of enzymes attached to membranes provide two examples of these situations. Besides cellular membranes, lipid membranes are present in various man-made applications such as liposomes used in novel drug delivery techniques (Langer, 1998) and in many natural entities such as lipoproteins. The variety of situations where lipid bilayers play an important role is truly fascinating and is discussed in a number of review articles (Bloom et al., 1991; Lipowsky and Sackmann, 1995; Merz and Roux, 1996; Nagle and Tristram-Nagle, 2000; Katsaras and Gutberlet, 2001).
The characteristics of membranes have been extensively investigated for many decades, and experiments have provided substantial information about the intriguing physicochemical aspects of membrane systems (Bloom et al., 1991; Lipowsky and Sackmann, 1995; Merz and Roux, 1996; Nagle and Tristram-Nagle, 2000; Katsaras and Gutberlet, 2001). However, although the experimental approach is the cornerstone of membrane research, it is often difficult or even impossible to obtain a thorough understanding of the phenomena taking place in lipid bilayers by experiments only. Therefore, atomistic computer simulation techniques such as classical molecular dynamics (MD) have become a standard tool for studies of biomembrane systems at the molecular level (Merz and Roux, 1996; Tieleman et al., 1997; Feller, 2000; Saiz and Klein, 2002).
One drawback of the computational approach is that its success depends on various methodological issues such as force fields, constraints, and the accuracy of integration schemes for the equations of motion (Tieleman et al., 1997; van Gunsteren and Mark, 1998; Chiu et al., 2000; Besold et al., 2000; Vattulainen et al., 2002). In particular, the treatment of electrostatic interactions deserves special attention, since biomembrane systems are highly charged: lipid molecules are either polar or charged and they interact with each other, the polar water environment, counterions (Pandit and Berkowitz, 2002), proteins (Ibragimova and Wade, 1998), and DNA (Bandyopadhyay et al., 1999). Proper treatment of electrostatic interactions in MD simulations is therefore one of the most important issues in this field and it continues to pose significant challenges for computer simulations.
The calculation of electrostatic interactions is typically based on solving the Poisson equation for the electrostatic potential such that all charged particles and their periodic images are taken into account in some systematic fashion. The Ewald summation method, its variants (Sagui and Darden, 1999), and the fast multipole method (Greengard and Rokhlin, 1987; Frenkel and Smit, 2002) are commonly used techniques that exploit this idea. In particular, the particle-mesh Ewald (PME) technique has been used increasingly often in lipid bilayer simulations (Venable et al., 2000; Saiz and Klein, 2001; Feller et al., 2001; Tobias, 2001; Pandit and Berkowitz, 2002).
Alternatively, one can neglect the long-range Coulombic tail and truncate the interactions at some suitable distance, a typical choice being 1.5–2.0 nm. This technique leads to considerable savings in the computational load and hence is widely used. Due to the speedup, it is particularly useful in studies of large systems over long times (Lindahl and Edholm, 2000; Marrink et al., 2001; Chiu et al., 2002), and when the computational requirements are demanding due to, e.g. long timescales associated with complex processes such as membrane fusion (Marrink and Tieleman, 2002). The discontinuities in the potential and forces at the cutoff radius are typically not considered to be a major issue, since they can be handled using various shifting and switching techniques (Steinbach and Brooks, 1994; Leach, 2001).
One might expect the artifacts due to truncation, if any, to become smaller as the cutoff distance rcut is increased, and that for reasonably large cutoffs the system should not be influenced by truncation. In practice, however, this is not the case. The classical example is water: its bulk properties (Alper and Levy, 1989; Feller et al., 1996) and properties at the surfaces of lipid monolayers have been found to be affected by truncation (Alper et al., 1993a,b; Feller et al., 1996). Other cases where direct effects due to truncation have been observed include peptides, proteins, and DNA (Smith and Pettitt, 1991; Schreiber and Steinhauser, 1992; York et al., 1993, 1995; Ibragimova and Wade, 1998; Norberg and Nilsson, 2000).
Given these findings, it is rather surprising that only Venable et al. have considered the effects of truncation in the context of lipid bilayers (Venable et al., 2000). They compared the areas per molecule in a DPPC bilayer in the gel phase using systems in which the electrostatic interactions had been treated using PME and a truncation of 1.2 nm. They found the results to differ by ∼4%. To the best of our knowledge, further systematic studies of truncation effects in lipid bilayers have not been reported. The lack of information is particularly striking in the case of the liquid-crystalline (Lα) phase, which is highly relevant from a physiological point of view. Instead, the general impression seems to be that truncation may lead to artifacts, but they are minor, or even negligible, if the cutoff is longer than ∼1.8 nm (Alper et al., 1993a,b; Feller et al., 1996; Jakobsson et al., 1996).
In this article, we show through an extensive set of 20-ns MD simulations for a fully hydrated pure lipid bilayer of 128 dipalmitoylphosphatidylcholine (DPPC) molecules in the liquid-crystalline phase that the truncation of electrostatic interactions can have significant consequences on the properties of lipid bilayer systems. We consider several truncation distances from 1.8 to 2.5 nm and compare them to a case where the particle-mesh Ewald technique has been applied. We find that the simulations where PME has been used lead to an area per lipid molecule consistent with experiments, whereas the truncation of electrostatic interactions leads to 5–14% smaller values. This dramatic result is reflected in various properties of the lipid bilayer, including the probability distribution of the area per lipid, the density profile across the membrane, and the ordering of acyl chains. In addition to these, truncation leads to prominent artifacts in the electrostatic potential across the bilayer. We interpret the artifacts in terms of radial distribution functions g(r) of molecules and molecular groups in the plane of the membrane. The radial distribution functions reveal without doubt that truncation leads to artificial ordering in the headgroups of lipid molecules.
We conclude that the truncation of electrostatic interactions may lead to profound artifacts in the properties of lipid bilayer systems, and should be used with great care, if at all.
SYSTEM
Model and simulation details
We have simulated a lipid bilayer system consisting of 128 DPPC molecules (shown schematically in Fig. 1), fully hydrated by 3655 water molecules. The united atom model description used in this work has been validated previously (Tieleman and Berendsen, 1996).
FIGURE 1.
Representation of a DPPC molecule showing the numbering of carbons in the acyl chains discussed in the text.
We used a system available at http://moose.bio.ucalgary.ca/files/dppc128.pdb as our initial configuration. This system corresponds to the final structure of run E discussed elsewhere (Tieleman and Berendsen, 1996). The bilayer is in the x-y plane.
The parameters for bonded and nonbonded interactions were taken from a rather recent study on a DPPC bilayer system (Berger et al., 1997), available in electronic form at http://moose.bio.ucalgary.ca/files/lipid.itp. The partial charges were obtained from the underlying model description (Tieleman and Berendsen, 1996) and can be found at http://moose.bio.ucalgary.ca/files/dppc.itp. For water, the SPC model (Berendsen et al., 1981) was used.
Lennard-Jones interactions were cut off at 1.0 nm without shift or switch functions. Electrostatic interactions within 1.0 nm were calculated at each time step, whereas interactions beyond this range were determined every 10 time steps. These choices follow the parameterization of DPPC (Tieleman and Berendsen, 1996). This choice further corresponds to the scheme referred to as twin-range cutoff, to distinguish it from the multiple time step schemes. They both have certain practical advantages, and there are cases where the multiple time step would probably be more useful. However, since basically all DPPC simulations reported so far have used a twin-range scheme and our objective was to use an approach that is common on this field, we decided to follow the same idea.
Long-range electrostatics was handled either by using a cutoff at rcut = 1.8 nm, 2.0 nm, or 2.5 nm, or by means of the particle-mesh Ewald (Essman et al., 1995b) method to take the long-range interaction fully into account. The time step for the simulations was chosen to be 2.0 fs.
The simulations were performed using the Gromacs (Lindahl et al., 2001) package in the NpT ensemble. The Berendsen algorithm with a time constant of 1 ps for pressure coupling was used as barostat. The setup was chosen such that the height of the simulation box (i.e., its extension in the z direction) was allowed to vary independently of the cross-sectional area of the box in the x-y plane. The DPPC and water molecules were separately coupled to a heat bath at a temperature T = 323 K using the Berendsen algorithm (Berendsen et al., 1984) with a coupling constant of 0.1 ps. The lengths of all bonds were kept constant with the Lincs algorithm (Hess et al., 1997).
The main focus of this paper is on the effects due to different treatments of the long-range electrostatic interactions. To this end, we have studied DPPC bilayers over a timescale of 20 ns using three different truncation distances and PME. The simulations have been repeated at two different temperatures in the liquid-crystalline phase to confirm the validity of our conclusions. In addition, as described in Appendix A, we performed additional simulations to examine the effects due to constraints, time constants of the thermostat and pressure coupling, and the range of van der Waals interactions. These simulations sum up to ∼20 simulations of 20 ns each. In total, the simulations took ∼15,000 CPU hours.
Data analysis
To calculate the area occupied by each individual lipid and to determine the probability distributions for the area per lipid P(A), we applied Voronoi analysis in two dimensions (Shinoda and Okazaki, 1998a). In Voronoi tessellation, we first computed the centers of mass (CM) for the lipids and projected them onto the x-y plane. Thus, the centers of mass define a set of points in the x-y plane. A point in the plane is considered to belong to a particular Voronoi cell if it is closer to the projected CM of the lipid molecule associated with that cell than to any other CM position.
The mass density profile across the bilayer was calculated by separately analyzing each frame of the simulations. The center of the bilayer (i.e., its z component) was first determined by computing the centers of mass for the two monolayers. The positions of all atoms were then taken into account with respect to the center. It is important to note that the masses of all hydrogen atoms must be included explicitly, as has been done in this work. Since the system possesses mirror symmetry, all positions with z < 0 have been folded to z > 0 to reduce statistical error.
The electrostatic potential across the bilayer was calculated in a similar fashion. The average charge density profile was first computed in such a way that the center of the bilayer (z = 0) was determined for each simulation frame separately. Finally, the electrostatic potential was determined by integrating the charge density twice starting from the initial condition V(z = 0) = 0.
The microscopic structure of lipid molecules and the ordering of acyl chains is characterized through the order parameter tensor Sαβ (α, β = x,y,z) defined as
 |
(1) |
where θα is the angle between the αth molecular axis and the bilayer normal (z axis). The order parameter is calculated separately for all positions (carbons) along the chain. Given the geometry of the bilayer, the relevant order parameter is the diagonal element Szz. This is related to the deuterium order parameter SCD defined as
 |
(2) |
which is often determined in experiments, e.g. using nuclear magnetic resonance spectroscopy. Since the bilayer is symmetric with respect to rotation around the z axis, we have Sxx = Syy, and Sxx + Syy + Szz = 0. Hence, it follows that SCD = −Szz/2. To allow comparison with experimental data, we present our results in terms of |SCD|.
Ordering of water in the vicinity of the bilayer-water interface is described by calculating the time averaged projection of the water dipole unit vector  onto the interfacial normal n,
 |
(3) |
where z is the z component of the center of mass of the water molecule and vector n points away from the bilayer center along the z coordinate.
To calculate the radial distribution functions (RDFs) between different charged groups, one should note that the groups have internal structure. The positively charged group is choline, essentially N+(CH3)3, and the negatively charged one is the phosphate group, essentially PO2O−. To demonstrate possible artifacts due to truncation in the pair correlation behavior between these charged groups, we found that the most transparent way to this end is to consider RDFs between nitrogen and phosphate atoms in the choline and phosphate groups. The RDFs presented in this work are thus for the P-P and N-N pairs.
Note that our simulations—like virtually all simulations—use a group-based cutoff, i.e., electrostatic interactions are computed for a pair of particles if any pair belonging to the two groups is within the cutoff distance. Due to this, the system cannot force any atom to a certain distance such that it would artificially enhance favorable interactions within a group only. As a consequence, the artifacts observed using truncated electrostatics cannot be explained by the internal structure.
For the radial distribution function between the center of mass positions of the DPPC molecules, we first calculated the CM for all of them. Then, the g2d(r) was computed in a plane, i.e., using the x, y coordinates of the CM positions.
RESULTS AND DISCUSSION
System dimensions
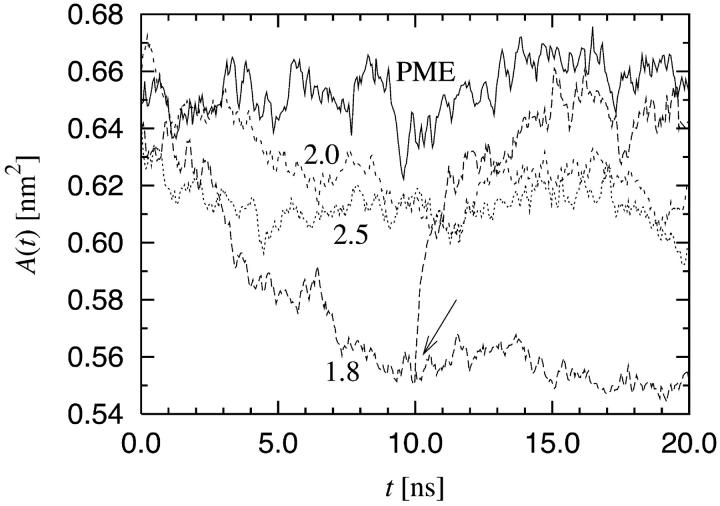
One of the central quantities in describing lipid bilayers is the average area per molecule 〈A〉. For DPPC it has been experimentally determined to be 〈A〉 = 0.64 nm2 (Nagle and Tristram-Nagle, 2000). It provides a measure for tuning the force fields and other parameters for lipid systems as one aims for a quantitative description of lipid bilayers through MD simulations. In the present work, the average area per lipid was computed using the size of the simulation box in the x-y plane. Since we employ pressure coupling, the simulation box is allowed to fluctuate during the simulation. The temporal behavior of the area per lipid A(t) is shown in Fig. 2. The simulations have equilibrated after 10 ns and for the analysis we discarded the first 10 ns, and used the second 10-ns period only.
FIGURE 2.
The area per lipid A(t) as a function of time for truncated and PME electrostatics. Cutoff radii are shown in the plot. In addition, A(t) is shown for the case where the electrostatics was switched from a cutoff at 1.8 nm to PME at 10 ns (marked by an arrow).
Fig. 2 shows that A(t) depends strongly on the treatment of electrostatic interactions. The simulations using PME yielded 〈A〉 = (0.645 ± 0.010) nm2 consistent with recent experiments (Nagle and Tristram-Nagle, 2000). Truncation at both 2.0 nm and 2.5 nm lead to 〈A〉 = (0.615 ± 0.010) nm2, which deviates ∼5% from the PME result. Further decrease of the cutoff distance to 1.8 nm leads to 〈A〉 = (0.555 ± 0.010) nm2. This is ∼14% smaller than the reference value of 0.645 nm2.
We verified that the large differences in the average area per lipid are indeed due to electrostatics and not a consequence of initial conditions. To this end, we chose an equilibrated configuration from the simulation with rcut = 1.8 nm (at 10 ns) as the initial configuration for a new simulation. In this new simulation, the electrostatic interactions were computed using PME instead of a cutoff. This transition point is marked by an arrow in Fig. 2. As seen from Fig. 2, the area per lipid quickly approaches the value of 0.645 nm2. We can thus conclude that the different areas per lipid reported here are solely due to the treatment of electrostatic interactions.
For the purpose of comparison, let us note that our results for the average area per lipid at short times are in agreement with earlier studies by Tieleman et al. (Tieleman and Berendsen, 1996), whose model description we follow in the present work. They used a cutoff at 2.0 nm and found 〈A〉 ≈ 0.60 nm2 for the area per molecule. A full comparison is not meaningful, however, since the timescale in their studies was 0.5 ns and the analysis was done over the last 100 ps only.
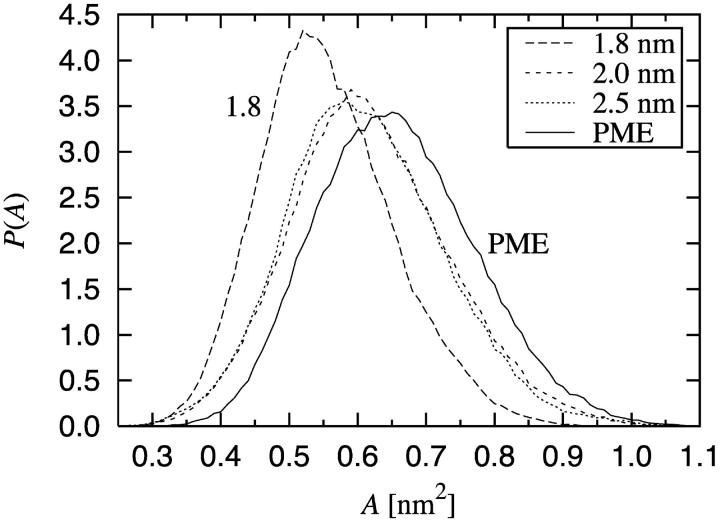
We have extended the above studies by considering the probability distributions for the area per lipid molecule P(A). This quantity is of interest for a number of processes in lipid bilayers, e.g. the lateral diffusion of lipids in the bilayer plane. Results for P(A) are shown in Fig. 3. The distributions reveal that the minimum area per lipid is ∼0.3 nm2. Further, we find that the shapes of the distributions are similar and scaled by the average area per molecule. However, it is worth pointing out that even if the cutoff distance is increased to a value close to the maximal one (i.e., half the linear dimension of the system), the artifacts in P(A) persist. This indicates that cutoff distances even as large as 2.5 nm are not sufficient for a proper quantitative treatment of electrostatics.
FIGURE 3.
Distribution of the area per lipid, P(A), computed by the Voronoi analysis.
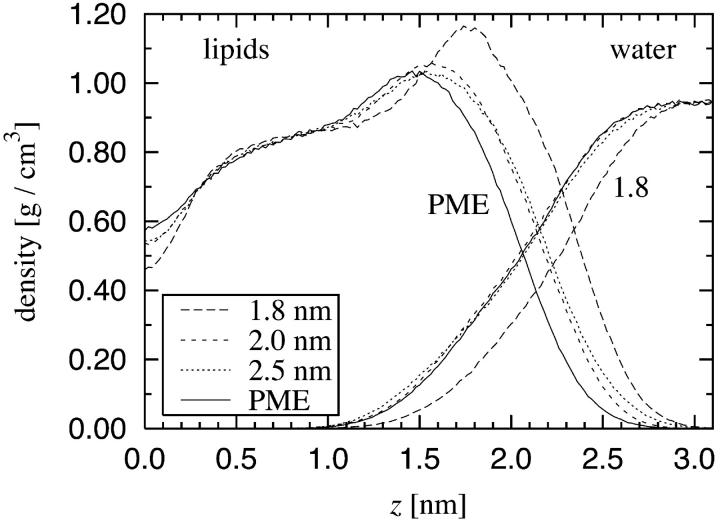
Next we estimate the density distribution and the dimensions along the bilayer normal. The mass density profile for water and lipid molecules is shown in Fig. 4. As before, we find that the smallest cutoff leads to major artifacts as compared to the PME description, whereas the other two truncation distances perform better. The results obtained using any truncation distance are distinctly different from those obtained using PME, however. To demonstrate this, we consider the thickness of the bilayer defined as the point where the densities of water and lipids are equal. The half thicknesses of the bilayers were found to be 2.03 nm for PME, 2.15 nm for rcut = 2.0 nm and 2.5 nm, and 2.33 nm for rcut = 1.8 nm. It is noteworthy that the deviations in these results are of similar size as the deviations found in the average area per molecule. However, although truncation leads to a decreased area per lipid, it also leads to an increased height of the membrane. Thus these two artifacts compensate each other, and one finds that the average volume per lipid obtained by truncation methods is consistent with the value found by PME. This result was confirmed by the Voronoi analysis for the lipid bilayers in three dimensions (data not shown).
FIGURE 4.
Mass density profile across the bilayer computed separately for lipids (left) and water (right). z = 0 corresponds to the center of the bilayer and both sides of the bilayer have been folded toward positive z.
It should be noted that the density of the bulk water phase is essentially independent of the simulation parameters. This is in contrast to the density of the lipid phase. These observations confirm that the differences between the simulations are caused by the electrostatic interactions between the lipids and/or lipids and water, but not by the interactions among the water molecules.
Order parameters
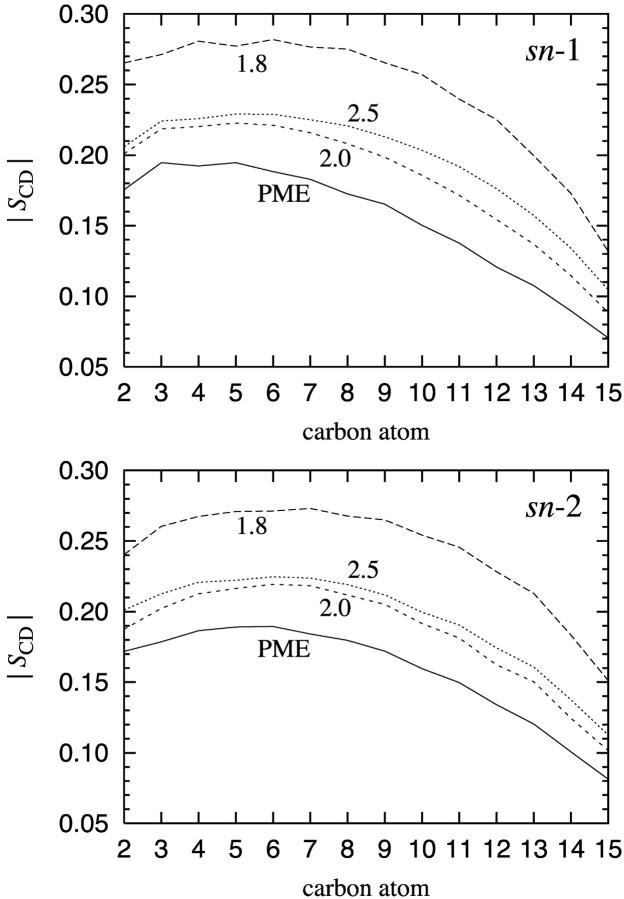
We have computed SCD for all carbon atoms in both chains (sn-1 and sn-2) by averaging over all equivalent atoms in all DPPC molecules. The results are shown in Fig. 5. We find that PME yields an order parameter profile which is in good agreement with experimental data (Brown et al., 1979; Douliez et al., 1995; Petrache et al., 2000). Note that SCD ≈ 0.20 close to the glycerol group, and tends toward zero toward the end of a tail. The acyl chains are therefore reasonably ordered close to the headgroup, whereas conformational disorder becomes more and more apparent toward the center of the bilayer.
FIGURE 5.
The order parameter |SCD| separately for the two acyl chains of DPPC: sn-1 chain and sn-2 chain. For numbering of carbons, see Fig. 1.
The results with different cutoff distances differ significantly from those obtained using PME. The situation close to the glycerol group clearly demonstrates the problem. The truncation of electrostatic forces at rcut = 2.0 nm and 2.5 nm yields order parameters that deviate ∼13% from the values obtained using PME. In the case of rcut = 1.8 nm, the deviation is even larger, being of the order of 40% close to the glycerol group. Differences are expected since the ordering of acyl chains must be affected by the packing of lipids as discussed in the previous section. A reduction in the area per molecule leads to an enhanced ordering of the acyl chains and correlates with an increased thickness of the bilayer.
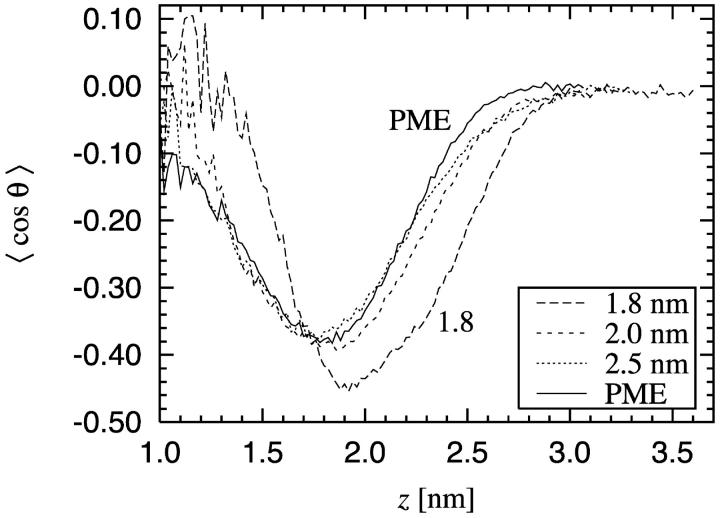
We have also considered the ordering of water in the vicinity of the bilayer-water interface by calculating the time averaged projection of the water-dipole unit vector onto the interfacial normal. As revealed by Fig. 6, the water molecules prefer to order themselves in such a way that the dipoles are oriented toward the bilayer. Ordering persists up to the height where the density of the lipids approaches zero.
FIGURE 6.
P(z) = 〈cos θ〉 describing the ordering of water close to the bilayer-water interface. z = 0 corresponds to the center of the bilayer. The noise at small z is due to the small number of water molecules inside the bilayer.
This ordering can be explained by the orientational behavior of water molecules around phosphoryl groups. The radial distribution of the oxygens and hydrogens of the water molecules around the phosphatidyl and choline groups were determined (data not shown), revealing that the water molecules are strongly oriented around the phosphorus atom. This is due to the hydrogen bonding between the oxygen atoms of the phosphatidyl group and the hydrogen atoms of the water molecules. Only a weak orientation is found around the nitrogen atom, most likely due to the hydrophobic nature of the surrounding methyl groups, which results in hydrogen bonding among the water molecules. This behavior is very similar for the different treatments of electrostatic interactions and also to earlier MD simulation studies of phosphatidylcholine systems (Alper et al., 1993a; Damodaran and Merz, 1994; Essman et al., 1995a; Hyvönen et al., 1997). As the number of hydrogen-bonded water molecules around the phosphatidyl group is larger on the side of the water region, the dominating orientation of the water dipoles is toward the bilayer center. Only a few water molecules penetrate into the hydrocarbon region, resulting in poor statistics and a spiky profile.
To conclude this section, our results indicate that the ordering of fatty acyl chains is strongly affected by the method by which electrostatic interactions are treated. In addition, we find that the use of a relatively large cutoff in electrostatic interactions does not give rise to major artifacts in the properties of water molecules themselves or their radial distribution around the headgroups. At the surface of the bilayer, however, packing of lipids affects the properties of the interfacial water layer. These conclusions support the view of previous research on the properties of water close to a water-lipid monolayer interface (Alper et al., 1993a,b; Feller et al., 1996). In these studies it was found that the artifacts were reduced by an increase in the cutoff, but were not eliminated for cutoff distances as large as rcut = 1.8 nm. The work by Feller et al. provides a particularly interesting example of this issue, since they considered the radial distribution of oxygen-oxygen pairs in bulk water and found minor peaks close to the cutoff distance (Feller et al., 1996). This is consistent with our results for RDFs close to the water-bilayer interface. We studied the radial distribution functions for O-N and O-P pairs (where O stands for oxygen in water) and found very weak but systematic ordering effects at rcut. In RDFs found by PME, such ordering effects were not present.
Electrostatic potential
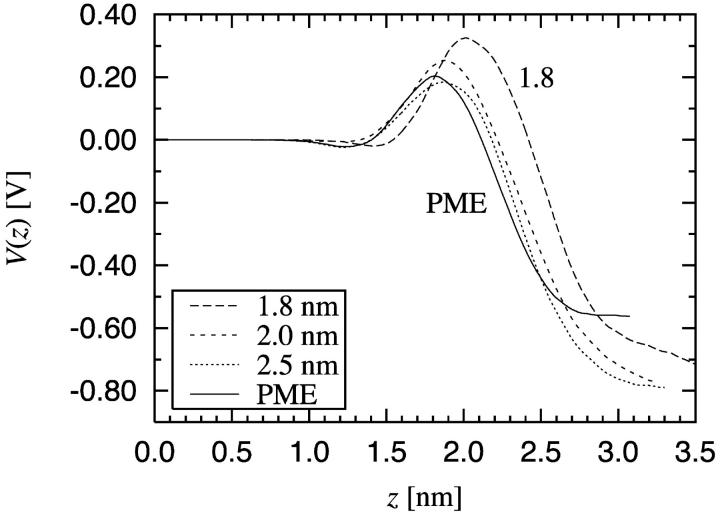
Based on the results discussed above, it seems obvious that the truncation of Coulombic interactions plays an important role in the electrostatic properties of the bilayer. To verify this and to quantify the magnitude of possible artifacts due to truncation, we studied the electrostatic potential V(z). The results are shown in Fig. 7.
FIGURE 7.
Total electrostatic potential V(z) across the bilayer, where z = 0 corresponds to the center of the bilayer.
The general behavior agrees with previous simulation studies of PC bilayers (Tieleman and Berendsen, 1996; Shinoda et al., 1998b; Smondyrev and Berkowitz, 1999, 2000). The lipid molecules contribute with a large positive potential, which is compensated by the contribution due to the water molecules. The total potential was determined to be −570 mV. For comparison, the experimental values for the potential range from −200 mV to −575 mV for different PC/water interfaces (Flewelling and Hubbel, 1986; Simon and McIntosh, 1989; Gawrisch et al., 1992; McIntosh et al., 1992).
As what comes to the differences between the curves in Fig. 7, we note that the profiles of V(z) are correlated with the mass density profiles in Fig. 4. The differences in the packing of lipids are also reflected in the electrostatic potential: The strongest orientation of water molecules is found just above the peak in the density of lipids, and the orientation of the water ranges just as far as the headgroups of the lipids prevail.
Radial distribution of lipids
We first consider RDFs between the two charged groups in a DPPC molecule. The positively charged choline group is at the top and the negatively charged phosphate group at the lower part of the headgroup (see Fig. 1). However, the average orientation of the P-N vector is almost parallel to the plane of the bilayer (data not shown). The details of the calculation are described in the section for data analysis.
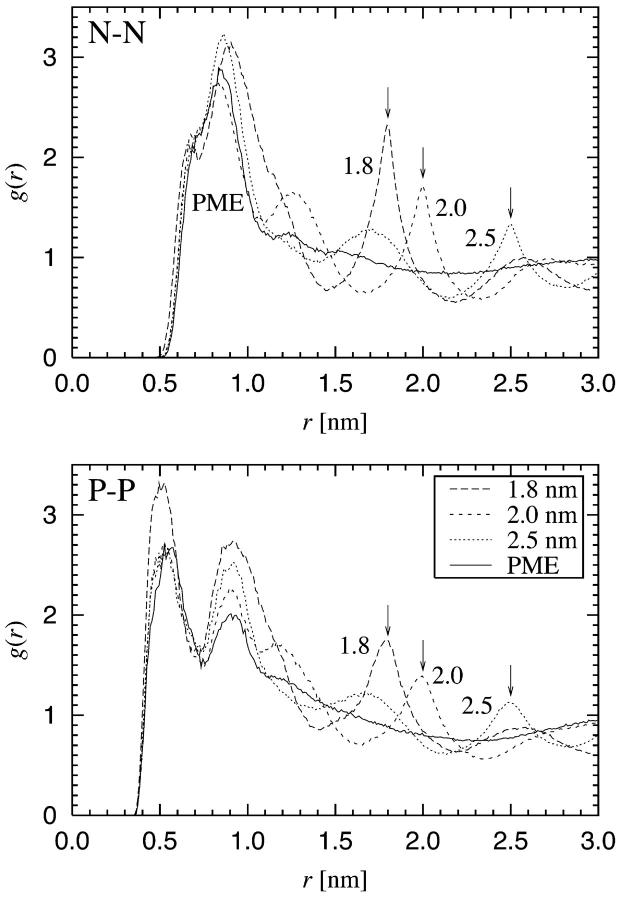
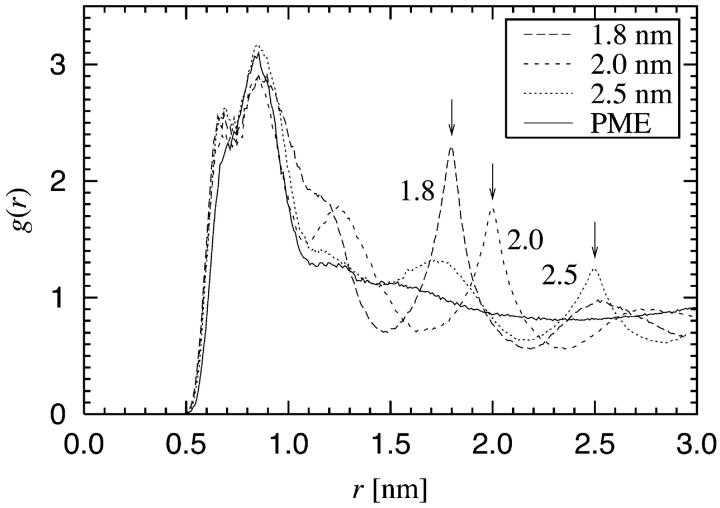
The RDFs for the two pairs of P and N atoms in the headgroup are shown in Fig. 8. The RDF of N-N pairs serves as a good example of our findings. The application of PME yields a radial distribution function which has a hard core at small distances, a rather narrow peak around 0.8 nm, and essentially no structure beyond r = 1.0 nm. This behavior is expected since we are dealing with a liquid-crystalline phase in the absence of translational order in the bilayer plane. The RDFs from the simulations in which a cutoff was used are dramatically different. In all of these cases we find that there is a wildly oscillating long-range component which has a local maximum exactly at the cutoff distance. In addition to this, the oscillations persist for distances far beyond rcut. Although the details are slightly different for P-P (as well as N-P) pairs, similar conclusions on artificial ordering can be drawn.
FIGURE 8.
Radial distribution function (RDF) g(r) between the two central atoms in the headgroup of a DPPC molecule: RDFs for N-N and P-P pairs. Cutoff distances are indicated by arrows.
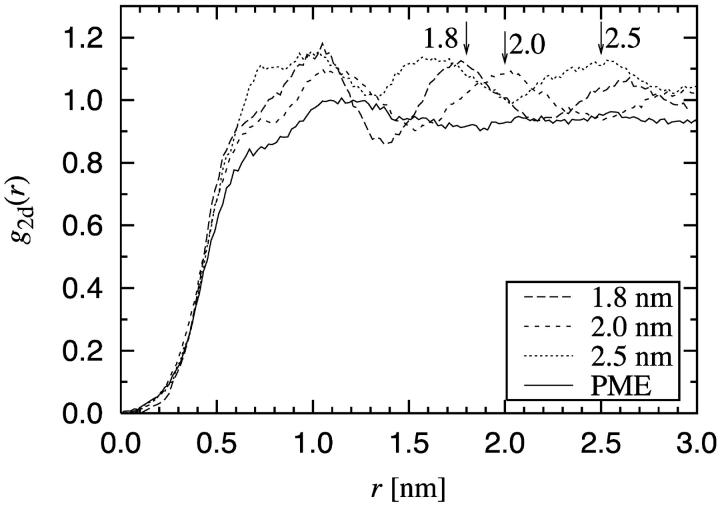
These structural artifacts have a very strong character. This is evident from the RDF for the DPPC center of mass positions presented in Fig. 9. The g(r) given by the PME method is consistent with the assumption of a fluid-like phase, having just a small peak around 1.2 nm. The truncation methods, on the other hand, give rise to further structure manifested as artificial maxima precisely at the cutoff distance.
FIGURE 9.
Radial distribution function g2d(r) for the center of mass positions of the DPPC molecules. Note the relatively soft core of g(r) in the vicinity of r = 0. This is due to the fact that the lipids may be entangled around each other such that the x,y coordinates of their center of mass positions may lie close to each other.
Results of similar nature have been reported for ionic systems (van Gunsteren and Mark, 1998). For an aqueous NaCl solution van Gunsteren and Mark found that the truncation of Coulombic interactions gave rise to an artificial peak around the cutoff distance. In our work the DPPC molecules are polar, though the behavior of the bilayer is not expected to be solely dictated by polar groups. In this sense, the pronounced artifacts in Fig. 9 for lipid molecules may come as a surprise.
We can conclude that the truncation of electrostatic interactions gives rise to artificial order in the plane of the membrane. Truncation changes the phase behavior of the bilayers, and consequently affects thermodynamic properties such as the compressibility of the bilayer. It is clear that this is a matter of serious concern. It suggests that the truncation of Coulombic interactions in lipid bilayer systems may not only influence the short-range order of the system, but also the long-range behavior. Various intriguing phenomena such as organization of bilayer-protein systems involve scales of several molecular diameters. The artificial ordering observed in this work persists over these distances, and care should be taken when treating these systems.
SUMMARY AND CONCLUSIONS
We have investigated the effects of truncating Coulombic interactions on the properties of a DPPC bilayer and water in the vicinity of a bilayer-water interface. We have found that the truncation of electrostatic interactions can have serious consequences for the structural and electrostatic properties of lipid bilayer systems. The reduced area per molecule and the corresponding changes in the ordering of acyl chains provide two examples of the problems associated with truncation. Preliminary studies of dynamic quantities such as the lateral diffusion coefficient have shown that they can also be sensitive to truncation. However, a thorough analysis of this issue requires simulations over much longer timescales (Patra et al., unpublished results). As shown in this work, these artifacts are due to the fact that truncation gives rise to artificial ordering in the bilayer plane, which in turn implies that the lipid bilayer is no longer in a truly fluid-like state. Instead, the artificial order persists over a long range, which for typical system sizes studied by molecular dynamics simulations may exceed the actual size of the system. Furthermore, since the artificial order due to truncation affects the phase behavior of the system, we may conclude that there is indeed a reason for major concern.
The particle-mesh Ewald (PME) technique, on the other hand, has performed very well in this study. Besides providing results consistent with experimental data, it has given no reason for concern with respect to pair correlation behavior in the plane of the bilayer. The current trend of using PME in MD simulations of lipid membrane systems seems to be justified and should be encouraged.
We would like to stress, however, that even PME and its variants may lead to artifacts unless great care is taken. These artifacts are related to the periodicity of the system, as periodic boundary conditions are used to eliminate finite size effects in simulations of small systems. Hünenberger et al. have observed (Hünenberger and McCammon, 1999; Weber et al., 2000) that the artificial periodicity used in Ewald techniques may indeed affect the conformational equilibria of e.g. peptides and proteins by stabilizing the most compact conformations of the molecules. Despite the fact that a substantial amount of work has already been done (Sagui and Darden, 1999; Martyna and Tuckerman, 1999; Zhou et al., 2001; Mináry et al., 2002; Karttunen et al., 2002), it is clear that more attention is called for to develop more reliable and efficient techniques for dealing with electrostatic interactions in simulations of biomolecular systems.
Acknowledgments
This work has, in part, been supported by the Academy of Finland through its Center of Excellence Program (E.F., P.L., and I.V.), the National Graduate School in Materials Physics (E.F.), the Academy of Finland Grant Nos. 54113 (M.K.) and 80246 (I.V.), the Jenny and Antti Wihuri Foundation (M.H.), and the Federation of Finnish Insurance Companies (M.H.).
APPENDIX A: EFFECT OF OTHER SIMULATION PARAMETERS
We have complemented the main body of research by further simulations to check the importance of other simulation parameters in the present work. For example, we have checked the importance of constraints by keeping the DPPC bonds flexible, investigated the role of pressure coupling by a study in which the time constant of the barostat was set to a value of 5 ps, and repeated all the simulations at a temperature of T = 325 K. In all cases we have found that both the quantitative results and the conclusions remain the same. However, changing the cutoff of the van der Waals interaction rvdW appears to have effects worth noticing. Although the parameterization of DPPC was done with a cutoff of rvdW = 1.0 nm, and was therefore used in the major part of this study, the value of 1.4 nm is also a common choice. This is motivated in particular by the Gromos96 force field which assumes rvdW = 1.4 nm.
Simulations similar to those with rvdW = 1.0 nm have been run with rvdW = 1.4 nm. The average area per lipid using PME is reduced by 0.051 nm2, whereas the average areas per lipid for the three different cutoffs—rcut = 1.8 nm, 2.0 nm, or 2.5 nm—are reduced by 0.017, 0.046, and 0.067 nm2, respectively. This trend is understandable since an increase in rvdW effectively increases the attractive interaction between acyl chains, thus reducing the area per molecule. Interestingly, also the average volume per lipid is reduced by about 0.03 nm3, as was revealed by the Voronoi analysis of lipid bilayers in three dimensions. Despite these quantitative differences between the different cutoff distances for the van der Waals interactions, the conclusions of our work remain intact. This is demonstrated in Fig. 10, which presents data for the RDFs between the N-N pairs with a cutoff rvdW = 1.4 nm. The data indicate that the truncation of electrostatic interactions still gives rise to artificial ordering, which is not observed in the case of PME.
FIGURE 10.
Radial distribution function for N-N pairs in the headgroups of DPPC molecules based on simulations with a van der Waals cutoff rvdW = 1.4 nm (cf. Fig. 8 with rvdW = 1.0 nm). Cutoff distances are indicated by arrows.
References
- Alper, H. E., D. Bassolino, and T. R. Stouch. 1993a. Computer simulation of a phospholipid monolayer-water system: The influcence of long range forces on water structure and dynamics. J. Chem. Phys. 98:9798–9807. [Google Scholar]
- Alper, H. E., D. Bassolino-Klimas, and T. R. Stouch. 1993b. The limiting behavior of water hydrating a phospholipid monolayer: A computer simulation study. J. Chem. Phys. 99:5547–5559. [Google Scholar]
- Alper, H. E., and R. M. Levy. 1989. Computer simulations of the dielectric properties of water: Studies of the simple point charge and transferrable intermolecular potential models. J. Chem. Phys. 91:1242–1251. [Google Scholar]
- Bandyopadhyay, S., M. Tarek, and M. L. Klein. 1999. Molecular dynamics study of a lipid-DNA complex. J. Phys. Chem. B. 103:10075–10080. [Google Scholar]
- Berendsen, H. J. C., J. P. M. Postma, W. F. van Gunsteren, A. DiNola, and J. R. Haak. 1984. Molecular dynamics with coupling to an external bath. J. Chem. Phys. 81:3684–3690. [Google Scholar]
- Berendsen, H. J. C., J. P. M. Postma, W. F. van Gunsteren, and J. Hermans. 1981. Interaction models for water in relation to protein hydration. In Intermolecular Forces. B. Pullman, editor, Reidel, Dordrecht, The Netherlands. 331–342.
- Berger, O., O. Edholm, and F. Jahnig. 1997. Molecular dynamics simulations of a fluid bilayer of dipalmitoylphosphatidylcholine at full hydration, constant pressure, and constant temperature. Biophys. J. 72:2002–2013. [DOI] [PMC free article] [PubMed] [Google Scholar]
- Besold, G., I. Vattulainen, M. Karttunen, and J. M. Polson. 2000. Towards better integrators for dissipative particle dynamics simulations. Phys. Rev. E. 62:R7611–R7614. [DOI] [PubMed] [Google Scholar]
- Bloom, M., E. Evans, and O. G. Mouritsen. 1991. Physical properties of the fluid lipid-bilayer component of cell membranes: A perspective. Q. Rev. Biophys. 24:293–397. [DOI] [PubMed] [Google Scholar]
- Brown, M. F., J. Seelig, and U. Häberlen. 1979. Structural dynamics in phospholipid bilayers from deuterium spin-lattice relaxation time measurements. J. Chem. Phys. 70:5045–5053. [Google Scholar]
- Chiu, S.-W., M. Clark, S. Subramaniam, and E. Jacobsson. 2000. Collective motion artifacts arising in long-duration molecular dynamics simulations. J. Comput. Chem. 21:121–131. [Google Scholar]
- Chiu, S. W., E. Jacobsson, R. J. Mashl, and H. L. Scott. 2002. Cholesterol-induced modifications in lipid bilayers: A simulation study. Biophys. J. 83:1842–1853. [DOI] [PMC free article] [PubMed] [Google Scholar]
- Damodaran, K. V., and J. K. M. Merz. 1994. A comparison of DMPC- and DLPE-based lipid bilayers. Biophys. J. 66:1076–1087. [DOI] [PMC free article] [PubMed] [Google Scholar]
- Douliez, J.-P., A. Leonard, and E. J. Dufourc. 1995. Restatement of order parameters in biomembranes: Calculation of C–C bond order parameters from C-D quadrupolar splittings. Biophys. J. 68:1727–1739. [DOI] [PMC free article] [PubMed] [Google Scholar]
- Essman, U., L. Perera, and M. L. Berkowitz. 1995a. The origin of the hydration interaction of lipid bilayers from MD simulation of dipalmitoylphosphatidylcholine membranes in gel and liquid crystalline phases. Langmuir. 11:4519–4531. [Google Scholar]
- Essman, U., L. Perera, M. L. Berkowitz, H. L. T. Darden, and L. G. Pedersene. 1995b. A smooth particle mesh Ewald method. J. Chem. Phys. 103:8577–8592. [Google Scholar]
- Feller, S. E. 2000. Molecular dynamics simulations of lipid bilayers. Curr. Opin. Colloid Interface Sci. 5:217–223. [Google Scholar]
- Feller, S. E., K. Gawrisch, and A. D. MacKerell, Jr. 2001. Polyunsaturated fatty acids in lipid bilayers: Intrinsic and environmental contributions to their unique physical properties. J. Am. Chem. Soc. 124:318–326. [DOI] [PubMed] [Google Scholar]
- Feller, S. E., R. W. Pastor, A. Rojnuckarin, S. Bogusz, and B. R. Brooks. 1996. Effect of electrostatic force truncation on interfacial and transport properties of water. J. Phys. Chem. 100:17011–17020. [Google Scholar]
- Flewelling, R. F., and W. L. Hubbel. 1986. The membrane dipole potential in a total membrane potential model. Biophys. J. 49:541–552. [DOI] [PMC free article] [PubMed] [Google Scholar]
- Frenkel, D., and B. Smit. 2002. Understanding Molecular Simulation: From Algorithms to Applications, 2nd edition. Academic Press, San Diego.
- Gawrisch, K., D. Ruston, J. Zimmerberg, V. A. Parsegian, R. P. Rand, and N. Fuller. 1992. Membrane dipole potentials, hydration forces, and the ordering of water at membrane surface. Biophys. J. 61:1213–1223. [DOI] [PMC free article] [PubMed] [Google Scholar]
- Greengard, L., and V. Rokhlin. 1987. A fast algorithm for particle simulation. J. Comput. Phys. 73:325–348. [Google Scholar]
- Hess, B., H. Bekker, H. J. C. Berendsen, and J. G. E. M. Fraaije. 1997. LINCS: A linear constraint solver for molecular simulations. J. Comput. Chem. 18:1463–1472. [Google Scholar]
- Hünenberger, P. H., and J. A. McCammon. 1999. Effect of artificial periodicity in simulations of biomolecules under Ewald boundary conditions: A continuum electrostatics study. Biophys. Chem. 78:69–88. [DOI] [PubMed] [Google Scholar]
- Hyvönen, M., T. T. Rantala, and M. Ala-Korpela. 1997. Structure and dynamic properties of diunsaturated 1-palmitoyl-2-linoleoyl-sn-glycero-3-phosphatidylcholine lipid bilayer from molecular dynamics simulation. Biophys. J. 73:2907–2923. [DOI] [PMC free article] [PubMed] [Google Scholar]
- Ibragimova, G. T., and R. C. Wade. 1998. Importance of explicit salt ions for protein stability in molecular dynamics simulation. Biophys. J. 74:2906–2911. [DOI] [PMC free article] [PubMed] [Google Scholar]
- Jakobsson, E., S. Subramaniam, and H. L. Scott. 1996. Strategic issues in molecular dynamics simulations of membranes. In Biological membranes–A Molecular Perspective from Computation And Experiment, K. M. Merz, Jr. and B. Roux, editors. Dordrecht Birkhäuser, Boston. 105–123.
- Karttunen, M., A. L. Pakkanen, P. K. Kinnunen, and K. Kaski. 2002. Computational modeling of DNA-cationic lipid complexation. Cell. Mol. Biol. Lett. 7:238–239. [PubMed] [Google Scholar]
- Katsaras, J., and T. Gutberlet. 2001. Lipid bilayers: Structure and Interactions. Springer-Verlag, Berlin.
- Langer, R. 1998. Drug delivery and targeting. Nature. 392(Suppl.):5–10. [PubMed] [Google Scholar]
- Leach, A. R. 2001. Molecular Modelling: Principles and Applications, 2nd edition. Prentice Hall, Harlow.
- Lindahl, E., and O. Edholm. 2000. Mesoscopic undulations and thickness fluctuations in lipid bilayers from molecular dynamics simulations. Biophys. J. 79:426–433. [DOI] [PMC free article] [PubMed] [Google Scholar]
- Lindahl, E., B. Hess, and D. van der Spoel. 2001. GROMACS 3.0: A package for molecular simulation and trajectory analysis. J. Mol. Model. 7:306–317. [Google Scholar]
- Lipowsky, R., and E. Sackmann. 1995. Structure and dynamics of membranes: From cells to vesicles. Elsevier, Amsterdam.
- Marrink, S. J., E. Lindahl, O. Edholm, and A. E. Mark. 2001. Simulation of the spontaneous aggregation of phospholipids into bilayers. J. Am. Chem. Soc. 123:8638–8639. [DOI] [PubMed] [Google Scholar]
- Marrink, S. J., and D. P. Tieleman. 2002. Molecular dynamics simulation of spontaneous membrane fusion during a cubic-hexagonal phase transition. Biophys. J. 83:2386–2392. [DOI] [PMC free article] [PubMed] [Google Scholar]
- Martyna, G. J., and M. E. Tuckerman. 1999. A reciprocal space based method for treating long range interactions in ab initio and force-field-based calculations in clusters. J. Chem. Phys. 110:2810–2821. [Google Scholar]
- McIntosh, T. J., S. A. Simon, D. Needham, and C.-H. Huang. 1992. Interbilayer interactions between sphingomyelin and sphingomyelin/cholesterol bilayers. Biochemistry. 31:2020–2024. [DOI] [PubMed] [Google Scholar]
- Merz, K. M., Jr., and B. Roux. 1996. Biological membranes: A molecular perspective from computation and experiment. Birkhäuser, Boston.
- Mináry, P., M. E. Tuckerman, K. A. Pihakari, and G. J. Martyna. 2002. A new reciprocal space based treatment of long range interactions on surfaces. J. Chem. Phys. 116:5351–5362. [DOI] [PubMed] [Google Scholar]
- Nagle, J. F., and S. Tristram-Nagle. 2000. Structure of lipid bilayers. Biochim. Biophys. Acta. 1469:159–195. [DOI] [PMC free article] [PubMed] [Google Scholar]
- Norberg, J., and L. Nilsson. 2000. On the truncation of long-range electrostatic interactions in DNA. Biophys. J. 79:1537–1553. [DOI] [PMC free article] [PubMed] [Google Scholar]
- Pandit, S. A., and M. L. Berkowitz. 2002. Molecular dynamics simulation of dipalmitoylphosphatidylserine bilayer with Na+ counterions. Biophys. J. 82:1818–1827. [DOI] [PMC free article] [PubMed] [Google Scholar]
- Petrache, H. I., S. W. Dodd, and M. F. Brown. 2000. Area per lipid and acyl length distributions in fluid phosphatidylcholines determined by 2H NMR spectroscopy. Biophys. J. 79:3172–3192. [DOI] [PMC free article] [PubMed] [Google Scholar]
- Sagui, C., and T. A. Darden. 1999. Molecular dynamics simulations of biomolecules: Long-range electrostatic effects. Annu. Rev. Biophys. Biomol. Struct. 28:155–179. [DOI] [PubMed] [Google Scholar]
- Saiz, L., and M. L. Klein. 2001. Structural properties of a highly polyunsaturated lipid bilayer from molecular dynamics simulations. Biophys. J. 81:204–216. [DOI] [PMC free article] [PubMed] [Google Scholar]
- Saiz, L., and M. L. Klein. 2002. Computer simulation studies of model biological membranes. Acc. Chem. Res. 35:482–489. [DOI] [PubMed] [Google Scholar]
- Schreiber, H., and O. Steinhauser. 1992. Cutoff size does strongly influence molecular dynamics results on solvated polypeptides. Biochemistry. 31:5856–5860. [DOI] [PubMed] [Google Scholar]
- Shinoda, W., and S. Okazaki. 1998a. A Voronoi analysis of lipid area fluctuation in a bilayer. J. Chem. Phys. 109:1517–1521. [Google Scholar]
- Shinoda, W., M. Shimizu, and S. Okazaki. 1998b. Molecular dynamics study on electrostatic properties of a lipid bilayer: Polarization, electrostatic potential, and the effects on structure and dynamics of water near the interface. J. Phys. Chem. B. 102:6647–6654. [Google Scholar]
- Simon, S. A., and T. J. McIntosh. 1989. Magnitude of the solvation pressure depends on dipole potential. Proc. Natl. Acad. Sci. USA. 86:9263–9267. [DOI] [PMC free article] [PubMed] [Google Scholar]
- Smith, P. E., and B. M. Pettitt. 1991. Peptides in ionic solutions: A comparison of the Ewald and switching function techniques. J. Chem. Phys. 95:8430–8441. [Google Scholar]
- Smondyrev, A. M., and M. L. Berkowitz. 1999. Structure of dipalmitoylphosphatidylcholine/cholesterol bilayer at low and high cholesterol concentrations: Molecular dynamics simulation. Biophys. J. 77:2075–2089. [DOI] [PMC free article] [PubMed] [Google Scholar]
- Smondyrev, A. M., and M. L. Berkowitz. 2000. Molecular dynamics simulation of dipalmitoylphosphatidylcholine membrane with cholesterol sulfate. Biophys. J. 78:1672–1680. [DOI] [PMC free article] [PubMed] [Google Scholar]
- Steinbach, P. J., and B. R. Brooks. 1994. New spherical-cutoff methods for long-range forces in macromolecular simulations. J. Comput. Chem. 15:667–683. [Google Scholar]
- Tieleman, D. P., and H. J. C. Berendsen. 1996. Molecular dynamics simulations of a fully hydrated dipalmitoylphosphatidylcholine bilayer with different macroscopic boundary conditions and parameters. J. Chem. Phys. 105:4871–4880. [Google Scholar]
- Tieleman, D. P., S. J. Marrink, and H. J. C. Berendsen. 1997. A computer perspective of membranes: Molecular dynamics studies of lipid bilayer systems. Biochim. Biophys. Acta. 1331:235–270. [DOI] [PubMed] [Google Scholar]
- Tobias, D. J. 2001. Electrostatics calculations: Recent methodological advances and applications to membranes. Curr. Opin. Struct. Biol. 11:253–261. [DOI] [PubMed] [Google Scholar]
- van Gunsteren, W. F., and A. E. Mark. 1998. Validation of molecular dynamics simulation. J. Chem. Phys. 108:6109–6116. [Google Scholar]
- Vattulainen, I., M. Karttunen, G. Besold, and J. M. Polson. 2002. Integration schemes for dissipative particle dynamics: From softly interacting systems towards hybrid models. J. Chem. Phys. 116:3967–3979. [Google Scholar]
- Venable, R. M., B. R. Brooks, and R. W. Pastor. 2000. Molecular dynamics simulations of gel Lβ I phase lipid bilayers in constant pressure and constant surface area ensembles. J. Chem. Phys. 112:4822–4832. [Google Scholar]
- Weber, W., P. H. Hünenberger, and J. A. McCammon. 2000. Molecular dynamics simulations of a polyalanine octapeptide under Ewald boundary conditions: Influence of artificial periodicity on peptide conformation. J. Phys. Chem. B. 104:3668–3675. [Google Scholar]
- York, D. M., T. A. Darden, and L. G. Pedersen. 1993. The effect of long-range electrostatic interactions in simulations of macromolecular crystals: A comparison of the Ewald and truncated list methods. J. Chem. Phys. 99:8345–8348. [Google Scholar]
- York, D. M., W. Yang, H. Lee, T. Darden, and L. G. Pedersen. 1995. Toward the accurate modeling of DNA: The importance of long-range electrostatics. J. Am. Chem. Soc. 117:5001–5002. [Google Scholar]
- Zhou, R., E. Harder, H. Xu, and B. J. Berne. 2001. Efficient multiple time step method for used with Ewald and particle mesh Ewald for large biomolecular systems. J. Chem. Phys. 115:2348–2358. [Google Scholar]


