

Abstract
A composite continuum theory for calculating ion current through a protein channel of known structure is proposed, which incorporates information about the channel dynamics. The approach is utilized to predict current through the Gramicidin A ion channel, a narrow pore in which the applicability of conventional continuum theories is questionable. The proposed approach utilizes a modified version of Poisson-Nernst-Planck (PNP) theory, termed Potential-of-Mean-Force-Poisson-Nernst-Planck theory (PMFPNP), to compute ion currents. As in standard PNP, ion permeation is modeled as a continuum drift-diffusion process in a self-consistent electrostatic potential. In PMFPNP, however, information about the dynamic relaxation of the protein and the surrounding medium is incorporated into the model of ion permeation by including the free energy of inserting a single ion into the channel, i.e., the potential of mean force along the permeation pathway. In this way the dynamic flexibility of the channel environment is approximately accounted for. The PMF profile of the ion along the Gramicidin A channel is obtained by combining an equilibrium molecular dynamics (MD) simulation that samples dynamic protein configurations when an ion resides at a particular location in the channel with a continuum electrostatics calculation of the free energy. The diffusion coefficient of a potassium ion within the channel is also calculated using the MD trajectory. Therefore, except for a reasonable choice of dielectric constants, no direct fitting parameters enter into this model. The results of our study reveal that the channel response to the permeating ion produces significant electrostatic stabilization of the ion inside the channel. The dielectric self-energy of the ion remains essentially unchanged in the course of the MD simulation, indicating that no substantial changes in the protein geometry occur as the ion passes through it. Also, the model accounts for the experimentally observed saturation of ion current with increase of the electrolyte concentration, in contrast to the predictions of standard PNP theory.
INTRODUCTION
Ion permeation through narrow protein channels is a topic of considerable current interest (Andersen and Koeppe II, 1992; Dorman et al., 1996; Eisenberg, 1999; Hille et al., 1999; Roux et al., 2000; Kuyucak et al., 2001). The importance of ion transport for many vital cell functions is difficult to overestimate. Processes in which substantial ionic currents are generated in membrane channels include maintenance of ionic concentration gradients across the cell membrane, generation of action potentials in neurons, and autowaves in heart muscle, to name just three. Moreover, many modern drugs target ionic channels to modify their action (Nilius and Droogmans, 2001; Lerche et al., 2001; Antonov, 2001; Marban, 2002). Therefore, in addition to extensive experimental effort, there is much theoretical interest in understanding mechanisms of ion channel function at the molecular level. Recent advances in solving three-dimensional structures of membrane proteins in general and channel proteins in particular (Koprowski and Kubalski, 2001) have enabled attempts at detailed molecular level modeling of ion current through protein channels (Kurnikova et al., 1999; Allen et al., 1999; Cardenas et al., 2000; see also recent reviews of the subject: Kuyucak et al., 2001; Tieleman et al., 2001). A first attempt to perform a full-scale nonequilibrium molecular dynamics (MD) simulation of ion current through a simplified model channel at very high ion concentrations and applied voltage has been reported recently (Crozier et al., 2001a,b). However, nonequilibrium MD simulations are too expensive for realistic biological ion channel systems at physiological conditions because of the many different timescales and length scales involved. Instead, several Dynamic Monte Carlo (Graf et al., 2000, and Graf, unpublished results) and Brownian Dynamics studies (Corry et al., 2001; Chung et al., 1999; Allen et al., 1999; Im et al., 2000; Burykin et al., 2002; Mashl et al., 2001) of current-voltage relations through different natural and model channels have been recently reported.
A key conclusion drawn from these studies is that the dielectric self-energy (DSE) which arises when an ion moves through a relatively narrow channel with diameter of up to ∼1 nm greatly affects the dynamics of ion permeation (Corry et al., 2000; Graf et al., 2000; Graf, unpublished results; Dieckmann et al., 1999). A charged particle which moves from a highly polarizable medium such as water solution into a low polarity medium such as a protein surrounded by a lipid bilayer experiences a dielectric barrier or dielectric self-energy. Several studies have demonstrated that transport through a narrow channel is greatly reduced or even completely inhibited by the presence of a dielectric barrier (Corry et al., 2000; Graf et al., 2000; Graf, unpublished results; Chung et al., 1999). In contrast, experimentally observed currents through narrow channels such as Gramicidin A (GA) are not negligible but, on the contrary, quite substantial—measured in tens of millions of ions per second (Hille, 1992). Therefore, these relatively small and simple molecular structures function very efficiently as ion channels. One thus suspects that a rigid model of a narrow membrane channel is inadequate for describing its ionic permeability. What is obviously missing from this oversimplified model is the motion of the channel structure itself. The importance of this aspect of ion-channel operation has been clearly demonstrated in equilibrium simulations (Roux and Karplus, 1993). In this article we propose a modeling approach that takes into account the dynamic implication of this motion for the transport of ions under nonequilibrium conditions. The proposed approach can describe ion currents (a long timescale process) while accounting for the molecular flexibility of the channel protein (fast conformational changes on a short timescale) which forms the channel. We examine the possible mechanisms by which a functional channel overcomes the impediment of a dielectric barrier and devise a model of an ion channel that is free of fitting parameters (except for a reasonable choice of dielectric constants) and realistic enough to yield ion currents which are compatible with experimental observations. We employ a combination of modeling methods that span a range of molecular resolutions (particle dynamics, continuum electrostatics), thus enabling treatment of ion channel permeation from first principles.
Ion permeation is slow on a molecular timescale. As an ion passes through the channel, the protein channel molecule has time to adjust its local geometry to the presence of the ion instantaneously on the timescale of the ion transport (Mackay et al., 1984; Partenskii and Jordan, 1992; Roux and Karplus, 1993; Berneche and Roux, 2000). We have performed an equilibrium MD study of protein channel relaxation with an ion placed at various positions inside the channel. Our simulations reveal that the introduction of an ion into the channel causes only small changes in the three-dimensional structure of the protein in agreement with previous studies of an Na+ ion in GA channel (Woolf and Roux, 1997). These small structural changes, however, substantially alter the ion-protein electrostatic interaction energy, leading to the relative stabilization of the ion-channel complex. This observation forms the basis for the numerical approach proposed herein.
The remainder of this article is organized as follows. In “Theory and Simulation Methods” section the theoretical formulation is discussed and the simulation methods used are outlined. The “Simulation Procedure” section describes the system studied and provides details of the numerical modeling. Our results are presented and discussed in Results and Discussion, followed by a Conclusions section. An Appendix is provided with a summary of terms and abbreviations used throughout the article.
THEORY AND SIMULATION METHODS
Potential-of-Mean-Force-Poisson-Nernst-Planck (PMFPNP) approach to calculate ion currents through the channel
In continuum theory, electrolyte ions are treated as a continuous charge distribution characterized by the concentrations  of the ionic species involved. The electric charge of the ith ionic species is qi and the associated charge density is
  The distribution of these concentrations is governed by a set of drift-diffusion equations, also called Nernst-Planck equations, one for each ionic species i present in solution. In particular,
  the flux of species i at a given point in space, is given by
 |
(1a) |
and the concentration of species i evolves in accordance with the continuity equation  In Eq. 1a, Di is the position-dependent diffusion coefficient of species i,
  is the inverse temperature, k is the Boltzmann constant, and T is the absolute temperature. Finally,
  is the free energy of ions of species i in solution. At steady state,
 |
(1b) |
and thus all quantities in Eq. 1 are time-independent. The second term on the right-hand side of Eq. 1a is the drift term due to the forces acting on a charged particle of species i from both ion-ion interactions and external sources. The latter include interactions with fixed charges on the protein system and the externally imposed electric field. Eq. 1 is supplemented by concentration boundary conditions that account for the external bulk ionic concentrations of species i (which may be different on different boundary “faces,” particularly if concentrations in the bathing solutions on the two sides of the membrane differ).
In a continuum model  depends on the electrostatic charge distribution in the system and on the (generally position-dependent) dielectric response function
  It is convenient to separate the ion free energy into two contributions:
 |
(2) |
where  is the electrostatic potential due to all mobile ions and the applied electric field associated with external electrodes, and
  is the potential of mean force (PMF) (McQuarrie, 1976) for a single test ion (hence “single ion potential,” or SIP). In an inhomogeneous dielectric medium,
  is determined by the Poisson equation:
 |
(3) |
subject to Dirichlet boundary conditions, i.e., values of the electrostatic potential are fixed on the boundaries of the computational box (Kurnikova et al., 1999). In reality, these boundary conditions are imposed by the electrodes. In numerical models practical considerations often dictate the use of smaller subsystems, for which the computational boundary conditions need to be taken to reflect the effect of the actual ones using theoretical considerations (Graf et al., 2000). In the simplest approximation introduced in the field of channel modeling by Eisenberg and co-workers (Barcilon et al., 1992), the term  is disregarded. In an obvious generalization,
  may include the electrostatic potential due to partial charges fixed on the protein and lipid atoms, i.e.,
  (Chen and Eisenberg, 1993a,b; Kurnikova et al., 1999; Cardenas et al., 2000). Eqs. 1 and 3 are coupled nonlinearly via the ci and φmobile variables. In the general case of a protein of arbitrary geometry and distribution of partial charges on protein atoms, they have no analytical solution and must be solved numerically to self-consistency (Kurnikova et al., 1999). Eqs. 1–3 with
  comprise the so-called Poisson-Nernst-Planck (PNP) theory.
It is important to note that PNP theory invokes a mean field approximation in which the ion responds to the average concentrations of all mobile ions and its integrity as a particle is not accounted for. In particular, it was recognized recently that the change in solvation energy of a single ion when it moves in an inhomogeneous dielectric medium provides an important contribution to the drift flux term of Eq. 1 but is missing from the PNP definition of  (Corry et al., 2000; Schuss et al., 2001; Graf et al., 2000). This change in the free energy of a single ion defined with respect to the free energy of that ion in a bulk solvent was termed the DSE (or dielectric barrier)
  (Graf et al., 2000, and Graf, 2002, unpublished results). When the DSE is taken into account,
  is modified to
 |
(4) |
Recent studies have shown that  in a narrow channel strongly influences the resulting current (Graf et al., 2000, and Graf, unpublished results). Therefore, a careful assessment of
  is essential for modeling realistic channel behavior. PNP-like theory that implements
  as defined in Eq. 4 will be termed Dielectric-Self-Energy-Poisson-Nernst-Planck (DSEPNP) theory (Graf, unpublished results). It was found that using this model to calculate ion transport through narrow channels such as Gramicidin A leads to very low permeability due to the high dielectric self-energy barrier, and cannot account for the observed relatively efficient ionic permeation through such channels. Note, however, that
  as defined by Eq. 4, still disregards a potentially important contribution to the free energy of inserting an ion at some location in the channel that results from the induced change in the channel geometry. A better calculation of
  is clearly needed.
In general, calculating free energy differences in biomolecular processes is a challenging task. Several approaches have been adopted for various problems in molecular modeling. These theoretical methodologies span a wide range of molecular resolution—from estimating electrostatic free energies on a continuum level by solving the Poisson equation (Sharp and Honig, 1990; Dieckmann et al., 1999; Luty et al., 1992; Partenskii et al., 1994) to full atomistic Molecular Dynamics simulations (Roux and Karplus, 1993; Kollman et al., 2000). In this article we adopt a methodology to calculate  for an ion entering the channel which is both cost-effective in terms of computational power and can account for the most essential properties of the system, including efficient ion permeation, when the function
  thus estimated is utilized in a PNP-like kinetic theory. The general approach of combining the precalculated PMF for a single ion with the self-consistent PNP approach to estimate ion currents will be termed PMFPNP.
The electrostatic free energy of transferring an ion from the bulk solution into the channel is defined by
 |
(5) |
where Gcomplex is the energy of an ion plus protein/membrane complex embedded in the solvent (water) with the ion located at a point  inside the channel, Gprotein is the energy of the protein/membrane system (without the ion) embedded in the same solvent and Gion is the energy of a single ion in the bulk solvent. The conventional continuum electrostatic approach for calculating
  based on Eq. 4, is outlined in the next subsection. A combined MD/continuum approach, which takes into account the channel flexibility, is presented in the following subsection. In subsequent sections we present results of applying both methodologies to first determine a plausible set of dielectric constants and then simulate current through the Gramicidin A channel.
A continuum approach to calculate the electrostatic free energy
In the absence of external fields, the electrostatic energy G of a collection of point charges can be found as  where the summation is over all electrostatic charges qi in the system and φi is the value of the electrostatic potential at the position of charge i. The electrostatic potential
  needed to calculate G can be found from the corresponding Poisson equation:
 |
(6) |
supplemented by Dirichlet boundary conditions with the boundary potential set to zero infinitely far away from the source charges. In Eq. 6, δ is the three-dimensional Dirac delta function and  is the position of charge qj. We have recently shown (Graf et al., 2000, and Graf, unpublished results) that for channels as narrow as 4 Å in radius, a continuum description of ion permeation described by DSEPNP, i.e., Eqs. 1–6, compares well with results of Dynamic Monte Carlo (DMC) simulations in which ions are treated as charged particles that diffuse in an inhomogeneous dielectric medium with a prescribed diffusion coefficient. As already mentioned, such particle-based simulation models of narrow rigid channels (Allen et al., 1999; Graf et al., 2000) exhibit very small superlinear currents for voltages up to 200 mV. The insignificance of these currents can be traced to the presence of a DSE barrier of several kT in each. In contrast, real biological channels of similar size and shape exhibit substantial ionic current at low voltages, with nearly linear or sublinear current-voltage characteristics. A detailed analysis of DSEPNP and DMC particle simulations suggests that the effective polarizability of the channel environment (loosely defined as the ability of the local protein environment to adjust to stabilize an extra electric charge) must be higher than implied by the standard model utilized in both DMC and DSEPNP studies reported previously. Both approaches for simulating ion motions across channels suffer from the following two major limitations, related to the insufficient flexibility assigned to the description of the channel. First, the solvent polarizability is accounted for by a single parameter (a dielectric constant), while in reality solvent response in the confined channel environment may vary with the position in the channel in a way that cannot be determined from the bulk solvent properties. Second, the protein structure is taken to be rigid (usually at its average NMR configuration), while in reality the protein structure responds to the ionic presence. Below we will investigate the consequences of both limitations.
A combined molecular dynamics/continuum electrostatics approach to calculate free energy
 can, in principle, be found from an atomistic simulation in which all atoms on the protein, the lipid membrane, and the solvent are treated explicitly. Several attempts to calculate the free energy of an ion in a Gramicidin A channel by MD simulation have been reported (Roux and Karplus, 1993; Woolf and Roux, 1997; Elber et al., 1995). Such calculations rely on a parameterized potential function (Roux, 2002) and require complete sampling of the system configuration space. Improvements in the available parameterizations of potential functions have been slow in recent years (Roux, 2002). Fortunately, an alternative method of dealing with the second problem, namely the limited sampling of the environment configurational space, has recently been introduced. Since a large portion of the configuration space required for quantitative calculation of the free energy of an ion in a solvent is due to the solvent itself, it was proposed (Kollman et al., 2000; Vorobjev et al., 1999) that the computationally expensive sampling of solvent configurations may be replaced by considering solvent effects via an appropriate approximate averaging procedure. A similar procedure was applied to model a polyglycine analog of Gramicidin A channel (Aqvist and Warshel, 1989). Following the approach of Kollman et al. (2000) a full-scale equilibrium MD trajectory of the protein in an atomistic solvent is generated to sample the protein conformational space (with and without ion in the channel). The resulting sequence of N protein/water configurations is used to obtain a corresponding sequence of dielectric continuum models of these systems, in which the fixed protein charges are embedded in their corresponding atomic positions. These continuum dielectric configurations, obtained with the permeating ion fixed in a given position, are then used to compute the electrostatic free energy of inserting the ion at that position (Sharp and Honig, 1990). Adapting the procedure introduced by Kollman et al. (2000), the free energy of ion-protein complex formation is calculated as an average over all n = 1, …, N configurations:
 |
(7) |
where  has the same meaning as in Eq. 5, calculated for the n-th configuration. The method thus combines an MD simulation to obtain atomistic configurations of the membrane-protein-ion complex with a continuum dielectric representation of each configuration to obtain a simple estimate of
  for that configuration, followed by the average indicated in Eq. 7. This approach allows us to account for solvent effects on average, i.e., at a mean field level, and to reduce the noise in the free energy calculations due to insufficient sampling of solvent configurations. The procedure described above, in which the potential of mean force ΔGSIP is calculated via Eq. 7 and then used in the PNP formalism, will be termed Potential-of-Mean-Force-Poisson-Nernst-Planck (PMFPNP). We should note that this calculation still disregards contributions to the free energy due to changes in the protein internal energy and accounts only approximately (through the temperature-dependence of the dielectric functions) for entropic contributions. These missing contributions are expected to be small because deformation of the protein is minimal during the ion permeation (see the Results and Discussion section), and because the changes in configuration entropy in these processes are typically small. (A similar number of degrees of freedom are constrained independent of the ion position in the channel.)
THE SIMULATION PROCEDURE
The model system
The approach outlined above was implemented in a series of calculations performed for a model Gramicidin A (GA) channel. GA is an antibiotic peptide widely used in single-channel experiments on passive ion-current permeation through a lipid membrane. It is a robust narrow channel with a relatively rigid structure. It reconstructs into a lipid bilayer by forming head-to-head dimers of α-helical polypeptides. Due to its unusual primary sequence of alternating L and D amino acids it forms a helix with all the amino acid sidegroups extending away from the backbone helix, which forms the channel. Therefore, the channel is lined with backbone carbonyl and amide groups, generating a hydrophilic environment inside the channel. Fig. 1 shows a three-dimensional GA ion channel structure incorporated into a crude model of a lipid bilayer membrane, with the membrane/protein channel system solvated in water. This snapshot is taken from an MD simulation performed as described in the next section. As has been noted by several workers (Dieckmann et al., 1999; Roux and MacKinnon, 1999; Graf et al., 2000) the dielectric self-energy is very large for channels <5 Å in radius, implying the conundrum discussed above in modeling their permeability. We have chosen to work with GA, the narrowest known ion channel, to emphasize our goal of understanding the permeability of such narrow channels. It has also been pointed out (Doyle et al., 1998; Tieleman et al., 2001) that the selectivity filter of the potassium channel possesses certain similarities to the GA channel and thus our study of GA may help to understand the energetics of the potassium channel selectivity filter as well as other narrow channels.
FIGURE 1.
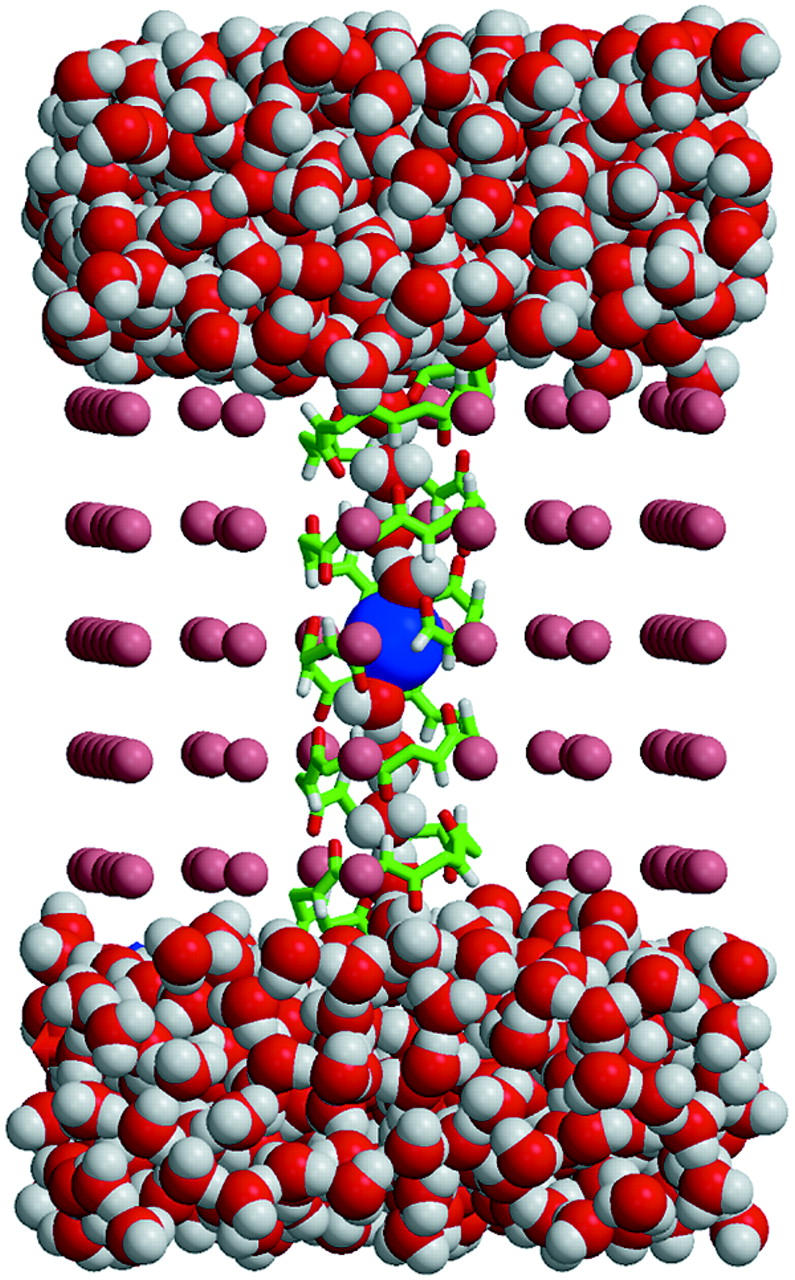
Snapshot of the GA channel with a K+ ion embedded in a model membrane and solvated with water after a 300-ps MD simulation as described in text. The model lipid bilayer is represented by pink spheres (the radius of the pink sphere in a picture does not reflect its Lennard-Jones parameters). The K+ ion is shown as the blue sphere in the center of the channel. Only backbone atoms of the peptide chains are shown.
MD/continuum simulation of an ion in the GA channel
We have performed a set of molecular dynamics (MD) simulations of a single potassium ion and a single chloride ion fixed at various positions in a Gramicidin A channel. GA was incorporated into a slab of heavy (mass = 100 au) spheres with Lennard-Jones parameters ɛ = 0.05 kcal/mol and σ = 4.45 Å, and no partial charge. The slab of these dummy spheres represents a lipid bilayer by providing a nonpolar environment for the channel molecule. This channel-membrane model system was then immersed in a box of 738 SPC/E water molecules. Eight water molecules in random configurations were placed inside the GA pore. This system was subjected to energy minimization followed by a 200-ps constant pressure MD equilibration run at 300 K. Positions of the dummy atoms and GA atoms were constrained in space with 200 kcal/mol/Å2 harmonic spring forces. After the GA-water equilibration was completed, an ion (K+ or Cl−) was introduced into the channel. A force constant of 200 kcal/mol/Å2 was again applied to the positions of the dummy atoms and a 10 kcal/mol/Å2 force constant was applied to the backbone atoms of the GA. The energy of each system thus prepared was minimized, followed by a 30-ps equilibration period when the harmonic constraints on the GA backbone atoms were gradually reduced from 10 kcal/mol/Å2 to 0.5 kcal/mol/Å2. Subsequently, 300-ps production runs were performed with constant volume dynamics at 300 K. 0.5 kcal/mol/Å2 harmonic constraints were maintained on each of the backbone C and N atoms of GA. The coordinate of the ion along the channel axis (z-axis) was held fixed, while its x,y coordinates were allowed to fluctuate. The coordinates of the protein atoms were collected every 2 ps. For every such time point along the MD trajectory, the coordinates of the protein molecule and the ion were used to calculate the appropriate electrostatic free energy by solving the Poisson equation as described in A Continuum Approach to Calculate the Electrostatic Free Energy.
An MD trajectory of GA without K+ was also generated as described above. All MD simulations were performed using the AMBER 6 software package and Cornell et al. force field (Cornell et al., 1995). The Lennard-Jones parameters for the potassium ion were taken from work of Aqvist (1990). Bonds involving hydrogen atoms were constrained via the SHAKE algorithm. A 12-Å cutoff distance was used for all nonbonded interactions. The MD time step was set to 2 fs.
For the continuum electrostatics calculations, partial charges on the GA atoms were taken from the force field of Cornell (Cornell et al., 1995). The dielectric response profile  and the positions of the partial charges represent the molecular system in a continuum representation. In the numerical solution of Eq. 6, these functions are discretized on a uniform three-dimensional grid as described in Kurnikova et al. (1999). The radii of potassium and chlorine ions, estimated by fitting experimental enthalpies of hydration, were chosen to be RK+ = 2.17 Å (Dieckmann et al., 1999) and RCl− = 1.81 Å (Dasent, 1982) The electrostatic energy was calculated using our three-dimensional PNP program (Kurnikova et al., 1999), modified to allow the assignment of several arbitrary values of dielectric constant parameters to different regions of space. For all results reported in the following sections, the grid dimensions of the simulation box were 1513 with a linear scale of three grid points per Å. The width of the membrane was set to 33 Å to mimic a glycerilmonoolein bilayer. In Fig. 2, a two-dimensional slice of
  shows how different dielectric constants are assigned to membrane (ɛm), protein (ɛp), bulk (ɛw), and channel (
 ) regions. The choice of numerical values for the dielectric constants is discussed in the Results and Discussion section. Quasi-coulombic boundary conditions (Klapper et al., 1986), which anticipate the asymptotic form of the electric potential far from the source charge region, were employed in our electrostatic calculations to obtain accurate results with a finite-size computational box. The set of calculations described above was repeated with the potassium ion fixed at 18 different positions along one GA monomer at spatial increments of 1 Å, and the chloride ion fixed at seven different positions at spatial increments of 3 Å.
FIGURE 2.

Two-dimensional center cut of the three-dimensional space-dependent dielectric constant function used for numerical solution of the Poisson equation. The simulation system is divided into four regions: the protein (ɛp), the bulk water (ɛw), the membrane (ɛm), and the channel water ( ).
).
All calculations were performed on a set of IBM RS6000 workstations. It took ∼12.5 h to complete a 300-ps MD simulation and ∼27 h to solve a set of Poisson equations as prescribed by Eq. 7 for N = 150.
MD calculation of the diffusion coefficients
The diffusion coefficients of the ion were calculated from the all-atom MD simulation using the force-force autocorrelation function (McQuarrie, 1976; Koneshan et al., 1998). According to the fluctuation-dissipation theorem for a Brownian particle moving in thermal equilibrium, the one-dimensional friction coefficient is:
 |
(8) |
where  is the random force on the particle at position
  along the channel axis. The space-dependent diffusion coefficient
  for the ion can then be extracted using the Stokes-Einstein relation
The input needed for Eq. 8 was obtained from equilibrium MD simulations with the potassium ion fixed in space. All parameters needed for the MD simulation were set as described in the previous section. Starting with equilibrated systems of K+ fixed in the GA channel at a particular position along the channel axis, a 1-ns trajectory was generated and the forces acting on the ion were collected. This calculation was repeated at 18 K+ ion positions selected as indicated above. A similar MD simulation of a potassium ion in bulk water was also performed. In the latter simulation the K+ ion was immersed in a box of 735 SPC/E water molecules, the system was equilibrated, and finally, a 1-ns constant volume equilibrium trajectory was generated.
RESULTS AND DISCUSSION
Continuum dielectric theory: the role of the dielectric response
In continuum modeling of biological channels the position-dependent dielectric response function plays a prominent role. The most common choice for the dielectric constant of the membrane and the protein molecule is ɛm = ɛp = 2–5. Water is usually represented as a dielectric medium with dielectric constant ɛw = 80. The choice of these parameters for calculating electrostatic free energies of binding in solution has been intensively scrutinized in recent literature on globular proteins and organic molecules (Simonson and Brooks, 1996; Sharp and Honig, 1990; Warshel and Russell, 1984). However, the appropriate choice of dielectric constants for membrane proteins and membrane environments is relatively unexplored. We have examined the dependence of the electrostatic binding free energy  in the GA channel, calculated as described in A Continuum Approach to Calculate the Electrostatic Free Energy, on the choice of the dielectric constant values of the channel environment (as in Fig. 2). Indeed, the two-ɛ model predicts a huge solvation barrier for an ion in a narrow channel. Fig. 3 shows, via the solid line with filled circles,
  for a potassium ion in a GA channel as a function of the ion position along the channel axis for a set of ɛ-values in the range indicated above, namely, ɛw =
  = 80, ɛm = ɛp = 4. The three-dimensional channel structure reported by Arsen'ev et al. (1986) was employed in these calculations. Note the high barrier of ∼14 kT to bring the ion into the center of the channel which results from this choice of parameters. Such a barrier would completely block ion current (Graf, 2002, unpublished results), in contrast to experimental observation. Since the GA channel is very efficient in passing simple cations, one should ask what other properties of the channel and its environment need to be incorporated into the model to describe its interaction with the ion at least qualitatively correctly. It is widely believed that the environment around a biological channel is highly inhomogeneous in its electrostatic properties and therefore cannot be described adequately by just two dielectric constant regions. It should be emphasized that this separation of the single ion potential into two contributions, one associated with explicit charges in the environment (in this case the protein) and the other arising from the dielectric self energy, is to some extent arbitrary and reflects our choice of the electrostatic model for the protein. One possibility is that simply employing a better description of the dielectric response function may yield a more realistic permeability model. A protein is a polarizable medium and ɛp values between 4 and 20 have recently been suggested to represent a protein molecule (King et al., 1991; Gilson and Honig, 1986; Schutz and Warshel, 2001). Therefore, the dielectric constant ɛp was increased in several increments up to ɛp = 30, keeping ɛw =
  and ɛm as 80 and 4, respectively. Fig. 3 shows results for
  obtained under these conditions. We see that even for ɛp as high as 30 the barrier
  is still ∼2.5 kT. Note that the mobility of water inside the channel is highly restricted and its dielectric response is probably substantially lower than that of bulk water. Still, we find that the ion penetration free energy is rather insensitive to the water dielectric constant value in this region. This is shown in Table 1, in which
  was varied between 40 and 200. It appears that for a narrow channel confined within a low dielectric constant (ɛ < 6) membrane, a substantial dielectric barrier exists even if the protein and/or the channel region are assigned unphysically high dielectric constants. Our recent DMC studies of ion current in a model cylindrical channel (Graf et al., 2000) indicate that an energetic barrier as low as 2 kT effectively inhibits any appreciable ionic current at low applied voltages (Graf et al., 2000, and Graf, unpublished results). Therefore, other mechanisms by which the environment can polarize in response to the presence of a permeating ion must exist. As outlined in the Introduction, a likely mechanism entails local conformational changes in the protein as the ion moves through the channel. The next subsection considers this possibility.
FIGURE 3.

Electrostatic free energy of the K+-GA binding,  , is calculated here for a rigid channel with different protein dielectric constants).
  is plotted as a function of the ion displacement from the center of the GA channel along the channel axis. The energy is calculated by numerical solution of the Poisson equation for a configuration of GA taken from the PDB data bank (Arsen'ev et al., 1986) (Eqs. 5–6). The dielectric constant of the bulk water is ɛw = 80, the membrane ɛm = 4 and the channel water
  = 80. The dielectric constant of the protein was taken to be ɛp = 4 (•), 10 (▪), and 30 (♦). See Fig. 2 for the assignment of regions with different dielectric constants.
TABLE 1.
The value of the  barrier calculated by numerical solution of the Poisson equation for a rigid NMR configuration of GA (as prescribed by Eq. 5)
 |
 |
|---|---|
| 40 | 7.2 |
| 80 | 6.4 |
| 200 | 5.4 |
The dielectric constant of the channel water is varied while dielectric constants of other parts of the system are kept fixed with epsilon of bulk water ɛw = 80, membrane ɛm = 4, and protein ɛp = 10.
Free energy of ion-channel association from combined MD simulations and continuum electrostatics method: the role of channel relaxation
To elucidate the influence of the protein molecule itself on the passage of an ion through the channel, the free energy  associated with transferring a K+ ion from the bulk electrolyte solution to a particular point
  inside the GA channel was calculated as described above in “A Combined Molecular Dynamics/Continuum Electrostatics Approach to Calculate Free Energy”. Namely, a sample of GA configurations was obtained from equilibrium MD simulations with a K+ ion at various positions along the channel, followed by continuum dielectric model calculations of the free energy associated with transferring the potassium ion into the channel. The results obtained from these simulations are shown in Figs. 4–7. Fig. 4 shows
  as a function of time calculated along the MD trajectory for the complex with the ion positioned in the center of the channel as in Fig. 1, starting from an initial protein structure taken as the NMR geometry. The values of the dielectric constants used in the electrostatic part of this calculation are ɛp = 2, ɛm = 4,
  = 40 and ɛw = 80. The initial relaxation of energy at the onset of the simulation is shown in Fig. 4 a. The free energy drops below zero on average in a fraction of a picosecond. This result clearly demonstrates the short timescale required for the protein to adjust to the insertion of the ion. The equilibrium state is reached after a longer time. Electrostatic calculations in the equilibrated part of the trajectory, presented in Fig. 4 b, were performed using ɛp = 4 (solid line) and ɛp = 2 (dashed line), keeping ɛm and
  as above: note that
  is characterized by large fluctuations between positive and negative values. That is, the protein fluctuates between permeable and nonpermeable structures in rapid succession. On average, however, more configurations that favor ion binding inside the channel occur and the resulting average energy is negative, i.e., favorable for ion permeation into the channel. Another important observation that can be drawn from Fig. 4 b is that the dependence of the calculated energy on the value of ɛp is different for different configurations. For some structures, e.g., the initial NMR structure,
  increases as ɛp decreases in the same manner as observed in Fig. 3. For others, however, the energy decreases with decreasing ɛp, resulting in tighter binding of the ion-protein complex. This is somewhat counterintuitive and demonstrates that for any particular spatial distribution of the dielectric response function
  it is impossible to predict, a priori, how the polarization of the medium around the charge will influence the calculated electrostatic energy in the system. The dependence of
  on the choice of
  and ɛm is shown in Fig. 5, a and b, respectively, for several snapshots from the MD simulation.
  depends very weakly on
  (see Fig. 5 a) and varies monotonically with ɛm (Fig. 5 b).
FIGURE 4.

 calculated for different protein structures which are collected during the MD simulation. Note how the energy fluctuates between positive and negative values, indicating ion-permeable and impermeable structural conformations of the protein (see explanation in text). In both panels
  = 40, ɛw = 80, and ɛm = 4. (a) Initial relaxation. ɛp = 2. (b) A portion of the equilibrium trajectory. Solid line shows calculations with ɛp = 4, and dashed line is for ɛp = 2.
FIGURE 7.
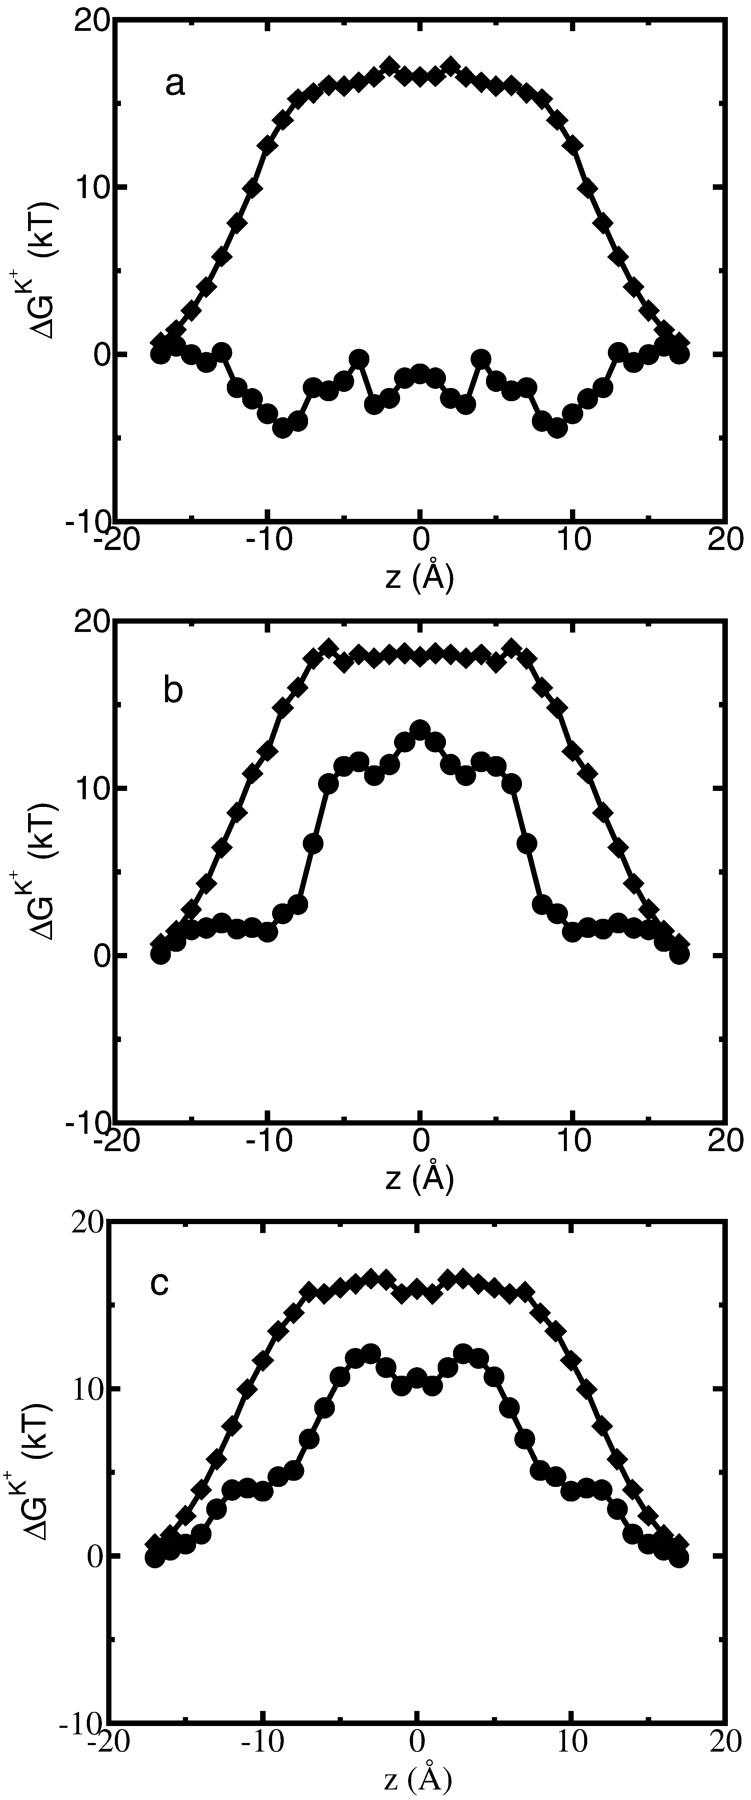
(a) Average free energy of K+, flexible GA binding  i.e., with partial charges on GA atoms (•), compared with
  i.e., without partial charges on the GA atoms (♦). Each point is the average of N = 150 calculations along the 300-ps MD trajectory as prescribed by Eq. 7. (b) The same as in a but for the rigid NMR geometry of GA as prescribed by Eq. 5. (c) The same as in b but for average MD geometry of GA equilibrated with only water (no ion) in the channel.
FIGURE 5.

(a) Dependence of  on
on  plotted for several snapshots taken from the MD trajectory; n is the index labeling snapshots along the MD trajectory. The following set of dielectric parameters was used ɛp = ɛm = 4, ɛw =
  = 80. The dielectric constant of the channel water was set to
  = 20 (♦), 40 (▪), and 80 (•). See Fig. 2 for the assignment of regions with different dielectric constants. (b) Dependence of
  on ɛm plotted for several snapshots taken from the MD trajectory. The following set of dielectric parameters was used ɛp = 2, ɛw = 80,
  = 40. The dielectric constant of the membrane was set to ɛm = 2 (♦) and 4 (•).
 was shown for individual channel configurations in Figs. 3–5. In what follows we consider the corresponding free energy averages over the entire equilibrium MD trajectory according to Eq. 7. The following values of dielectric parameters were used to obtain the results presented in the remainder of this article: ɛm = ɛp = 4, and ɛw =
  = 80. Fig. 6 shows this trajectory-averaged free energy as a function of ion position along the channel axis. Deep wells in the
  profile indicate cation stabilization (and thus possible ion binding sites). The energy minima located closer to the entrance to the channel are deeper than the two energy minima near the center of the channel. It is important to emphasize the large difference between the free energy for ion insertion calculated for the relaxed channel and for the NMR configuration. In Fig. 7 a the trajectory-averaged
  in the relaxed channel with K+ is shown (again) along with
  The electrostatic free energy of transferring an ion from the bulk solution into the channel for the (unrelaxed) NMR channel geometry, calculated via Eq. 5, is shown in Fig. 7 b. In Fig. 7 c we show the electrostatic free energy of transferring K+ from the bulk solution into an averaged structure obtained by first equilibrating the GA protein in an MD simulation with only water inside. Comparing Fig. 7 a to either Fig. 7, b or c, it is clearly seen that the relaxation of the channel environment in the ion's presence during the MD simulation leads to a huge decrease in the cost of introducing an ion into the channel. If the channel is kept in its NMR geometry or in an average geometrical structure obtained by pre-equilibrating the channel with water but without K+, an ion entering the channel experiences a significant energetic barrier. Thus, it is favorable for the ion to bind into a channel that is allowed to relax in response to the ion's presence, as is the case in nature. This relaxation evidently leads to a dramatic decrease of the electrostatic free energy, which may become negative. Further inspection of the DSE term in Fig. 7 (diamonds) and the total
  (circles) reveals that when channel flexibility is allowed in the ion's presence (Fig. 7 a) only minor changes in the DSE term occur, whereas the total complex association energy,
  decreases significantly. The latter observation indicates that for our choice of the electrostatic model of the protein, the main effect of the small structural changes in the channel molecule, which occur as a result of the local relaxation around the permeating ion, is to modify the direct electrostatic interactions of the permeating ion with the nearby partial charges on the protein groups. The effect of protein relaxation on
  is small. The direct ion-protein electrostatic interactions become significantly stronger in a flexible channel and can compensate the large DSE, thus rendering the channel permeable.
FIGURE 6.

The total free energy profile calculated for K+ ion in the channel using the flexible channel with fluctuations generated by an MD trajectory as described in “A Combined Molecular Dynamics/Continuum Electrostatics Approach to Calculate Free Energy”. Each point in the plot is the average of N = 150 calculations along the 300-ps MD trajectory as prescribed by Eq 7. The following set of dielectric parameters was used: ɛp = ɛm = 4, ɛw =  = 80.
= 80.
Next, we investigate how the structure of the protein is affected, on average, by the presence of an ion in the protein channel. The central part of the GA channel is formed when two α-helical monomers are stacked on top of each other in the membrane. They are held together only by hydrogen bonds, and therefore the center is the most flexible part of the channel, which is fairly rigid in other parts (Woolf and Roux, 1997). We have found that deviations from the average atom positions due to the ion presence are relatively small even in the center of the channel. Therefore, we report only the results corresponding to the ion position in the center of the channel to demonstrate that the influence of the ion on the channel structure is small even in this case. In Fig. 8 the root mean square deviation from the average equilibrium geometry of the backbone carbonyl oxygen atoms lining the channel pore, accumulated over the course of the MD simulation, is shown. Comparison of the root mean square deviation for a channel simulated with and in the absence of K+ ion further supports the conclusion that the average geometry of the protein molecule remains essentially unchanged as the ion is introduced into the channel. Direct comparison of the NMR and average MD structures indeed reveals only small changes in the average positions of the protein atoms. This is further illustrated in Fig. 9 (a and b), where we have superimposed the average MD coordinates of the GA-K+ system (ion inside the channel) with the average MD coordinates of the GA system (no ion in the channel). It can be seen from these figures that the largest changes in atomic positions between the two structures occur for carbonyl oxygen atoms closest to the ion. In particular, carbonyl groups near the ion have tilted toward it, as indicated by arrows. Other workers studying narrow channels, e.g., GA and K+ channels (Mackay et al., 1984; Roux and Karplus, 1993; Elber et al., 1995; Tang et al., 2000; Berneche and Roux, 2000), have observed that ions in the channel distort the positions of the carbonyl oxygens to achieve proper solvation. The average positions of most other GA atoms have not changed significantly. Tables 2–5 report various configurational changes that occur in the channel when an ion is placed in different positions along the channel aqueous pore. The average distances and magnitudes of distortion between the potassium ion and the nearest carbonyl groups are within the range of changes reported earlier in NMR and MD analyses of Na+ ion migration through GA (Woolf and Roux, 1997). There are four carbonyl oxygens whose distances from the ion decrease substantially when the ion is introduced into the center of the GA channel. Even for the largest distortions reported here, it can be seen that the hydrogen bonds among the backbone atoms of GA remain intact, i.e., the additional tilt angle of carbonyl groups involved remains small (see Fig. 9).
FIGURE 8.

Root mean square deviation of GA backbone carbonyl oxygen atoms in the MD simulation. The numbers of the residues in the protein sequence are indicated on the abscissa. Circles correspond to the simulation with a K+ ion placed in the center of the channel (•). The curve with the squares is for the GA channel without K+ (▪). Each root mean square deviation curve is calculated along the 300-ps MD trajectory relative to the corresponding average MD structure.
FIGURE 9.
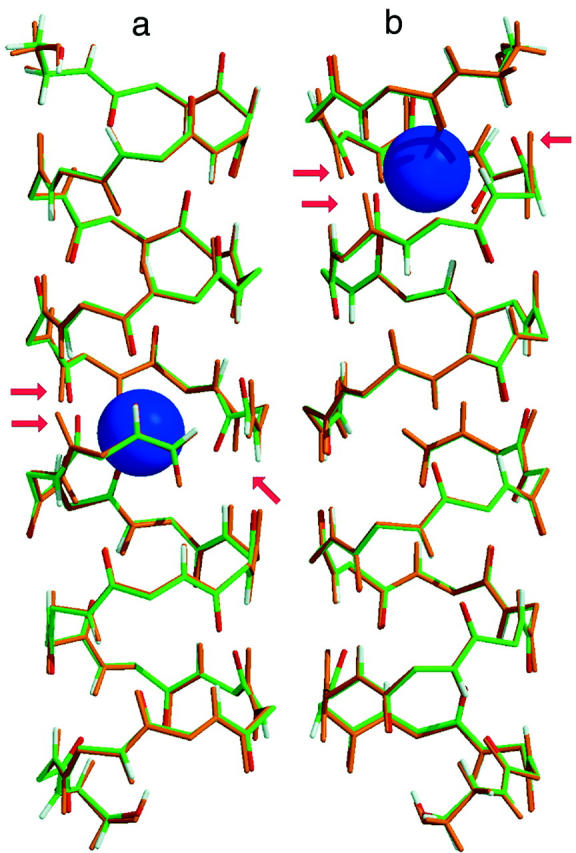
The average configuration of GA in MD simulation without the ion (orange peptide) is superimposed with the average configuration of GA in MD simulations with the K+ ion (green peptide). K+ is shown as a blue sphere. Arrows indicate the carbonyl oxygens that bend toward the K+ due to favorable electrostatic interactions. (a) During the MD simulation, an ion was in the center of the channel; and (b) K+ is 9 Å from the center of the channel, the predicted position of the binding site (cf. Fig. 6).
TABLE 2.
Distances between K+ and the nearest backbone carbonyl oxygen atoms are reported for NMR (RNMR), MD_GA (RMD_GA) and MD_GA_K (RMD_GA_K) configurations
| Name and no. of the residue | RNMR (Å) | RMD_GA (Å) | RMD_GA_K (Å) | ΔRNMR (Å) | ΔRMD (Å) | ΔαMD (deg) |
|---|---|---|---|---|---|---|
| FOR0 | 3.95 | 4.30 | 4.25 | 0.30 | −0.05 | 6 |
| VAL1 | 4.03 | 4.01 | 3.30 | −0.73 | −0.71 | 24 |
| ALA3 | 3.07 | 3.35 | 2.87 | −0.20 | −0.48 | 14 |
| FOR17 | 3.95 | 3.99 | 4.03 | 0.08 | 0.04 | 17 |
| VAL18 | 4.04 | 4.11 | 3.13 | −0.91 | −0.98 | 33 |
| ALA20 | 3.09 | 3.35 | 2.89 | −0.2 | −0.46 | 15 |
For the NMR configuration, K+ was placed in the center of the channel. For the MD_GA configuration, Gramicidin A was equilibrated with only water in the channel, then the average configuration over the trajectory was generated, and a K+ ion placed in the center of the channel. To generate the MD_GA_K configuration, Gramicidin A was equilibrated by MD simulation with K+ placed at the center of the channel, fixing the coordinate in the axial direction; then the average configuration over the trajectory was generated. Changes in K+-carbonyl oxygen distances between NMR and MD_GA_K (ΔRNMR) configurations and between MD_GA and MD_GA_K (ΔRMD) configurations are also given in the Table, as are changes in the carbonyl group angles (ΔαMD) between MD_GA and MD_GA_K configurations. The name and the number of the corresponding residues are given in the first column of the table and are enumerated as in the original file (1GRM) taken from the protein data bank (www.rcsb.org).
TABLE 5.
The same as in Table 4 but for NMR, MD_GA, and MD_GA_K configurations with K+ ion placed 9 Å away from the center of the channel
| Name and no. of the residue | θNMR (deg) | θMD GA (deg) | θMD_GA_K (deg) |
|---|---|---|---|
| VAL8 | 15 | 13 | 17 |
| LEU10 | 9 | 4 | 23 |
| TRP11 | 155 | 155 | 144 |
| LEU12 | 19 | 8 | 5 |
| TRP13 | 150 | 155 | 146 |
| TRP15 | 142 | 144 | 147 |
(It is worth noting that the carbonyl group angle with respect to the bilayer normal does not fully characterize the actual degree of protein motion. For example, from Table 2 the distance between carbonyl oxygen of VAL18 and K+ decreases by ∼1 Å when the ion is placed in the center of the channel and the carbonyl group changes its angle by ∼33°. On the other hand, as seen in Table 4, the carbonyl group angle with respect to the bilayer normal has not changed significantly. The reason is that the carbonyl group has flipped, so that the change in interatomic distances occurred not due to the change of the angle with respect to the bilayer normal but due to the change of the angle in the plane of the bilayer. We have also noticed that the potassium ion changes its position in the bilayer plane relative to the center of the channel by ∼0.2 Å when it has been equilibrated in the center of the channel and by ∼0.3 Å when it has been equilibrated at 9 Å away from the center).
TABLE 4.
Backbone carbonyl groups angles with respect to the bilayer normal are reported for NMR (θNMR), MD_GA (θMD_GA), and MD_GA_K (θMD_GA_K) configurations
| Name and no. of the residue | θNMR (deg) | θMD_GA (deg) | θMD_GA_K (deg) |
|---|---|---|---|
| FOR0 | 5 | 12 | 10 |
| VAL1 | 157 | 158 | 155 |
| ALA3 | 158 | 161 | 158 |
| FOR17 | 174 | 171 | 161 |
| VAL18 | 24 | 23 | 26 |
| ALA20 | 23 | 18 | 23 |
To generate the MD_GA configuration, Gramicidin A was equilibrated with only water in the channel, then the average configuration over the trajectory was computed, and a K+ ion placed in the center of the channel. For the MD_GA_K configuration, Gramicidin A was equilibrated by MD simulation with K+ placed at the center of the channel, fixing the coordinate in the axial direction: then the average configuration over the trajectory was computed.
The shape of the free energy profile in Fig. 6 suggests that there are four energy wells in the GA channel. Two of them, represented by the deeper minima, are located at a distance of ∼9 Å from the center of the channel. This observation agrees well with previous experimental and theoretical studies of GA binding sites (Woolf and Roux, 1997; Elber et al., 1995; Kurnikova et al., 1999). Two other, energetically shallower, energy minima reside ∼3 Å from the center of the channel (Kurnikova et al., 1999).
Finally we consider the free energy profile for a chloride ion in the GA channel. As in the K+ case, when the GA channel is allowed to relax as described above, the free energy barrier calculated for a Cl− ion decreases (see Fig. 10). However, the magnitude of the net barrier in the center of the channel is still much too large to expect any significant Cl− current through the channel.
FIGURE 10.

Average  for a flexible GA (•) and for a rigid one (♦). For the flexible protein each point in the plot is the average of N = 150 calculations along the 300-ps MD trajectory as prescribed by Eq. 7. The NMR geometry of the GA was used for the rigid channel. The following set of dielectric parameters was used for both calculations: ɛp = ɛm = 4, ɛw =
  = 80.
= 80.
Calculation of diffusion constants
Current calculations using PMFPNP or Brownian Dynamics techniques crucially depend on the magnitude of the diffusion coefficients that characterize the motion of ions in the channel. In the narrow pore of Gramicidin the permeant ion is largely dehydrated and is instead coordinated by backbone carbonyl groups. The mobility of the permeating ion is suppressed not only by the restrictions inherent in its lateral confinement but also by strong electrostatic interactions with these relatively immobile carbonyl oxygens. Moreover, due to the single file arrangement of the ion and water molecules, the motion of the ion is coupled to the motion of surrounding water, which is also inhibited inside the channel (Elber et al., 1995).
There are no direct experimental measurements of diffusion coefficients of ions inside Gramicidin or other channels. The diffusion coefficient of a potassium ion in bulk water calculated as described in MD Calculation of the Diffusion Coefficients and indicated in Fig. 11 is only 13% smaller than the experimentally measured value (Lide, 1994). Fig. 11 also shows the calculated diffusion coefficient of a K+ ion inside the channel. The resulting values are ∼8.5 times less than in the bulk solution. Several model MD studies of ion diffusion coefficients inside various model channels have been reported recently. All of them find reduction by a factor of 3–10 in the diffusion coefficient when the ion is moved from bulk water into a channel environment (Lynden-Bell and Rasaiah, 1996; Smith and Sansom, 1999). Furthermore, the ion's mobility is expected to be position-dependent. In Fig. 11 position is measured with respect to the channel center. We see that when an ion leaves the channel (at ∼17 Å from the channel center) its diffusion coefficient abruptly increases by a factor of four. At this distance the ion is completely solvated by reservoir water and interaction with the channel is very weak. The small size of the simulation box did not allow us to move the ion to a distance from the channel at which the value of the bulk  is completely recovered. In the kinetics calculations described below, we have used
  in the bulk region and 0.25 × 10⁻⁵ cm2/s in the channel based on the numerical results shown in Fig. 11. A linear interpolation function has been employed to connect bulk and channel diffusion constant at the ends of the GA dimer. The diffusion constants for Cl− ion were set to the same values as for the K+ ion, based on the fact that in bulk water these ions have similar diffusion constants.
FIGURE 11.

Calculated diffusion coefficient for K+ ion inside of the GA channel (•), and in bulk SPC/E water (solid line). Only the Dz component of the diffusion coefficient of the ion in the channel is calculated.
Ion current
With the calculated diffusion coefficients and free energies for ion-channel interaction in hand, we can now apply the PMFPNP procedure, as prescribed by Eqs. 1–7, to evaluate ion currents in the GA channel. The SIP potentials for K+ and Cl− as reported in Figs. 6 and 10, respectively, were adopted as the single ion PMF's needed to evaluate ion current in the PMFPNP procedure. The one-dimensional potential along the (z) channel axis extracted from MD/continuum calculation was simply extended in the lateral (x,y) directions. Within the narrow channel, variation in the lateral direction is expected to be minor, and likewise in the bulk solution regions. Near the channel entrances, the SIP will not be strictly independent of x,y position, but again, we expect the error in the I-V curves resulting from the simplified SIP profile employed here to be negligible. The dielectric constants were set to ɛm = ɛp = 4, and ɛw =  = 80. In Fig. 12 the current-voltage characteristic of a GA channel in a glycerilmonoolein membrane is shown for two values of reservoir electrolyte concentrations. The inset to Fig. 12 displays experimental measurements of single ion channel currents for this system (Busath et al., 1998). Our calculated currents compare rather well with the experimental curves. At 200 mV applied voltage the theory underestimates measured currents for the low bath electrolyte concentration (0.1 M) by about a factor of two. Given that no fitting parameters were employed in our analysis, the agreement with experiment is encouraging.
FIGURE 12.

Current-voltage relations predicted by PMFPNP model are compared to experimental results (Busath et al., 1998) (upper left inset). Bulk KCl concentrations of 0.1 (shaded square) and 1.0 M (open circle) were used in the simulations. The experimental curves in the inset correspond to the following concentrations of bulk KCl solutions: shaded square, 0.1 M; solid circle, 0.2 M; open square, 0.5 M; open circle, 1.0 M; and solid square, 2.0 M. The analogous experimental and calculated curves are labeled with the same symbols.
In Fig. 13, ion current is plotted as a function of the electrolyte concentration in the bathing solutions at an applied voltage of 100 mV. At V = 100 mV the experimental current data points shown in Fig. 12 at concentrations up to 2 M are consistently 2–3 times larger than the prediction of our PMFPNP calculations, but show a similar trend toward saturation. Such saturation of the IC curves is not observed in simple PNP theory, i.e., with  and a rigid channel (as demonstrated by the line with diamonds in Fig. 13). We note that one remaining possible source of error is underestimating the diffusion constants in the channel, and further studies regarding the validity of the procedure that uses Eq. 8 in the restricted channel environment are required. To understand the mechanism of saturation in PMFPNP we have plotted the free energy
  along the channel axis that results from PNP (Fig. 14, a and c) and PMFPNP (Fig. 14, b and d) for several bulk electrolyte concentrations. By comparing Fig. 14, a and b, we observe that the potential profile features several barriers for the positive ion in PMFPNP (Fig. 14 b). The height of the barriers increases as the bulk electrolyte concentration increases. In standard PNP, however, such barriers are not observed (Fig. 14 a). In PMFPNP (see Fig. 14, b and d) negative ions experience a much larger barrier than positive ions in the channel. As indicated in Fig. 15, when the bulk ion concentration increases, the positive ion density in the channel also increases and cannot be compensated by negative ions. The resulting effective positive charge in the channel creates a larger effective barrier for the transfer of positive ions and leads to current saturation with increased salt concentration. However, since PMFPNP does not account for direct ion-ion dynamic correlations, it may only partially account for correlation-dependent phenomena such as currents at large bath electrolyte concentrations at high voltages. Clearly, the nature of direct ion-ion correlations in a channel environment is not completely understood and requires further study.
FIGURE 13.

Current-concentration relations as predicted by PNP (♦) and PMFPNP (•) models. The external potential difference was set to 100 mV.
FIGURE 14.

 profile along the channel axes for K+ and Cl− is plotted for several bulk electrolyte concentrations and 100 mV applied voltage: a and c were calculated using PNP; b and d were calculated using PMFPNP. The curve with circles is for 0 M, the curve with squares is for 0.5 M, and the curve with diamonds is for 10 M electrolyte concentrations. The dashed line is the result of a calculation at OM electrolyte concentration in which the protein molecule has no partial charges on the atoms. It corresponds to the linear ramp potential caused by the high resistivity of the membrane.
FIGURE 15.

Ion concentration profile along the channel axis for K+ and Cl− is plotted for several bulk electrolyte concentrations: a and c were calculated using PNP; b and d were calculated using PMFPNP. The curves with diamonds and circles are for 0.5 M; the curves with squares and triangles are for 10 M electrolyte concentrations.
CONCLUSIONS
The passage of ions through narrow membrane channels is affected by a combination of interconnected energetic and kinetic factors, including the local electric field resulting from the response of the membrane and the channel protein to the externally imposed potential, the energetics (electrostatic and short range interactions) of the ion accommodation in different parts of the channel, the electrostatic interaction between mobile ions in and near the channel, and the ion's mobilities in the channel environment. Full-scale MD simulations of this process are not yet practical because of the vastly different time and length scales involved.
Alternative simplified coarse-grained models have tried to capture the essential physics of the process. The Poisson-Nernst-Planck (PNP) approach focuses on the electrostatic interaction between permeant ions and between one such ion and its rigid inhomogeneous dielectric environment as the main factors that control the channel operation. Calculations of ion transport through the GA channel based on this approach have shown a remarkable agreement with experimental results (Kurnikova et al., 1999; Cardenas et al., 2000; Hollerbach et al., 2000). The present calculations together with several recent works show, however, that this apparent success is an artifact resulting from the cancellation of two errors that are big for narrow channels such as GA. First, the PNP approach strongly underestimates the dielectric barrier associated with transferring an ion from bulk water into the channel. This would lead to a strong overestimate of the ion current. Second, the PNP model considers the channel protein and the membrane as rigid dielectric environments, disregarding the channel structural response to the presence of the ion and thus implying a relatively small ability of the channel to accommodate the ion and to facilitate its transfer. This alone would lead to the opposite effect of underestimating the ion current. These two errors compensate each other in the final result for ion transport through the GA channel.
In the present article we have described a hybrid molecular dynamics-continuum electrostatic methodology that makes it possible to combine the convenience and numerical efficiency of a PNP-based calculation with proper accounting for dielectric barrier and channel relaxation effects. This methodology contains several ingredients:
The standard PNP approach is corrected by adding the gradient of a suitable single ion potential (the DSE) to the drift term in the drift-diffusion Eq. 1. In another work (Graf, unpublished results), in which this potential is derived from the dielectric response of a rigid membrane-protein complex to the presence of a single ion, we show that this approach provides a good approximation for the dielectric barrier.
This electrostatic single ion potential is further augmented by a contribution arising from the structural response of the channel to the ion. This is done by using atomistic MD simulations to compute this response, while still maintaining numerical simplicity by representing the resulting responsive structure as a dielectric continuum for the purpose of computing the local electrostatic energy.
The local diffusion coefficient of the ion is obtained from a first-principles calculation based on MD evaluation of the force-force autocorrelation function associated with the ion positioned at different locations along the channel.
The modified PNP equations, including all the above ingredients, now referred to as the Potential-of-Mean-Force-Poisson-Nernst-Planck (PMFPNP) model, are used to calculate the ionic current for the imposed potential and concentration biases.
We have seen that this calculation yields results that agree well with available experiments on ion transport through the GA channel, without employing any arbitrary adjustable parameters. This suggests that the present modeling may account for the essential factors that affect ion transport through open membrane channels. Still, one must view this success with some caution. The use of continuum dielectric models for the protein and water with the inevitable introduction of ill-defined dielectric constants and the neglect of restrictions on water mobility in the channel is obviously a serious approximation. Also, dynamic correlations between ions in the channel that possibly affect the dynamics of ion permeation, especially at higher concentrations, are only partially accounted for by this model. Further work is needed to fully assess the model reliability.
TABLE 3.
Same as in Table 2 but for NMR, MD_GA, and MD_GA_K configurations with K+ ion placed 9 Å away from the center of the channel
| Name and no. of the residue | RNMR (Å) | RMD_GA (Å) | RMD_GA_K (Å) | ΔRNMR (Å) | ΔRMD (Å) | ΔαMD(deg) |
|---|---|---|---|---|---|---|
| VAL8 | 3.64 | 3.33 | 2.91 | −0.73 | −0.42 | 14 |
| LEU10 | 3.91 | 3.76 | 3.16 | −0.75 | −0.60 | 22 |
| TRP11 | 3.15 | 3.55 | 3.26 | 0.11 | −0.29 | 15 |
| LEU12 | 5.05 | 4.73 | 4.81 | −0.24 | 0.08 | 15 |
| TRP13 | 2.55 | 3.10 | 2.73 | 0.18 | −0.37 | 12 |
| TRP15 | 3.00 | 2.96 | 2.78 | −0.22 | −0.18 | 0 |
Acknowledgments
The calculations reported in this article were carried out on computers at the University of Pittsburgh's Center for Molecular and Materials Simulations.
A.N.'s work was supported in part by the Israel Science Foundation and by the Kurt Lion Fund. Work in R.D.C.'s group was supported by National Institutes of Health grant R0l GMG1082-03 and and American Chemical Society Petroleum Research Fund grant 34754-AC6. M.K. acknowledges the financial support provided by Marquette University.
APPENDIX
In this Appendix a glossary of all important terms and abbreviations used in the article is given for the convenience of the reader. Subscript or superscript i denotes ionic species.
Symbols

Free energy function entering the Nernst-Planck equation (Eq. 1a)

Electrostatic potential due to all mobile ions and the applied electric field

Electrostatic potential due to partial charges fixed on the protein and lipid atoms

Electrostatic potential found from the solution of the corresponding Poisson equation (Eq. 6)

Potential of mean force for a single test ion—hence single ion potential (SIP)

Dielectric self-energy (DSE) or solvation energy of a single ion

Electrostatic free energy of an ion-protein/membrane complex with the ion located at a point
 inside the channel, calculated by numerical solution of Poisson equation (Eq. 6)
- Gprotein
Electrostatic free energy of the protein/membrane in the absence of the ion, calculated by numerical solution of Poisson equation
- Gion
Electrostatic free energy of the ion in bulk solvent, calculated by numerical solution of Poisson equation

Position-dependent dielectric response function (dielectric constant)
-
ɛp, ɛm, ɛw,

Dielectric constant of protein, membrane, bulk, and channel water region (Fig. 2)
Acronyms
- PNP
Poisson-Nernst-Planck theory
- DSEPNP
Dielectric-Self-Energy-Poisson-Nernst-Planck theory
- PMFPNP
Potential-of-Mean-Force-Poisson-Nernst-Planck theory
- DMC
Dynamic Monte Carlo method
- DSE
Dielectric self-energy
- PMF
Potential of mean force
References
- Allen, T. W., M. Hoyles, S. Kuyucak, and S. H. Chung. 1999. Molecular and Brownian dynamics study of ion selectivity and conductivity in the potassium channel. Chem. Phys. Let. 313:358–365. [Google Scholar]
- Andersen, O. S., and R. E. Koeppe, II. 1992. Molecular determinants of channel function. Physiol. Rev. 72:S89–S158. [DOI] [PubMed] [Google Scholar]
- Antonov, S. M. 2001. Transporters of neurotransmitters: receptive, transport, and channel functions. J. Evol. Biochem. Physiol. 37:328–334. [Google Scholar]
- Aqvist, J. 1990. Ion water interaction potentials derived from free-energy perturbation simulations. J. Phys. Chem. 94:8021–8024. [Google Scholar]
- Aqvist, J., and A. Warshel. 1989. Energetics of ion permeation through membrane channels. Biophys. J. 56:171–182. [DOI] [PMC free article] [PubMed] [Google Scholar]
- Arsen'ev, A. S., A. L. Lomize, I. L. Barsukov, and V. F. Bystrov. 1986. Gramicidin A transmembrane ion-channel. Three-dimensional structure reconstruction based on NMR spectroscopy and energy refinement. Biol. Membr. 3:1077–1104. [Google Scholar]
- Barcilon, V., D. P. Chen, and R. S. Eisenberg. 1992. Ion flow through narrow membrane channels. II. SIAM J. Appl. Math. 53:1405–1425. [Google Scholar]
- Berneche, S., and B. Roux. 2000. Molecular dynamics of the KcsA K+ channel in a bilayer membrane. Biophys. J. 78:2900–2917. [DOI] [PMC free article] [PubMed] [Google Scholar]
- Burykin, A., C. N. Schutz, J. Villá, and A. Warshel. 2002. Simulations of ion current in realistic models of ion channels: the KcsA potassium channel. Prot. Struct. Funct. Genet. 43:265–280. [DOI] [PubMed] [Google Scholar]
- Busath, D. D., C. D. Thulin, R. W. Hendershot, L. R. Phillips, P. Maughan, C. D. Cole, N. C. Bingham, S. Morrison, L. C. Baird, R. J. Hendershot, M. Cotten, and T. A. Cross. 1998. Noncontact dipole effects on channel permeation. I. Experiments with (5F-Indole)Trp(13) Gramicidin A channels. Biophys. J. 75:2830–2844. [DOI] [PMC free article] [PubMed] [Google Scholar]
- Cardenas, A. E., R. D. Coalson, and M. G. Kurnikova. 2000. Three-dimensional Poisson-Nernst-Planck theory studies: Influence of membrane electrostatics on Gramicidin A channel conductance. Biophys. J. 79:80–93. [DOI] [PMC free article] [PubMed] [Google Scholar]
- Chen, D. P., and R. S. Eisenberg. 1993a. Charges, currents, and potentials in ionic channels of one conformation. Biophys. J. 64:1405–1421. [DOI] [PMC free article] [PubMed] [Google Scholar]
- Chen, D. P., and R. S. Eisenberg. 1993b. Flux, coupling, and selectivity in ionic channels of one conformation. Biophys. J. 65:727–746. [DOI] [PMC free article] [PubMed] [Google Scholar]
- Chung, S. H., T. W. Allen, M. Hoyles, and S. Kuyucak. 1999. Permeation of ions across the potassium channel: Brownian dynamics studies. Biophys. J. 77:2517–2533. [DOI] [PMC free article] [PubMed] [Google Scholar]
- Cornell, W. D., P. Cieplak, C. I. Bayly, I. R. Gould, K. M. Merz, D. M. Ferguson, D. C. Spellmeyer, T. Fox, J. W. Caldwell, and P. A. Kollman. 1995. A second generation force field for the simulation of proteins, nucleic acids, and organic molecules. J. Am. Chem. Soc. 117:5179–5197. [Google Scholar]
- Corry, B., T. W. Allen, S. Kuyucak, and S. H. Chung. 2001. Mechanisms of permeation and selectivity in calcium channels. Biophys. J. 80:195–214. [DOI] [PMC free article] [PubMed] [Google Scholar]
- Corry, B., S. Kuyucak, and S. H. Chung. 2000. Tests of continuum theories as models of ion channels. II. Poisson-Nernst-Planck theory versus Brownian dynamics. Biophys. J. 78:2364–2381. [DOI] [PMC free article] [PubMed] [Google Scholar]
- Crozier, P. S., D. Henclerson, R. L. Rowley, and D. D. Busath. 2001a. Model channel ion currents in NaCl-extended simple point charge water solution with applied-field molecular dynamics. Biophys. J. 81:3077–3089. [DOI] [PMC free article] [PubMed] [Google Scholar]
- Crozier, P. S., R. L. Rowley, N. B. Holladay, D. Henderson, and D. D. Busath. 2001b. Molecular dynamics simulation of continuous current flow through a model biological membrane channel. Phys. Rev. Lett. 86:2467–2470. [DOI] [PubMed] [Google Scholar]
- Dasent, W. E. 1982. Inorganic energetics. Cambridge University Press, NY.
- Dieckmann, G. R., J. D. Lear, Q. F. Zhong, M. L. Klein, W. F. DeGrado, and K. A. Sharp. 1999. Exploration of the structural features defining the conduction properties of a synthetic ion channel. Biophys. J. 76:618–630. [DOI] [PMC free article] [PubMed] [Google Scholar]
- Dorman, V., M. B. Partenskii, and P. C. Jordan. 1996. A semi-microscopic Monte Carlo study of permeation energetics in a Gramicidin-like channel: The origin of cation selectivity. Biophys. J. 70:121–134. [DOI] [PMC free article] [PubMed] [Google Scholar]
- Doyle, D. A., J. M. Cabral, R. A. Pfuetzner, J. M. Gulbis, S. L. Cohen, B. T. Chait, and R. MacKinnon. 1998. The structure of the potassium channel: Molecular basis of K+ conduction and selectivity. Science. 280:69–77. [DOI] [PubMed] [Google Scholar]
- Eisenberg, R. S. 1999. From structure to function in open ionic channels. J. Membr. Biol. 171:1–24. [DOI] [PubMed] [Google Scholar]
- Elber, R., D. Rojewska, D. P. Chen, and R. S. Eisenberg. 1995. Sodium in Gramicidin—an example of a permion. Biophys. J. 68:906–924. [DOI] [PMC free article] [PubMed] [Google Scholar]
- Gilson, M. K., and B. H. Honig. 1986. The dielectric constant of a folded protein. Biopolymers. 25:2097–2119. [DOI] [PubMed] [Google Scholar]
- Graf, P., A. Nitzan, M. G. Kurnikova, and R. D. Coalson. 2000. A dynamic lattice Monte Carlo model of ion transport in inhomogeneous dielectric environments: method and implementation. J. Phys. Chem. B. 104:12324–12338. [Google Scholar]
- Hille, B. 1992. Ionic Channels of Excitable Membranes. Sinauer Associates Inc., Cambridge, NY.
- Hille, B., C. M. Armstrong, and R. MacKinnon. 1999. Ion channels: from idea to reality. Nat. Med. 5:1105–1109. [DOI] [PubMed] [Google Scholar]
- Hollerbach, U., D. P. Chen, D. D. Busath, and B. Eisenberg. 2000. Predicting function from structure using the Poisson-Nernst-Planck equations: sodium current in the Gramicidin-A channel. Langmuir. 16:5509–5514. [Google Scholar]
- Im, W., S. Seefeld, and B. Roux. 2000. A grand canonical Monte Carlo-Brownian dynamics algorithm for simulating ion channels. Biophys. J. 79:788–801. [DOI] [PMC free article] [PubMed] [Google Scholar]
- King, G., F. S. Lee, and A. Warshel. 1991. Microscopic simulations of macroscopic dielectric-constants of solvated proteins. J. Chem. Phys. 95:4366–4377. [Google Scholar]
- Klapper, I., R. Hagstrom, R. Fine, K. Sharp, and B. Honig. 1986. Focusing of electric fields in the active site of Cu-Zn superoxide dismutase: effects of ionic strength and amino-acid modification. Proteins. 1:47–59. [DOI] [PubMed] [Google Scholar]
- Kollman, P. A., I. Massova, C. Reyes, B. Kuhn, S. H. Huo, L. Chong, M. Lee, T. Lee, Y. Duan, W. Wang, O. Donini, P. Cieplak, J. Srinivasan, D. A. Case, and T. E. Cheatham. 2000. Calculating structures and free energies of complex molecules: combining molecular mechanics and continuum models. Acc. Chem. Res. 33:889–897. [DOI] [PubMed] [Google Scholar]
- Koneshan, S., R. M. Lynden-Bell, and J. C. Rasaiah. 1998. Friction coefficients of ions in aqueous solution at 25°C. J. Am. Chem. Soc. 120:12041–12050. [Google Scholar]
- Koprowski, P., and A. Kubalski. 2001. Bacterial ion channels and their eukaryotic homologues. Bioessays. 23:1148–1158. [DOI] [PubMed] [Google Scholar]
- Kurnikova, M. G., R. D. Coalson, P. Graf, and A. Nitzan. 1999. A lattice relaxation algorithm for three-dimensional Poisson-Nernst-Planck theory with application to ion transport through the Gramicidin-A channel. Biophys. J. 76:642–656. [DOI] [PMC free article] [PubMed] [Google Scholar]
- Kuyucak, S., O. S. Andersen, and S. H. Chung. 2001. Models of permeation in ion channels. Rep. Progr. Phys. 64:1427–1472. [Google Scholar]
- Lerche, H., K. Jurkat-Rott, and F. Lehmann-Horn. 2001. Ion channels and epilepsy. Am. J. Med. Genet. 106:146–159. [DOI] [PubMed] [Google Scholar]
- Lide, D. R. 1994. CRC Handbook of Thermophysical and Thermochemical Data. CRC Press, Boca Raton, FL.
- Luty, B. A., M. E. Davis, and J. A. McCammon. 1992. Solving the finite-difference non-linear Poisson-Boltzmann equation. J. Comp. Chem. 13:1114–1118. [Google Scholar]
- Lynden-Bell, R. M., and J. C. Rasaiah. 1996. Mobility and solvation of ions in channels. J. Chem. Phys. 105:9266–9280. [Google Scholar]
- Mackay, D. H. J., P. H. Berens, K. R. Wilson, and A. T. Hagler. 1984. Structure and dynamics of ion-transport through Gramicidin-A. Biophys. J. 46:229–248. [DOI] [PMC free article] [PubMed] [Google Scholar]
- Marban, E. 2002. Cardiac channelopathies. Nature. 415:213–218. [DOI] [PubMed] [Google Scholar]
- Mashl, R. J., Y. Z. Tang, and J. Schnitzer. 2001. Hierarchical approach to predicting permeation in ion channels. Biophys. J. 81:2473–2483. [DOI] [PMC free article] [PubMed] [Google Scholar]
- McQuarrie, D. A. 1976. Statistical Mechanics. Harper Collins Publishers, New York.
- Nilius, B., and G. Droogmans. 2001. Ion channels and their functional role in vascular endothelium. Physiol. Rev. 81:1415–1459. [DOI] [PubMed] [Google Scholar]
- Partenskii, M. B., V. Dorman, and P. C. Jordan. 1994. Influence of a channel-forming peptide on energy barriers to ion permeation, viewed from a continuum dielectric perspective. Biophys. J. 67:1429–1438. [DOI] [PMC free article] [PubMed] [Google Scholar]
- Partenskii, M. B., and P. C. Jordan. 1992. Theoretical perspectives of ion-channel electrostatics, continuum and microscopic approach. Quart. Rev. Biophys. 91:477–510. [DOI] [PubMed] [Google Scholar]
- Roux, B. 2002. Theoretical and computational models of ion channels. Curr. Opin. Struct. Biol. 12:182–189. [DOI] [PubMed] [Google Scholar]
- Roux, B., S. Berneche, and W. Im. 2000. Ion channels, permeation, and electrostatics: insight into the function of KcsA. Biochemistry. 39:13295–13306. [DOI] [PubMed] [Google Scholar]
- Roux, B., and M. Karplus. 1993. Ion-transport in the Gramicidin channel—free energy of the solvated right-handed dimer in a model membrane. J. Am. Chem. Soc. 115:3250–3262. [Google Scholar]
- Roux, B., and R. MacKinnon. 1999. The cavity and pore helices the KcsA K+ channel: electrostatic stabilization of monovalent cations. Science. 285:100–102. [DOI] [PubMed] [Google Scholar]
- Schuss, Z., B. Nadler, and R. S. Eisenberg. 2001. Derivation of Poisson and Nernst-Planck equations in a bath and channel from a molecular model. Phys. Rev. E. 036116:1–14. [DOI] [PubMed] [Google Scholar]
- Schutz, C. N., and A. Warshel. 2001. What axe the dielectric “constants” of proteins and how to validate electrostatic models? Prot. Struct. Funct. Genet. 44:400–417. [DOI] [PubMed] [Google Scholar]
- Sharp, K. A., and B. H. Honig. 1990. Electrostatic interactions in macromolecules—theory and applications. Ann. Rev. Biophys. Biophys. Chem. 19:301–332. [DOI] [PubMed] [Google Scholar]
- Simonson, T., and C. L. Brooks. 1996. Charge screening and the dielectric constant of proteins: insights from molecular dynamics. J. Am. Chem. Soc. 118:8452–8458. [Google Scholar]
- Smith, G. R., and M. S. P. Sansom. 1999. Effective diffusion coefficients of K+ and Cl− ions in ion channel models. Biophys. Chem. 79:129–151. [DOI] [PubMed] [Google Scholar]
- Tang, Y. Z., W. Z. Chen, and C. X. Wang. 2000. Molecular dynamics simulations of the Gramicidin A- dimyristoylphosphatidylcholine system with an ion in the channel pore region. Eur. Biophys. J. Biophys. Lett. 29:523–534. [DOI] [PubMed] [Google Scholar]
- Tieleman, D. P., P. C. Biggin, G. R. Smith, and M. S. P. Sansom. 2001. Simulation approaches to ion channel structure-function relationships. Quart. Rev. Biophys. 34:473–561. [DOI] [PubMed] [Google Scholar]
- Vorobjev, Y. N., and J. Hermans. 1999. ES/IS: estimation of conformational free energy by combining dynamics simulations with explicit solvent with an implicit solvent continuum model. Biophys. Chem. 78:195–205. [DOI] [PubMed] [Google Scholar]
- Warshel, A., and S. T. Russell. 1984. Calculations of electrostatic interactions in biological systems and in solutions. Quart. Rev. Biophys. 17:283–422. [DOI] [PubMed] [Google Scholar]
- Woolf, T. B., and B. Roux. 1997. The binding site of sodium in the Gramicidin-A channel: comparison of molecular dynamics with solid-state NMR data. Biophys. J. 72:1930–1945. [DOI] [PMC free article] [PubMed] [Google Scholar]