

Abstract
The Na+ and voltage-dependence of transient rabbit Na+/glucose cotransporter (rSGLT1) kinetics was studied with the two-electrode voltage-clamp technique and Xenopus laevis oocytes. Using step changes in membrane potential, in the absence of glucose but with 100 or 10 mM Na+, transient currents were measured corresponding to binding/debinding of Na+ and conformational changes of the protein. Previously, only a single time constant has been published for rSGLT1. We, however, observed three decay components; a fast (τf, 0.5–1 ms) voltage- and Na+-independent decay, and medium (τm, 0.5–4 ms) and slow (τs, 8–50 ms) voltage- and Na+-dependent decays. Transient currents were simulated and fit using a four-state model to obtain kinetic parameters for the system. The four-state model was able to reconstitute an assortment of experimental data.
INTRODUCTION
The rabbit Na+/glucose cotransporter (rSGLT1) is a membrane protein, primarily found in the small intestine and kidney proximal tubules, which moves two Na+ ions and one glucose molecule/transport cycle into cells, using the electrochemical gradient of Na+ as a driving force. rSGLT1 was first cloned by Hediger and colleagues in 1987 (Hediger et al., 1987), and since then has been studied extensively. Voltage-clamp experiments on Xenopus laevis oocytes expressing SGLT1 protein have been particularly informative in studying transport kinetics. In response to a step change in membrane potential, in the absence of glucose, SGLT1-related transient current is observed. This current is attributed to the movement of Na+ ions along a pathway to the Na+ binding site (see Fig. 1 A, C⇔CNa), and reorientation of unloaded carrier across the membrane (C⇔C′). The transient current can be represented mathematically as a sum of exponential decays,  The number of decay components observed (n) is at most equal to the number of protein states minus one—for example, a model with three states will produce transients with, at most, two decay components. Ability to measure accurately as many decay components as possible is critical in determining underlying rate constants governing transport.
FIGURE 1.

State models of SGLT1 in the absence of glucose. (A) Classical three-state system. CNa⇔C corresponds to binding/debinding of either one or two simultaneous Na+ ions, and C⇔C′ to movement of the unloaded carrier between an outside and inside facing conformation. (B) Four-state diagram adopted by Chen et al. (1996) for hSGLT1 and used in this article for rSGLT1. Both C2⇔C3 and C3⇔C4 are conformational changes of the unloaded carrier. C1⇔C2 is a single or double Na+ binding/debinding event.
As early as 1992, two decay components were observed for rSGLT1: τs (slow), 4–18 ms, and τf (fast), 0.95–2.3 ms (Parent et al., 1992), and in 1993, two for human SGLT1 (hSGLT1): τs, 2–10 ms, and τf ∼ 0.5 ms (Loo et al., 1993). The three-state model in Fig. 1 A, with two concurrent Na+ binding/debinding events, was adopted for both human and rabbit SGLT1, attributing τs to a conformational change of the unloaded carrier between extra- and intracellular conformations (C⇔C′), and τf to non-SGLT1-specific membrane capacitive currents (τcapacitive ∼ 0.5 ms). It was concluded that Na+ binding/debinding (C⇔CNa) was too fast to observe. A 1994 study of the D176A mutant of rSGLT1 found two decay components with altered kinetics compared to wild-type (τs, 4.6–28 ms, and τf, 3.5–4.6 ms; see Panayotova-Heiermann et al., 1994). In this case, the fast decay was too slow to attribute to capacitive currents; however, no conclusion was made as to its functional significance, and the model in Fig. 1 A was retained. In 1996, Chen and co-workers (Chen et al., 1996), using the higher resolution cut-open oocyte technique (Taglialatela et al., 1992; Costa et al., 1994) as opposed to the two-electrode setup used in the earlier works mentioned above, found two decay components for hSGLT1 (τs, 2–10 ms, and τf, 0.4–0.8 ms). In contrast to the previous hSGLT1 study (Loo et al., 1993) the fast decay was attributed to SGLT1 function as opposed to membrane capacitance. Both decay components were present in the complete absence of extra- and intracellular Na+ and glucose. This led to the proposal of a new four-state model of SGLT1 with two conformational changes of the unloaded carrier (Fig. 1 B, C2⇔C3 and C3⇔C4). Little attention has been given to this model until now, with τf continuing to be interpreted as capacitive current by some groups. However, recent work in our lab with the Q170C mutant of rSGLT1 (unpublished research) has identified two decay components (τs, 8–30 ms and τf, 1.3–2.5 ms), consistent with, and supporting, the four-state model in Fig. 1 B.
In light of the second-order decays observed for hSGLT1 and the Q170C and D176A mutants of rSGLT1, we hypothesized that the decay characteristics of rSGLT1 might be more complex than previously reported, and we sought to investigate this in more detail. For all previous analyses of SGLT1 transient currents, rates of decay were measured by jumping from a single prestep potential (typically between −50 and −100 mV) to the poststep potential being tested (rates of decay are exclusively a function of the poststep potential; however, decay amplitudes are affected by both the pre- and poststep potentials), and this single trace was analyzed (Parent et al., 1992; Loo et al., 1993; Chen et al., 1996; Hazama et al., 1997; Panayotova-Heiermann et al., 1998; Meinild et al., 2001). This protocol, however, has several drawbacks. When the step in voltage is small, the transient currents are also small and it becomes difficult to fit them because of a small signal-to-noise ratio. In addition, it is possible that some decay components are not easily detected for all prestep potentials, and in particular, at ∼−50 mV. To solve both problems we implemented a protocol using an array of prestep potentials, from −150 to 90 in 10-mV steps, to find time constants at each poststep potential (see Fig. 2). Small transients were no longer a concern, as at least some of the voltage jumps were large enough to give adequate currents. Also, we were able to extract time constants over a range of prestep potentials where each decay component was optimally observed. An additional benefit was that trends could be compared among the family of curves, adding an extra level of robustness that was useful when fitting transients to a third-order decay. Using this protocol, three decay components were observed over a voltage range from −150 to 70 mV at 10 and 100 mM Na+. A four-state model is the minimum required to account for three time constants, and such a model was used to simulate and fit transient currents.
FIGURE 2.

SGLT1 transient currents. (A) Overlay of 25 traces showing membrane potentials applied to produce currents in B. Prestep potentials were applied for 100 ms before the step at t = 0 to allow the system to stabilize (not shown). A voltage step occurs at t = 0. Prestep potentials, defined as the membrane potential for t < 0, range from −150 to 90 mV in 10-mV steps. The poststep potential, membrane potential for t > 0, is 10 mV for all traces. (B) Set of 25 traces used to characterize the transient response of SGLT1 for a 10-mV poststep potential. Positive currents are generated from prestep potentials more hyperpolarizing than 10 mV, and negative currents from prestep potentials more depolarizing than 10 mV. Transient currents for prestep potentials of −150 and 90 mV are labeled and the intermediate potentials can be inferred from the size and sign of the transients. Currents before stabilization of the clamp have been removed.
MATERIALS AND METHODS
Molecular biology
The multicloning site of the eukaryotic expression vector pMT3 (provided by the Genetics Institute, Boston, MA) was removed by digestion with PstI and KpnI, and the cDNA of rSGLT1 (kindly provided by M. Hediger) was subcloned into the remaining EcoRI site (Lo and Silverman, 1998).
Oocyte preparation and injection
Xenopus laevis frogs were anesthetized with a 0.17% aqueous solution of 3-aminobenzoic acid ethyl ester. Extracted oocytes were digested for 25–90 min with 2 mg/ml of type IV collagenase (Sigma, Oakville, ON, Canada) prepared in modified Barth's saline (MBS) supplemented with MgCl. MBS/Mg2+ solution (0.88 mM NaCl, 1 mM KCl, 2.4 mM NaHCO3, 1 mM MgCl2, and 15 mM HEPES-Tris, pH 7.4). For all storage after digestion, oocytes were kept at 16–18°C in Leibovitz's L-15 solution (Sigma) supplemented with 0.08 mg/mL of gentamicin, 0.736 g/L of L-glutamine, and 10 mM of HEPES-NaOH, pH 7.4. The day after digestion, 9.2 nL of 60 ng/μL cDNA of rSGLT1 was injected into the nucleus, via the animal pole, of defolliculated oocytes.
Two-microelectrode voltage-clamp
Voltage-clamp experiments were performed 4–6 days after injection using a GeneClamp 500 amplifier and pClamp 6.0 data acquisition software (Axon Instruments, Union City, CA). Electrode tips, fabricated from 150 μm borosilicate glass capillary tubes, were pulled using the model p-97 Flaming/Brown micropipette puller (Sutter Instruments, Novato, CA). Tips were filled with 3-M KCl. Between measurements, oocytes were constantly perfused at ∼3.5 mL/min with voltage-clamping solution (100 mM NaCl, 2 mM KCl, 1 mM MgCl2, 1 mM CaCl2, and 10 mM HEPES-Tris base, pH 7.4). For experiments at 10 mM Na+, voltage-clamping solution was modified to contain 10 mM of NaCl and 90 mM of choline. Only oocytes with resting potentials more hyperpolarizing than −30 mV were used.
Transient current measurement
In an oocyte-expressing SGLT1, measured currents consist of nonspecific components (generated by capacitive currents, and endogenous transporters and channels), and an SGLT1-specific component that is inhibitable by phloridzin. For all experiments, SGLT1 specific currents were isolated by subtracting currents measured immediately before and after the addition of saturating 0.2 mM phloridzin, under the assumption that, in the absence of phloridzin, both specific and nonspecific currents are measured, whereas only nonspecific currents are detected in the presence of phloridzin. Because the Ki for phloridzin is 1–10 μM (unpublished data), 200 μM completely blocks SGLT1-specific currents. This has been confirmed by plots of the integral of transient currents in the presence of 200 μM phloridzin which are linear between −150 and 70 mV at both 10 and 100 mM Na+ (data not shown), suggesting that the transient current response is solely capacitive over this voltage range (i.e., transporter currents are completely inhibited by phloridzin).
Fig. 2, shows a typical protocol used to determine decay characteristics at a membrane potential of 10 mV. The protocol is composed of 25 traces, each characterized by a unique prestep potential ranging from −150 to 90 mV in 10-mV steps, and a poststep potential of 10 mV for all traces. Prestep potentials were applied for 100 ms before the step at t = 0 to allow the system to equilibrate. The voltage-dependence of decay parameters was determined using a set of these protocols, with the poststep potential varying from −150 to 70 mV in 20-mV steps. (For a detailed discussion of how the transient currents were fit to exponential decays, see Fitting Decay Currents in Results.) To determine the clamp speed, the oocyte membrane potential was measured as a function of time for several protocols. Final potentials were reached 0.6–1.3 ms after the onset of the clamp for voltage steps ranging from 70 to 240 mV. While the membrane potential is changing during a voltage step, large capacitive currents are observed, which leads to saturation of the amplifier. Data before stabilization of the membrane potential (i.e., the first 0.6 to 1.3 ms of each trace) was removed before curve fitting. A sampling interval of 20 μs was used.
State model simulations
Transient currents were recorded using the 5-ms ramp protocol shown in Fig. 3. The oocyte membrane potential was maintained at −50 mV between experiments. At t = 0 ms the membrane potential was increased linearly over 5 ms from −50 mV to an array of post-ramp potentials. At t = 150 ms the membrane potential was returned to −50 mV by another 5-ms ramp. A ramp was used, as opposed to a step, to avoid saturation of the amplifier by capacitive currents, allowing transients to be fit starting at t = 0, as opposed to 0.5–1.5 ms with a step. Before simulation, traces were low-pass-filtered at 1 kHz. Currents in response to the initial ramp (from 0 to 150 ms) were baseline-adjusted by the mean current calculated between 145 and 150 ms, whereas currents from the second ramp (150–300 ms) were baseline-adjusted by the mean current between 295 and 300 ms.
FIGURE 3.

Ramp protocol and transient currents used for model simulations. Overlay of clamp potentials, A, used to produce transients shown in B and C. At t = 0, a 5-ms ramp was applied from a holding potential of −50 mV to post-ramp potentials of 50, 20, −10, −90, and −130 mV. Another 5-ms ramp was used to return the membrane potential to −50 mV at t = 150 ms. The holding potential was maintained at −50 between experiments. Post-ramp potentials more depolarizing than −50 mV produced positive currents whereas those more hyperpolarizing produced negative currents. The transients increase in magnitude with larger changes in potential. Transients corresponding to −130 and 50 mV post-ramp potentials at t = 5 ms are labeled, and the intermediate potentials can be inferred from the size and sign of the transient.
Simulations were performed with the commercially available software package ModelMaker 3 (ModelKinetix, Old Beaconsfield, Buckinghamshire, UK), using the four-state model in Fig. 4, and Eqs. 1–5, which will be discussed shortly. Transient currents at five post-ramp membrane potentials (−130, −90, −10, 20, and 50 mV) were simulated and fit simultaneously from 0 to 50 ms and 150 to 200 ms. The overall χ2 was minimized by optimizing 12 parameters (six rate constants, k-values; and six valences, z-values). The number of expressed transporters, N, was estimated from Qmax measured from the Boltzmann distribution (see Eq. 5) To increase the likelihood of finding a global minimum, an array of initial values was used for the parameters. Each parameter had two starting values, for a total of 212 = 4096 optimizations.
FIGURE 4.

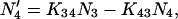
Four-state model.
State model equations
The four-state model in Fig. 4 was simulated using the following set of differential equations:
 |
(1a) |
 |
(1b) |
 |
(1c) |
 |
(1d) |
 |
(1e) |
N is the total number of expressed transporters and Ni is the number of transporters in state Ci. Eyring rate theory was used to account for voltage-dependence, V, of the rate constants (Glasstone et al., 1941),
 |
(2a) |
 |
(2b) |
 |
(2c) |
with u = F/RT, where F is Faraday's constant, R the gas constant, and T the temperature in Kelvin. In all calculations a u of 0.0394 mV−1 was used, corresponding to a temperature of 22°C. The voltage-dependence of each rate constant is characterized by a z-value, which is unitless. The charge movement associated with a single transition (Ci⇔Ci+1) is the sum of the forward and reverse voltage-dependencies,
 |
(3) |
Membrane current was calculated using the equation,
 |
(4) |
where e is the elementary charge.
N was calculated from Qmax (from the Boltzmann distribution) using the equation,
 |
(5) |
Time constants of a fast–slow–fast model
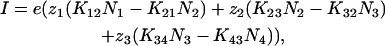
If K12 + K21 ≫ K23 + K32 ≪ K34 + K43 (Chen et al., 1996) it can be assumed that the system in Fig. 4 reaches an equilibrium distribution across transitions C1⇔C2 and C3⇔C4 before any significant movement has occurred across C2⇔C3. In this case, simple expressions for the system time constants can be derived (Chen et al., 1996):
 |
(6a) |
 |
(6b) |
 |
(6c) |
with
 |
(6d) |
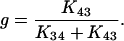 |
(6e) |
RESULTS
Fitting decay currents
Without assuming an order of decay a priori, we began by fitting each trace (from 0 to 100 ms) to a first-order exponential decay, and then subsequently increased the order (up to a maximum of three) until the χ2 ceased to decrease and/or the higher order terms became meaningless (this was often manifested as extremely large or small time constant or amplitude values; or large errors associated with fit parameters). A number of factors were taken into consideration when deciding upon an order for a fit; as a rule of thumb, the higher order fit was accepted if 1), its χ2 was at least 10% (this was chosen as a conservative value) smaller than the lower order fit; 2), time constant and amplitude trends were consistent among the family of curves; and 3), the residuals showed a clear improvement at the highest order fit.
Results from the analysis of a typical data set (characterized here by a 30-mV poststep potential at 100 mM Na+) are shown in Table 1. The χ2 was significantly reduced, typically by 95%, with a second-order fit for almost all traces (the only exception was the 90-mV trace which was of a single order). A third-order fit further reduced the χ2 of most depolarizing traces by ∼30%. All fits approached a minimum χ2 of ∼4 when the optimal fit order was used. This minimum χ2 was likely error due to background noise that could not be eliminated. (The error contributed by background noise—mean ± SD—was found to be 4.6 ± 0.46, n = 12, by fitting steady-state currents to the equation y = b over 100-ms intervals.) Three time constants (∼1, ∼3.5, and ∼18.5 ms) were clearly present, and remained relatively constant over the range of prestep potentials. When a time constant did deviate, as was the case for the 18.5 ms decay at potentials more depolarizing than 0 mV, it was likely caused by several factors; a decrease in the amplitude of the slow decay reduced the accuracy of the fit; the absence of a third-order fit at these potentials caused the slower decay to fit an average of the 3.5 and 18.5 ms decays. As a rule of thumb, each time constant was calculated from the average of five traces with the largest amplitude for that decay component. The three averaged time constants (mean ± SE) are given at the bottom of Table 1, and are 0.95 ± 0.118, 3.8 ± 0.18, and 18.7 ± 0.47. It is apparent that the 3.8-ms decay is absent for prestep potentials more depolarizing than 0 mV, and in addition the 18.7 ms decay is not fit well for these potentials. This highlights the importance of using several prestep potentials to determine time constants.
TABLE 1.
Multiexponential time constant analysis of a typical data set
| χ2 (Fit order) | % Drop (χ2) | |||||||
|---|---|---|---|---|---|---|---|---|
| Vi | 1 | 2 | 3 | 1–2 | 2–3 | τ1 | τ2 | τ3 |
| −150 | 204 | 7.7 | 4.3 | 96 | 45 | 0.8* | 3.4* | 18* |
| −140 | 198 | 8.8 | 4.0 | 96 | 55 | 0.9* | 4.0* | 20* |
| −130 | 194 | 7.2 | 3.7 | 96 | 49 | 1.1* | 4.0* | 20* |
| −120 | 186 | 8.0 | 5.1 | 96 | 36 | 1.0* | 3.8* | 19* |
| −110 | 175 | 7.2 | 4.6 | 96 | 37 | 0.9* | 3.7* | 19* |
| −100 | 163 | 6.3 | 4.3 | 96 | 32 | 0.8 | 3.5 | 18 |
| −90 | 154 | 6.3 | 4.6 | 96 | 27 | 1.0 | 3.8 | 19 |
| −80 | 154 | 6.0 | 4.3 | 96 | 28 | 0.9 | 3.6 | 19 |
| −70 | 139 | 6.2 | 4.6 | 96 | 26 | 0.9 | 3.6 | 18 |
| −60 | 131 | 6.5 | 5.0 | 95 | 24 | 1.0 | 3.7 | 18 |
| −50 | 120 | 5.1 | 4.2 | 96 | 18 | 0.7 | 3.2 | 18 |
| −40 | 104 | 5.0 | 4.1 | 95 | 18 | 0.8 | 3.3 | 18 |
| −30 | 94 | 5.1 | 3.9 | 95 | 24 | 1.0 | 3.5 | 18 |
| −20 | 73 | 5.2 | 4.3 | 93 | 18 | 0.9 | 3.2 | 17 |
| −10 | 61 | 5.3 | 4.6 | 91 | 14 | 1.3 | 4.4 | 20 |
| 0 | 39 | 4.4 | 3.9 | 89 | 11 | 1.1 | 3.4 | 19 |
| 10 | 18 | 3.8 | 3.5 | 78 | 7 | 1.6 | 14 | |
| 20 | 7.3 | 3.9 | 3.9 | 46 | 1 | 1.4 | 14 | |
| 30 | ||||||||
| 40 | 7.6 | 5.4 | 29 | 1.4 | 15 | |||
| 50 | 9.0 | 3.5 | 3.4 | 61 | 1 | 1.2 | 15 | |
| 60 | 11 | 4.2 | 60 | 1.1 | 13 | |||
| 70 | 7.6 | 4.6 | 39 | 1.1 | 11 | |||
| 80 | 5.1 | 4.1 | 20 | 1.1 | 11 | |||
| 90 | 4.2 | 1.0 | ||||||
| 0.95 ± 0.118 | 3.8 ± 0.18 | 18.7 ± 0.47 | ||||||
Value used to calculate average at bottom of column.
First through third-order fits are shown in Fig. 5 for the −120 mV prestep potential trace. Inadequacy of the first-order fit is readily visible. From a closeup of the first 10 ms (Fig. 5 B) it is possible to discern the improvements made by a third-order fit. However, justification of a third-order decay becomes more apparent when the residuals are plotted (Fig. 6). Residuals are defined as data-fit. For a good fit the residuals reflect noise and oscillate randomly about the zero axis. Inspection of Fig. 6 reveals that the second-order fit residual contains nonrandom oscillations, predominantly visible in the first 25 ms, which are removed by a third-order fit. Because the third-order residual is flat, it is unlikely that a fourth-order fit would have any added value.
FIGURE 5.

Comparison of first- through third-order fits to a transient decay. (A) First- (dotted line), second- (dashed line), and third-order (solid line) fits to the −130 mV prestep 30-mV poststep potential transient analyzed in Table 1. Inadequacy of the first-order fit is clearly shown. (B) Closeup from 0 to 10 ms shows improvement of the third-order fit over the second-order fit.
FIGURE 6.

Fit residuals. (A) First-, (B) second-, and (C) third-order fit residuals for the −130-mV prestep 30-mV poststep potential transient analyzed in Table 1 and fit in Fig. 5. Residuals are calculated as data-fit. For a good fit, the residuals contain only noise, and therefore oscillate randomly about the zero axis. First- and second-order residuals contain obvious nonrandom components. A third-order fit produced the best result, with residuals that appeared to contain only random noise.
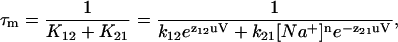
Time constant voltage and Na+-dependence
Similar analyses to the one discussed above were performed for poststep potentials ranging from −150 to 70 mV (in 20-mV increments) at 10 and 100 mM Na+. Three decay components were found in all cases except for poststep potentials more hyperpolarizing than −30 mV at 100 mM Na+ where only two were present. Results are shown in Fig. 7. The three time constants were characterized by a fast (τf, 0.5–1 ms) voltage- and Na+-independent decay, and medium (τm, 1.5–4 ms) and slow (τs, 10–45 ms) voltage- and Na+-dependent decays.
FIGURE 7.

Voltage- and Na+-dependence of the three time constants used to fit the transient currents. (A) τs (slow), (B) τm (medium), and (C) τf (fast). 100 mM Na+ (solid circles); 10 mM Na+ (open circles). (n = 3, except for −150, −110, −90, and 50 mV at 100 mM Na+ and −150 mV at 10 mM Na+, where n = 2). Error bars are standard errors for data points with n = 3 and the mean of the difference for n = 2.
τs is sigmoidal in form (Fig. 7 A). At 100 mM Na+, it increases rapidly from ∼10 ms at depolarizing potentials to ∼42 ms at −50 mV, and then becomes relatively voltage-independent, maintaining a value of ∼42 ms for potentials more hyperpolarizing than −50 mV. Decreasing the Na+ concentration to 10 mM shifts the curve to hyperpolarizing potentials by ∼100 mV. τm (Fig. 7 B) has a bell-shaped voltage-dependence, in the presence of 10 mM Na+, with a peak of ∼3.5 ms at ∼−20 mV. Any peak at 100 mM Na+ (assuming the same voltage-dependent form as 10 mM Na+) would occur at potentials more depolarizing than 70 mV, and would be greater than 4 ms. Therefore a reduction in the Na+ concentration appears to shift the τm versus V curve to hyperpolarizing potentials and possibly reduce its magnitude. The fast time constant (Fig. 7 C) is relatively voltage-independent at both 100 and 10 mM Na+, ranging between 0.5 and 1.1 ms.
We recognize that the settling time of the clamp (0.6–1.3 ms) is similar to that of τf (0.5–1 ms) and this may raise some questions about the relevancy of τf. Transient currents before settling of the clamp are removed before fitting, and this means that ∼35% of the fast decay component remains to be fit. However, because the amplitude of τf is large (∼103 nA), we believe the remaining current is sufficient. Three decays (i.e., 3 × τ) is often quoted as a rule of thumb for the minimum time interval necessary to fit an exponential decay well. If the amplitude of the fastest decay (0.5 ms) is ∼2000 nA and the minimum resolution of the system is 5 nA, then six decays are present before the transient vanishes, and we can afford to lose up to three decays in the time interval before the clamp stabilizes. Therefore, we can wait ∼3 × 0.5 = 1.5 ms for the clamp to stabilize and still retain reasonable fits for the fast decay component. Furthermore, τf and its amplitudes are present and consistent throughout each family of transients. However, we do believe that this does have an impact on the precision of τf measurements, which can be seen by comparing the τf versus V curves in Fig. 7 C to those of τs and τm, which are much smoother. The point here is to note that a fast decay component of ∼0.8 ms is present, but we recognize that its voltage- and Na+-concentration dependence needs to be thoroughly studied using more precise methods, such as the cut-open oocyte.
Amplitude voltage and Na+-dependence
In Fig. 8, amplitudes for each of the three decay components (denoted As, Am, and Af for amplitudes belonging to the slow, medium, and fast decay components, respectively) are shown as a function of the pre- and poststep potential for a representative data set at 10 and 100 mM Na+. (Am curves are not available for poststep potentials more hyperpolarizing than −30 mV at 100 mM Na+. Simulation results suggest that the medium decay becomes too fast to observe in this region.) All curves shift upward as the poststep potential is made more depolarizing, and shift by ∼100 mV to hyperpolarizing potentials as the Na+ concentration is reduced from 100 to 10 mM.
FIGURE 8.

Amplitude curves obtained from fitting transient currents to the multiexponential decay  Amplitudes are shown as a function of the prestep potential from −150 to 90 mV and for poststep potentials of −130 (circles), −90 (up triangle), −50 (down triangle), −10 (diamond), and 30 mV (left triangle). Data are from different oocytes at each Na+ concentration.
It should be noted that earlier investigations of the transient currents have mistaken τf as the time constant of the capacitive decay (Parent et al., 1992; Loo et al., 1993; Hazama et al., 1997). This occurred because τf is close to the speed of the capacitive time constant (∼0.5 ms). For a step change in potential, the charge movement, Q, associated with a capacitive decay, varies linearly with the size of the voltage jump, 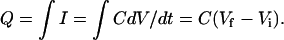 Because Q = Aτ, and τ is constant as a function of the prestep potential for each poststep potential in Fig. 8, if τf was a capacitive decay then the amplitude curves in Fig. 8 would be linear. However, they are not linear, and we conclude (as did Chen et al., 1996, for hSGLT1) that τf is not capacitive.
Model simulations
To test our findings and to provide further insight into the system, we sought a solution to the four-state model in Fig. 1 B (governed by Eqs. 1–5) that could reproduce experimental transient currents. This model was chosen because four states is the minimum number required to account for a three time constant system. In addition, this system has been used to model hSGLT1 transients in the absence of glucose (Chen et al., 1996).
Transient current recordings at 10 and 100 mM Na+ (for post-ramp potentials of −130, −90, −10, 20, and 50) were fit to currents produced from a simulation of the model. No assumption was made about the Na+-dependence of the rate constants. However, it was assumed that if a parameter was Na+-dependent it would become apparent when comparing solutions at both Na+ concentrations (i.e., a rate constant involving the binding of Na+ would decrease by a factor of 10 for a single, or 100 for a double, Na+ binding event as the Na+ concentration was reduced from 100 to 10 mM. (A rate constant which accounts for an ion binding event is written as  where n is the order—i.e., number of ions binding simultaneously—of the reaction, and [A] is the ion concentration. Therefore, if k21 is a single ion binding event, then reducing the Na+ concentration by a factor of 10 should reduce k21 by a factor of 10.)
Solutions were then compared to find those which were similar at both Na+ concentrations, allowing for the possibility of some Na+-dependent rate constants. A single solution was found with similar rate constants and voltage-dependencies at both Na+ concentrations for all parameters excluding k12 and k21 (see Table 2). As the Na+ concentration is reduced, k12 increases and k21 decreases by an order of magnitude. It was not unexpected to observe this change in k21 with Na+ concentration, as we hypothesized this to be the Na+ binding pathway before simulation. However, the change in k12 was unexpected, and no intermediate value could be found which provided adequate fits at both Na+ concentrations.
TABLE 2.
Four-state model solutions for rabbit and human SGLT1
| (1/s) | |||||||||||||
|---|---|---|---|---|---|---|---|---|---|---|---|---|---|
| (mM) [Na+] | k12 | k21 | k23 | k32 | k34 | k43 | z12 | z21 | z23 | z32 | z34 | z43 | |
| rSGLT1 | 100 | 66 | 180 | 100 | 24 | 330 | 380 | 0.44 | 0.69 | 0 | 0 | 0.31 | 0.2 |
| 10 | 480 | 23 | |||||||||||
| hSGLT1* | 2300 | 15,000 × [Na+] | 280 | 100 | 370 | 790 | 0.36 | 0.24 | 0.35 | 0 | 0.28 | 0.12 | |
Parameter values are from Chen et al. (1996).
In addition to reproducing the transient currents well (Fig. 9), the model solution was able to reconstitute a number of other experimental findings. The τ versus V curves in Fig. 10 were calculated by substituting the parameter values in Table 2 into Eq. 1 and solving for the eigenvalues of the system using the commercially available software package Maple 6.01 (Waterloo Maple, Waterloo, Ontario, Canada). The theoretical and experimental curves are very similar, providing further evidence that all three fitted time constants are related to SGLT1 function. At extreme hyperpolarizing and depolarizing potentials, τs approaches plateaus of 42 (1/k32) and 10 ms (1/k23), respectively. The effect of reducing the Na+ concentration can be interpreted as a shift in the τs curve to hyperpolarizing potentials by ∼100 mV. A hump is observed in τs at ∼−50 mV for 100 mM Na+, which appears to be present in the experimental data to a much smaller degree; however, the resolution of the experimental τs curve is insufficient to say so conclusively. As the Na+ concentration is decreased, the peak of τm, which has a bell-curve shape, shifts down by ∼1 ms and to the left by ∼100 mV. This is similar to what is observed experimentally, except that the shift is less pronounced. τf has a bell shape which is unchanged with Na+ concentration. The peak is broad, and may explain why the experimental τf values appear voltage-independent.
FIGURE 9.

Simulated transient currents. Transient currents predicted by the model solution in Table 2 (dashed lines).
FIGURE 10.

Simulated time constants. Using the parameter values in Table 2, τ versus V curves were calculated from a solution to Eq. 1. 100 mM Na+ (solid line); 10 mM Na+ (dashed line). τf curves are identical at 10 and 100 mM Na+ (dotted line).
Boltzmann curves simulated using the parameter values in Table 2 were calculated at 10 and 100 mM Na+ and were found to be similar to those measured experimentally (Fig. 11). Fig. 12 shows amplitude curves predicted by the model solution. The forms of these curves are very similar to those fit to the transient currents. The shift to hyperpolarizing potentials by ∼100 mV as the Na+ concentration is reduced from 100 to 10 mM is preserved, as well as the upward shift with increasing poststep potential.
FIGURE 11.

Experimental and predicted Boltzmann distributions. Experimental Boltzmann distributions (solid circles) were calculated by integrating (from 0 to 150 ms) baseline-adjusted (between t = 145 to 150 ms) transient currents produced from a ramp protocol similar to the one shown in Fig. 3. To increase the signal-to-noise ratio, Boltzmann curves from each oocyte were summed to create the Boltzmann distributions shown here. (A) n = 18 for 100 mM Na+, and (B) n = 4 for 10 mM Na+. Simulated Boltzmann distributions (solid line) were calculated using the parameter values in Table 2 and then scaled to match the amplitude of the experimental curves.
FIGURE 12.

Predicted amplitude trends using the solution in Table 2. The form of the predicted amplitude curves match the experimental ones in Fig. 8. Amplitudes are shown as a function of the prestep potential from −150 to 90 mV and for poststep potentials of −130 (solid), −90 (dashed), −50 (dotted), −10 (dash dot), and 30 mV (dash dot dot).
The parameter values for hSGLT1 are shown in Table 2 for comparison, and are similar to the rSGLT1 values for transitions C2⇔C3 and C3⇔C4, but differ significantly for transition C1⇔C2. This difference may be species-specific. It should be noted that Chen et al. (1996) found a single solution at all Na+ concentrations, with C1⇔C2 representing a single Na+ binding/debinding event.
DISCUSSION
Distinguishing between τf and membrane capacitance
Previous studies of SGLT1 have recognized the existence of a ∼0.5-ms decay and concluded that it was due to capacitive membrane current and therefore not relevant to the activity of the transporter (Parent et al., 1992; Loo et al., 1993; Hazama et al., 1997). However, two observations presented in this article have been used to distinguish a fast rSGLT1 specific decay from the capacitive transient, and are summarized as follows: 1), Capacitive currents are present only during the ramp-up period of the clamp, and therefore, by removing data during this time interval (initial 0.6–1.3 ms), we are able to insure that time constant fits are not due to membrane capacitance; and 2), If the fast decay is capacitive, the Af versus voltage curves in Fig. 8 must be linear—as is clearly not the case.
Although we conclude that it is possible to detect a fast (∼0.5–1 ms) voltage-independent rSGLT1-specific decay with the two-electrode setup, the resolution of the protocol is insufficient to provide any information on the precise form of the time constant versus voltage curves given the size of the error bars relative to the measured values (Fig. 7). Most likely a technique with a faster clamp time, such as the cut-open preparation, will be needed to accomplish this.
rSGLT1 is modeled well by a fast–slow–fast system
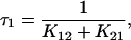
There is significant evidence that rSGLT1, in the absence of glucose, is modeled well as a fast–slow–fast four-state system. By this we mean that the rate constants of transitions C1⇔C2 and C3⇔C4 are much faster (greater) than those of the intermediate transition (C2⇔C3), and we may make certain assumptions which lead to a much simpler mathematical representation of the system than would be for the general case. Furthermore, the time constants of this simplified system may be written as they are in Eq. 6. These expressions for the time constants are convenient because τ1 and τ3 are expressed exclusively in terms of the rate constants of transitions C1⇔C2 and C3⇔C4 respectively, and experimental observations concerning these time constants may be interpreted in terms of the kinetics of the related transitions.
The τ versus V curves for the fast–slow–fast model are very similar to those of the general system (Fig. 13). In addition, amplitude curves derived using the fast–slow–fast model (not shown) are of similar form to those measured experimentally (Fig. 8). Lastly, the fast–slow–fast model was used successfully by Chen et al. (1996) to describe hSGLT1 in the absence of glucose, and the two time constants observed by them have similar voltage- and Na+-dependencies to τs and τf of rSGLT1.
FIGURE 13.

Comparison of time constants predicted by the general (solid line) and fast–slow–fast (dashed line) four-state system using the solution in Table 2. τ versus V curves of the general model were found by solving for the eigenvalues of the system of equations in Eq. 1. Time constants of the fast–slow–fast system were calculated from Eq. 6.
Transitions C2⇔C3 and C3⇔C4 are likely conformational changes of the unloaded carrier
It is noteworthy that both the voltage- and Na+-dependence of the hSGLT1 time constants observed by Chen et al. (1996) closely match the τs and τf seen in the present article for rSGLT1. To elaborate, the fast time constant for hSGLT1 is relatively voltage-independent from −200 to 60 mV, and is within the range of 0.5–0.8 ms, for both 100 and 10 mM Na+. The slow decay for hSGLT1 has the same sigmoidal shape as rSGLT1 (Fig. 7 A), except that hSGLT1 reaches a plateau of ∼10 ms at potentials more hyperpolarizing than ∼−60 mV, compared to ∼42 ms for rSGLT1. In addition, from modeling, Chen et al. (1996) concluded that τf is associated with transition C3⇔C4, as is concluded here for rSGLT1.
Of particular interest, two decay components were observed for zero trans Na+ for hSGLT1, allowing Chen et al. (1996) to attribute both decay components to conformational changes of the unloaded carrier. Assuming the similar time constants in both species correspond to equivalent transitions, it is likely that transitions C2⇔C3 and C3⇔C4 are also conformational changes of the unloaded carrier in rSGLT1.
The complete voltage-independence of transition C2⇔C3, as well as invariance in the kinetic parameters of transitions C2⇔C3 and C3⇔C4 at 10 and 100 mM Na+ (see Table 2), suggests that these transitions are not related to Na+ binding and are likely conformational changes of the unloaded carrier.
A recent study of the Q457C mutant of hSGLT1 labeled with the fluorescent compound tetramethylrhodamine-6-maleimide has shown that, in the absence of glucose, there is a voltage-dependent fluorescent quench which follows a Boltzmann relation with z = 0.4 (Meinild et al., 2002). This fluorescent change was attributed to a conformational change of the unloaded carrier between an inside- and outside-facing conformation. It is noteworthy that the valence of 0.4 reported for the hSGLT1 empty carrier translocation is similar to the combined valence of 0.51 reported here for transitions C2⇔C3 and C3⇔C4 of rSGLT1. This provides further evidence that, in combination, C2⇔C3 and C3⇔C4 may account for empty carrier translocation.
Functional significance of C1⇔C2
The transition C1⇔C2 is likely related to Na+ interacting at the extracellular surface, because 1), the rate constants from the model (k12 and k21) both vary with Na+ concentration (see Table 2); and 2), the position occupied by C1⇔C2 in the model (as the leftmost transition) is commonly assumed to be the Na+ binding/debinding event.
We are, however, hesitant to label C1⇔C2 the Na+ binding/debinding transition because of two anomalies. First, for a Na+ binding/debinding transition, only the Na+ binding rate constant (k21) is dependent on the Na+ concentration; the debinding rate constant (k12) is not. The model solution predicts that both rate constants are Na+-concentration-dependent. Second, assuming that the fast–slow–fast approximation holds, τm may be written in terms of the extracellular Na+ concentration from Eqs. 6a and 2 as,
 |
(7) |
where n is the number of Na+ binding events occurring in C1⇔C2. The general voltage-dependent form of τm is bell-shaped. Increasing the Na+ concentration (for any n ≥ 1) shifts the peak down and toward depolarizing potentials (Fig. 14). From Fig. 7 B at 10 mM Na+, we observe that τm is indeed bell-shaped; however, increasing the Na+ concentration 10-fold (10–100 mM) shifts the peak to depolarizing potentials, and upwards.
FIGURE 14.

Graphical representation of Eq. 7. Theoretical plot of the Na+ concentration and voltage-dependent behavior of the time constant associated with an isolated Na+ binding/debinding transition at high (solid line) and low (dashed line) Na+ concentrations. Note that at extreme hyperpolarizing and depolarizing potentials, τ approaches the reciprocal of one of the exponential terms in the denominator of Eq. 7 (dotted line). As the Na+ concentration is decreased (for any n ≥ 1), one of the exponentials shifts to the left, and the peak of τ shifts up and toward hyperpolarizing potentials.
As a possible explanation of these anomalies, we propose the two five-state models shown in Fig. 15, and suggest that the time constant measured to be τm, as well as the transition modeled by us as C1⇔C2 (Fig. 4), is the combined effect of two transitions—in this case, C0⇔C1⇔C2 in Fig. 15, which are not easily distinguished from one another using the time constant analysis presented in this article. The model in Fig. 15 A proposes a conformational change in the protein after the binding of Na+ (one or two ions) which exposes the sugar-binding domain so that it is accessible to glucose. This model is in agreement with our current understanding of the transporter, in that 1), phloridzin is only able to bind to the transporter in the presence of Na+, and phloridzin competes for the glucose binding domain (Restrepo and George, 1986; Moran et al., 1988; Toggenburger et al., 1982); and 2), a study of the Q457C mutant of hSGLT1 (residue 457 is located in the glucose-binding domain) has demonstrated that access to this site by 2-aminoethyl methanethiosulfonate hydrobromide and tetramethylrhodamine-6-maleimide is restricted in the absence of Na+ (Loo et al., 1998; Meinild et al., 2002), suggesting that a conformational change may occur in the glucose-binding region of the transporter in the presence of extracellular Na+. The model in Fig. 15 B is similar to a classical model of SGLT1 with two Na+ ions binding before glucose. However, instead of the two Na+ ions binding simultaneously, they occur sequentially.
FIGURE 15.

Hypothetical five-state models of rSGLT1 in the absence of glucose. In both models, transitions C2⇔C3 and C3⇔C4 correspond to conformational changes of the unloaded carrier. (A) C1⇔C2 is a single or double Na+ binding/debinding event, and C0⇔C1 is a conformational change in the protein which exposes the sugar-binding domain to glucose. (B) Both C0⇔C1 and C1⇔C2 are single Na+ binding/debinding events.
In summary, three decay components have been identified for rSGLT1. Rate constants for the four-state model in Fig. 4 were found which were able to duplicate the time course of the transients at 10 and 100 mM Na+ as well as time constant, amplitude, and Boltzmann curves. Two of the transitions, C2⇔C3 and C3⇔C4, are believed to be conformational changes of the unloaded carrier, with one of the transitions, C2⇔C3, completely voltage-independent. However, anomalies in the behavior of C1⇔C2 suggests that one of the five-state models in Fig. 15 may be more appropriate. We plan to explore these five-state models further with simulation studies, anticipating that this will require additional Na+-dependent data.
Acknowledgments
The authors gratefully acknowledge P. Backx, S. Huntley, V. Khurtorsky, H. Kunov, R. Reithmeier, and R. Tsushima for helpful discussion.
This work was supported by a grant to M.S. (MT-15267) as part of the Canadian Institutes of Health Research Group in Membrane Biology (MGC-25026).
References
- Chen, X.-Z., M. J. Coady, and J.-Y. Lapointe. 1996. Fast voltage clamp discloses a new component of presteady-state currents from the Na+–glucose cotransporter. Biophys. J. 71:2544–2552. [DOI] [PMC free article] [PubMed] [Google Scholar]
- Costa, A. C. S., J. W. Patrick, and J. A. Dani. 1994. Improved technique for studying ion channels expressed in Xenopus oocytes, including fast superfusion. Biophys. J. 67:395–401. [DOI] [PMC free article] [PubMed] [Google Scholar]
- Glasstone, S., K. J. Laider, and H. Eyring. 1941. The Theory of Rate Processes, 1st Ed. McGraw-Hill Book Company, New York.
- Hazama, A., D. D. F. Loo, and E. M. Wright. 1997. Pre-steady-state currents of the rabbit Na+/glucose cotransporter (SGLT1). J. Membr. Biol. 155:175–186. [DOI] [PubMed] [Google Scholar]
- Hediger, M. A., M. J. Coady, T. S. Ikeda, and E. M. Wright. 1987. Expression cloning and cDNA sequencing of the Na+/glucose cotransporter. Nature. 330:297–381. [DOI] [PubMed] [Google Scholar]
- Lo, B., and M. Silverman. 1998. Cysteine scanning mutagenesis of the segment between putative transmembrane helices IV and V of the high affinity Na+/glucose cotransporter SGLT1. J. Biol. Chem. 273:29341–29351. [DOI] [PubMed] [Google Scholar]
- Loo, D. D. F., A. Hazama, S. Supplisson, E. Turk, and E. M. Wright. 1993. Relaxation kinetics of the Na+/glucose cotransporter. Proc. Natl. Acad. Sci. USA. 90:5767–5771. [DOI] [PMC free article] [PubMed] [Google Scholar]
- Loo, D. D. F., B. A. Hirayama, E. M. Gallardo, J. T. Lam, E. Turk, and E. M. Wright. 1998. Conformational changes couple Na+ and glucose transport. Proc. Natl. Acad. Sci. USA. 95:7789–7794. [DOI] [PMC free article] [PubMed] [Google Scholar]
- Meinild, A.-K., D. D. F. Loo, B. A. Hirayama, E. Gallardo, and E. M. Wright. 2001. Evidence for the involvement of Ala 166 in coupling of Na+ to sugar transport through the human Na+/glucose cotransporter. Biochemistry. 40:11897–11904. [DOI] [PubMed] [Google Scholar]
- Meinild, A.-K., B. A. Hirayama, E. M. Wright, and D. D. F. Loo. 2002. Fluorescence studies of ligand-induced conformational changes of the Na+/glucose cotransporter. Biochemistry. 41:1250–1258. [DOI] [PubMed] [Google Scholar]
- Moran, A., L. J. Davis, and R. J. Turner. 1988. High affinity phlorizin binding to the llc-pk1 cells exhibits a sodium: phlorizin stoichiometry of 2:1. J. Biol. Chem. 263:187–192. [PubMed] [Google Scholar]
- Panayotova-Heiermann, M., D. D. F. Loo, P. M. Lostao, and E. M. Wright. 1994. Sodium/d-Glucose cotransporter charge movements involve polar residues. J. Biol. Chem. 269:21016–21020. [PubMed] [Google Scholar]
- Panayotova-Heiermann, M., D. D. F. Loo, J. T. Lam, and E. M. Wright. 1998. Neutralization of conservative charged transmembrane residues in the Na+/glucose cotransporter SGLT1. Biochemistry. 37:10522–10528. [DOI] [PubMed] [Google Scholar]
- Parent, L., S. Supplisson, D. D. F. Loo, and E. M. Wright. 1992. Electrogenic properties of the cloned Na+/glucose cotransporter. I. Voltage-clamp studies. J. Membr. Biol. 125:49–62. [DOI] [PubMed] [Google Scholar]
- Restrepo, D., and A. K. George. 1986. Phlorizin binding to isolated enterocytes: membrane potential and sodium dependence. J. Membr. Biol. 89:269–280. [DOI] [PubMed] [Google Scholar]
- Taglialatela, M., L. Toro, and E. Stefani. 1992. Novel voltage clamp to record small, fast currents from ion channels expressed in Xenopus oocytes. Biophys. J. 61:78–82. [DOI] [PMC free article] [PubMed] [Google Scholar]
- Toggenburger, G., M. Kessler, and S. Giorgio. 1982. Phlorizin as a probe of the small-intestinal Na+, d-Glucose cotransporter. Biochim. Biophys. Acta. 688:557–571. [DOI] [PubMed] [Google Scholar]