Abstract
Molecular dynamics simulations are performed on two hydrated dipalmitoylphosphatidylcholine bilayer systems: one with pure water and one with added NaCl. Due to the rugged nature of the membrane/electrolyte interface, ion binding to the membrane surface is characterized by the loss of ion hydration. Using this structural characterization, binding of Na+ and Cl− ions to the membrane is observed, although the binding of Cl− is seen to be slightly weaker than that of Na+. Dehydration is seen to occur to a different extent for each type of ion. In addition, the excess binding of Na+ gives rise to a net positive surface charge density just outside the bilayer. The positive density produces a positive electrostatic potential in this region, whereas the system without salt shows an electrostatic potential of zero.
INTRODUCTION
The influence of electrolytic solution on the properties of bilayers has been the subject of a large body of research (Cevc, 1990; McLaughlin, 1989, 1977). This particular topic is of interest because the crucial biological role of bilayers is to provide a barrier that divides electrolytic solutions into different compartments. It is well-known that ion binding affects the stability and structure of bilayers and the way in which proteins bind and insert (Binder and Zschörnig, 2002). Indeed, in many cases, the restructuring of the very large solution-membrane interface can be affected by ion adsorption, giving rise to changes in the surface and dipole potential (Ermakov et al., 2001; Ohki and Kurland, 1981; Papahadjopoulos, 1968). The binding of ions to bilayer modulates the domain formation in membranes composed of lipid mixtures (Huang et al., 1993; Groves et al., 2000; van Dijck et al., 1978; Rappolt et al., 2001; Ross et al., 2001). Ion interaction with the membrane surface is also presumed to be a major driving element of lipid vesicle aggregation and fusion (Ohki et al., 1982; Ohki and Arnold, 2000).
Experimental studies are typically aimed at quantifying intrinsic binding constants for ion-membrane binding and characterizing the membrane surface potential. The most common approach to these ends is the determination of the electrophoretic mobility of lipid vesicles in electrolyte solutions (Cevc, 1990; Eisenberg et al., 1979; McLaughlin, 1989, 1977; Tatulian, 1987). The ζ-potential is then calculated from this mobility using the Helmholtz-Smoluchowski equation, and intrinsic ion binding constants are then found by using the value of the ζ-potential along with the Gouy-Chapman theory and the Langmuir isotherm. Other approaches include infrared spectroscopic methods (Binder and Zschörnig, 2002), nuclear magnetic resonance methods (Macdonald and Seelig, 1988), fluorescent probe methods (Eisenberg et al., 1979), etc. Molecular dynamics simulation of bilayers in electrolyte solution may be able to help in the characterization of these properties. In addition, molecular dynamics may also help to clarify the structural changes that accompany ion interaction with membrane.
The subject of the specific adsorption of ions to the bilayer surface entails many interesting questions. Due to very specific interactions, an ion might bind to particular sites on a lipid headgroup. In the case of a cation, such sites may include the phosphodiester oxygens, or upon deeper penetration, it may bind with the carbonyl group. The forces which give rise to binding can involve interaction with the most polar regions of the headgroup, and can include the effect of the water which hydrates the headgroup (Garidel et al., 2000). For those who study ion binding to lipids, the interest is in knowing exactly where ions bind. If ions form complexes with lipids in the bilayer, how does such a complex look? How many lipids would be involved in such an ion-lipid complex?
Acidic lipids enhance the adsorption of positive ions due to their negative charge (Binder and Zschörnig, 2002; Cevc, 1990; Eisenberg et al., 1979; McLaughlin, 1989). However, studying the binding of such lipids to ions might preclude our observation of specific adsorption of ions to membrane due to simple charge-charge interaction. In the case of Ca2+ ions, specific binding to phosphatidylserine bilayer was found to be independent of the surface charge (Huster et al., 2000) after correcting for differences in the electric surface potential (Binder and Zschörnig, 2002). Thus, one might study the more complex issues of specific adsorption by opting to observe ionic interaction with an uncharged zwitterionic lipid such as dipalmitoylphosphatidylcholine (DPPC). Hence, in this work, we perform molecular dynamics simulations on hydrated DPPC bilayers with and without salt.
METHODS
Molecular dynamics simulations were performed at the North Carolina Supercomputing Center using the GROMACS package (Berendsen et al., 1995; Lindahl et al., 2001). All simulations used a time step of 4 fs. The force field parameters for lipids were based on the work of Berger (Berger et al., 1997). The LINCS algorithm was used to constrain all bonds in the system (Hess et al., 1997). Periodic boundary conditions were applied in all three dimensions. Long-range electrostatics were handled using the SPME algorithm (Essmann et al., 1995). The temperature in all simulations was maintained at 323 K using the Nose-Hoover scheme with a thermostat relaxation time of 0.5 ps. The analysis of subsequent results was performed using a combination of GROMACS analysis utilities and our own code. The system was equilibrated in an NPT ensemble using the Parrinello-Rahman pressure coupling scheme (Nose and Klein, 1983; Parrinello and Rahman, 1981) with a barostat relaxation time of 2.0 ps at a pressure of 1 atm.
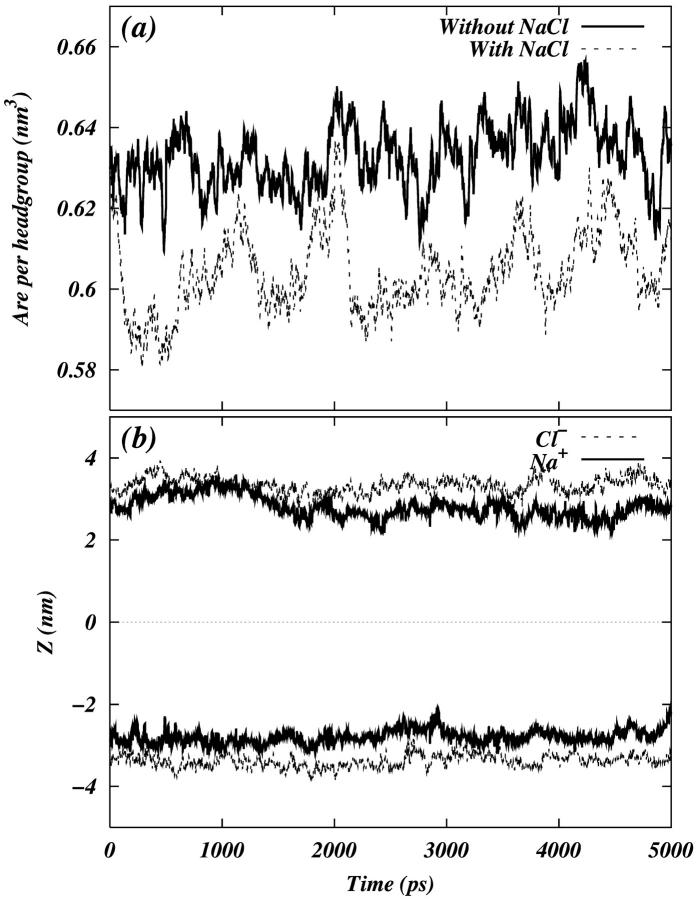
We performed two 10-ns simulations on a solvated phospholipid bilayer containing 128 DPPC molecules. An initial configuration for the systems was taken from Tieleman (Tieleman and Berendsen, 1996). In the first system, the phospholipid molecules were solvated by 6560 SPC water molecules. The second system also contained 22 Na+ ions and 22 Cl− ions (initially randomly distributed in water) in addition to phospholipid and water molecules. The choice in the number of ions was made to avoid effects due to ion-ion correlations while simultaneously performing reasonable statistical averaging. We will refer to the system with salt as the PC-NaCl system and to the system without salt as the pure-PC system. We monitored the volume of the simulation cell and the center of mass of the ions on both sides of the bilayer throughout these simulations. These quantities were stable over the last 5 ns of the simulations (Fig. 1). Hence, analysis was performed over the last 5 ns of both trajectories.
FIGURE 1.
(a) Area per headgroup as a function of time for the last 5 ns of the total 10 ns trajectory. (b) The z-component of the center of mass of the ions as a function of time for each leaflet of the bilayer. The center of the bilayer is denoted by the dotted line at z = 0.
RESULTS AND DISCUSSION
The area per lipid headgroup in the PC-NaCl system was found to be ∼60.5 Å2 while that of the pure-PC system was ∼62.7 Å2. The difference in these values is quite small, but one might conjecture that the binding of ions with headgroups may be responsible for this difference. The difference in the area per headgroup should be reflected by the ordering of the lipid hydrocarbon tails. The tail ordering can be ascertained in nuclear magnetic resonance experiments by measuring deuterium order parameters. The order parameter tensor S is defined as
 |
where θa is the angle made by the ath molecular axis with the bilayer normal and δab is the Kronecker delta function. The order parameter, SCD, can be determined from simulation using the following relation (Egberts and Berendsen, 1988),
 |
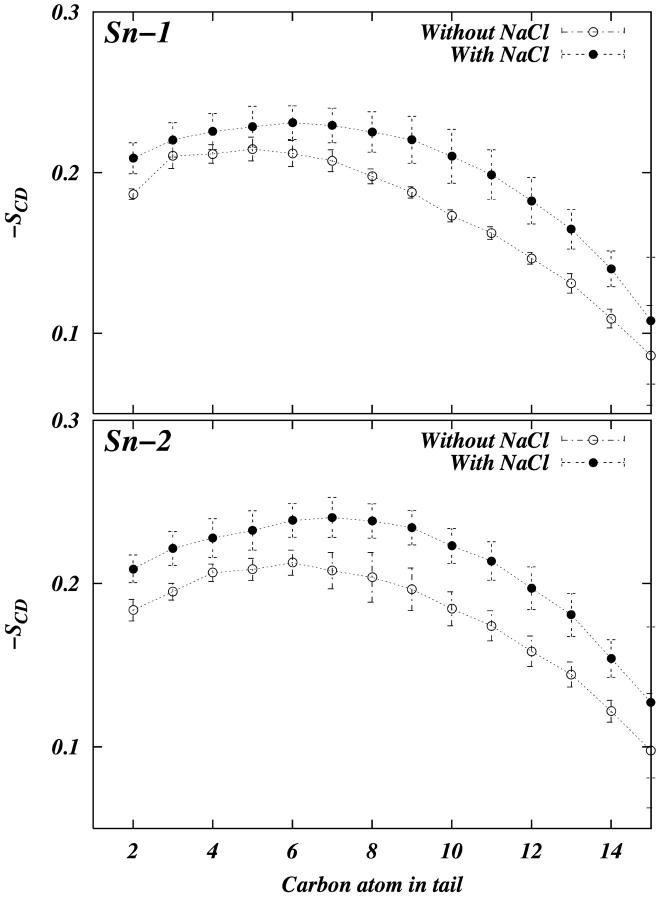
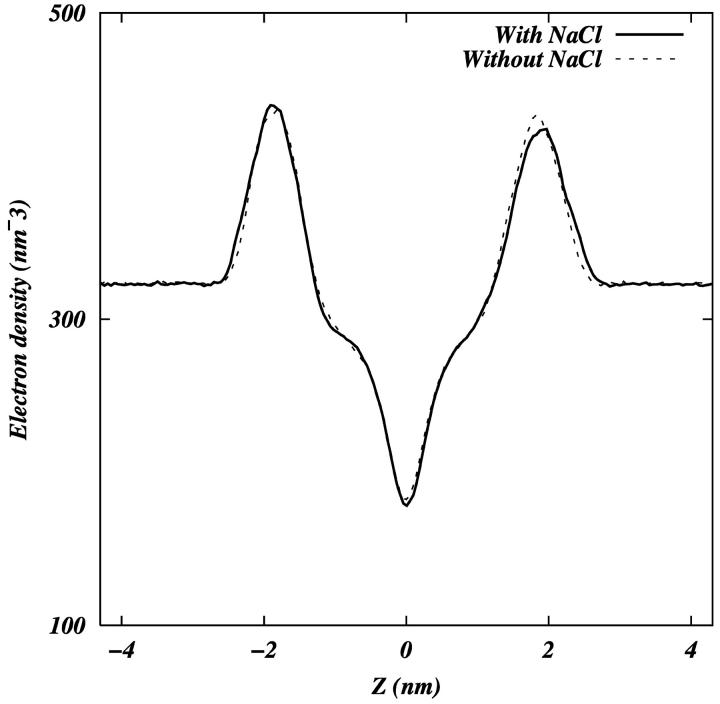
We calculated the order parameter for each of the hydrocarbon tails separately. The deuterium order parameters of the tails in each system are consistent with the difference observed in the area per headgroup (Fig. 2). We observe that the ordering of both Sn-1 and Sn-2 tails is slightly greater in the PC-NaCl system than in the pure-PC system. Fig. 3 shows the electron density of each system as a function of z (z = 0 is taken to be at the center of the bilayer). The density profiles are very similar to each other, but careful observation shows that the peak-to-peak distance in the PC-NaCl system is ∼0.22 nm larger than that of the pure-PC system. This increase in the bilayer thickness is consistent with the increase in the tail order parameters. The experimental observation that ion-lipid interactions stabilize the solid phase of the lipid (Binder and Zschörnig, 2002) is consistent with our finding related to the changes in order parameters and geometry.
FIGURE 2.
The deuterium order parameters for hydrocarbon tails of DPPC. The error bars in the figure are calculated by dividing the 5-ns trajectory into ten 500-ps trajectories.
FIGURE 3.
Electron densities as a function of the z-coordinate in both systems.
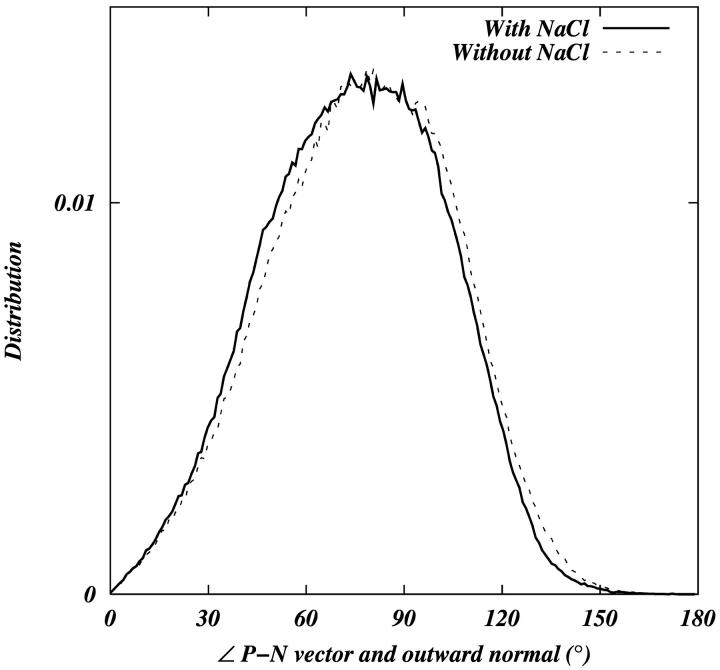
Despite these differences in the tail ordering, we see no significant difference in the orientation of the headgroup with respect to the outwardly directed bilayer normal (Fig. 4). We quantify the orientation of the headgroup in terms of the angle between the phosphorus-nitrogen (P-N) vector and outward bilayer normal. In both cases, the headgroup P-N vector is nearly parallel to the bilayer surface (∼78° with respect to the bilayer normal). Kondo and co-workers (Makino et al., 1991) have proposed a model linking the adsorption of the ions with the change in the orientation of the headgroup. We do not see any significant reorientation of the headgroups upon the addition of salt.
FIGURE 4.
Distribution of the angle between the vector joining the phosphorus and nitrogen in the DPPC headgroup and the outward normal of the bilayer.
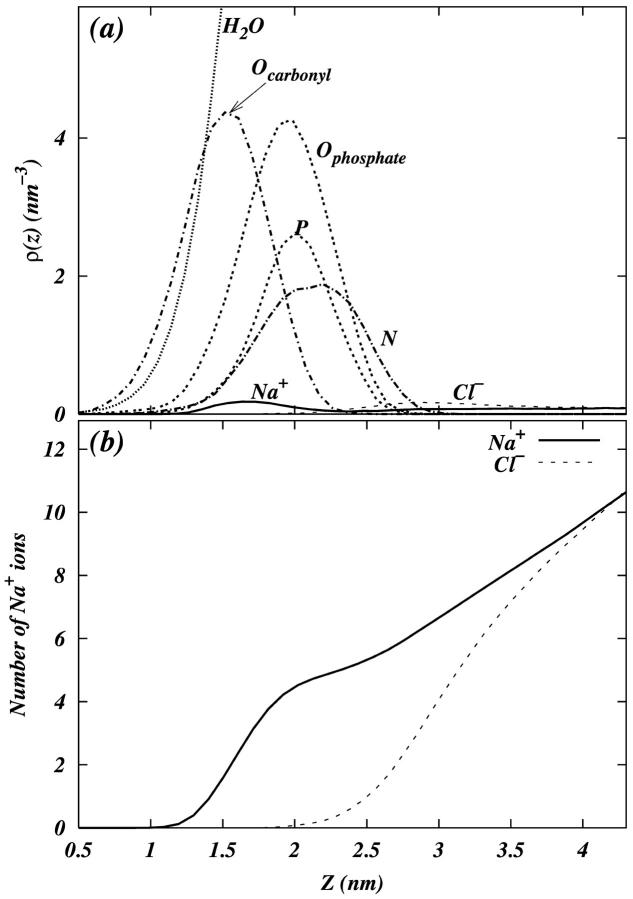
To determine the relative location of the ions with respect to the membrane surface, we plot the number density of various atoms in the system as a function of z (See Fig. 5 a). The density of Na+ shows a peak near the headgroup phosphate density in the overlap region of the phosphate and carbonyl oxygen densities (∼1.75 nm) indicating that Na+ may adsorb to the surface of the bilayer. The Cl− density is enhanced near the nitrogen of the choline group. Fig. 5 b shows the number of Na+ and Cl− ions found between the center of the bilayer and the x-y plane at position z in the system. If the plane is placed at the membrane boundary (∼2.6–2.9 nm from the center of the bilayer), we can see that there are ∼5.5–6.5 Na+ ions and ∼4.0 Cl− ions in the interfacial region.
FIGURE 5.
(a) Densities of various atoms in the system as function of the z-coordinate. Densities are averaged over two leaflets of the bilayer. (b) Number of Na+ and Cl− ions found between the center of the bilayer and the x-y plane at position z in the system.
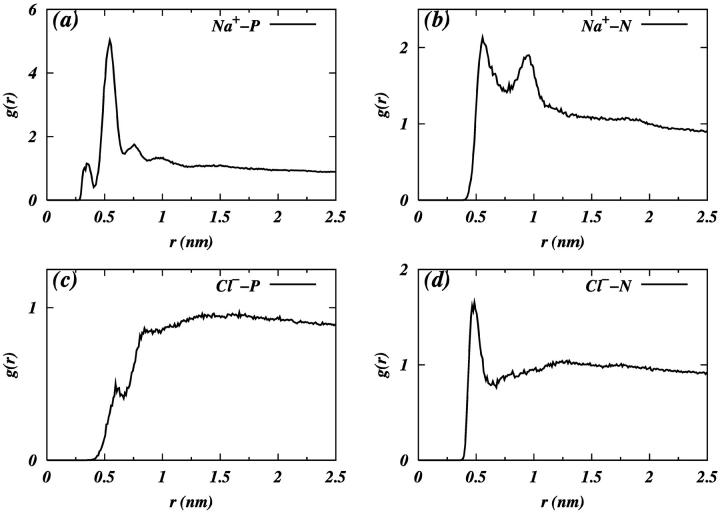
Now that we have observed that ions penetrate the interfacial region, we are interested in the particular way in which they are coordinated with the headgroup components. Fig. 6 shows the pair radial distribution functions (RDF) between ions and the phosphorous and nitrogen atoms of the headgroup. The RDF in Fig. 6, a and b, shows that the first coordination shell of phosphorous is within 0.65 nm of Na+. The first coordination shell of nitrogen is seen to be within 0.75 nm of Na+ (Fig. 6 b). The average number of phosphorous and nitrogen atoms within the first coordination shell of adsorbed Na+ is ∼2.1 and ∼1.4, respectively. These data suggest that Na+ ions are closer to phosphate group, as expected, and that there are two lipids coordinated with one Na+ ion. Fig. 6, c and d show that the Cl− does not have much coordination with phosphorous, but does have some coordination with the choline nitrogen.
FIGURE 6.
RDF of (a) Na+ with phosphorus, (b) Na+ with nitrogen, (c) Cl− with phosphorus, and (d) Cl− with nitrogen.
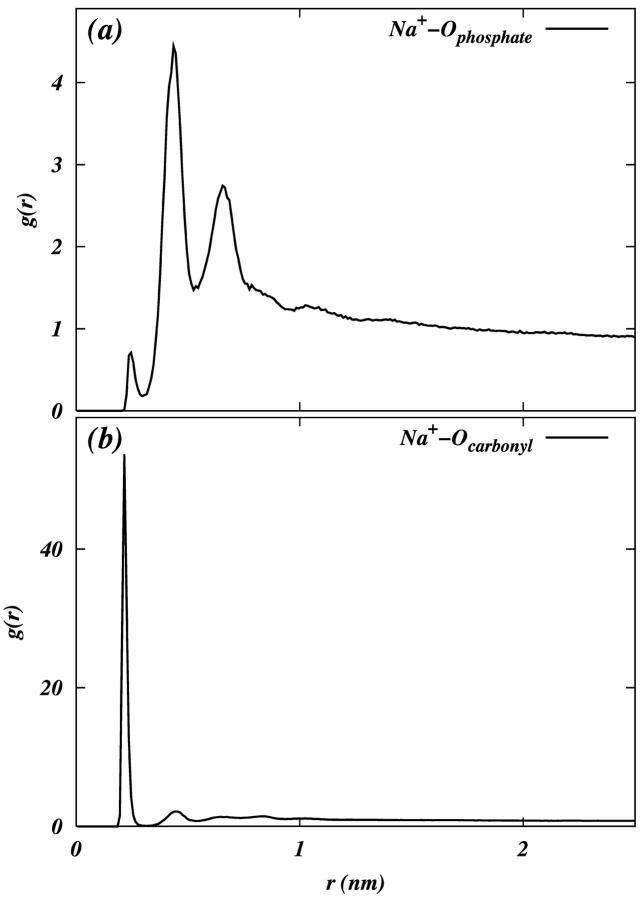
It is known that metal cations form complexes with anionic phosphodiester groups and carbonyl oxygens in the glycerol backbone of phosphocholine lipids (Binder and Zschörnig, 2002). Therefore, we studied the coordination of the phosphate and carbonyl oxygens with adsorbed Na+ ions. Fig. 7, a and b, show the RDF of phosphate-oxygen and carbonyl-oxygen around Na+, respectively. We see that the first coordination shell of carbonyl-oxygen is within 0.3 nm (coordination number ∼1.2) of Na+. There are two chemically equivalent phosphate-oxygens which give rise to an RDF with multiple peaks. From Fig. 7 a we see that the first peak in the RDF is at ∼0.215 nm, which corresponds to a position of Na+ near one of the two phosphate-oxygens. The second peak, which is at ∼0.435 nm, corresponds to a situation where Na+ is coordinated with both phosphate-oxygens. It is clear that a coordination with two phosphate-oxygens is preferred over single coordination. Hence, we consider the first coordination shell of phosphate-oxygen around Na+ to contain the first two peaks in the RDF. This definition of the first coordination shell gives a coordination number of ∼2.65. The coordinations of Na+ with headgroup oxygens (both carbonyl and phosphate) are shown clearly in the illustrations of Fig. 8. These coordinations or salt bridges may be responsible for the reduction in the area per lipid headgroup in the PC-NaCl system along with the concurrent increase in the tail order parameters (Fig. 2).
FIGURE 7.
RDF of (a) Na+ with phosphate oxygens, and (b) Na+ with carbonyl oxygens.
FIGURE 8.
Snapshot pictures showing the ion-lipid coordination.
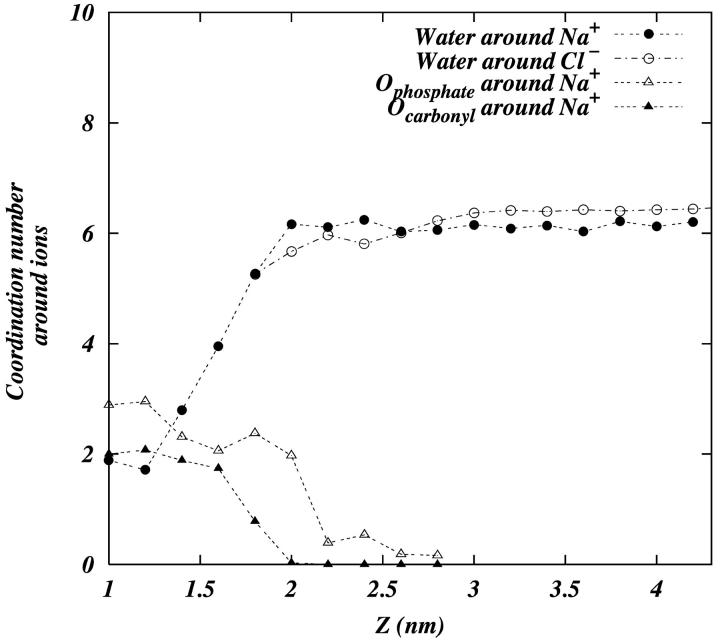
A hydrophilic ion which adsorbs effectively to the surface of the bilayer must necessarily shed its water. Fig. 9 shows how Na+ ions lose their water as they are adsorbed. By dividing the simulation cell into 0.2-nm slabs along the z-axis and calculating the average coordination number of water with an ion in the slab, we show the average coordination number of water with Na+ and Cl− ions as a function of z (z = 0 is taken to be the bilayer center). It can be seen that as a sodium ion adsorbs to the bilayer surface it loses 3.5–4 water molecules from its first coordination shell. On the other hand, Cl− ions do not lose their water to such a large extent (∼1 molecule of water), and can be considered loosely adsorbed. We have also plotted the coordination of carbonyl-oxygen and phosphate-oxygen around Na+ as a function of z in the same figure. We see that as Na+ begins to lose its water at ∼2 nm, it begins to coordinate with the phosphate and carbonyl oxygens.
FIGURE 9.
The coordination number of various atoms around the ions. Water oxygen around Na+ (•), water oxygen around Cl− (○), phosphate oxygens around Na+ (▵), and carbonyl oxygens around Na+ (▴).
Tatulian has reported the binding constant, K, of various alkaline earth metal cations and some anions with phosphatidylcholine vesicles (Tatulian, 1987). To link our observation of ion penetration of the interfacial region to binding events, we need a reasonable criterion to discern that an ion is bound. One of the simplest structural changes that indicates the binding of an ion is its dehydration. Hence, if an ion loses one or more of the water molecules from its coordination shell, we consider it to be bound to the membrane surface to some extent. Ideally, one would expect the loss of half of the water from the first coordination shell in the case of a closely bound ion on a flat surface. However, since the membrane surface is rugged and porous, we consider the loss of one or more water molecules from an ion's first hydration shell to be evidence of its binding. Fig. 9 shows that Na+ ions in the range of 1.4–1.8 nm from the center of the bilayer have 1–3 fewer waters (out of ∼6) in their coordination shell. We consider that only these interfacial ions may be bound to the surface. With this criterion and Fig. 5 b, we see that ∼0.9–3.7 ions are bound to the surface. This range in the number of bound ions gives rise to an intrinsic binding constant KNa+ of ∼0.15–0.61 M−1. (The intrinsic binding constant is taken to be  where C is the concentration of ions at the membrane surface—in our case, ∼0.1 M—and α is the fraction [moles of bound ion]/[moles of lipid on the surface]; see MacDonald and Seelig, 1988. The number of lipids on the surface of a bilayer leaflet in the case of our simulation is 64.) The experimentally observed binding constant of Na+ to phosphatidylcholine is 0.15 ± 0.10 M−1 (Tatulian, 1987). Following the same logic (using Fig. 9, and Fig. 5 b) we see, at most, one Cl− is bound to the membrane surface. This gives a binding constant KCl− of ∼0.16 M−1. The corresponding experimental value is 0.2 ± 0.1 M−1 (Tatulian, 1987).
We calculated the electrostatic potential as a function of the bilayer normal (z) by twice integrating the charge density along z as follows:
 |
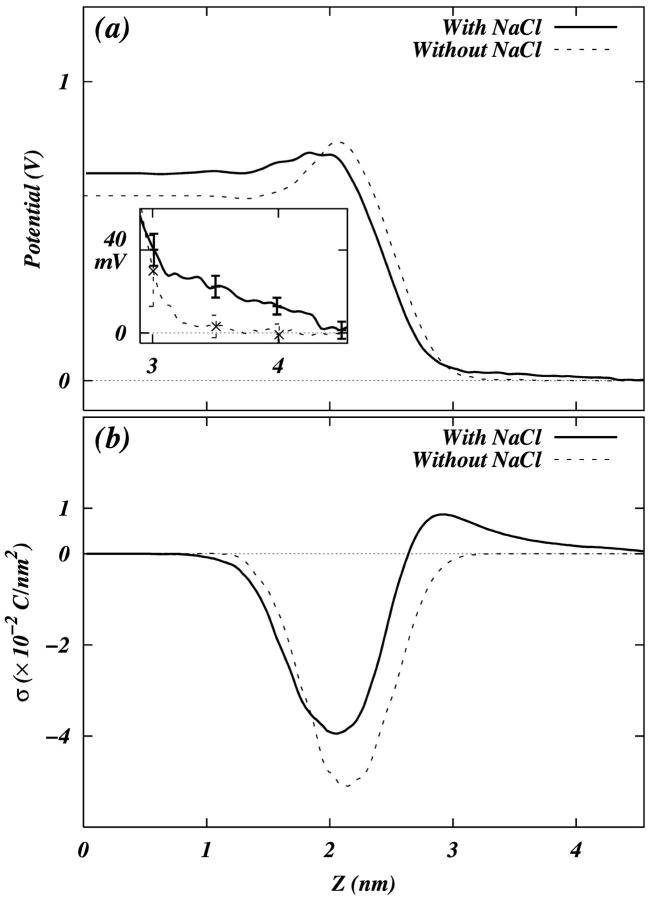
where the point z0 is in the bulk water, E0 is the permittivity of vacuum, and the ρ is the charge density calculated by dividing the whole box into slabs parallel to the x-y plane and counting the number of charges in each slab. We chose the zero of the potential at z0. Since both leaflets of the bilayer are equivalent, we averaged the contributions from the two leaflets in the calculations. Fig. 10 a shows the potential profile from the center of the bilayer to the bulk water for both systems. We see that the PC-NaCl system shows a positive potential (∼25 mV) with respect to the bulk water just outside the bilayer (>∼3 nm), whereas the potential in the pure-PC system remains ∼0. We attribute this positive potential to the adsorption of sodium ions to the surface of the membrane. We calculated the surface charge density as a function of z using the following relation,
 |
where z = 0 is at the center of the bilayer, and  is the charge density of the system excluding water. Fig. 10 b shows that after ∼2.65 nm from the center of the bilayer, the surface charge density becomes positive due to the adsorption of excess sodium ions in the PC-NaCl system. Note that the surface charge density in the pure-PC system is never positive. The observation of positive charge density and of a small positive potential in a region close to the boundary of the bilayer and water is consistent with the sign and the value of the ζ-potential measured in experiments with Na+ cations (Makino et al., 1991). The experimental results related to ζ-potential are often analyzed with the help of the simple Gouy-Chapman theory. We attempted to fit a potential profile from Gouy-Chapman theory to the results of our simulations. Since most of the potential we observe is dipolar in origin, we computed the difference in potential profiles obtained from our simulations with and without salt to remove the effect of the dipolar potential. Agreement with the Gouy-Chapman theory would then be ascertained by simultaneously fitting the difference potential profile and the ion distributions from our simulations to those predicted by Gouy-Chapman theory. However, these fits were found to be unsatisfactory. It is most likely that the small number of ions in the bulk water present in our simulation do not provide enough sampling to obtain representative ion distributions. Thus a proper fit cannot be performed. In addition, to perform the fit, one must also resolve an issue related to the location of a shear plane, which is not completely clear when the interface is broad. Nevertheless, we believe that a simulation with more ions may be helpful to compare the electrostatics from simulations with the results from Gouy-Chapman theory.
FIGURE 10.
(a) Total electrostatic potential profile of the system. The quantities are averaged over both leaflets of the bilayer. The error bars, inset, are calculated by dividing the 5-ns trajectory into five 1-ns trajectories. (b) Surface charge density σ as a function of the z-coordinate.
SUMMARY
The importance of membrane-ion interaction has spurred us to simulate two hydrated DPPC bilayer systems (one with NaCl and one without). Our results show that some of the Na+ ions are bound closely to the bilayer surface whereas some of the Cl− ions are comparatively weakly bound. The binding of Na+ in the PC-NaCl system leads to slightly higher tail ordering than in the pure-PC system. A concurrent decrease, although slight, in the area per headgroup is also observed upon the addition of salt.
Distinct complexes are seen to be formed between DPPC headgroups and ions. Our simulations show that roughly two lipids are bound to Na+ in the headgroup region. Upon binding to the headgroup region, an Na+ ion will lose much of its coordinated water. It will then come to be closely coordinated with the phosphate and carbonyl portions of the headgroup. We see that Cl− exhibits a small coordination with N(CH3)+3 of the headgroup, and remains weakly bound.
With ions bound, we see a slightly positive potential (∼25 mV) just outside the membrane as compared to our pure-PC system. Since the interfacial region of our system is so large, the meaning of the phrase “just outside the membrane” may seem vague. Binder and Zschörnig refer to the region of membrane penetrated by ions as an interphase rather than an interface (Binder and Zschörnig, 2002). Since both the number (Fig. 5) and electron (Fig. 3) densities of the system show a significant drop ∼0.26–0.29 nm, we can take any point in the range ∼0.29–0.32 nm to mean just outside the bilayer. Kondo and co-workers have also seen a positive ζ-potential in experimental systems of PC bilayer in electrolyte solution (Makino et al., 1991). Our inability to fit the electrostatic potential and ion densities to the Gouy-Chapman model indicates that there may not be enough ions in the bulk to obtain good sampling.
The width of the bilayer/electrolyte interphase is indicative of the rugged nature of the membrane surface. This provides for difficulty in structurally distinguishing between a bound ion and a free ion in the interface region. The correlation of the loss of water from the ion hydration shell with the binding of the ion makes for a reasonable way to structurally discriminate between these ions. The calculated ratio of the intrinsic binding constant of Na+ to that of Cl− membrane is somewhat higher than the experimental value (Tatulian, 1987; Berg et al., 1997). It is possible that changes to the partial charges and force field parameters of the headgroup may improve the agreement.
Although we observe binding of Na+ to membrane, and ion dehydration upon so doing, the hydration of the membrane headgroups is seen to remain relatively stable. This is consistent with the weak “kosmotropic” nature of Na+ ions (Macdonald and Seelig, 1988). In general, the character of ion adsorption to the bilayer surface depends on the relative strength of ion-water, water-water, ion-headgroup, and water-headgroup interactions. A strong effect on the behavior of bilayers is observed in experiments when aqueous solutions contain strong “kosmotropic” ions such as Ca2+ and Zn2+. Complex rearrangement in the bilayer headgroup region is expected in these cases, and molecular details of such rearrangement are the subject of our future investigations.
Acknowledgments
Computational support from the North Carolina Supercomputing Center, Raleigh-Durham, North Carolina, is gratefully acknowledged. We appreciate our conversation with J. Sachs and T. Woolf about their preliminary results obtained from simulations of NaCl next to POPC bilayers. We also thank M.K. Jain for helpful discussion.
This work was supported by the National Science Foundation under grant MCB0077499. It was also supported, in part, by the Molecular and Cellular Biophysics Program at the University of North Carolina at Chapel Hill under the United States Public Health Service training grant T32 GM08570.
References
- Berendsen, H., D. van der Spoel, and R. van Drunen. 1995. GROMACS: a message-passing parallel molecular dynamics implementation. Comp. Phys. Comm. 91:43–56. [Google Scholar]
- Berg, O. G., J. Rogers, B-Z. Yu, J. Yao, L. S. Romsted, and M. K. Jain. 1997. Thermodynamic and kinetic basis of interfacial activation: resolution of binding and allosteric effects on pancreatic phospholipase A2 at zwitterionic interfaces. Biochem. 36:14512–14530. [DOI] [PubMed] [Google Scholar]
- Berger, O., O. Edholm, and F. Jahnig. 1997. Molecular dynamics simulations of a fluid bilayer of dipalmitoylphosphatidylcholine at full hydration, constant pressure, and constant temperature. Biophys. J. 72:2002–2013. [DOI] [PMC free article] [PubMed] [Google Scholar]
- Binder, H., and O. Zschörnig. 2002. The effect of metal cations on the phase behavior and hydration characteristics of phospholipid membranes. Chem. Phys. Lipids. 115:39–61. [DOI] [PubMed] [Google Scholar]
- Cevc, G. 1990. Membrane electrostatics. Biochim. Biophys. Acta. 1031:311–382. [DOI] [PubMed] [Google Scholar]
- Egberts, E., and H. J. C. Berendsen. 1988. Molecular dynamics simulation of a smectic liquid crystal with atomic detail. J. Chem. Phys. 89:3718–3732. [Google Scholar]
- Eisenberg, M., T. Gresalfi, T. Riccio, and S. McLaughlin. 1979. Adsorption of monovalent cations to bilayer membranes containing negative phospholipids. Biochemistry. 18:5213–5223. [DOI] [PubMed] [Google Scholar]
- Ermakov, Y. A., A. Z. Averbakh, A. I. Yusipovich, and S. Sukharev. 2001. Dipole potential indicate restructuring of the membrane interface induced by Gadolinium and Beryllium ions. Biophys. J. 80:1851–1862. [DOI] [PMC free article] [PubMed] [Google Scholar]
- Essmann, U., L. Perera, M. L. Berkowitz, T. Darden, H. Lee, and L. G. Pedersen. 1995. A smooth particle mesh Ewald method. J. Chem. Phys. 103:8577–8593. [Google Scholar]
- Garidel, P., A. Blume, and W. Hübner. 2000. A Fourier transform infrared spectroscopic study of the interaction of alkaline earth cations with the negatively charged phospholipid 1,2-dimyristoyl-sn-glycero-3-phosphoglycerol. Biochim. Biophys. Acta. 1466:245–259. [DOI] [PubMed] [Google Scholar]
- Groves, J. T., S. G. Boxer, and H. M. McConnell. 2000. Lateral reorganization of fluid lipid membranes in response to the electric field produced by a buried charge. J. Phys. Chem. 104:11409–11415. [Google Scholar]
- Hess, B., H. Bekker, H. J. C. Berendsen, and J. G. E. M. Fraaige. 1997. LINCS: a linear constraint solver for molecular simulations. J. Comp. Chem. 18:1463–1472. [Google Scholar]
- Huang, J., J. E. Swanson, A. R. G. Dibble, A. K. Hinderliter, and G. W. Feigenson. 1993. Nonideal mixing of phosphatidylserine and phosphatidylcholine in fluid lamellar phase. Biophys. J. 64:413–425. [DOI] [PMC free article] [PubMed] [Google Scholar]
- Huster, D., K. Arnold, and K. Gawrisch. 2000. Strength of Ca2+-binding to retinal lipid membranes: consequences for lipid organization. Biophys. J. 78:3011–3018. [DOI] [PMC free article] [PubMed] [Google Scholar]
- Lindahl, E., B. Hess, and D. van der Spoel. 2001. GROMACS 3.0: a package for molecular simulation and trajectory analysis. J. Mol. Mod. 7:306–317. [Google Scholar]
- Macdonald, P. M., and J. Seelig. 1988. Anion binding to neutral and positively charged lipid membranes. Biochemistry. 27:6769–6775. [DOI] [PubMed] [Google Scholar]
- Makino, K., T. Yamada, M. Kimura, T. Oka, H. Ohshima, and T. Kondo. 1991. Temperature- and ionic strength-induced conformational changes in the lipid head group region of liposomes as suggested by ζ-potential data. Biophys. Chem. 41:175–183. [DOI] [PubMed] [Google Scholar]
- McLaughlin, S. 1977. Membrane potentials at membrane-solution interfaces. Curr. Topics Membr. Trans. 9:71–144. [Google Scholar]
- McLaughlin, S. 1989. The electrostatic properties of membranes. Annu. Rev. Biophys. Biophys. Chem. 18:113–136. [DOI] [PubMed] [Google Scholar]
- Nose, S., and M. L. Klein. 1983. Constant pressure molecular dynamics for molecular systems. Mol. Phys. 50:1055–1076. [Google Scholar]
- Ohki, S., and K. Arnold. 2000. A mechanism for ion-induced lipid vesicle fusion. Coll. Surf. B Biointer. 18:83–97. [Google Scholar]
- Ohki, S., N. Düzgüneş, and K. Leonards. 1982. Phospholipid vesicle aggregation: effect of monovalent and divalent ions. Biochemistry. 21:2127–2133. [DOI] [PubMed] [Google Scholar]
- Ohki, S., and R. Kurland. 1981. Surface potential of phosphatidylserine monolayers. II. Divalent and monovalent ion binding. Biochim. Biophys. Acta. 645:170–176. [DOI] [PubMed] [Google Scholar]
- Papahadjopoulos, D. 1968. Surface properties of acidic phospholipids: interaction of monolayers and hydrated liquid crystals with uni- and bi-valent metal ions. Biochim. Biophys. Acta. 163:240–254. [DOI] [PubMed] [Google Scholar]
- Parrinello, M., and A. Rahman. 1981. Polymorphic transitions in single crystals: a new molecular dynamics method. J. Appl. Phys. 52:7182–7190. [Google Scholar]
- Rappolt, M., G. Pabst, H. Amenitsch, and P. Laggner. 2001. Salt-induced phase separation in the liquid crystalline phase of phosphatidylcholine. Coll. Surf. A Physiochem. Eng. Aspects. 183–185:171–181. [Google Scholar]
- Ross, M., C. Steinem, H.-J. Galla, and A. Janshoff. 2001. Visualization of chemical and physical properties of calcium–induced domains in DPPC/DPPS Langmuir-Blodgett layers. Langmuir. 17:2437–2445. [Google Scholar]
- Tatulian, S. A. 1987. Binding of alkaline-earth metal cations and some anions to phosphatidylcholine liposomes. Eur. J. Biochem. 170:413–420. [DOI] [PubMed] [Google Scholar]
- Tieleman, D. P., and H. J. C. Berendsen. 1996. Molecular dynamics simulations of fully hydrated DPPC with different macroscopic boundary conditions and parameters. J. Chem. Phys. 105:4871–4880. [Google Scholar]
- van Dijck, P. W. M., B. De Kruijff, A. J. Verkleij, and L. L. M. van Deenen. 1978. Comparative studies on the effects of pH and Ca2+ on bilayers of various negatively charged phospholipids and their mixtures with phosphatidylcholine. Biochim. Biophys. Acta. 512:84–96. [DOI] [PubMed] [Google Scholar]


