Abstract
In this article we studied, by nuclear magnetic resonance relaxation measurements, the disassembly of a virus particle—the MS2 bacteriophage. MS2 is one of the single-stranded RNA bacteriophages that infect Escherichia coli. At pH 4.5, the phage turns to a metastable state, as is indicated by an increase in the observed nuclear magnetic resonance signal intensity upon decreasing the pH from 7.0 to 4.5. Steady-state fluorescence and circular dichroism spectra at pH 4.5 show that the difference in conformation and secondary structure is not pronounced if compared with the phage at pH 7.0. At pH 4.5, two-dimensional 15N-1H heteronuclear multiple quantum coherence (HMQC) spectrum shows ∼40 crosspeaks, corresponding to the most mobile residues of MS2 coat protein at pH 4.5. The 15N linewidth is ∼30 Hz, which is consistent with an intermediate with a rotational relaxation time of 100 ns. The average spin lattice relaxation time (T1) of the mobile residues was measured at different temperatures, clearly distinguishing between the dimer and the equilibrium intermediate. The results show, for the first time, the presence of intermediates in the process of dissociation of the MS2 bacteriophage.
INTRODUCTION
High-resolution solution nuclear magnetic resonance (NMR) is a powerful technique to study protein structure and dynamics. Large protein oligomers, however, are difficult to study by NMR due to the low tumbling rates and consequently, high transverse relaxation rates and thus, broad lines. On the other hand, flexible regions in such oligomers are frequently present and can be used to obtain structural information. The measurements of relaxation times can be used to study the dynamics of flexible regions and correlate them with relevant biological events (Lipari and Szabo, 1982; Clore et al., 1990a,b; Wagner et al., 1993; Akke and Palmer, 1996; Mandel et al., 1996; Almeida et al., 1997a,b). Protein dynamics information can be obtained from the interpretation of the 15N longitudinal (T1) and transverse (T2) relaxation times and 15N-1H heteronuclear nuclear Overhauser effect (NOE) (Clore et al., 1990a; Berglund et al., 1992; Stone et al., 1992; Wagner, 1993). These parameters depend on the hydrodynamic properties of the molecules in solution. From the construction of a hydrodynamic model that describes both the global and internal protein motions (Lipari and Szabo, 1982; Clore et al., 1990a,b), we can get physical insights of how proteins behave in solution.
MS2 is an icosahedral RNA bacteriophage with triangulation number of T = 3 whose capsid is formed by 180 copies of the coat protein. The crystallographic structure is known at 2.8-Å resolution (Valegard et al., 1990; Golmohammadi et al., 1993). The coat protein (129 residues, 13 kDa) is folded as seven antiparallel β-strands and two helices. Each face of the icosahedron is formed by trimers of coat protein. The virus shell has one copy of an additional protein, A, associated with it (Valegard et al., 1990; Golmohammadi et al., 1993).
Knowledge of the properties and function of the bacteriophage capsid shell is necessary to describe events associated with cell entry, release of the genetic material for virus replication, and assembly of the new particles. In small RNA bacteriophages the loop between the β-strands denoted F and G, known as FG-loop, makes important contacts for virus assembly (Ni et al., 1995; Stonehouse et al., 1996; Axblom et al., 1998). The only conformational difference between the subunits occurs in the FG-loop. In capsids the FG-loop is found in two different conformations differing in the contacts between subunits (Stonehouse et al., 1996). It is also known that mutations in this loop decrease the capsid's stability when compared with wild-type (Stonehouse et al., 1996; Axblom et al., 1998; Peabody and Ely, 1992). Several random mutagenesis studies as well as site-directed mutations corroborate the fact that FG-loop is fairly dynamic but partially structured as a β-hairpin (Valegard et al., 1990; Golmohammadi et al., 1993).
Mechanisms of virus assembly vary greatly depending on capsid complexity and nucleic acid type. For some viruses (e.g., P22) assembly starts with the formation of smaller units of the capsid (Johnson and Chiu, 2000; Phelps et al., 2000). The association of coat protein in assembly intermediates helps in the formation of asymmetric contacts that are important for capsid structure. For MS2, no intermediates have been found, although it seems clear that the dimer is the basic unit of coat protein folding and the basic building block of the capsid. Structural studies of assembly intermediates are complicated because of their metastable nature (Liljas, 1999; Johnson and Chiu, 2000).
In the present work, we developed a strategy to probe the properties of MS2 bacteriophage particle in solution using NMR spectroscopy. The measurements of the 15N relaxation parameters enabled us to get insights into the dynamics of the intermediates formed during the disassembly process of the phage capsid induced by a shift to low pH. We could then estimate the internal correlation time and the order parameter for motion of the most flexible regions and get information about the association/dissociation equilibrium. Our results allowed us to identify an intermediate in virus disassembly elicited by decrease in pH.
MATERIAL AND METHODS
Phage propagation
Escherichia coli strain A/λ was propagated to midlog phase (optical density ∼1.0 at 600 nm) in minimum M9 media supplemented with thiamine (1 mg per liter). The media contained 15NH4Cl as the only nitrogen source and glucose as the only carbon source. Five hours after inoculation with the virus, the cells were submitted to five bursts of sonication on ice (1 min sonicating and 1 min resting). The cell debris was centrifuged at 7000 g and discarded. The supernatant was precipitated overnight with ammonium sulfate at 50% saturation. The pellet was solubilized in the minimum amount of water possible and dialyzed against 5 mM phosphate buffer at pH 7.0. Afterwards the virus was subject to a 20–50% sucrose gradient for 14 h at 32,000 g. SDS-PAGE (Laemmli, 1970) of the purified phage yielded a single band on an overloaded gel.
Virus-like particle (VLP) preparation
The E. coli BL21(DE3) cell strain containing the plasmid pETCT (containing the gene encoding the wild-type coat protein) was propagated until midlog phase at 37°C. Protein expression was induced with 1 mM IPTG and after 2 h, the cells were lysed by sonication. The virus-like particle (VLP) was then precipitated with ammonium sulfate followed by a purification step in a sucrose gradient (as described for the purification of MS2 phage).
Sample preparation
The obtained phage or VLP was extensively dialyzed against water, lyophilized, and dissolved in 5 mM sodium phosphate buffer at pH 7.0 or pH 4.5 (for NMR measurements, the sample buffer contained 90% H2O e 10% D2O). The final concentration of phage or VLP in the sample was ∼500 μg/mL. The protein concentration was measured using Lowry's method (Lowry et al., 1951).
Fluorescence spectroscopy measurements
Fluorescence spectra were performed on an ISS K2 spectrofluorometer (ISS, Champaign, IL). The tryptophan residues were excited at 280 nm and emission was observed from 305 to 370 nm. Experiments were performed at room temperature in 5 mM phosphate buffer at pH 7.0 or pH 4.5.
Far-UV circular dichroism
The circular dichroism measurements were performed in a spectropolarimeter Jasco-715 1505 model (Jasco, Tokyo, Japan), using a 0.1-cm pathlength quartz cuvette. Spectra were the average of two scans from 200 to 270 nm, and the buffer baseline was subtracted.
NMR spectroscopy
NMR spectra were obtained with Bruker DRX 600 MHz and Bruker DRX 400 MHz (Bruker, Ettlingen, Germany). A triple resonance inverse detection probe (15N, 13C, and 1H) was used at 600 MHz and a multinuclear broadband inverse detection probe was used at 400 MHz.
Relaxation measurements
T1av relaxation was obtained using one-dimensional pulse sequence described by Nirmala and Wagner (1988). In this pulse sequence, a distortionless enhancement by polarization transfer (DEPT) magnetization transfer is used instead of insensitive nuclei enhanced by polarization transfer (INEPT). By using this pulse sequence the signal-to-noise ratio was improved. The pulse sequence presents a T1 relaxation time period. A series of experiment accumulation of 1024–3096 transients was performed. Each of them refer to a T1 relaxation time period of 20 ms–4 s. The obtained one-dimensional spectra were then integrated using XWINNMR software. The normalized integral of the amide spectral region was plotted against T1 time period. T1av is the result of curve-fitting this plot as a monoexponential decay.
Simulations of the relaxation parameters
The equations used for simulations of T1 and T2 are the following. Dipolar and chemical shift anisotropy relaxation mechanisms were taken into account for the simulations. (For a detailed description of these equations, see Lipari and Szabo, 1982.)
 |
(1) |
 |
(2) |
where d2 accounts for the dipolar contribution for the relaxation, J(ω) are the spectral density functions as described below, γa and γx are the magnetogyric ratios of the nuclei a and x, h is the Planck constant, rax is the distance between the two nuclei (1.02 Å for the N-H bonds), c2 accounts for the chemical shift anisotropy contribution, Bo is the main magnetic field, and Δσ is the difference between the parallel and perpendicular chemical shift anisotropy tensors (−160 ppm for protein backbone amide 15N).
We have used spectral density functions described by Lipari and Szabo (1982) and by Clore and co-workers (Clore et al., 1990a,b).
Rigid sphere:
 |
(3) |
One internal motion (Lipari and Szabo, 1982):
 |
(4) |
Two internal motions (Clore et al., 1990a,b):
 |
(5) |
J(ω) are the spectral density functions, τm is the overall rotational correlation time for a spherical particle, and τf and τs are the fast and slow correlation times that describe the internal N-H motion in Eq. 4; τe is the correlation time that describes the internal N-H motion in Eq. 3. S is the N-H vector order parameter. Sf and Ss stand for the fast and slow internal motions.
RESULTS
NMR of the intact virus particle
MS2 bacteriophage is known to be stable at pH 7.0 and to become less stable as the pH is decreased (Sugiyama et al., 1967; DaPoian et al., 1993; Lago et al., 2001). At low concentration MS2 dissociates to dimers (Lago et al., 2001), whereas other viruses shows intermediates in the dissociation process (Phelps et al., 2000). Similar pH sensitivity has been observed for other icosahedral viruses (van Vlijmen et al., 1998) and has been implicated in cell entry, endocytosis, and release of RNA (Phelps et al., 2000). The conformational changes important for virus assembly/disassembly and the nature of intermediates formed during these processes are still unknown (Liljas, 1999; Phelps et al., 2000; Lago et al., 2001).
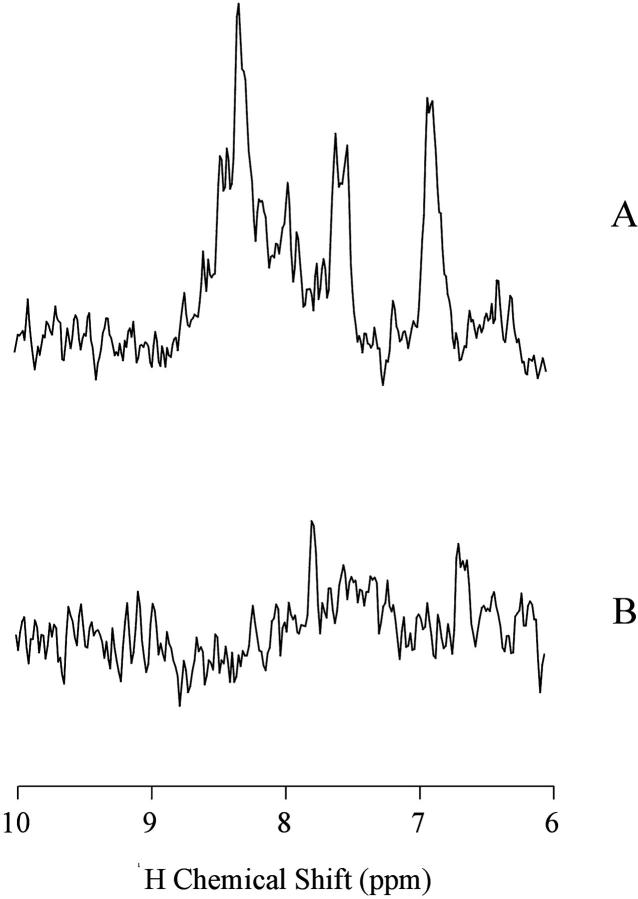
The MS2 bacteriophage has a hydrodynamic radius of 130 Å (DaPoian et al., 1993). When tumbling as a rigid sphere, no NMR signal will be detected from MS2. This is the result when the experiment is done at pH 7.0. In contrast, when the pH is lowered to 4.5, the same sample shows a spectrum with several peaks (Figs. 1 and 2 ).
FIGURE 1.
15N-edited proton spectra (HMQC) of MS2 coat protein at pH 4.5 (A) and 7.0 (B) at 40°C. The spectra were obtained with 1024 scans and a recycle delay of 3 s at pH 4.5, and 8 s for pH 7.0.
FIGURE 2.
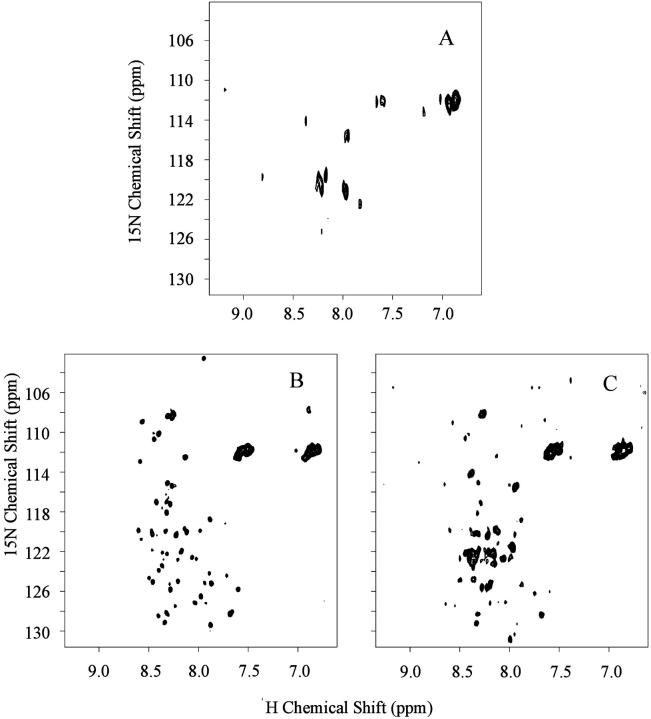
15N-1H HMQC spectra of MS2 (A, B) and VLP (C) at pH 7.0 (A) and 4.5 (B, C). All spectra were acquired with 1024 × 128 points. Spectrum A was obtained with 400 scans and a recycle delay of 8 s. Spectrum B was recorded with 160 scans and a recycle delay of 3 s. The processing was performed with zero filling and a square sine multiplication shifted by 90°, in the indirect dimension and exponential multiplication with 10 Hz of line broadening in the direct dimension. States-time proportional phase incrementation method was used for quadrature detection in the indirect dimension. All spectra were done at 40°C.
The NMR samples of MS2 at pH 4.5 that we have prepared are fairly stable. Identical NMR spectra could be obtained over a period of several weeks. However, the signal-to-noise ratio decreases very slowly when the sample is stored at room temperature. This can be attributed to coat protein dissociation followed by protein aggregation. Coat protein aggregation was confirmed by measuring light scattering of MS2 at pH 4.5 and 7.0 (data not shown). At pH 4.5 the scattered light increases very slowly, and at pH 7.0 the light scattering is constant with time. When MS2 phage is subjected to conditions where dissociation is fast (20 mM acetic acid, pH < 4) the coat protein promptly aggregates at the concentration with which we are working. The aggregation explains the slow vanishing of the NMR signal with time. Once the coat protein is aggregated, the NMR signal is not observable.
A two-dimensional 15N-1H heteronuclear multiple quantum coherence (HMQC) spectrum of the virus particle at pH 7.0 (Fig. 2 a) shows mainly crosspeaks from side-chain amides of glutamine and/or asparagine, with 15N chemical shifts ∼112 ppm. Even using a large relaxation delay (8 s), only a few backbone amide peaks can be observed. In contrast, the HMQC spectrum at pH 4.5 (Fig. 2 b) shows several crosspeaks. These spectra were acquired with a relaxation delay of 3 s. This parameter was optimized based on the signal-to-noise observed. This suggests that the 15N spin-lattice relaxation times (T1) of most of these backbone amide peaks are in the range of few seconds. Among the observed crosspeaks at pH 4.5, ∼42 are backbone amide peaks and the others are side-chain. The 15N chemical shifts for seven of the crosspeaks are typical for glycine residues (15N chemical shift between 108 and 114 ppm). Chemical shift dispersion is not very large, but it is larger than the chemical shift dispersion expected for a completely unstructured polypeptide chain.
A parallel approach we also pursued was the analysis by NMR of the virus-like particle (VLP) of MS2. VLP was obtained from the heterologous expression of the coat protein in E. coli. Fig. 2 c shows the HMQC spectrum of the VLP at pH 4.5. The VLP HMQC spectrum displays chemical shift dispersion, linewidth similar to the phage spectrum at pH 4.5, and about the same number of crosspeaks (Fig. 2 b). The lower signal-to-noise ratio is due to lower concentration.
Circular dichroism and fluorescence measurements
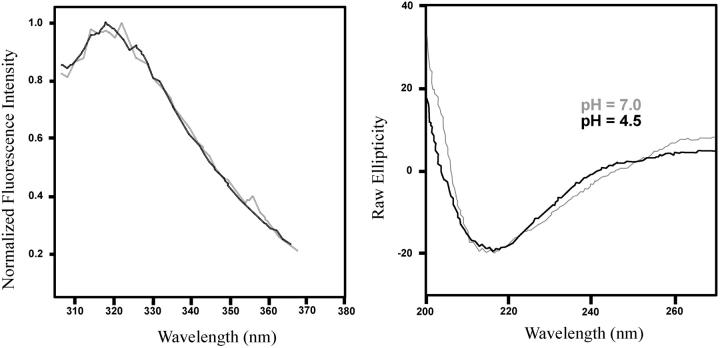
To get additional information about the conformational state of the coat protein at pH 4.5 and pH 7.0, we performed fluorescence and circular dichroism experiments. Fig. 3 shows the tryptophan steady-state fluorescence and circular dichroism spectra at both pH values. The conformational change, as sensed by the tryptophan, is not pronounced with the decrease in pH, since the spectra at both pH values are almost identical. Most of the fluorescence observed is from the two tryptophans located at different regions of the protein (DaPoian et al., 1993). Rather small changes in secondary structure were observed by circular dichroism. The spectrum is predominantly of a β-sheet structure as indicated by the negative band at 215 nm. The positive ellipticity at 200 nm decreases with the pH shift to 4.5, and represents a small decrease in secondary structure content (Johnson, 1988).
FIGURE 3.
Tryptophan steady-state fluorescence and circular dichroism spectra at pH 7.0 (gray) and 4.5 (black) at room temperature. The fluorescence spectra were obtained with excitation wavelength of 280 nm at room temperature.
Linewidths and transverse relaxation times (T2)
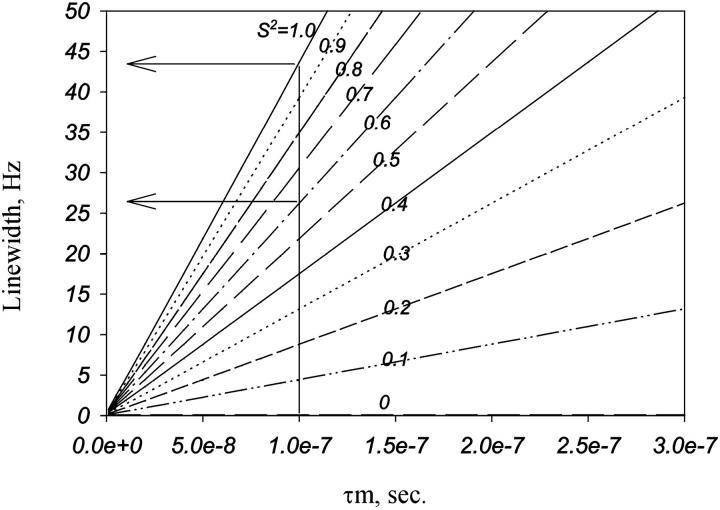
Transverse relaxation times (T2) are related to the rotational correlation time and thus to molecular size. The linewidths of the peaks observed in the HMQC spectrum of MS2 shown in Fig. 2 b are between 30 and 40 Hz. Fig. 4 shows the correlation between linewidth and the overall rotational correlation time as a function of the order parameter. The order parameter normally obtained from N-H in proteins ranges from 0.6 in flexible regions to 0.9 in structured regions. The linewidth of 30–40 Hz, in this range of order parameter, is compatible with τm of 1 × 10⁻⁷ s. This τm is 10× smaller than what one would expect for the intact virus particle, and 10× larger than expected for the coat protein dimer. We then believe that the signal observed by NMR is from oligomers of coat protein. The linewidth is the same range (30–40 Hz) when we vary the temperature from 5 to 50°C (data not shown).
FIGURE 4.
Theoretical value of linewidth of the 15N line as a function of τm (overall correlation time) in several values of S2 (order parameter), as indicated. The simulations were done using the Lipari-Szabo model free formalism with a fixed value of τe (internal correlation time) of 100 ps.
Measurement of T1
15N T1 measurement of the individual peaks in the HMQC was not feasible because it would demand too much NMR time (see Materials and Methods). We decided to measure T1 in the one-dimensional spectra. We acquired a set of one-dimensional spectra varying the period where the signal relaxes by T1 (Nirmala and Wagner, 1998). The integral of the whole amide region of each one-dimensional spectrum was plotted against T1 period. The result is the average 15N T1 of the residues in the most flexible regions of the coat protein.
It must be clear that what we are calling “average T1” (T1av) is not the arithmetic average of T1 of each resonance, but it is an average of T1 weighed by T2 of each amide resonance. Signals with longer T2 will be more intense and therefore best represented. T1av will not reflect the average motion of the molecule but mostly the flexible residues. For large particles, T1av will reflect the average internal motion. As the 15N linewidths are approximately the same for the signals (∼30–40 Hz), all crosspeaks in the HMQC will be very nearly represented in T1av. This is true for the MS2 particle (Fig. 2 b) and for its VLP (Fig. 2 c).
Because temperature changes lead to variation in internal motion, T1av was measured at different temperatures at two fields (14.1 T/600 MHz and 9.4 T/400 MHz). The values are listed in Table 1. The dependence of T1av with temperature enabled us to detect the temperature where T1av is at a minimum (30°C). We could better interpret the results by comparison of T1av values with simulations of T1. To accomplish that, we performed several simulations of T1 as a function of the internal dynamics using the Lipari-Szabo model free formalism (Lipari and Szabo, 1982).
TABLE 1.
T1av in several temperatures
| Temperature °C | T1, s 600 MHz | T1, s 400 MHz |
|---|---|---|
| 5 | 2.4 ± 0.18 | – |
| 15 | 2.1 ± 0.16 | – |
| 30 | 1.2 ± 0.090 | 2.0 ± 0.15 |
| 40 | 3.2 ± 0.24 | 2.8 ± 0.21 |
| 50 | 4.1 ± 0.31 | 4.0 ± 0.30 |
Experimental values of T1 obtained at 400 and 600 MHz. T1 was measured as described in Material and Methods.
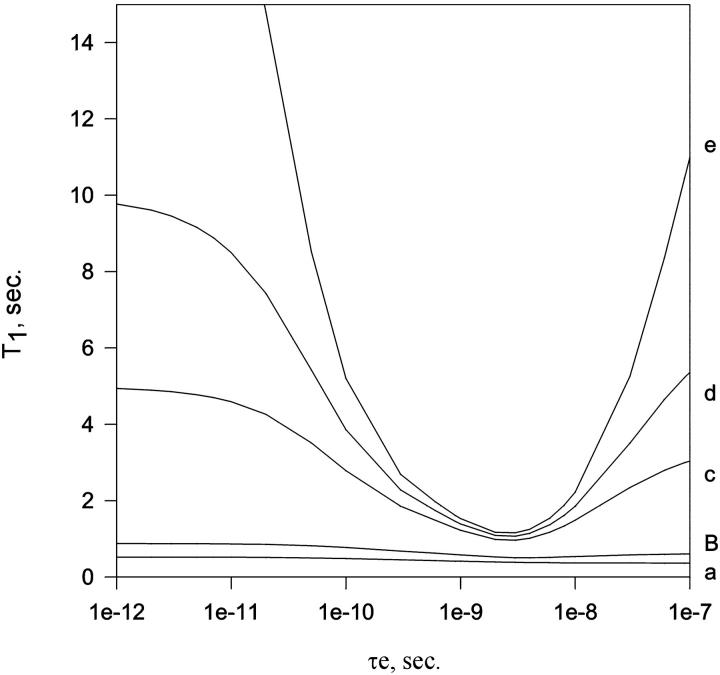
Fig. 5 shows the theoretical value of T1 as a function of τe (internal correlation time) for several values of τm (overall correlation time). The simulation shows the behavior of T1 for a relatively disordered N-H vector (order parameter, S2 = 0.7) for several sizes of molecules, i.e., from small molecules to large protein oligomers (τm from 2 to 500 ns). T1 shows a U-shaped curve for molecules of all sizes; however, it is noticeable that the curves become stiffer as the molecular size increases. This is important to emphasize, because T1 becomes an excellent probe for the internal dynamics in large particles.
FIGURE 5.
Theoretical value of T1 as a function of τe (internal correlation time) in several values of τm (overall correlation time): (a) τm, 2 ns; (b) τm, 8 ns; (c) τm, 50 ns; (d) τm, 100 ns; and (e) τm, 500 ns. The simulations were done using the Lipari-Szabo model free formalism with a fixed value of order parameter (S2 = 0.7). Theoretical values of T2 are between 240 and 350 ms for a, 90 and 130 ms for b, 15 and 20 ms for c, 7.7 and 10.4 ms for d, and 2.7 and 3.5 ms for e. The experimental 15N linewidth of ∼30 Hz (obtained from Fig. 2) corresponds to τm = 100 ns.
Comparison of theoretical values of T1 with the experimental T1av (Table 1) gave insights on the internal dynamics of the virus particle. The U-shaped curve of T1av as a function of the temperature shows a behavior not compatible with the dimer in solution, as expected from the linewidth measurements (Fig. 4). For comparison, we are considering that the change in temperature leads to changes in the internal and overall dynamics of the particle. Varying τm over the range expected for a change in temperature 5–50°C did not significantly change the simulated curves shown in Fig. 5. The temperature affects mainly the internal dynamics. An estimated overall rotational correlation time τm of 100 ns is compatible with the measured 15N linewidth (30–35 Hz) and T1av in Table 1.
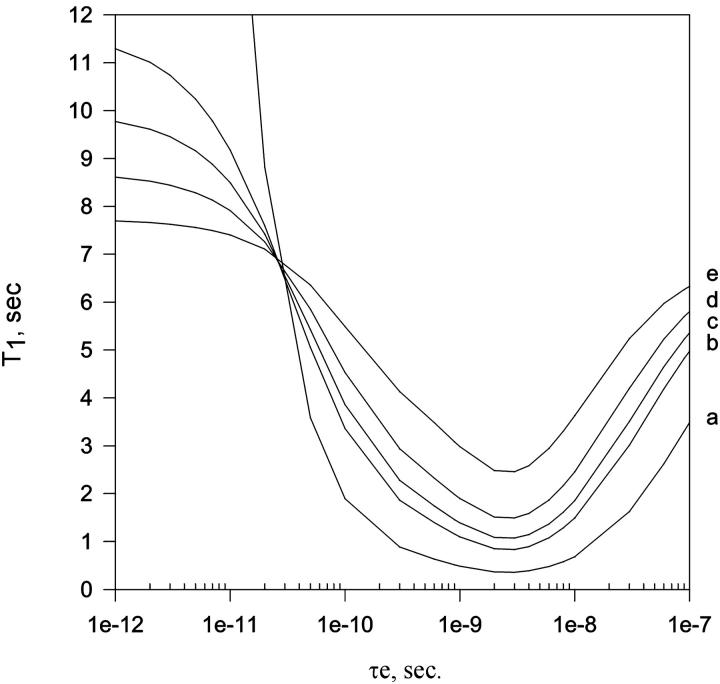
Fig. 6 shows the plot of T1 as a function of the internal correlation time for several values of the order parameter (S2) assuming τm is 100 ns. The minimum value of T1 at each curve in Fig. 6 corresponds the same for value of τe, independently of the order parameter. In this way, the minimum experimental value of T1av, at 30°C, corresponds to the theoretical value of T1 at τe 2.5 ns and S2 between 0.6 and 0.7. T1av values at temperatures <30°C correspond to smaller values of τe, and temperatures >30°C correspond to larger values of τe. Table 1 is in agreement with Figs. 5 and 6, as much as the increase in temperature will always increase internal dynamics (τe).
FIGURE 6.
Theoretical value of T1 as a function of τe (internal correlation time) in several values of order parameters (S2): (a) S2, 0; (b) S2, 0.6; (c) S2, 0.7; (d) S2, 0.8; and (e) S2, 0.9. The simulations were done using the Lipari-Szabo model free formalism with a fixed value of overall correlation time (τm = 100 ns). Theoretical values of T2 are between 7.4 and 7.7 ms for a, 7.8 and 12.2 ms for b, 7.7 and 10.4 ms for c, 7.5 and 9.11 ms for d, and 7.4 to 8.1 ms for e. Theoretical values of T2 in all order parameters are in agreement with the experimental 15N linewidth of ∼30 Hz (obtained from Fig. 3) when τm = 100 ns.
The magnitude of the particle internal motion is on the nanosecond (ns) timescale (Figs. 5 and 6). It includes segmental motions that usually occur in the ns timescale. Motion of the diffusion of the N-H bond occurs in the picosecond (ps) timescale (Clore et al., 1990a,b). When the segmental contribution to internal motion is separated from the fast component, the overall profile of the curve T1 versus internal motion is the same (simulation not shown).
The approach we used so far enabled us to estimate, with good confidence, the order and the timescale of the internal dynamics of the oligomer at 30°C. Moreover, the values of T1av at several temperatures can also be used to measure the effect of temperature on the internal dynamics.
Strategy for estimating the dynamics as a function of temperature
To further investigate the effect of temperature on τe, we elected to analyze the simulated plot in Fig. 6 with the inclusions of the uncertainties in the T1av measurement and of the uncertainties in the order parameter. In doing so, we employed the following criteria:
The experimental error for T1av measurements (15%) was used to calculate the lower and upper limit for each temperature.
The value for τe was assumed to be 2.5 ns at 30°C, and the lower and upper limit of T1av, 30°C.
Two assumptions were made: (i), the increase in temperature will always lead to an increase in the internal correlation time, and (ii), the increase in temperature will always lead to a decrease in order parameter.
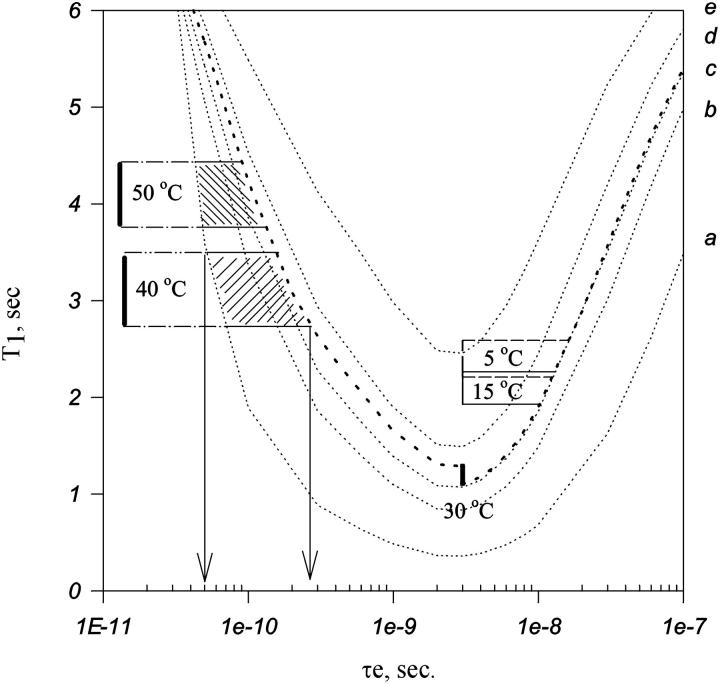
The criteria above enable us to draw regions in the plot of Fig. 5 where the values of T1av at each temperature will be found with 100% confidence. These regions are shown in Fig. 7. Note that the timescale of the internal motion at each temperature could be determined reasonably well. The minimum and maximum τe at each temperature is shown in Table 2.
FIGURE 7.
The same as Fig. 6 plus regions representing all the possible values of T1av at each temperature. (a) S2, 0; (b) S2, 0.6; (c) S2, 0.7; (d) S2, 0.8; and (e) S2, 0.9. The criteria used to find the regions are the following. At 30°C, τe is 2.5 ns, and the maximum and minimum S2 are the T1 corresponding to T1av within an experimental error of 15%. For temperatures >30°C, the maximum order parameter is the one obtained at 30°C. The minimum order parameter is ‘0’, maximum disorder. The internal correlation is necessarily lower than the one at 30°C, and the minimum and maximum T1 will be T1av within the range of the experimental error of 15%. For temperatures <30°C, the minimum order parameter is the minimum obtained at 30°C. The maximum order parameter will be ‘1’, maximum order. The internal correlation is necessarily higher then the one at 30°C, and the minimum and maximum T1 will be T1av within the range of the experimental error of 15%.
TABLE 2.
Averaged T1 and the internal correlation time obtained from Fig. 7
| Temperature °C | T1, s 600 MHz | τe, s |
|---|---|---|
| 5 | 2.4 | 2.5 × 10⁻⁹, 1.3 × 10⁻⁸ |
| 15 | 2.1 | 2.5 × 10⁻⁹, 1.2 × 10⁻⁸ |
| 30 | 1.2 | 2.5 × 10⁻⁹ |
| 40 | 3.2 | 5.0 × 10⁻¹¹, 2.8 × 10⁻¹⁰ |
| 50 | 4.1 | 3.1 × 10⁻¹¹, 1.4 × 10⁻¹⁰ |
Each τe corresponds to the region shown.
DISCUSSION
General considerations
In the present article we showed a remarkable increase in NMR signal of a 15N-labeled MS2 bacteriophage aqueous solution when we lowered the pH. About 40 crosspeaks appeared in the two-dimensional HMQC spectrum of both the phage and VLP. Fluorescence and circular dichroism spectra showed that the tertiary and secondary structure of the MS2 coat protein did not vary significantly with the pH change.
To have more insights on the events we are probing, we performed relaxation measurements. Comparison of experimental data with simulations can expand our ways to interpret physical phenomenon. By using a well-established theory of 15N relaxation in proteins we simulated the experimental conditions of the protein.
From the simulations of T1 using the Lipari-Szabo model free formalism (Lipari and Szabo, 1982) we could conclude that for large particles, 15N T1 is very dependent on the internal motion (Fig. 5). This is a special feature of large particles. Note that for large particles (τm > 50 ns; see Fig. 5, c–e) the calculated T1 varies significantly with variation in internal motions. On the other hand, for small particles the variation is rather small (Fig. 5, a and b).
Our measurements of T1av as a function of temperature showed a behavior that matches well with large particles. We could then conclude that we are probing NMR signal coming from a large particle. We expect the MS2 phage to start to dissociate at low pH. However, based on the relaxation parameters we can affirm that the signal is not coming from the dimer, the last step of dissociation.
Origin of the measured NMR signal
The rationalization of the origin of the observed NMR signal is fundamental for the comprehension of the events occurring when the pH is decreased to 4.5. 15N linewidth measured in the HMQC spectra at Fig. 2, b and c, are between 30 and 40 Hz. This is consistent with the T2 of a particle of apparent rotational correlation time of ∼100 ns (spherical particle with an apparent hydrodynamic radius of ∼48 Å), 10× smaller than the one expected for MS2 virus particle.
To calculate the apparent overall correlation time (100 ns) used in the T1 simulations, exchange contribution to T2 was not taken into consideration because: (i), the linewidth is not very dependent on temperature; and (ii), the observed T1 is also typical of large particles, and the exchange contribution to the NMR signal of the dimeric protein (completely dissociated) does not explain this behavior.
When several species are in equilibrium, the resulting apparent overall rotational correlation time is
 |
(6) |
where τ1, τ2, τ3, and τn are the overall rotational correlation times of the virus particle and the possible intermediates of dissociation of MS2, and χ1, χ2, χ3, and χn are the molar fraction of the virus and the intermediates. τvirus is estimated from Debye equation (Atkins, 1997) using the hydrodynamic radius of the virus as 130 Å (DaPoian et al., 1993). Therefore, the observed overall correlation time has contributions from all the intermediates.
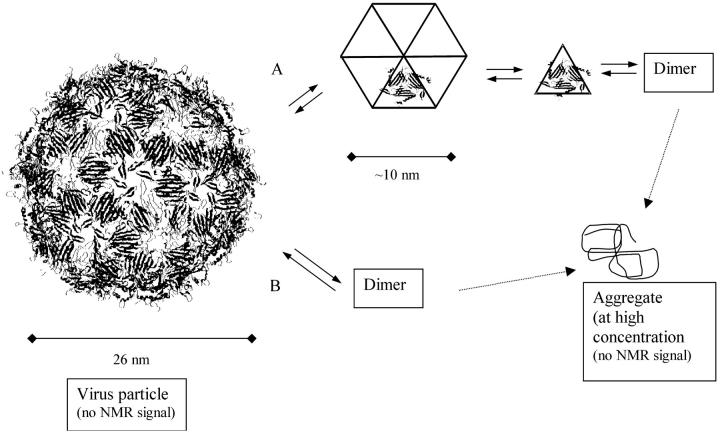
The NMR signal coming from the integral MS2 particle would not be measurable, because of a very short T2 (∼0.4 ms). Conformational exchange can also contribute to the shortening of T2. We concluded that the NMR signal is not from the integral virus particle, and not from the dimer, either. The NMR signal is probably coming from a high equilibrium concentration of an intermediate. Fig. 8 shows two possible mechanisms for MS2 disassembly. Mechanism A shows possible dissociation intermediates and mechanism B shows two-state equilibrium.
FIGURE 8.
Schematic diagram showing two mechanisms for MS2 disassembly. (A) Here, there are intermediates in the disassembly: a hexamer of trimers, the trimer that corresponds to the asymmetric unit, and the dimeric form that is the conformation where the capsid protein works as a repressor. (B) The two-states dissociation is shown, where the final conformation is the dimeric form.
If MS2 disassembly follows a two-state mode (mechanism B in Fig. 8) there is a unique explanation for the observed NMR signal: the occurrence of a very rapid exchange between the two states. The equilibrium must be fast because the line broadening is not pronounced. With fast equilibrium, the relaxation parameters reflect the properties of intact virus. However, it is difficult to explain the slow vanishing of the NMR signal with mechanism B. Because it is known that the aggregation step is fast (from the studies of aggregation at low pH), the equilibrium concentration of the dimer species in mechanism B would have to be extremely small to account for the slow overall rate of aggregation.
The most suitable explanation for the origin of the NMR signal is mechanism A (Fig. 8), with the presence of intermediates in equilibrium. In Fig. 8 we postulate the presence of hexamer or pentamers of trimers, trimers (the asymmetric unit), and the final dimeric conformation. Tuma and co-workers have proposed a similar mechanism for the assembly/disassembly of the icosahedral bacteriophage, PRD1 (Tuma et al., 1996). For this mechanism to occur, fast equilibrium is not demanded. By assuming this mechanism, one simple explanation arises: one intermediate is the molecule being probed by NMR. The hexamer or pentamers of trimers has about the same size expected (∼10 nm of diameter). The assumption of the presence of intermediates helps us to understand the slow vanishing of the NMR signal. The limiting step is the formation of the intermediate and not the aggregation. In mechanism A the aggregation step can be as fast as observed at pHs <4.0.
Small proteins generally follow a two-state-mode unfolding, whereas large proteins tend to form folding intermediates (Privalov, 1996). The difference is that the lifetime of the intermediates tends to be rather short for small proteins (ns to ms) and large for large proteins (ms to s). The same could be expected for intermediates of virus dissociation. Stable intermediates have been described for the dissociation of many viruses (Phelps et al., 2000). Since MS2 is quite a small coat protein, the lifetime of the dissociation intermediate should be short. Relaxation measurements enable the detection of short lifetime intermediates. In the present article, we proposed, for the first time, the presence of intermediates in the process of dissociation of MS2 bacteriophage. However, we could not unambiguously define if there are one or more intermediates.
Other considerations
Based on the rationale showed in Fig. 7, we could estimate the timescale of the segmental motions of the intermediate. However, the interpretation made is valid only if there is one principal intermediate or if there is rapid exchange between various intermediates. This strategy can be of general use to obtain the timescale of segmental motions in large particles.
The dynamic properties of this intermediate was probed by T1 measurements. The observed timescales at different temperatures are summarized in Table 2. Note that the timescale of the internal motion varied two orders of magnitude with temperature change. If we consider the inverse of τe as the rate constant of the events we are probing, there is a considerable change in rate constant over a small temperature range, meaning high activation energy. This suggests segmental motions or more complexes motions that could involve equilibrium between intermediates.
The x-ray structure of the MS2 bacteriophage shows the presence of regions in the protein with high B-factors in the amide nitrogen: FG-, AB-loop, and C- and N-terminal. FG-loop is critical for the virus assembly. Deletion and mutation in this loop yields assembly of defective coat protein (Stonehouse et al., 1996; Axblom et al., 1998).
The total number of glycine residues in the coat protein is nine, with six having high B-factors in the x-ray structures. Two are in the FG-loop, three in the AB-loop and one in the C-terminal. It matches the number of possible glycines residues in the HMQC spectrum (Fig. 2 b). There are seven crosspeaks between 106 and 112 ppm (15N chemical shift) and 8–9 ppm (1H chemical shift). It reinforces the hypothesis that the residues we probed are the residues in the AB- and FG-loops, plus a few residues in the N- and C-termini. Approximately the same number of putative glycines could be found in the VLP spectrum at pH 4.5. Although the spectrum of VLP is not identical to the phage spectrum, it indicates to similar phenomenon in the VLP. It is noteworthy that the VLP spectrum shows approximately the same number of peaks and the same linewidth.
Acknowledgments
We thank Francisco Gomes Neto for technical support and Marcius S. Almeida for careful revision.
This work was supported by an international grant from the International Centre for Genetic Engineering and Biotechnology, Trieste, Italy; and by grants from the Financiadora de Estudos e Projetos, Rio de Janeiro, Brazil; the Conselho Nacional de Desenvolvimento Científico e Tecnológico, Brasilia, Brazil; and the Fundação de Amparo à Pesquisa do Estado do Rio de Janeiro Carlos Chagas Filho, Rio de Janeiro, Brazil. J.L.S. is an International Scholar of the Howard Hughes Medical Institute.
References
- Akke, M., and A. G. Palmer. 1996. Monitoring macromolecular motions on microsecond to millisecond time scales by R(1), Rho R(1) constant relaxation time NMR spectroscopy J. Am. Chem. Soc. 118:911–912. [Google Scholar]
- Almeida, F. C., and S. J. Opella. 1997a. Measurement of 1H T1ρ in a uniformly 15N labeled protein with heteronuclear two-dimensional spectroscopy. J. Magn. Res. 124:509–511. [DOI] [PubMed] [Google Scholar]
- Almeida, F. C., and S. J. Opella. 1997b. FD coat protein structure in membrane environments: structural dynamics of the loop between the hydrophobic trans membrane helix and the amphipathic in-plane helix. J. Mol. Biol. 270:481–495. [DOI] [PubMed] [Google Scholar]
- Atkins, P. W., editor. 1997. Physical Chemistry, 6th Ed. W. H. Freeman & Co., London.
- Axblom, C., K. Tars, K. Fridborg, L. Oma, M. Bundule, and L. Liljas. 1998. Structure of phage FR capsids with deletion in the FG loop: implications for viral assembly. Virology. 249:80–88. [DOI] [PubMed] [Google Scholar]
- Berglund, H., H. Kovács, K. Dahlman-Wright, J. Gustafsson, and T. Hãrd. 1992. Backbone dynamics of the glucocorticoid receptor DNA-binding domain. Biochemistry. 31:12001–12011. [DOI] [PubMed] [Google Scholar]
- Clore, G. M., P. C. Driscoll, P. T. Wingfield, and A. M. Gronenborn. 1990a. Analysis of the backbone dynamics of interleukin-1 β using two-dimensional inverse detected heteronuclear 15N-1H NMR spectroscopy. Biochemistry. 29:7387–7401. [DOI] [PubMed] [Google Scholar]
- Clore, G. M., A. Szabo, A. Bax, L. E. Kay, P. C. Driscoll, and A. M. Gronenborn. 1990b. Deviations from the simple two-parameter model-free approach to the interpretation of nitrogen-15 nuclear magnetic relaxation of proteins. J. Am. Chem. Soc. 112:4989–4991. [Google Scholar]
- DaPoian, A. T., A. C. Oliveira, P. L. Gaspar, J. L. Silva, and G. Weber. 1993. Reversible pressure dissociation of R17 bacteriophage: the physical individuality of virus particles. J. Mol. Biol. 31:999–1008. [DOI] [PubMed] [Google Scholar]
- Golmohammadi, R., K. Valegard, K. Fridborg, and L. Liljas. 1993. The refined structure of bacteriophage MS2 at 2.8 Å resolution. J. Mol. Biol. 234:620–639. [DOI] [PubMed] [Google Scholar]
- Johnson, J. E., and W. Chiu. 2000. Structures of virus and virus-like particles. Curr. Opin. Struct. Biol. 10:229–235. [DOI] [PubMed] [Google Scholar]
- Johnson, W. C., Jr. 1988. Secondary structure of proteins through circular dichroism. Ann. Rev. Biophys. Chem. 17:145–167. [DOI] [PubMed] [Google Scholar]
- Laemmli, U. K. 1970. Cleavage of structural proteins during the assembly of the head of the bacteriophage T4. Nature. 277:680–700. [DOI] [PubMed]
- Lago, H., A. M. Parrott, T. Moss, N. J. Stonehouse, and P. G. Stockley. 2001. Probing the kinetics of formation of the bacteriophage MS2 translational operator complex: identification of a protein conformer unable to bind RNA. J. Mol. Biol. 305:1131–1144. [DOI] [PubMed] [Google Scholar]
- Liljas, L. 1999. Virus assembly. Curr. Opin. Struct. Biol. 9:129–134. [DOI] [PubMed] [Google Scholar]
- Lipari, G., and A. Szabo. 1982. Model-free approach to the interpretation of nuclear magnetic resonance relaxation in macromolecules. 1. Theory and range of validity. J. Am. Chem. Soc. 104:4546–4559. [Google Scholar]
- Lowry, O. H., N. J. Rosenbrough, A. L. Farr, and R. J. Randall. 1951. Protein measurement with the folin phenol reagent. J. Biol. Chem. 193:265–275. [PubMed] [Google Scholar]
- Mandel, A. M., M. Akke, and A. G. Palmer. 1996. Dynamics of ribonuclease H: temperature dependence of motions on multiple time scales. Biochemistry. 35:16009–16023. [DOI] [PubMed] [Google Scholar]
- Ni, C. Z., R. Syed, R. Rondandapanir, J. Wickersham, D. S. Peabody, and K. R. Ely. 1995. Crystal-structure of the MS2 coat protein dimer—implications for RNA binding and virus assembly. Structure. 3:255–263. [DOI] [PubMed] [Google Scholar]
- Nirmala, N. R., and G. Wagner. 1998. Measurement of C-13 relaxation times in proteins by two-dimensional heteronuclear H1–C13 correlation spectroscopy. J. Am. Chem. Soc. 110:7557–7558. [Google Scholar]
- Peabody, D. S., and K. R. Ely. 1992. Control of translational repression by protein-protein interactions. Nucleic Acids Res. 20:1649–1655. [DOI] [PMC free article] [PubMed] [Google Scholar]
- Phelps, K., B. Speelman, and C. B. Post. 2000. Theoretical studies of viral capsid proteins. Curr. Opin. Struct. Biol. 10:170–173. [DOI] [PubMed] [Google Scholar]
- Privalov, P. L. 1996. Intermediate states in protein folding. J. Mol. Biol. 258:707–725. [DOI] [PubMed] [Google Scholar]
- Stone, M. J., W. J. Fairbrother, A. G. Palmer, J. Reizer, M. H. J. R. Saier, and P. E. Wright. 1992. Backbone dynamics of the Bacillus subtilis glucose permease II A domain determined from 15N NMR relaxation measurement. Biochemistry. 31:4394–4406. [DOI] [PubMed] [Google Scholar]
- Stonehouse, N. J., K. Valegard, R. Golmohammadi, S. van den Worm, C. Walton, P. G. Stockey, and L. Liljas. 1996. Crystal structures of MS2 capsids with mutations in the subunit FG loop. J. Mol. Biol. 256:330–339. [DOI] [PubMed] [Google Scholar]
- Sugiyama, T., R. R. Hebert, and K. A. Hartman. 1967. Ribonucleoprotein complexes formed between bacteriophages MS2 RNA and MS2 coat protein in vitro. J. Mol. Biol. 25:455–463. [DOI] [PubMed] [Google Scholar]
- Tuma, R., J. H. K. Bamford, D. H. Bamford, M. P. Russel, and G. J. Thomas, Jr. 1996. Structure interaction and dynamics of PRD1 virus. I. Coupling of subunit folding and capsid assembly. J. Mol. Biol. 257:87–101. [DOI] [PubMed] [Google Scholar]
- van Vlijmen, H. W. T., S. Curry, M. Schaefer, and M. Karpuls. 1998. Titration calculations of foot-and-mouth disease virus capsid and their stabilities as a function of pH. J. Mol. Biol. 275:295–308. [DOI] [PubMed] [Google Scholar]
- Valegard, K., L. Liljas, K. Fridborg, and T. Unge. 1990. The three-dimensional structure of the icosahedral bacterial virus MS2. Nature. 345:36–41. [DOI] [PubMed] [Google Scholar]
- Wagner, G. 1993. Characterization of the distribution of internal motions in the basic pancreatic trypsin inhibitor using a large number of internal NMR probes. Quar. Rev. Biophys. 16:1–57. [DOI] [PubMed] [Google Scholar]
- Wagner, G., S. Hyberts, and J. W. Peng. 1993. Study of protein dynamics by NMR. In NMR of Proteins. G. M. Clore, and A. M. Gronenborn, editors. CRC Press, Boca Raton, FL. p. 220.


