

Abstract
The present article considers the influence of heterogeneity in a mobile analyte or in an immobilized ligand population on the surface binding kinetics and equilibrium isotherms. We describe strategies for solving the inverse problem of calculating two-dimensional distributions of rate and affinity constants from experimental data on surface binding kinetics, such as obtained from optical biosensors. Although the characterization of a heterogeneous population of analytes binding to uniform surface sites may be possible under suitable experimental conditions, computational difficulties currently limit this approach. In contrast, the case of uniform analytes binding to heterogeneous populations of surface sites is computationally feasible, and can be combined with Tikhonov-Phillips and maximum entropy regularization techniques that provide the simplest distribution that is consistent with the data. The properties of this ligand distribution analysis are explored with several experimental and simulated data sets. The resulting two-dimensional rate and affinity constant distributions can describe well experimental kinetic traces measured with optical biosensors. The use of kinetic surface binding data can give significantly higher resolution than affinity distributions from the binding isotherms alone. The shape and the level of detail of the calculated distributions depend on the experimental conditions, such as contact times and the concentration range of the analyte. Despite the flexibility introduced by considering surface site distributions, the impostor application of this model to surface binding data from transport limited binding processes or from analyte distributions can be identified by large residuals, if a sufficient range of analyte concentrations and contact times are used. The distribution analysis can provide a rational interpretation of complex experimental surface binding kinetics, and provides an analytical tool for probing the homogeneity of the populations of immobilized protein.
INTRODUCTION
During the last decade, the measurement of surface binding equilibrium and kinetics has become a very popular approach for the study of protein interactions (Fägerstam et al., 1990; Schuck, 1997b; Rich and Myszka, 2001; Cooper, 2002). Optical biosensors have made a significant impact in many fields, for example, in the study of receptor interactions in immunology, cell adhesion, signal transduction, and virology (Khilko et al., 1995; van der Merwe and Barclay, 1996; Natarajan et al., 1999; McDermott et al., 2000; Myszka et al., 2000; Xing et al., 2000; Garcia et al., 2001; Andersen et al., 2002; Rebois et al., 2002; Rudolph et al., 2002), antibody-antigen interactions and antibody engineering (Kelley and O'Connell, 1993; Malmborg and Borrebaeck, 1995; Nieba et al., 1996; Ober et al., 2001; Gonzales et al., 2002); they are used for ligand fishing in combination with mass spectroscopy (Natsume et al., 2000; Nedelkov and Nelson, 2000; Williams and Addona, 2000; Gilligan et al., 2002), and as screening tools in drug discovery (Cooper, 2002). Despite this success, and possibly because of the exquisite sensitivity of optical biosensors, the reliable quantitative analysis of the affinity and rate constants has, in many cases, been problematic (see, for example, Glaser and Hausdorf, 1996; O'Shannessy and Winzor, 1996; Schuck and Minton, 1996b; Lakey and Raggett, 1998; Hall, 2001; Rudolph et al., 2002). Surprisingly, there are still only a few examples where the experimental data can be well-modeled as a single pseudo-first-order reaction, although most frequently this is the reaction model that the binding partners are assumed to follow. Several possible reasons for deviations from the expected binding kinetics have been identified in different cases, including mass transport limitations in the surface binding kinetics (Glaser, 1993; van der Merwe et al., 1994; Schuck, 1996; Yarmush et al., 1996; Myszka et al., 1998), and heterogeneity of the immobilized sites, or of the analytes (O'Shannessy, 1994; Davis et al., 1998; Schuck et al., 1999). The present article addresses the latter point, and examines in a general way how distributions of surface sites or mobile binding partners with different binding properties may be deduced from the observed binding data.
The homogeneity of surface sites is of considerable interest beyond the analysis of binding equilibria and kinetics of protein interactions by optical affinity biosensors. It is important, for example, for the sensitivity and reproducibility of biosensors (Anderson et al., 1997; Vijayendran and Leckband, 2001) in the development of protein chip technology (Hodneland et al., 2002), and, more generally, in the context of characterization of chemical adsorption to surfaces (Jagiello, 1994; Rusch et al., 1997; Puziy, 1999; Gun'ko et al., 2001).
The mathematical modeling of kinetic surface binding data from optical biosensors involving independent nonuniform sites has frequently been restricted to models with two discrete classes of sites. However, dependent on the nature of the protein and the immobilization conditions, potentially a continuum of surface sites with different kinetic and thermodynamic properties may be formed. The Sips isotherm addresses this problem by describing binding to sites with a continuous distribution of affinities (Sips, 1948). It is an immunological standard method to assess, for example, heterogeneity of polyclonal antibody-antigen reactions in solution (Nisonoff and Pressman, 1958; Selinger and Rabbany, 1997) and has also been used, for studies of the heterogeneity of sites from immobilization with different immobilization chemistries in direct surface binding and displacement assays (Rabbany et al., 1997; Selinger and Rabbany, 1997; Vijayendran and Leckband, 2001). However, it is a thermodynamic model and constrained to a predefined, approximately Gaussian shape of the affinity distribution. In other fields of surface binding, such as chemical adsorption processes in the gas and liquid phase, more general approaches are well-known. These are based on continuous “model-free” affinity distributions, calculated by inversion of a Fredholm integral equation using Tikhonov-Phillips regularization techniques, such as CONTIN (Haber-Pohlmeier and Pohlmeier, 1997; Puziy, 1999; Gun'ko et al., 2001).
In the present study, we have examined how these latter techniques can be utilized for the characterization of protein interactions. Moreover, since, in addition to the binding isotherm, optical biosensors usually provide kinetic data on surface binding and dissociation—a rich source of information—we explored whether it is possible to retrieve information on the combined distribution of affinity and kinetic parameters of heterogeneous populations of analytes or immobilized sites. We have taken the approach of regularization with the Tikhonov-Phillips and maximum entropy method (Hansen, 1998), which does not require assumptions on the number of species or the shape of the distribution. By application to simulated and experimental data, we have identified conditions under which continuous distributions of affinity and kinetic constants may be obtained.
THEORY
In the following, we assume binding sites at the surface (ligands) which can be exposed to free analytes in solution according to the following scheme: During a well-defined contact time, analyte binding to the surface sites takes place. The binding progress is reported by a signal that is proportional to the total surface-bound material. At the end of this association phase, free analyte is removed from the vicinity of the surface, and the dissociation of the surface-bound analyte can be observed. We assume that kinetic data are available for several such cycles of surface binding and dissociation, each at different analyte concentrations. Optical biosensors can generate such data, for example, by incubating the surface with analyte in a cuvette-based system, or through a microfluidic flow injection system.
We will also assume that the surface binding of a single class of analyte to a single class of ligand follows the time-course of an ideal pseudo-first-order reaction. These surface sites have an affinity described by the binding constant KA (or KD = 1/KA), and a total binding capacity smax. The kinetics of surface binding is described by the on-rate constant kon and an off-rate constant koff with KA = kon/koff. If the analyte concentration c is held constant, e.g., due to replenishing with a flow or because of a negligible number of surface-bound analyte molecules, the binding progress s(t) follows the rate equation
 |
(1) |
The equilibrium binding describes a Langmuir isotherm
 |
(2) |
(Langmuir, 1918). If we apply the analyte at time t0 for a contact time tc, we can integrate the rate equation and arrive at the binding progress in the association phase
 |
(3) |
After the analyte is removed, we see dissociation of the bound analyte from the surface with
 |
(4) |
Both association and dissociation are proportional to smax. In summary, the binding course can be described as
 |
(5) |
The parameters b0 and bc allow for baseline offsets which frequently occur in measurements with optical biosensors due to refractive index offsets when applying the sample.
Considering the immobilized proteins as a mixture of sites with different KA and kon, one can formulate a differential distribution of immobilized sites P(kon, KA) such that the integral P(kon*, KA*)dkondKA is the surface binding capacity of sites with an on-rate constant between kon* and kon* + dkon and with an affinity between KA* and KA* + dKA. The maximum binding capacity of the entire surface Smax would then be
 |
(6) |
(with the integration limits describing the range of observable affinity and kinetic constants). The total measured time-course of analyte binding in the association and dissociation phase is
 |
(7) |
(with the kernel given by Eq. 5 evaluated unit binding capacity smax = 1). An analogous distribution of binding constants for the case of uniform surface sites and heterogeneous analyte population is described in the Appendix.
Eq. 7 is a Fredholm integral equation as it occurs in many other biophysical disciplines when an experiment only provides an indirect measurement of the desired quantities (Provencher 1982a). Given noisy data points stot(cj, ti) obtained at a small set of concentrations cj and given a generally large number of timepoints ti, we would like to obtain the distribution P of affinity and rate constants. In general, a direct inversion of Eq. 7 is instable and may not lead to useful information (Provencher, 1982a). However, we can use regularization techniques and impose additional parsimony constraints on the distribution P. This will result in the simplest distribution Pσ that is consistent with the data on a given predefined confidence level σ. We have implemented Tikhonov-Phillips (TP) and maximum entropy (ME) regularization (in the applications TP will be used unless noted otherwise). The details of this calculation are described in the Appendix.
For the practical application it is important to note that these regularization techniques introduce a bias to favor the most parsimonious distribution, and that different procedures can lead to different results. Experience with this approach in other biophysical disciplines shows that it can provide very good results, but that the introduction of prior knowledge of parsimony (and possibly other available prior knowledge) into the data analysis has to be carefully balanced and is to be considered in the interpretation of the results. Therefore, the properties of this binding constant distribution analysis are explored below.
RESULTS
To explore the affinity distribution methods, we first studied equilibrium isotherms. Fig. 1 shows a simulated binding isotherm with two classes of surface sites. Normally distributed noise of 1 unit was added. (In the following, for simplicity, we adopt the units of the BIAcore surface plasmon resonance instrument, which are termed “RU,” and which correspond to ∼1 pg protein/mm2 or 10−6 refractive index units.) As shown in Fig. 1 A (dotted line), the data cannot be described well as a single species isotherm. If the analysis, in terms of an affinity distribution, is attempted by simply calculating the best fit with a combination of species with different affinity constants, a good fit is achieved (data not shown) but the resulting distribution is ill-conditioned and governed by noise in the data (Fig. 1 B, short dashed line). In the present case, it results in a combination of three species, with the two major peaks corresponding approximately to the species underlying the simulation, and the third species being a result of the noise in the simulated data. This demonstrates that a direct inversion will result in an artificial level of detail. Therefore, we calculated the “simplest” distribution of affinities that can fit the data with a root-mean-square (rms) deviation within the predefined confidence level of p = 0.9, as judged by F-statistics. The result is a statistically acceptable fit of the data (Fig. 1 A, solid line), and a corresponding distribution that only represents the range of affinities underlying the data (Fig. 1 B, solid line). This avoids misleading or statistically unwarranted level of detail, and represents the information that can safely be extracted from the given data. Only when the signal-to-noise ratio is increased in the simulations, can we usually obtain two well-separated peaks that resolve both species underlying this simulation (Fig. 1 B, dashed line). Very similar results were obtained with the ME method (data not shown). This example illustrates the difficulties of distribution analysis from equilibrium-binding data, and the basic principle of regularization.
FIGURE 1.

Distribution analysis of an equilibrium isotherm from a homogeneous analyte binding to heterogeneous surface sites. Data (circles) were simulated for two classes of surface sites with KD = 10 nM and 100 nM and a binding capacity of 100 RU each. 1 RU noise was added. A continuous affinity distribution was approximated with 50 KD values logarithmically spaced between 1 and 1000 nM. (A) Shows the equilibrium isotherms: simulated data (circles), best fit with a single site model (dotted line), and continuous distribution calculated with regularization on a confidence limit of 0.9 (solid line). (B) Shows the calculated affinity distributions: single site model (full circle), distribution without regularization (short dashed line) rescaled, and distribution with TP regularization (solid line). For comparison, the distribution with regularization is shown from the application to a sample of simulated data set with 3.3-fold lower noise (dashed line).
Next, we investigated if ligand distributions are better defined on the basis of kinetic binding progress curves. Again, the interaction of analytes binding to two sites was simulated. As shown in Fig. 2, the kinetic data allow a clear separation and correct identification of the two sites. Under the conditions of Fig. 2, when changing the affinity of the two sites (leaving the on-rate constants unchanged), they could be resolved when the affinity was at least 2.5-fold different. However, the resolution was also found to depend strongly on the contact times of the analyte with the surface. For example, when we examined cases of lower kinetic rate constants simulated for shorter contact times, the resulting affinity and rate constant distribution only poorly resolved the binding constant of the higher affinity site (Fig. 3). Under these conditions, the higher affinity sites are far from their equilibrium level; in particular, at the lower concentrations. Interestingly, both on-rate constants are still well-defined. Again, similar results are obtained when using ME regularization (ME produces slightly sharper peaks except for the underdetermined high affinity in Fig. 3, which is slightly broader; data not shown). In summary, these results demonstrate that the simultaneous determination of the affinity and on-rate constant distribution can be possible under suitable experimental conditions. This will be further illustrated with the analysis of experimentally measured binding curves below.
FIGURE 2.
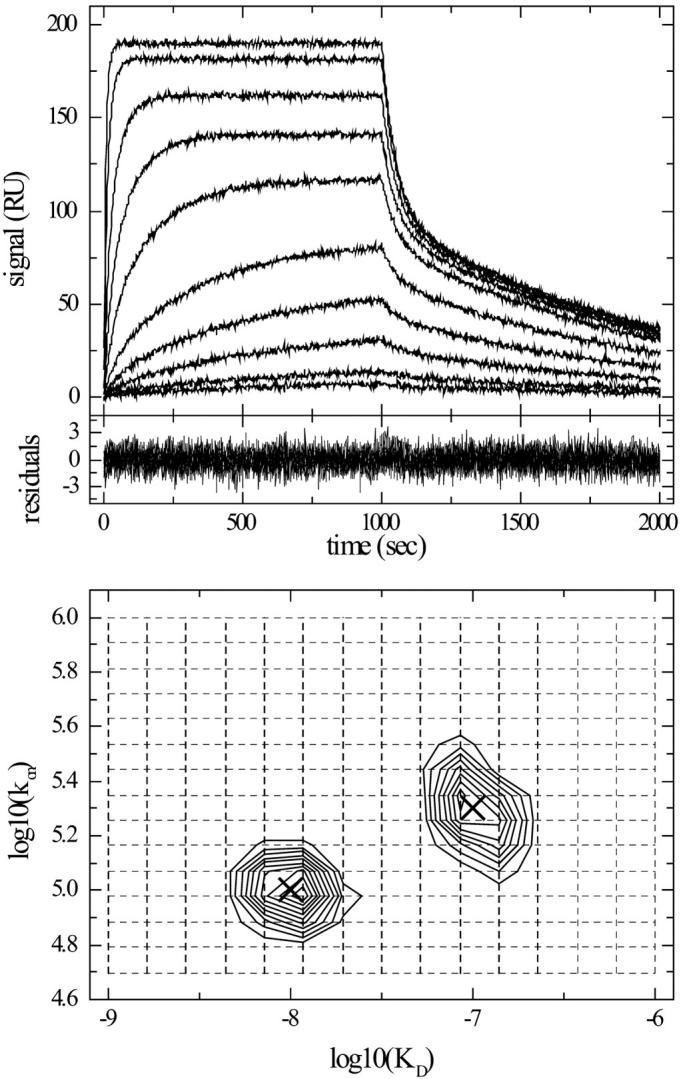
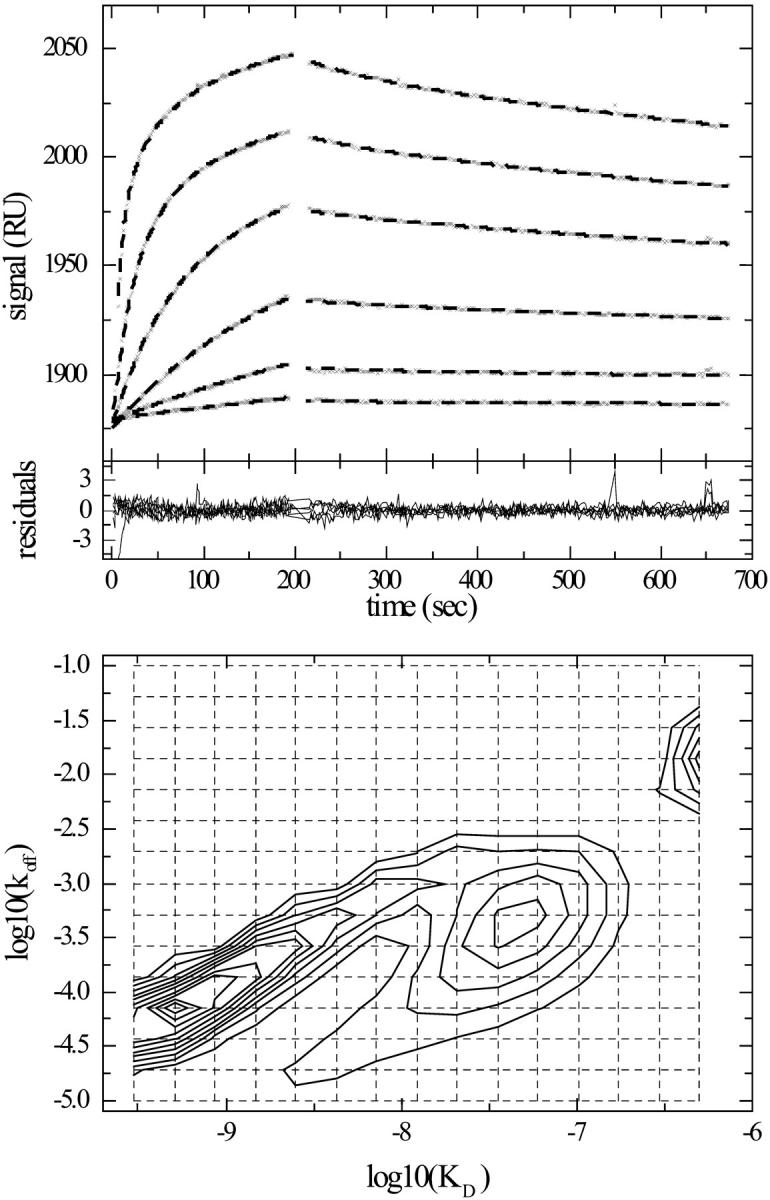
Two-dimensional on-rate constant and affinity distribution analysis for heterogeneous surface sites. Surface binding data were simulated as a superposition of two classes of surface sites with KD = 10 and 100 nM, and kon = 2 × 10⁵ and 1 × 10⁵/Ms, respectively, both with a maximum binding capacity of 100 RU. Analyte concentrations were 1, 2, 5, 10, 20, 50, 100, 200, 500, and 1000 nM. Binding curves were calculated for 1000 s of association and 1000 s of dissociation, and normally distributed noise of 1RU was added. The data were modeled as a two-dimensional distribution of affinity and on-rate constants, using a grid of 15 on-rate constants between 5 × 10⁴ and 1 × 10⁶/Ms, and a grid of 15 KD values between 1 nM and 1 μM, and with TP regularization on a confidence level of 0.9. Included in the model were independent baseline offsets for the association and dissociation phases at all concentrations. (Top) Simulated data. (Middle) Residuals of the fit. (Bottom) Contour lines of the distribution (solid lines), interpolated by MATLAB with 10 equally spaced contour levels between 2.1 and 22 RU. The kon–KD grid underlying the distribution is indicated (dotted lines). The parameters of the two sites underlying the simulated data are indicated (crosses).
FIGURE 3.
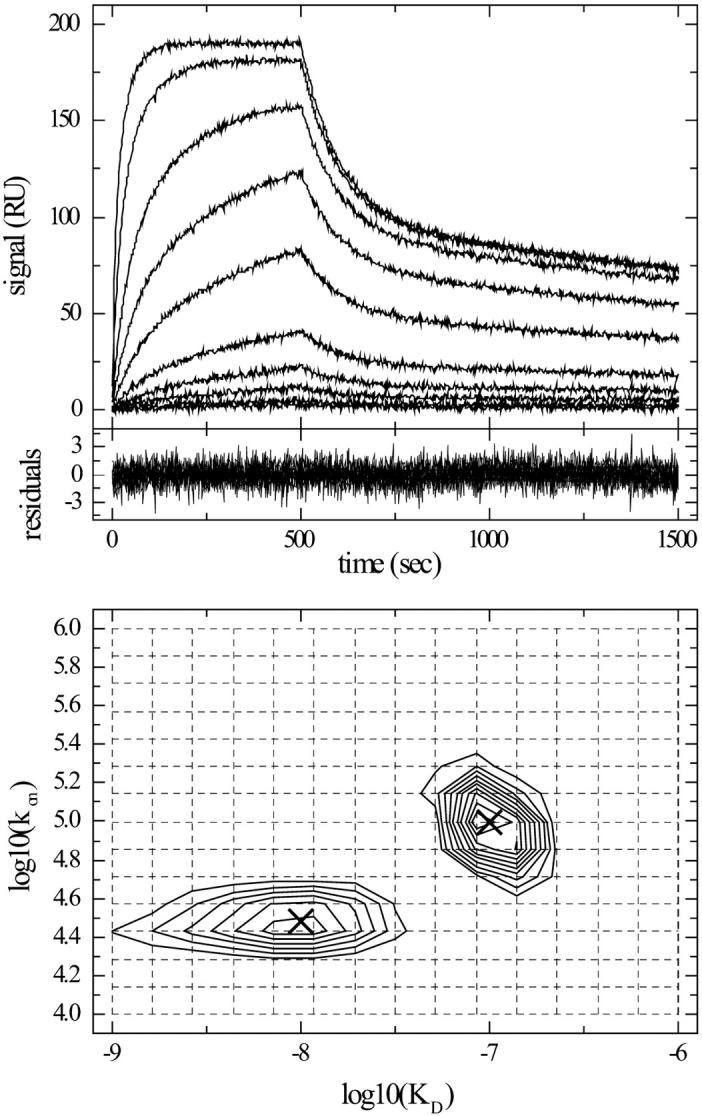
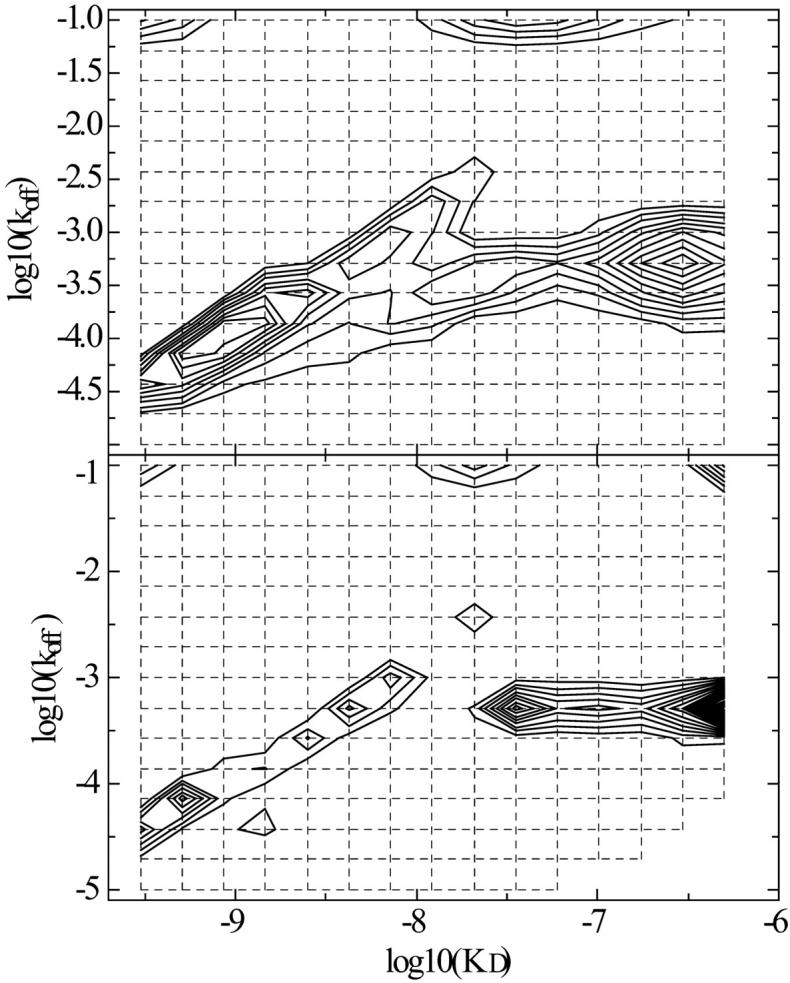
On-rate constant and affinity distribution analysis of simulated data with low rate constants and short association times. Surface binding data were simulated as in Fig. 2, but with lower kinetic constants for the high affinity site (KD = 10, kon = 3 × 10⁴Ms) and with only 500 s contact time, under otherwise identical conditions as in Fig. 2. The data were modeled as a two-dimensional distribution of affinity and on-rate constants, using a grid of 15 on-rate constants between 104 and 106/Ms, and a grid of 15 KD values between 1 nM and 1 μM. Included in the model were independent baseline offsets for the association and dissociation phases at all concentrations. (Top) Simulated data. (Middle) Residuals of the fit. (Bottom) Contour lines of the distribution (solid lines), interpolated by MATLAB with 10 equally spaced contour levels between 1.83 and 18.3. The kon-KD grid underlying the distribution is indicated (dotted lines). The parameters of the two sites used for generating the simulated data are indicated (crosses).
The inverse situation of distributions of analyte binding to a single class of surface sites, as outlined in the Appendix, was also studied with simulated data. Theory predicts that when each species is at steady state, the resulting total equilibrium isotherm does not contain any information about the analyte distribution, because it is identical to the isotherm of a single class of sites with an average binding constant. In contrast, kinetic surface binding of heterogeneous analyte mixtures cannot be described as a single interaction. The information carried in surface binding progress curves was tested with simulated data from two analyte species with the same rate constants, total analyte concentrations, and maximum signal-to-noise ratio as used in Fig. 2 above. The surface binding kinetics of a distribution of analytes was calculated on the basis of a 5 × 9 grid of on-rate constants (5 × 10³–5 × 10⁵/Ms) and affinity constants (106/M–109/M), using Eqs. A7 and A8. We initialized the distribution uniformly and employed a Levenberg-Marquardt algorithm to optimize the fit to the simulated data. Surprisingly, under these conditions, an excellent fit was found with an almost uniform distribution of analytes, indicating that a single set of surface binding progress curves does not provide sufficient information for the identification of the two species underlying the simulation (data not shown).
However, a characteristic feature of distributions of analytes binding to a single class of surface sites is the competitive displacement of fast-binding, low affinity analytes by slower-binding, higher affinity analytes. Therefore, the dissociation kinetics can strongly depend on the contact time, and data sets at different contact times can serve as an additional source of information (Fig. 4). Additionally, we increased the signal-to-noise ratio to 1000 (maximum capacity 500 RU with a noise of 0.5 RU). Under these conditions, a global regression of the data in Fig. 4 on a coarse 5 × 5 grid of on-rate and affinity constants (3 × 10⁴–1 × 10⁵/Ms and 3.3 × 10⁶/M–3.3 × 108/M), again initialized with a uniform distribution, converged to the correct bimodal analyte distribution (data not shown). Unfortunately, with increasing grid size, solving the differential equations for the distributions becomes more time-consuming, and higher parameter correlation was observed when modeling the distributions to the binding progress curves. However, our results indicate that, at least in principle, information on distributions of ligands may be obtained from a set of surface binding progress curves recorded at different concentrations and contact times. We have not further optimized the analysis of analyte distributions beyond this demonstration of principle, and instead examined the practical application of the computationally simpler analysis of ligand distributions.
FIGURE 4.

Simulated surface binding data for two classes of analyte (KD = 10 and 100 nM, and kon = 2 × 10⁵ and 1 × 10⁵/Ms) binding competitively to a single class of surface sites. Data were calculated for a maximum binding capacity of 500 RU, at concentrations of 3, 10, 30, 100, 300, and 1000 nM. For all concentrations, three contact times were used: 30 s (dotted lines), 150 s (dashed lines), and 500 s (solid lines). (The association progress of the experiment at the different contact times is identical, except for the simulated noise.)
For the analyses of experimental data from a commercial BIAcore X surface plasmon resonance biosensor with the ligand distribution model, we have used off-rate and dissociation equilibrium constant distributions, covering a range wide enough, and with a grid fine enough, so that the rms deviation of the fit was independent on the grid. We found it important to avoid very high and very low off-rate constants that correlate with the unknown baseline offsets. As a first test, we modeled experimental binding curves of myoglobin binding to a monoclonal antibody immobilized in the carboxymethyl dextran matrix of a CM5 sensor chip (Figs. 5–7) (Roden and Myszka, 1996; Schuck et al., 1998). An experiment similar to Fig. 5 has been suggested previously as an example for consistency with the model of a single class of sites (Roden and Myszka, 1996), although a larger data basis with longer contact times (Figs. 6 and 7) reveal the existence of lower affinity sites (Schuck et al., 1998) (see below). A single site model for the data of Fig. 5 has a global minimum at a KD of 3.2 nM and koff = 4.4 × 10⁻⁴/s, with an rms error of 0.68 RU, and a local minimum at a KD of 550 nM and koff = 3.3 × 10⁻⁴/s (rms error 1.05 RU). The ligand distribution model calculated with TP regularization led to an rms error of 0.68 RU (Fig. 5), with a very broad distribution. The short contact times lead to small curvature of the binding kinetics, and accordingly, to very limited information content of the experimental data.
FIGURE 5.
(Top) Experimental kinetic data (x) of myoglobin at concentrations of 4, 12.2, 37, 110, and 330 nM binding to monoclonal antibody immobilized in the carboxymethyl dextran matrix of a CM5 sensor chip at a flow rate of 30 μl/min. (For details on the experimental methods, see Schuck et al., 1998.) Best fit binding kinetics (dashed bold line) from modeling with a koff–KD distribution in the range from koff = 0.1–10−5/s and KD between 0.3 and 500 nM, are calculated with TP regularization, and include the start times of the association and the baselines of the association and dissociation phases as unknowns. Regularization on a confidence level of 0.9 was used. (Middle) Residuals of the best fit, which has an rms deviation of 0.68 RU. (Bottom) Interpolated contour lines of the koff–KD distribution. The 15 × 15 grid of koff and KD values, underlying this model, is indicated (dotted lines). The calculated maximum binding capacity is 132 RU. Integration of the broad high affinity peak gives a binding capacity of the high affinity site of 116 RU, and an average koff = 3.0 × 10⁻⁴/s and an average KD = 63.7 nM.
FIGURE 7.
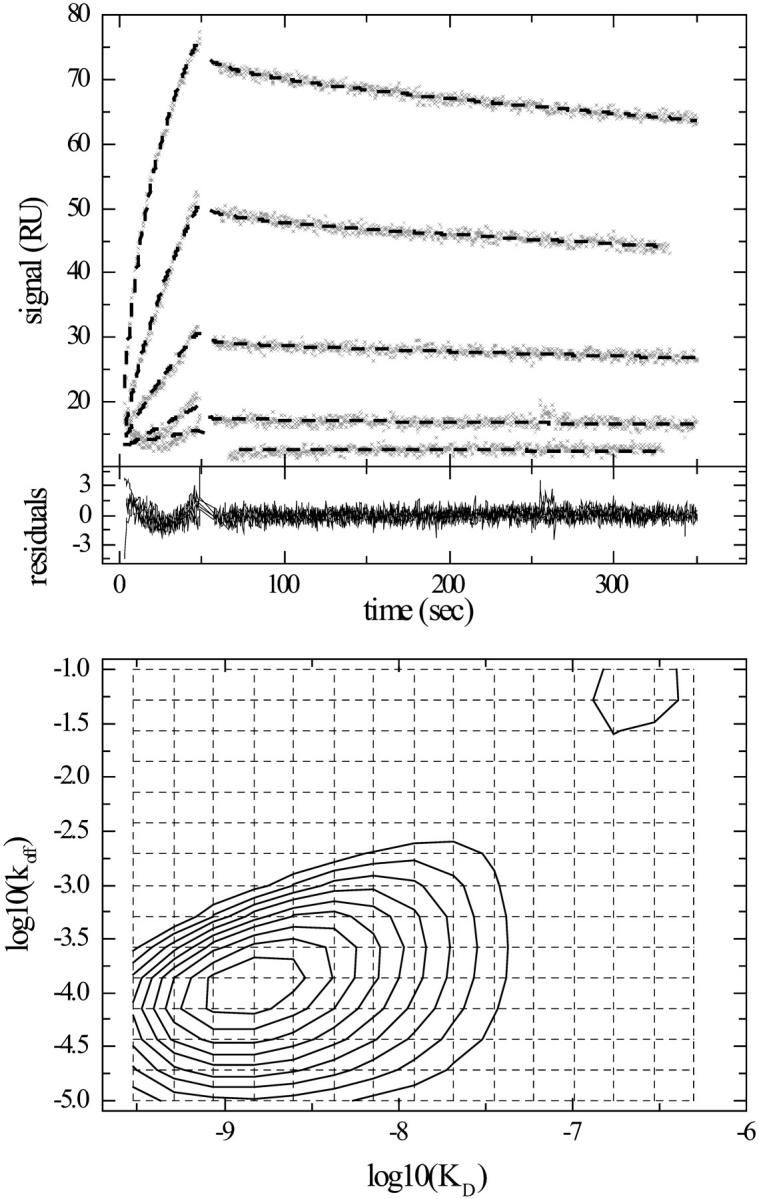
Distribution analysis of myoglobin binding kinetics to the same surface as in Fig. 6, but with lower concentration range and longer contact times. (Top) Experimental kinetic data (x) of myoglobin at concentrations of 4, 12.2, 37, 110, and 330 nM binding, at a flow rate of 1 μl/min. The data were modeled with the same distribution model as in Figs. 5 and 6. Best fit binding curves are shown (dashed bold line). (Middle) Residuals of the best fit, which has an rms deviation of 0.8 RU. (Bottom) Interpolated contour lines of the koff–KD distribution. The calculated maximum binding capacity is 288 RU. Integration around the high affinity peak gives a binding capacity of the high affinity site of 59 RU, a weight average koff = 8.1 × 10⁻⁵/s, and a weight average KD = 0.72 nM. When using ME regularization, the high affinity site has a binding capacity of 41 RU, an average koff = 5.7 × 10⁻⁵/s, and an average KD = 0.50 nM.
FIGURE 6.
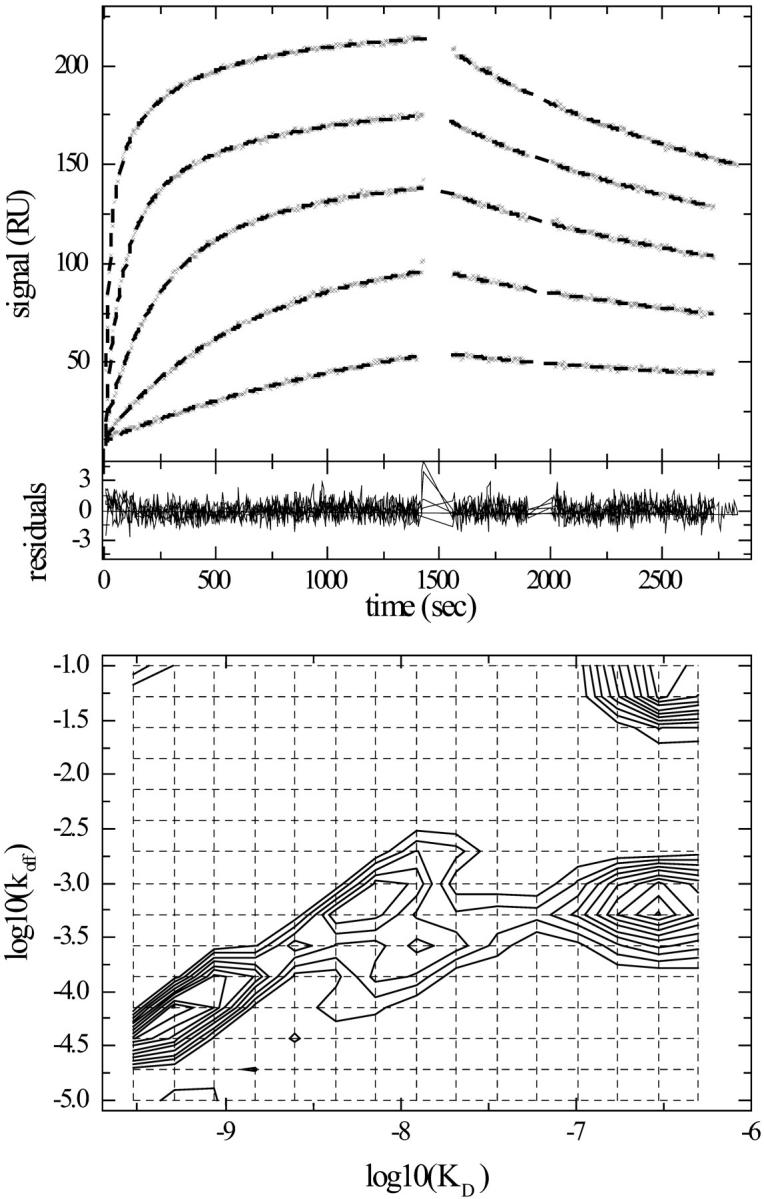
Distribution analysis of myoglobin binding kinetics to surface immobilized sites under similar conditions as in Fig. 5, but with longer contact times and a larger concentration range. (Top) Experimental kinetic data (x) of myoglobin at concentrations of 4, 12.2, 37, 110, 330, and 990 nM binding to monoclonal antibody immobilized in the carboxymethyl dextran matrix of a CM5 sensor chip at a flow rate of 30 μl/min. The data were modeled with the same distribution model as in Fig. 5. Best fit binding curves are shown (dashed bold line). (Middle) Residuals of the best fit, which has an rms deviation of 0.53 RU. (Bottom) Interpolated contour lines of the koff–KD distribution. The calculated maximum binding capacity is 197 RU. Integration of the distribution inside a polygon drawn around the high affinity peak gives a binding capacity of the high affinity site of 96 RU, an average koff = 1.9 × 10⁻⁴/s, and an average KD = 2.0 nM.
This example displays an important property of the regularization: because the regularization selects the smoothest distribution consistent with the data, data with limited information content result in very broad distributions. Interestingly, when ME regularization is used, an alternative fit of the same quality was identified with a single, broad peak at the corner of the koff–KD plane with the highest KD and lowest koff value. However, the total binding capacity was unrealistically high, significantly exceeding the possible signal as judged by the amount of immobilized antibody. Clearly, the molecular binding properties are ill-defined from such limited data sets, and different results from the two regularization methods reflect the different prior assumptions about the shape of the distribution (smoothness versus high information entropy).
When the contact time and the concentration range are extended, more details of the rate and affinity constant distribution emerge. As shown in Fig. 6, the distribution gives an excellent fit and exhibits a peak in the range of KD ∼ 0.5 nM, koff ∼ 7.2 × 10⁻⁵/s and kon ∼ 1.3 × 10⁵/Ms (because of the skewed peak, the average KD is 2 nM), but it also shows the presence of lower affinity sites with a peak at KD ∼ 40–60 nM (kon ∼ 104/Ms), as well as a peak at KD ∼ 500 nM. Because the highest analyte concentration used in this experiment was only 990 nM, these latter very low affinity sites are likely ill-defined. For comparison, when we applied the ME regularization, we found a distribution that is again dominated by low KD-low koff sites with unreasonably large binding capacities (data not shown). However, when the low KD-low koff sites were excluded from the model, a distribution very similar to Fig. 6 was obtained with a high affinity peak with KD = 1.7 nM and kon = 1.2 × 10⁵/Ms and medium affinity sites with 56 nM and kon = 1.2 × 10⁴/Ms, consistent to the results from TP regularization.
We believe that this range of affinities reflects a true heterogeneity of the ligand population at the biosensor surface in this experiment. Likely, they are generated by artifacts from the immobilization, which was amine coupling into a carboxymethyl dextran matrix. Another factor that could contribute to heterogeneity is the different physical environment at different depths of the dextran matrix, which can be expected to be of increasing density closer to the gold surface.
To explore the reproducibility of the calculated distribution and the dependence on experimental conditions, we analyzed another data set from the same surface, but with still longer association times (Fig. 7) and compared the results to those shown in Fig. 6. Several points are noteworthy: the high affinity site appears well reproduced with a slightly narrower peak, and the medium affinity sites appear to have more structure and details. However, the low affinity sites in the range of 300–500 nM are not well-reproduced in Fig. 7, which is most likely due to the threefold lower maximal concentration (330 nM) of the data in Fig. 7. It appears that the information on the site with low affinity and low rate constant is contained in the small sloping of the association-binding curves at high concentration and long contact times. The kinetic contribution from the low-affinity species with high rate constant, on the other hand, has essentially decayed for most of the experimental data, and is therefore relevant only for the modeling the data shortly after start and end of the contact period and otherwise highly correlated with the parameters for the baseline offsets. The peak position of both of these species with low affinity is not well-defined, since a distribution model where the KD values are constrained to a maximum of 100 nM leads to an rms deviation that is only 0.03 RU higher (although it does reproduce two peaks at KD values of 100 nM, data not shown).
This comparison illustrates that distribution analysis greatly benefits from long contact times. Also, it highlights that sites with KD values significantly higher than the highest applied analyte concentration may not be reliably characterized. Importantly, however, the high affinity sites appear well-defined and reproducible. That the differences in Figs. 6 and 7 are not due to the significantly lower flow rate that was used in the experiment of Fig. 7 is ruled out by a global analysis of both data sets of Figs. 6 and 7 jointly. Global analysis gives an excellent fit, and the distributions are consistent with the previous results, indicating a high affinity site with KD ∼ 0.5–1 nM and koff ∼ 0.8–1×10⁻⁵/s, in addition to a range of medium affinity and low affinity sites (Fig. 8).
FIGURE 8.
Joint global analysis of the myoglobin surface binding kinetics shown in Figs. 6 and 7. The same grid for the koff–KD distribution was used as in the separate analyses, but using baseline parameters in the association and dissociation phase as local parameters. (Top) Results from TP regularization, which gave an rms deviation of 0.87 and 0.94 RU for the data shown in Figs. 6 and 7, respectively. The calculated total binding capacity is 253 RU. Integration around the high affinity peak gives a binding capacity of the high affinity site of 62 RU, an average koff = 7.8 × 10⁻⁵/s, and an average KD = 0.72 nM. (Bottom) Results from ME regularization excluding sites with kon < 100/Ms; the calculated total binding capacity is 263 RU, with a high affinity site of 43 RU, koff = 6.0 × 10⁻⁵/s, and an average KD = 0.50 nM.
As a second experimental system, Fig. 9 shows the application to a Fab fragment of a variant of the mAb CC49 (Muraro et al., 1988) binding to immobilized bovine mucin. The CC49 antibody recognizes TAG-72, a tumor-associated glycoprotein. The primary CC49 epitope on TAG-72 is the trisaccharide Galβ(1–3)[NeuAcα(2–6)]GalNAc, but it also recognizes, although with lower affinity, clusters of the disaccharide structure [NeuNAcα(2–6)]GalNAc, linked to serine or threonine side chains (Hanisch et al., 1989). Both the disaccharide and the trisaccharide structures are also present in bovine and ovine submaxillary mucins (Reddish et al., 1997). Therefore, the interaction of the Fab with immobilized mucin is an example where intrinsically multiple classes of ligand are present. Accordingly, a fit with a pseudo-first-order model of a single site leads to a poor fit (rms deviation = 4.7 RU, not shown). The distribution model leads to an acceptable fit of the data (rms deviation 0.98 RU), and displays two peaks, one corresponding to higher affinity sites with KD ∼ 500 nM and one with approximately four-to-fivefold lower affinity and approximately tenfold faster off-rate constant. We attribute these sites to the trisaccharide and disaccharide structures, respectively. Interestingly, a fit with two discrete classes of ligand sites converges to similar parameters, but at the significantly higher rms deviation of 1.43 RU, suggesting that the tri- and disaccharides may not all be homogeneous in their binding properties or accessibility, and that the continuous distribution may be a better description.
FIGURE 9.
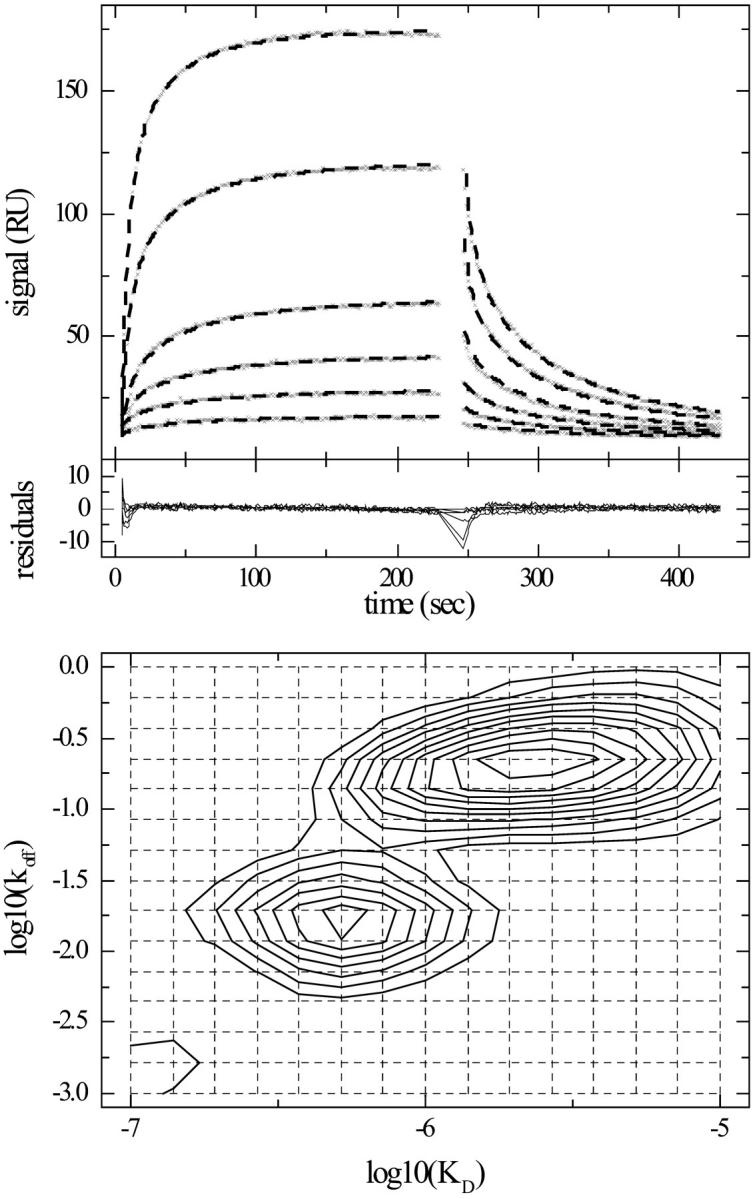
Surface binding data and distribution analysis of a Fab fragment of a variant of mAb CC49 binding to immobilized bovine mucin. The mucin was immobilized using standard amine coupling to CM5 carboxymethyl dextran chips in the BIAcore X surface plasmon resonance biosensor (Schuck et al., 1999). (Top) Experimental kinetic data (x) of Fab fragment at concentrations of 25, 50, 100, 200, 400, and 800 nM. The best fit distribution model is shown as dashed line. (Middle) Residuals of the fit, with an rms deviation of 0.98 RU. (Bottom) Interpolated contour lines of the koff –KD distribution. The 15 × 15 grid of koff and KD values underlying this model is indicated as dotted lines. The calculated maximum binding capacity is 397 RU.
So far, we have examined ligand distributions known to be heterogeneous. Next, we studied how the model can fit surface binding kinetic data that are governed by other processes. This is of concern because of the large numbers of parameters introduced in the distribution model, and because the source of apparent complexity in the binding kinetics may not be known a priori.
First, we simulated binding curves of two analytes competitively binding to a single class of surface sites, with binding parameters and under conditions as shown in Fig. 2. The modeling with a koff–KD distribution of ligands resulted in a single peak at an average KD, but with a poor fit and systematic residuals with rms deviation of 2.42 RU (data not shown). This shows that despite the large numbers of parameters in the ligand distribution model, the set of surface binding data that can be modeled well is limited, and that the quality of fit may serve as an indicator if the ligand distribution is an appropriate model.
Second, we examined the behavior of the ligand distribution when applied to transport limited data. Fig. 10 shows the observed kinetics of hen egg lysozyme binding to D1.3 antibody. This interaction is well-understood (Ward et al., 1989; Sundberg and Mariuzza, 2002) and one would expect a simple 1:1 pseudo-first-order reaction kinetics. However, the experimental surface binding data are strongly transport limited. The best fit koff–KD distribution model has an rms deviation of >20 RU, clearly unacceptable (Fig. 10). As a consequence, the calculated distribution is not meaningful (data not shown). More difficult is the detection of moderately transport influenced binding, in particular when the available data cover only a small concentration range: Fig. 11 shows data from a study of G-protein subunit interactions (Gβγ binding to immobilized biotinylated Giα) (Rebois et al., 2002). As described previously, the kinetic traces do not conform to a single site model, but in solution competition experiments a KD of ∼ 15 nM was measured (Rebois et al., 2002). The binding kinetics can be described by a single site compartment model for binding and transport with a KD of 50.6 nM. This is in reasonable agreement with the binding constant in solution, and the rms deviation of the fit is 0.91 RU (Fig. 11 B). If a distribution model is applied without accounting for the transport limitation, a significantly worse fit is observed, with an rms deviation of 1.48 RU and clearly systematic residuals (Fig. 11 C). However, the rms deviation is not as high as with the other impostor applications of the distribution. It should also be noted that the calculated distribution (Fig. 11 D) is not consistent with the binding parameters as judged from the solution competition data and from the fit with the transport limited single site model. To analyze this situation further, we simulated data on the basis of the best fit, transport limited single site compartment model, but using a threefold higher concentration range and double the contact and dissociation times. Now, the impostor application of the distribution model resulted in an rms deviation of 1.9 RU, and the resulting distribution displayed a single peak at the correct KD, although at 60% too low off-rate constant (data not shown). This highlights again that the distribution analysis benefits from a large concentration range and long contact times. It also shows the importance of independent, experimental identification of transport limited binding.
FIGURE 10.

Binding kinetics of hen egg lysozyme binding to D1.3 antibody immobilized by amine coupling in a carboxymethyl dextran matrix of a CM5 chip. Standard immobilization procedures were used (Schuck et al., 1999). Lysozyme (Worthington) was diluted into the standard HEPES-buffered saline running buffer at concentrations of 2.5, 5, 10, and 25 nM, and applied at a flow rate of 5 μl/min. The experimental data (x) were modeled with a koff–KD distribution with a 15 × 15 grid covering a KD range from 0.1 nM to 10 μM, and a koff range from 10−5/s to 1/s. Best fit model is shown (dashed line). The rms deviation of the fit is 23.3 RU.
FIGURE 11.
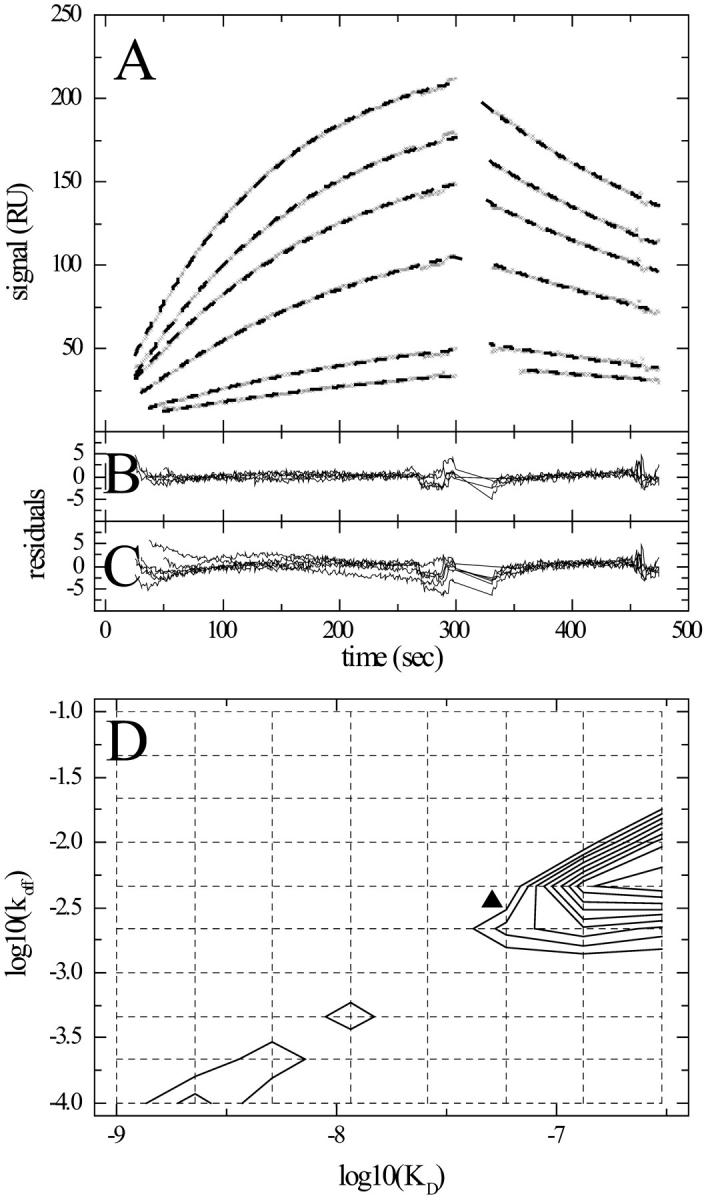
Binding kinetics of Gβγ binding to immobilized biotinylated Giα (data taken from Rebois et al., 2002). (A) Experimental data (x) of Gβγ at concentrations of 10, 20, 40, 60, 80, and 100 nM, applied at flow rates of 1 μl/min. (For experimental details, see Rebois et al., 2002.) A single site model of transport influenced binding based on a compartment model (dashed lines) converges to Kd = 50.6 nM, koff = 3.5 × 10⁻³/s, log10(kt) = 7.7, and a maximal binding capacity of 282 RU. (B) Residuals of the single transport limited site model, with an rms deviation of 0.91 RU. (C) Residuals of a ligand distribution model, with an rms deviation of 1.49 RU. (D) Contour lines of the calculated best fit ligand distribution (solid lines). The koff–KD grid is indicated (dotted lines). The calculated total binding capacity is 570 RU. For comparison, the koff and KD values from the single transport limited site model are shown (triangle).
DISCUSSION
The quantitative interpretation of surface binding kinetics for the study of protein interactions can be a very difficult task. The homogeneity of the analyte and the immobilized ligand is a critical factor, since, in both cases, molecules with different binding properties can easily generate relative signal contributions that are amplified and become significantly larger than their relative population, or even dominate the observed kinetics. Heterogeneity of the surface sites may be introduced by nonspecific immobilization chemistry, nonuniform orientations of the macromolecules, conformational changes due to the immobilization, the use of an immobilization matrix that makes the sites differentially accessible to the analyte, or it may be intrinsic to the system under study. Additional difficulties can be the transport of the analyte to the surface sites, which may in extreme cases completely govern the surface binding kinetics, or possibly the existence of multiple conformational states and transitions that cause complex chemical binding kinetics. In the majority of applications using optical biosensors to quantitatively characterize protein interactions found in the published literature, the data are not well-described by an ideal pseudo-first-order reaction (Karlsson et al., 1994), showing the importance of considering complicating factors, but also indicating the opportunity to gain more information from these experiments. Unfortunately, however, one of the main mathematical difficulties of modeling surface binding is that the data are noisy exponentials or similarly smoothly decaying functions, and many different models for more complex reaction kinetics may fit the data similarly well (Glaser and Hausdorf, 1996). The present work addresses this problem and explores methods that account in a very general way for effects of analyte or ligand heterogeneity, provided other complicating factors are absent (see below).
Situations where the surface binding is characterized by a distribution of analytes with different binding properties are abundant and of great importance. We have explored if it is possible to formulate a model useful for analysis of such situations. For the study of proteins, beyond the description of analyte macromolecules that are intrinsically heterogeneous due to variability in primary sequence, conformation, or glycosylation, such a model would be required for the binding of a polyclonal population of antibodies to an antigen located on a cell membrane, viral envelope, or manmade surface. It may also be interesting, for example, to use an optical biosensor assay for the study of the evolution of the affinity and kinetic properties of whole ensembles of macromolecules, such as polyclonal mixtures of immunoglobulins. However, analyte distributions are very difficult to unravel. In a different context, Rusch and co-workers have approached the problem for equilibrium binding of two analyte species that interact with a distribution of surface sites (Rusch et al., 1997). Unfortunately, their results are not applicable to the problems considered here, because they require independent variation and detection of both analyte species, which is not possible with optical biosensors and when working with preexisting unknown mixtures of polydisperse analytes. In this situation, the equilibrium isotherms are indistinguishable from that of a single site with average affinity. However, optical biosensors can measure the binding kinetics, which our results suggest can carry sufficient information to characterize an analyte distribution binding to a single class of surface sites, provided that a sequence of surface binding and dissociation data at different total analyte concentrations and different contact times are available. Improvement in the instrumental signal-to-noise ratio and refinement of the computational approaches could make the characterization of analyte distributions practical.
Much simpler in theory and practical implementation are analyses of distributions of surface sites interacting with a single class of analyte. The situation of distribution of surface sites may not be uncommon (Rabbany et al., 1997; Vijayendran and Leckband, 2001), in particular when considering that nonspecific amine coupling of proteins into a surface-attached hydrogel is the immobilization strategy most widely used in conjunction with surface plasmon resonance biosensing. Many studies have revealed different degrees of heterogeneity of the immobilized sites with other immobilization chemistries and surfaces (Anderson et al., 1997; Narang et al., 1997; Vijayendran and Leckband, 2001), and optimization of protein immobilization for stable and uniform activity is a very active and important area of research (Hodneland et al., 2002). But even with ideal immobilization conditions, there are many examples where the immobilized molecules intrinsically would represent an ensemble with different binding properties (Fig. 9).
The surface binding kinetics to such heterogeneous surfaces is a simple linear superposition of the independent binding processes of different subpopulations, and commonly multiple-site models are applied for their analysis. A key difference of the approach studied in the present article is that it does not require an ad hoc assumption about a specific number of discrete sites (usually two), and instead is based only on the much weaker assumption that there could be heterogeneity of sites with rate and affinity constants in a certain range. Further, it does not employ nonlinear regression, where typically multiple-site models converge with strong dependence on good initial parameters, which in practice are difficult to obtain. The present method uses regularization to calculate the simplest distribution that can fit the data within a predefined confidence interval. This procedure adjusts the resolution of the distribution automatically to the noise level and information content of the data, and thereby reduces the risk of overinterpreting the data. As illustrated in several examples, where the underlying model of ligand heterogeneity is applicable, excellent fits of the data can be obtained with residuals in the order of the noise of the data acquisition.
For the computation of the distribution of rate and affinity constants, we have adapted an approach for the inversion of integral equations by regularization that was initially introduced for the analysis of autocorrelation functions in dynamic light scattering (Provencher, 1979), and is implemented in the program CONTIN (Provencher, 1982a,b). It is designed to address the problem of instability that is encountered in the inversion integral equations by use of Tikhonov-Phillips (TP) regularization (Phillips, 1962; Hansen, 1998), and its potential and limitation are well-understood (Provencher, 1992). In this context, it should be noted that the optical biosensor data usually have relatively high signal-to-noise ratios, which slightly improves some of the problems usually encountered with unraveling exponentials. TP regularization is widely used for the calculation of affinity distributions from binding isotherms, for example, in chemical surface adsorption processes in the gas or liquid phase and the study of surface heterogeneity (Koopal and Vos, 1993; Jagiello, 1994; Mamleev and Bekturov, 1996; Puziy, 1999; Gun'ko et al., 2001), ion exchange at surfaces (Haber-Pohlmeier and Pohlmeier, 1997), and has also found application in the biosensor field, for example, in the estimation of blood glucose with glucose biosensors (Freeland and Bonnecaze, 1999).
We have also implemented maximum entropy (ME) regularization, which is widely used, for example, in the analysis of decay times in autocorrelation functions (Livesey et al., 1986), time-resolved fluorescence (Brochon, 1994; van der Heide et al., 2000; Steinbach et al., 2002), enthalpy distributions (Poland, 2001a), thermodynamic distributions in ligand binding (Steinbach, 1996; Poland, 2001b), distribution of dissociation rate constants (Stanley et al., 1994), diffusion corrected sedimentation coefficient distributions in analytical ultracentrifugation (Schuck, 2000), and other biophysical disciplines. ME was found to result in sharper peaks if a few discrete species are present, but to exhibit some instability for broad distributions (Amato and Hughes, 1991; Provencher, 1992; Schuck et al., 2002). The comparison between the distributions from TP and ME regularization appears very useful to determine how much of the result is governed by the different prior assumptions. Although in the practical applications studied here, the ME method favored fits with very large binding capacities of very low affinity sites, in practice, these could be excluded from the fit by a more stringent choice of the distribution range (or can be avoided in experiments with a larger concentration range).
It should be straightforward to extend the ME method to incorporate prior expectation values for the distribution (Press et al., 1992), which may reflect known or suspected properties of the binding sites. If it is safe to make the additional assumption that the surface sites are few and discrete, one could also use the calculated distribution to initialize a discrete multiple site model with a rational choice of the number of species and the initial values of the parameters for nonlinear regression. In principle, techniques to integrate multiple discrete site models with ME regularization (Steinbach et al., 2002) should also be directly applicable.
One of the key questions will be how much detail can be obtained from the experimental data, and which experimental conditions result in a well-defined distribution. We found that long contact times are crucial. In practice, when using a microfluidics with an injection loop of fixed volume, of such as incorporated in the BIAcore systems, constraints may exist in the length of the possible analyte contact times, in particular at flow rates sufficiently high to avoid mass transport limitation. However, this problem can be addressed effectively with the oscillating flow technique, in which a very small and recoverable sample volume is subjected to a back-and-forth movement at high flow rates (Abrantes et al., 2001).
A second important factor for generating data sets suitable for the proposed analysis is a wide concentration range. In all the examples we studied, we found it difficult to characterize binding sites with equilibrium dissociation constants far above the highest analyte concentration used. For the data analysis, this poses the problem of defining a good range for the distribution, which is large enough to encompass all binding constants necessary to describe the data, but not too large to produce artificial peaks with large binding capacities at affinities that are outside the dynamic range and remain essentially unpopulated at the experimental concentrations. In our experience, the rms deviation of the fit for a given distribution range and the total binding capacity can be helpful as a guide. However, even if low affinity sites are essential for a good fit, yet cannot be well-characterized in the distribution, our results show that the high affinity sites can remain unaffected by this.
It could be argued that by incorporating into the model the flexibility to describe the possibly present low affinity sites, an unbiased analysis of the characteristic features of the high affinity sites is made possible. Accordingly, one possible strategy to utilize the distribution analysis is to model the data in the s(c,t) domain well and with a large distribution model, to transform them into a c(koff, KD) surface, and then to interpret the resulting peaks in terms of interactions of interest, likely immobilization artifacts, or ill-defined distribution regions. This differs fundamentally from the use of a one- or two-sites' model to fit directly the s(c,t) data, which frequently results in a significantly worse fit, and in binding constants that may represent only some averages over the distribution or subpopulations. The ad hoc definition of regions of interest directly in the s(c,t) data domain to improve the fit to a single site model can, in theory, result in binding constants far outside the range of any of the subpopulations.
We have used the interaction of myoglobin to a surface immobilized monoclonal antibody to illustrate the distribution analysis. A high-affinity site with sub-nM affinity was reproducibly identified, in the presence of a range of lower affinity sites, which were possibly generated by the random immobilization chemistry, and/or by differences in the physicochemical microenvironment of different sites within the immobilization matrix. Interestingly, data with an experimental design with short contact times very similar to Fig. 5 were used to demonstrate that surface binding kinetics can be modeled with an ideal pseudo-first-order kinetics of a single site, arguing that surface-related effects on the interaction are absent (Roden and Myszka, 1996). We have shown previously that in our experiments, longer contact times reveal the existence of lower affinity sites (Schuck et al., 1998). In comparison, as noted above, the regularization used in the distribution analysis automatically produces a very broad peak for the data with short contact times (Fig. 5), and provides more detail only at longer contact times (Figs. 6 and 7). Not surprisingly, the rms deviations of the fits in the distribution models were smaller throughout than those of the single site or two site models, respectively. The equilibrium dissociation constants that we obtained earlier from the two-site fits were similar for the data shown in Fig. 6, and slightly higher for the data of Fig. 7. In Schuck et al. (1998), we have taken the difference in the binding constants from the two-site models as an indication of mass transport limitation. However, a global and consistent analysis of both data sets is possible with the distribution analysis (Fig. 8). This suggests that the differences in the parameters calculated with the two-site models may not be due to mass transport limitation, but rather due to limitations of the two-site model, which does not adequately represent the broader distribution of sites.
As mentioned above, the measured surface binding kinetics can be governed by factors other than ligand heterogeneity. In most situations that we studied, the ligand distribution model could not fit such data, provided sufficient contact times and concentration range. Therefore, the rms deviation of the distribution will be an important parameter to judge the trustworthiness of the distribution, and the magnitude and randomness of the residuals should be judged stringently. It is unclear how experimental limitations such as a decaying activity of the surface (Ober and Ward, 2002), incorrect analyte concentrations, or imperfect compensation for bulk effects (Ober and Ward, 1999) would influence the calculated distributions.
The influence of mass transport on the surface binding is of special importance (Glaser, 1993; Schuck, 1996; Schuck and Minton, 1996a; Yarmush et al., 1996; Myszka et al., 1998; Vijayendran et al., 1999; Wofsy and Goldstein, 2002). When applying the distribution analysis to data from strongly mass transport limited binding, very large residuals were obtained. This can be understood on the basis that no combination of exponential surface binding curves of the type Eq. 3 (at sufficient contact times) can produce a linear binding progress or even positive curvatures like those observed in Fig. 10. Nevertheless, when using experimental concentrations lower than KD, as was shown previously, excellent fits may be achieved even with discrete single-site or two-site models when applied to transport limited binding processes (Schuck, 1997a). Clearly, unrecognized mass transport limitation would, in such situations, also be misinterpreted with the distribution model.
It is possible to include a first-order approximation of mass transport influence in the distribution analysis, based on compartment models (Schuck and Minton, 1996a; Myszka, et al. 1998; Wofsy and Goldstein, 2002). Unfortunately, the large computational cost currently still limits this approach. However, although this could extend the range of distribution analysis into the regime of slightly transport influenced binding, it would not be applicable to the description of strongly transport controlled surface binding (Schuck and Minton, 1996a). The binding of lysozyme to the surface-immobilized D1.3 antibody (Fig. 10) is an example of such a case. The binding mode of this antibody is very well-understood and does not involve cooperative reactions (Ward et al., 1989; Sundberg and Mariuzza, 2002). Therefore, we attribute the positive curvature in the association phase to spatial gradients of saturation that transiently occur either within the immobilization matrix (Schuck, 1996) or parallel to the sensor surface (Yarmush et al., 1996), in combination with spatially inhomogeneous detection from the evanescent field of the surface plasmons and/or the lateral illumination profile of the surface. Clearly, such processes violate the assumptions of a compartment model under steady-state conditions. Interestingly, in the case of myoglobin, which is significantly less charged, the binding does not appear to be transport limited. This is consistent with previous studies showing the absence of effects of the immobilization matrix in this case (Karlsson and Fält, 1997). Besides differences in the on-rate constants of the antibodies, nonspecific binding properties and the net charge of the analyte may be important factors in determining the extent of interaction and transport limitation in the immobilization matrix (Schuck, 1996, 1997a; Piehler et al., 1999; Zacher and Wischerhoff, 2002). Thus, the importance of transport limitation will be strongly dependent on the system under study, and despite the potential to identify and, to a certain approximation, model transport influenced binding computationally, experimental controls seem to remain essential.
In summary, we propose that ligand heterogeneity can be taken into account using a model for continuous two-dimensional distributions of rate and affinity constants. Although more experience with other systems is needed to fully understand the potential and the limitations of the approach, the initial application to several model systems is promising, yielding excellent fits of the data and well-defined distributions if a suitable data basis can be used. By exploiting the full kinetic data set available, the obtained two-dimensional kinetic and affinity distributions have a higher resolution than corresponding affinity distributions based on the isotherm analysis alone. We believe this will provide a useful tool for probing the uniformity of protein immobilization, and for the study of protein interactions by optical affinity biosensors.
Acknowledgments
We thank R. Ober for many helpful discussions.
APPENDIX
Calculating the affinity and rate constant distributions of populations of surface sites
This section describes how Eq. 7 is solved. Since there is no analytical solution to the problem, we calculate an approximate P on a discrete lattice of kon and KA values, with (Nkon × NKA) grid points (kon,k, KA,l) with kon values between kon,min and kon,max, and KA values between KA,min and KA,max. (The parameterization can be easily transformed to other sets of variables, such as koff and KD.) The distribution values pkl = P(kon,k, KA,l)Δkon,kΔKA,l can be expressed as a vector p with Nmod = (Nkon × NKA) elements. Likewise, we can express the experimental data points sxp(cj,ti) at the Nt times ti and the Nc concentration values cj as a vector s with Ndat = (Nt × Nc) elements. The kernel in Eq. 7 can be evaluated on our kon–KA lattice for each time and concentration, and can be arranged in a Ndat by Nmod matrix and abbreviated as A. This leads to a least-squares problem. Adding a regularization term to stabilize the solution, we arrive at
 |
(A1) |
Obviously, positivity of the parameters is required to eliminate solutions with physically impossible negative surface concentrations. The constraint B(p) can be chosen to provide the most parsimonious distribution that gives a satisfactory fit to the data. Among the most widely applied regularization methods are maximum entropy (ME), which maximizes the information entropy of the solution (Smith and Grandy, 1985), or Tikhonov-Phillips (TP) regularization, which maximizes the smoothness of the solution (Phillips, 1962). Since they have slightly different properties, we have implemented both ME
 |
(A2) |
and TP regularization derived from the sum of the second derivative of the distribution as
 |
(A3) |
which can be expressed in discretized form as
 |
(A4) |
(Press et al., 1992) with D denoting the sum of the second difference matrices with respect to the directions kon and KA, respectively. The minimization Eq. A1 with ME regularization is a nonlinear problem, which in our implementation was solved with the Newton-based, large-scale optimization algorithm of MATLAB. In contrast, regularization Eq. A3 can be written as an equation system
 |
(A5) |
where positivity can be conveniently imposed using an adaptation for normal equations of the NNLS algorithm by Lawson and Hanson (1974).
The remaining problem is the adjustment of the regularization parameter λ. In our implementation, we chose the method described by Provencher (1982a,b). It is based on the fact that all values λ > 0 increase the χ2 value of the fit because the additional constraint forces the distribution from the (generally instable) least-squares optimum p(λ = 0). This allows use of a statistical criterion comparing the goodness of fit. The Fisher distribution predicts the ratio of χ2(λ)/χ2(0), and as a consequence, it is possible to adjust λ such that the probability of χ2(λ)/χ2(0) equals a predefined confidence level (in the present article, 0.9). One can take into account the effect of regularization on the degrees of freedom, derived from the singular values of A and D, as outlined by Provencher (1982a). With ME regularization, this effect was neglected. Other methods for estimating the regularization are possible (Hansen, 1998).
It is also possible to combine several experimental data sets into a joint global analysis. For example, multiple data sets with several analyte concentrations each may be available, with different contact times for different sets. Extending the summation of the least-squares expression to several experiments, it can be shown that global matrices (AAT)glob and (sAT)glob can be formed as a sum of local matrices (AAT)xp and (sAT)xp which can be separately calculated for each experiment. In our implementation in MATLAB (The Mathworks, Inc.), the baseline parameters were treated as parameters local to each experiment. An additional unknown local parameter was t0 in Eq. 3 for each concentration (this start time of the binding experiment is experimentally not well-defined). These parameters were optimized with a Levenberg-Marquardt algorithm in a series of distribution analyses.
In some cases, for example for severely mass transport limited surface binding, little useful information on the chemical kinetics can be derived. However, if the association phase is carried out for a sufficient length of time, one can still study the thermodynamics of surface binding and characterize the distribution of affinity constants. Again, regularization techniques can be used to obtain the simplest affinity distribution that is consistent with the experimentally measured binding isotherm, analogous to the approach outlined above (Haber-Pohlmeier and Pohlmeier, 1997).
Affinity and rate constant distributions of different subpopulations of analyte binding competitively to a single class of surface sites
In some cases, the existence of a single class of surface sites may be a good assumption, but the analyte may consist of subpopulations that differ in their surface binding properties. This is the reverse situation from that considered so far. In this case, we know the total concentration of analyte ctot applied (or usually a series of total concentrations) and would like to represent the analyte distribution as fractions P with
 |
(A6) |
such that Pdkon dKA is the partial concentration c(kon*, KA*) of an analyte with on-rate constants between kon* and kon* + dkon and with an affinity between KA* and KA* + dKA. The surface binding experiment can be modeled as the combined binding of all analyte populations
 |
(A7) |
If the surface sites have a maximum capacity Smax the rate equation for binding of the analyte subpopulation i with rate constants kon,i and koff,i can be written as
 |
(A8) |
This significantly differs from the pseudo-first-order rate equations in that all different analyte populations j compete for the same surface sites, and thus are not independent of each other. For example, analyte populations that bind to the surface more rapidly, and which may represent initially the most abundant population of surface-bound species, will, at longer contact times, be displaced from the surface sites by molecules that bind more slowly but with higher affinity. For the inverse problem of modeling data  solutions of Eq. A8 can be combined with a nonlinear regression algorithm to find the distribution of pi values that model the data best. In our implementation with MATLAB, we have included the total surface binding capacity Smax as an unknown parameter.
It is interesting to note the solutions of Eq. A8, when each species is at steady state, which leads to the familiar expression for the total signal stot as a function of ctot:
 |
(A9) |
Thus, for distributions of analytes binding to a single class of surface sites, the binding isotherm is indistinguishable from that of a single analyte with a weighted-average affinity of  Therefore, analyte distributions can only be characterized through analysis of their binding kinetics.
References
- Abrantes, M., M. T. Magone, L. F. Boyd, and P. Schuck. 2001. Adaptation of the BIAcore X surface plasmon resonance biosensor for use with small sample volumes and long contact times. Anal. Chem. 73:2828–2835. [DOI] [PubMed] [Google Scholar]
- Amato, U., and W. Hughes. 1991. Maximum entropy regularization of Fredholm integral equations of the first kind. Inv. Prob. 7:793–808. [Google Scholar]
- Andersen, P. S., P. Schuck, E. J. Sundberg, C. Geisler, K. Karjalainen, and R. A. Mariuzza. 2002. Quantifying the energetics of cooperativity in a ternary protein complex. Biochemistry. 41:5177–5184. [DOI] [PubMed] [Google Scholar]
- Anderson, G. P., M. A. Jacoby, F. S. Ligler, and K. D. King. 1997. Effectiveness of protein A for antibody immobilization for a fiber optic biosensor. Biosens. Bioelectron. 12:329–336. [DOI] [PubMed] [Google Scholar]
- Brochon, J. C. 1994. Maximum entropy method of data analysis in time-resolved spectroscopy. Methods Enzymol. 240:262–311. [DOI] [PubMed] [Google Scholar]
- Cooper, M. A. 2002. Optical biosensors in drug discovery. Nat. Rev. Drug Discov. 1:515–528. [DOI] [PubMed] [Google Scholar]
- Davis, S. J., S. Ikemizu, M. K. Wild, and P. A. van der Merwe. 1998. CD2 and the nature of protein interactions mediating cell-cell recognition. Immunol. Rev. 163:217–236. [DOI] [PubMed] [Google Scholar]
- Fägerstam, L. G., Å. Frostell, R. Karlsson, M. Kullman, A. Larsson, M. Malmqvist, and H. Butt. 1990. Detection of antigen-antibody interactions by surface plasmon resonance. Application to epitope mapping. J. Mol. Recognit. 3:208–214. [DOI] [PubMed] [Google Scholar]
- Freeland, A. C., and R. T. Bonnecaze. 1999. Inference of blood glucose concentrations from subcutaneous glucose concentrations: applications to glucose biosensors. Ann. Biomed. Eng. 27:525–537. [DOI] [PubMed] [Google Scholar]
- Garcia, K. C., C. G. Radu, J. Ho, R. J. Ober, and E. S. Ward. 2001. Kinetics and thermodynamics of T cell receptor-autoantigen interactions in murine experimental autoimmune encephalomyelitis. Proc. Natl. Acad. Sci. USA. 98:6818–6823. [DOI] [PMC free article] [PubMed] [Google Scholar]
- Gilligan, J. J., P. Schuck, and A. L. Yergey. 2002. Mass spectrometry after capture and small-volume elution of analyte from a surface plasmon resonance biosensor. Anal. Chem. 74:2041–2047. [DOI] [PubMed] [Google Scholar]
- Glaser, R. W. 1993. Antigen-antibody binding and mass transport by convection and diffusion to a surface: a two-dimensional computer model of binding and dissociation kinetics. Anal. Biochem. 213:152–161. [DOI] [PubMed] [Google Scholar]
- Glaser, R. W., and G. Hausdorf. 1996. Binding kinetics of an antibody against HIV p24 core protein measured with real-time biomolecular interaction analysis suggest a slow conformational change in antigen p24. J. Immunol. Methods. 189:1–14. [DOI] [PubMed] [Google Scholar]
- Gonzales, N. R., P. Schuck, J. Schlom, and S. V. Kashmiri. 2002. Surface plasmon resonance-based competition assay to assess the sera reactivity of variants of humanized antibodies. J. Immunol. Methods. 268:197–210. [DOI] [PubMed] [Google Scholar]
- Gun'ko, V. M., R. Leboda, V. V. Turov, F. Villieras, J. Skubiszewska-Zieba, S. Chodorowski, and M. Marciniak. 2001. Structural and energetic nonuniformities of pyrocarbon-mineral adsorbents. J. Colloid Interface Sci. 238:340–356. [DOI] [PubMed] [Google Scholar]
- Haber-Pohlmeier, S., and A. Pohlmeier. 1997. Kinetics and equilibrium of the ion exchange of Cd2+ at Na-montmorillonite: analysis of heterogeneity by means of the regularization technique CONTIN. J. Colloid Interface Sci. 188:377–386. [Google Scholar]
- Hall, D. 2001. Use of optical biosensors for the study of mechanistically concerted surface adsorption processes. Anal. Biochem. 288:109–125. [DOI] [PubMed] [Google Scholar]
- Hanisch, F. G., G. Uhlenbruck, H. Egge, and J. Peter-Katalinic. 1989. A B72.3 second-generation-monoclonal antibody (CC49) defines the mucin-carried carbohydrate epitope Gal beta(1–3) [NeuAc alpha(2–6)]GalNAc. Biol. Chem. Hoppe Seyler. 370:21–26. [DOI] [PubMed] [Google Scholar]
- Hansen, P. C. 1998. Rank-Deficient and Discrete Ill-Posed Problems. SIAM, Philadelphia, Pennsylvania.
- Hodneland, C. D., Y. S. Lee, D. H. Min, and M. Mrksich. 2002. Selective immobilization of proteins to self-assembled monolayers presenting active site-directed capture ligands. Proc. Natl. Acad. Sci. USA. 99:5048–5052. [DOI] [PMC free article] [PubMed] [Google Scholar]
- Jagiello, J. 1994. Stable numerical solution of the adsorption integral equation using splines. Langmuir. 10:2778–2785. [Google Scholar]
- Karlsson, R., and A. Fält. 1997. Experimental design for kinetic analysis of protein-protein interactions with surface plasmon resonance biosensors. J. Immunol. Methods. 200:121–133. [DOI] [PubMed] [Google Scholar]
- Karlsson, R., H. Roos, L. Fägerstam, and B. Persson. 1994. Kinetic and concentration analysis using BIA technology. Methods Enzymol. 6:99–110. [Google Scholar]
- Kelley, R. F., and M. P. O'Connell. 1993. Thermodynamic analysis of an antibody functional epitope. Biochemistry. 32:6828–6835. [DOI] [PubMed] [Google Scholar]
- Khilko, S. N., M. T. Jelonek, M. Corr, L. F. Boyd, A. L. M. Bothwell, and D. H. Margulies. 1995. Measuring interactions of MHC class I molecules using surface plasmon resonance. J. Immunol. Methods. 183:77–94. [DOI] [PubMed] [Google Scholar]
- Koopal, L. K., and C. H. W. Vos. 1993. Adsorption on heterogeneous surfaces. Calculation of the adsorption energy distribution function or the affinity spectrum. Langmuir. 9:2593–2605. [Google Scholar]
- Lakey, J. H., and E. M. Raggett. 1998. Measuring protein-protein interactions. Curr. Opin. Struct. Biol. 8:119–123. [DOI] [PubMed] [Google Scholar]
- Langmuir, I. 1918. The adsorption of gases on plane surfaces of glass, mica and platinum. J. Am. Chem. Soc. 40:1361–1403. [Google Scholar]
- Lawson, C. L., and R. J. Hanson. 1974. Solving Least Squares Problems. Prentice-Hall, Englewood Cliffs, New Jersey.
- Livesey, A. K., P. Licinio, and M. Delaye. 1986. Maximum entropy analysis of quasielastic light scattering from colloidal dispersions. J. Chem. Phys. 84:5102–5107. [Google Scholar]
- Malmborg, A. C., and C. A. Borrebaeck. 1995. BIAcore as a tool in antibody engineering. J. Immunol. Methods. 183:7–13. [DOI] [PubMed] [Google Scholar]
- Mamleev, V. S., and E. A. Bekturov. 1996. Numerical method for analysis of surface heterogeneity in a case of finite diversity of adsorption sites. Langmuir. 12:3630–3642. [Google Scholar]
- McDermott, B. M., Jr., A. H. Rux, R. J. Eisenberg, G. H. Cohen, and V. R. Racaniello. 2000. Two distinct binding affinities of poliovirus for its cellular receptor. J. Biol. Chem. 275:23089–23096. [DOI] [PubMed] [Google Scholar]
- Muraro, R., M. Kuroki, D. Wunderlich, D. J. Poole, D. Colcher, A. Thor, J. W. Greiner, J. F. Simpson, A. Molinolo, P. Noguchi, and J. Schlom. 1988. Generation and characterization of B72.3 second generation monoclonal antibodies reactive with the tumor-associated glycoprotein 72 antigen. Cancer Res. 48:4588–4596. [PubMed] [Google Scholar]
- Myszka, D. G., X. He, M. Dembo, T. A. Morton, and B. Goldstein. 1998. Extending the range of rate constants available from BIACORE: interpreting mass transport influenced binding data. Biophys. J. 75:583–594. [DOI] [PMC free article] [PubMed] [Google Scholar]
- Myszka, D. G., R. W. Sweet, P. Hensley, M. Brigham-Burke, P. D. Kwong, W. A. Hendrickson, R. Wyatt, J. Sodroski, and M. L. Doyle. 2000. Energetics of the HIV gp120-CD4 binding reaction. Proc. Natl. Acad. Sci. USA. 97:9026–9031. [DOI] [PMC free article] [PubMed] [Google Scholar]
- Narang, U., G. P. Anderson, F. S. Ligler, and J. Burans. 1997. Fiber optic-based biosensor for ricin. Biosens. Bioelectron. 12:937–945. [DOI] [PubMed] [Google Scholar]
- Natarajan, K., L. F. Boyd, P. Schuck, W. M. Yokoyama, D. Eliat, and D. H. Margulies. 1999. Interaction of the NK cell inhibitory receptor Ly49A with H-2Dd: identification of a site distinct from the TCR site. Immunity. 11:591–601. [DOI] [PubMed] [Google Scholar]
- Natsume, T., H. Nakayama, O. Jansson, T. Isobe, K. Takio, and K. Mikoshiba. 2000. Combination of biomolecular interaction analysis and mass spectrometric amino acid sequencing. Anal. Chem. 72:4193–4198. [DOI] [PubMed] [Google Scholar]
- Nedelkov, D., and R. W. Nelson. 2000. Practical considerations in BIA/MS: optimizing the biosensor-mass spectrometry interface. J. Mol. Recog. 13:140–145. [DOI] [PubMed] [Google Scholar]
- Nieba, L., A. Krebber, and A. Pluckthun. 1996. Competition BIAcore for measuring true affinities: large differences from values determined from binding kinetics. Anal. Biochem. 234:155–165. [DOI] [PubMed] [Google Scholar]
- Nisonoff, A., and D. Pressman. 1958. Heterogeneity and average combining constants of antibodies from individual rabbits. J. Immunol. 80:417–428. [PubMed] [Google Scholar]
- O'Shannessy, D. J. 1994. Determination of kinetic rate and equilibrium binding constants for macromolecular interactions: a critique of the surface plasmon resonance literature. Curr. Opin. Biotechnol. 5:65–71. [DOI] [PubMed] [Google Scholar]
- O'Shannessy, D. J., and D. J. Winzor. 1996. Interpretation of deviations from pseudo-first-order kinetic behavior in the characterization of ligand binding by biosensor technology. Anal. Biochem. 236:275–283. [DOI] [PubMed] [Google Scholar]
- Ober, R. J., C. G. Radu, V. Ghetie, and E. S. Ward. 2001. Differences in promiscuity for antibody-FcRn interactions across species: implications for therapeutic antibodies. Int. Immunol. 13:1551–1559. [DOI] [PubMed] [Google Scholar]
- Ober, R. J., and E. S. Ward. 1999. The choice of reference cell in the analysis of kinetic data using BIAcore. Anal. Biochem. 271:70–80. [DOI] [PubMed] [Google Scholar]
- Ober, R. J., and E. S. Ward. 2002. Compensation for loss of ligand activity in surface plasmon resonance experiments. Anal. Biochem. 306:228–236. [DOI] [PubMed] [Google Scholar]
- Phillips, D. L. 1962. A technique for the numerical solution of certain integral equations of the first kind. J. Ass. Comp. Mach. 9:84–97. [Google Scholar]
- Piehler, J., A. Brecht, K. Hehl, and G. Gauglitz. 1999. Protein interactions in covalently attached dextran layers. Colloids Surf. B Biointerface. 13:325–336. [Google Scholar]
- Poland, D. 2001a. Enthalpy distributions in proteins. Biopolymers. 58:89–105. [DOI] [PubMed] [Google Scholar]
- Poland, D. 2001b. Ligand binding distributions in nucleic acids. Biopolymers. 58:477–490. [DOI] [PubMed] [Google Scholar]
- Press, W. H., S. A. Teukolsky, W. T. Vetterling, and B. P. Flannery. 1992. Numerical Recipes in C. University Press, Cambridge.
- Provencher, S. W. 1979. Inverse problems in polymer characterization: direct analysis of polydispersity with photon correlation spectroscopy. Macromol. Chem. 180:201–209. [Google Scholar]
- Provencher, S. W. 1982a. A constrained regularization method for inverting data represented by linear algebraic or integral equations. Comp. Phys. Comm. 27:213–227. [Google Scholar]
- Provencher, S. W. 1982b. CONTIN: A general purpose constrained regularization program for inverting noisy linear algebraic and integral equations. Comp. Phys. Comm. 27:229–242. [Google Scholar]
- Provencher, S. W. 1992. Low-bias macroscopic analysis of polydispersity. In Laser Light Scattering in Biochemistry. S. E. Harding, D. B. Satelle, and V. A. Bloomfield, editors. The Royal Society of Chemistry, Cambridge, UK. pp. 92–111.
- Puziy, A. M. 1999. Use of CONTIN for calculation of adsorption energy distributions. Langmuir. 15:6016–6025. [Google Scholar]
- Rabbany, S. Y., R. Piervincenzi, L. Judd, A. W. Kusterbeck, R. Bredehorst, K. Hakansson, and F. S. Ligler. 1997. Assessment of heterogeneity in antibody-antigen displacement reactions. Anal. Chem. 69:175–182. [DOI] [PubMed] [Google Scholar]
- Rebois, R. V., P. Schuck, and J. K. Northup. 2002. Elucidating kinetic and thermodynamic constants for interaction of G protein subunits and receptors by surface plasmon resonance spectroscopy. Methods Enzymol. 344:15–42. [DOI] [PubMed] [Google Scholar]
- Reddish, M. A., L. Jackson, R. R. Koganty, D. Qiu, W. Hong, and B. M. Longenecker. 1997. Specificities of anti-sialyl-Tn and anti-Tn monoclonal antibodies generated using novel clustered synthetic glycopeptide epitopes. Glycoconj. J. 14:549–560. [DOI] [PubMed] [Google Scholar]
- Rich, R. L., and D. G. Myszka. 2001. Survey of the year 2000 commercial optical biosensor literature. J. Mol. Recognit. 14:273–294. [DOI] [PubMed] [Google Scholar]
- Roden, L. D., and D. G. Myszka. 1996. Global analysis of a macromolecular interaction measured on BIAcore. Biochem. Biophys. Res. Commun. 225:1073–1077. [DOI] [PubMed] [Google Scholar]
- Rudolph, M. G., J. G. Luz, and I. A. Wilson. 2002. Structural and thermodynamic correlates of T-cell signaling. Annu. Rev. Biophys. Biomol. Struct. 31:121–149. [DOI] [PubMed] [Google Scholar]
- Rusch, U., M. Borkovec, J. Daicic, and W. H. van Riemsdijk. 1997. Interpretation of competitive adsorption isotherms in terms of affinity distributions. J. Colloid Interface Sci. 191:247–255. [DOI] [PubMed] [Google Scholar]
- Schuck, P. 1996. Kinetics of ligand binding to receptor immobilized in a polymer matrix, as detected with an evanescent wave biosensor. I. A computer simulation of the influence of mass transport. Biophys. J. 70:1230–1249. [DOI] [PMC free article] [PubMed] [Google Scholar]
- Schuck, P. 1997a. Reliable determination of binding affinity and kinetics using surface plasmon resonance biosensors. Curr. Opin. Biotechnol. 8:498–502. [DOI] [PubMed] [Google Scholar]
- Schuck, P. 1997b. Use of surface plasmon resonance to probe the equilibrium and dynamic aspects of interactions between biological macromolecules. Annu. Rev. Biophys. Biomol. Struct. 26:541–566. [DOI] [PubMed] [Google Scholar]
- Schuck, P. 2000. Size distribution analysis of macromolecules by sedimentation velocity ultracentrifugation and Lamm equation modeling. Biophys. J. 78:1606–1619. [DOI] [PMC free article] [PubMed] [Google Scholar]
- Schuck, P., L. F. Boyd, and P. S. Andersen. 1999. Measuring protein interactions by optical biosensors. In Current Protocols in Protein Science. J. E. Coligan, B. M. Dunn, H. L. Ploegh, D. W. Speicher, and P. T. Wingfield, editors. John Wiley & Sons, New York. pp. 20.2.1–20.2. 21.
- Schuck, P., D. B. Millar, and A. A. Kortt. 1998. Determination of binding constants by equilibrium titration with circulating sample in a surface plasmon resonance biosensor. Anal. Biochem. 265:79–91. [DOI] [PubMed] [Google Scholar]
- Schuck, P., and A. P. Minton. 1996a. Analysis of mass transport limited binding kinetics in evanescent wave biosensors. Anal. Biochem. 240:262–272. [DOI] [PubMed] [Google Scholar]
- Schuck, P., and A. P. Minton. 1996b. Minimal requirements for internal consistency of the analysis of surface plasmon resonance biosensor data. Trends Biochem. Sci. 252:458–460. [DOI] [PubMed] [Google Scholar]
- Schuck, P., M. A. Perugini, N. R. Gonzales, G. J. Howlett, and D. Schubert. 2002. Size-distribution analysis of proteins by analytical ultracentrifugation: strategies and application to model systems. Biophys. J. 82:1096–1111. [DOI] [PMC free article] [PubMed] [Google Scholar]
- Selinger, J. V., and S. Y. Rabbany. 1997. Theory of heterogeneity in displacement reactions. Anal. Chem. 69:170–174. [DOI] [PubMed] [Google Scholar]
- Sips, R. 1948. On the structure of a catalyst surface. J. Chem. Phys. 16:490–495. [Google Scholar]
- Smith, C. R., and W. T. Grandy. 1985. Maximum-Entropy and Bayesian Methods in Inverse Problems. Reidel, Dordrecht, The Netherlands.
- Stanley, B. J., K. Topper, and D. B. Marshall. 1994. Analysis of the heterogeneous rate of dissociation of Cu(II) from humic and fulvic acids by statistical deconvolution. Anal. Chim. Acta. 287:25–34. [Google Scholar]
- Steinbach, P. J. 1996. Two-dimensional distributions of activation enthalpy and entropy from kinetics by the maximum entropy method. Biophys. J. 70:1521–1528. [DOI] [PMC free article] [PubMed] [Google Scholar]
- Steinbach, P. J., R. Ionescu, and C. R. Matthews. 2002. Analysis of kinetics using a hybrid maximum-entropy/nonlinear-least-squares method: application to protein folding. Biophys. J. 82:2244–2255. [DOI] [PMC free article] [PubMed] [Google Scholar]
- Sundberg, E. J., and R. A. Mariuzza. 2002. Molecular recognition in antigen-antibody complexes. Adv. Protein Chem. 61:119–160. [DOI] [PubMed] [Google Scholar]
- van der Heide, U. A., S. C. Hopkins, and Y. E. Goldman. 2000. A maximum entropy analysis of protein orientations using fluorescence polarization data from multiple probes. Biophys. J. 78:2138–2150. [DOI] [PMC free article] [PubMed] [Google Scholar]
- van der Merwe, P. A., and A. N. Barclay. 1996. Analysis of cell-adhesion molecule interactions using surface plasmon resonance. Curr. Opin. Immunol. 8:257–261. [DOI] [PubMed] [Google Scholar]
- van der Merwe, P. A., A. N. Barclay, D. W. Mason, E. A. Davies, B. P. Morgan, M. Tone, A. K. C. Krishnam, C. Ianelli, and S. J. Davis. 1994. Human cell-adhesion molecule CD2 binds CD58 (LFA-3) with a very low affinity and an extremely fast dissociation rate but does not bind CD48 or CD59. Biochemistry. 33:10149–10160. [DOI] [PubMed] [Google Scholar]
- Vijayendran, R. A., and D. E. Leckband. 2001. A quantitative assessment of heterogeneity for surface-immobilized proteins. Anal. Chem. 73:471–480. [DOI] [PubMed] [Google Scholar]
- Vijayendran, R. A., F. S. Ligler, and D. E. Leckband. 1999. A computational reaction-diffusion model for the analysis of transport limited kinetics. Anal. Chem. 71:5405–5412. [DOI] [PubMed] [Google Scholar]
- Ward, E. S., D. Gussow, A. D. Griffiths, P. T. Jones, and G. Winter. 1989. Binding activities of a repertoire of single immunoglobulin variable domains secreted from Escherichia coli. Nature. 341:544–546. [DOI] [PubMed] [Google Scholar]
- Williams, C., and T. A. Addona. 2000. The integration of SPR biosensors with mass spectrometry: possible applications for proteome analysis. Trends Biotechnol. 18:45–48. [DOI] [PubMed] [Google Scholar]
- Wofsy, C., and B. Goldstein. 2002. Effective rate models for receptors distributed in a layer above a surface: application to cells and Biacore. Biophys. J. 82:1743–1755. [DOI] [PMC free article] [PubMed] [Google Scholar]
- Xing, L., K. Tjarnlund, B. Lindqvist, G. G. Kaplan, D. Feigelstock, R. H. Cheng, and J. M. Casasnovas. 2000. Distinct cellular receptor interactions in poliovirus and rhinoviruses. EMBO J. 19:1207–1216. [DOI] [PMC free article] [PubMed] [Google Scholar]
- Yarmush, M. L., D. B. Patankar, and D. M. Yarmush. 1996. An analysis of transport resistances in the operation of BIAcore; implications for kinetic studies of biospecific interactions. Mol. Immunol. 33:1203–1214. [DOI] [PubMed] [Google Scholar]
- Zacher, T., and E. Wischerhoff. 2002. Real-time two-wavelength surface plasmon resonance as a tool for the vertical resolution of binding processes in biosensing hydrogels. Langmuir. 18:1748–1759. [Google Scholar]