

Abstract
Olfactory receptor neurons (ORNs) respond to odorants with characteristic patterns of action potentials that are relevant for odor coding. Prolonged odorant exposures revealed three populations of dissociated toad ORNs, which were mimicked by depolarizing currents: tonic (TN, displaying sustained firing, 49% of 102 cells), phasic (PN, exhibiting brief action potential trains, 36%) and intermediate neurons (IN, generating trains longer than PN, 15%). We studied the biophysical properties underlying the differences between TNs and PNs, the most extreme cases among ORNs. TNs and PNs possessed similar membrane capacitances (∼4 pF), but they differed in resting potential (−82 versus −64 mV), input resistance (4.2 versus 2.9 GΩ) and unspecific current, Iu (TNs: 0 < Iu ≤ 1 pA/pF; and PNs: Iu > 1 pA/pF). Firing behavior did not correlate with differences in voltage-gated conductances. We developed a mathematical model that accurately simulates tonic and phasic patterns. Whole cell recordings from rat ORNs in fragments (∼4 mm2) of olfactory epithelium showed that such a tissue normally contains tonic and phasic receptor neurons, suggesting that this feature is common across a wide range of vertebrates. Our findings show that the individual passive electrical properties can govern the firing patterns of ORNs.
INTRODUCTION
Olfactory receptor neurons (ORNs) are the sensory cells of the olfactory epithelia. A typical ORN can respond to various odorants, depending on the odor receptor it expresses (Malnic et al., 1999) and generates action potential patterns that are transmitted to the brain. Such firing patterns are of fundamental importance for the generation of odor coding. ORNs share a conserved morphology among most vertebrates, possessing a soma bearing a nonmyelinated axon and a single dendrite that ends in the dendritic knob; 5–20 chemosensory cilia emerge from the knob. Aside from their transduction features, ORNs are similar to other neuronal cells, including a similar repertoire of voltage-gated ion channels and a spontaneous action potential discharge activity. However, they are more tractable for dissociation and electrical recording than most other neurons.
ORNs respond to odorants with increases (excitation) or decreases (inhibition) in their action potential firing rates (Bacigalupo et al, 1997; Schild and Restrepo, 1998). Excitatory responses are triggered by a depolarizing receptor potential that arises from the activation of a cyclic nucleotide-gated conductance (Nakamura and Gold, 1987; Kurahashi, 1989) and a Ca2+-dependent Cl− conductance (Kleene and Gesteland, 1991; Kurahashi and Yau, 1993; Lowe and Gold, 1993a). In contrast, inhibitory responses are due to a hyperpolarizing receptor potential (Dionne, 1992; Morales et al., 1994) induced by an increase in a Ca2+-dependent K+ conductance (Morales et al, 1995, 1997; Sanhueza et al., 2000). Because these conductances are triggered by odorant stimuli, we term them transduction conductances. They are principally confined to the chemosensory cilia of ORNs (Firestein et al., 1990; Lowe and Gold, 1993b; Delgado et al., 2001).
Whereas the transduction conductances initiate ORN responses to odorant stimuli, voltage-gated conductances shape the eventual action potential patterns. Four voltage-gated conductances are present in the soma of Caudiverbera caudiverbera olfactory neurons: 1), an inactivating, TTx-sensitive Na+ conductance, 2), a non-inactivating Ca2+ conductance, 3), a delayed rectifier K+ conductance, and 4), a Ca2+-dependent K+ conductance (Delgado and Labarca, 1993; Sanhueza and Bacigalupo, 1999). An additional inactivating K+ conductance is present in some species (Trotier, 1986; Lynch and Barry, 1991), but not in Caudiverbera. Voltage-dependent Cl− currents are absent in Caudiverbera's ORNs (Delgado and Labarca, 1993).
A diversity of firing patterns can be observed when isolated ORNs are stimulated with long exposures of slightly suprathreshold odorant concentrations: 1), tonic responses, consisting of a sustained action potential firing pattern that lasts until the end of the stimulus; 2), phasic responses, exhibiting a brief early train of action potentials (1–8 spikes) followed by a sustained depolarization; and 3), intermediate responses, displaying a single initial train of action potentials, but longer than in PNs. ORNs that give tonic responses to sustained exposures to low odorant concentrations generate phasic-like responses to higher (adapting) levels of odorants due to odor adaptation (Getchell and Shepherd, 1978), a phenomenon consisting of a Ca2+/Calmodulin-mediated reduction in the cyclic nucleotide-gated conductance (Chen and Yau, 1994). However, we show that some ORNs generate phasic responses even to stimuli at threshold odor concentrations.
Since neurons generating tonic or phasic responses to depolarizing stimuli are commonly found within the nervous system (Kandel et al., 2000) and ORNs posses similar electrophysiological properties as other neurons, besides their transduction abilities, it is reasonable to ask whether their particular electrical characteristics could determine their response spiking pattern, independently of odor adaptation. Our goal in the present work was to examine this issue and establish the physiological basis for the tonic and phasic behavior of olfactory neurons. To this end, we investigated the intrinsic electrical properties of isolated olfactory neurons that could account for such differential neuronal behavior and we explored whether tonic and phasic behavior can be observed in the intact epithelium. We found ORN tonic and phasic activity both in the epithelium and in isolation. The average resting potentials (Vr) in tonic ORNs were more negative than those in phasic cells and ORNs presented an unspecific basal conductance that was smaller in tonic than in phasic neurons. There are no differences in the membrane capacitance and voltage-dependent conductances between tonic and phasic ORNs. We conclude that firing patterns of ORNs can be determined by their individual passive electrical properties.
METHODS
Preparations, solutions, and solution changes
Isolated ORNs were obtained by mechanical dissociation of the olfactory epithelium from the Chilean toad Caudiverbera caudiverbera. The animals were anesthetized in ice, sacrificed by decapitation, and pithed. ORNs were maintained in Normal Ringer solution, supplemented with nutrients and antibiotics (Morales et al., 1994). Caudiverbera ORNs were utilized in the present study due to their relatively large size and their resistance to experimental manipulations, representing an excellent model system.
Normal amphibian Ringer (in mM): 115 NaCl, 2.5 KCl, 1 CaCl2, 0.4 MgCl2, 10 HEPES, and 3 glucose, pH 7.6. N-methyl-D-glucamine (NMDG) replaced NaCl in some experiments. Internal solution: 120 KCl, 2 EGTA, 4 HEPES-Na, 0.1 Na-GTP, 1 Mg-ATP, and 1 CaCl2, pH 7.6; in some experiments K+ was replaced by Cs+ (indicated in the text).
Olfactory epithelia were obtained from Sprague-Dawley rats (3–5 weeks old), bred in the animal facility of the Catholic University of Chile. Rats were sacrificed by CO2 inhalation for 5 min, decapitated, and the nasal cavity was opened by a transversal section of the skull. The olfactory epithelium was excised from the dorsal posterior part of the septum with fine scissors and the tissue was cut in small pieces (∼4 mm2); each time one of such epithelial fragments was placed with the ciliary layer up in a chamber containing mammalian artificial cerebrospinal fluid, in mM: 125 NaCl, 25 KCl, 2 CaCl2, 1 MgCl2, 25 NaHC03, 1.25 NaH2PO4, 10 dextrose, and 5 HEPES, equilibrated with 95% O2/5% CO2. Internal solution (in mM): 120 KCl, 2 EGTA, 4 HEPES, 0.1 Na-GTP, 1 Mg-ATP, and 1 CaCl2, pH 7.6. The chamber was continuously perfused with oxygenated ACSF at a rate of 1 ml/min and each tissue fragment was used for no more than 1 h, although we did not observe an evident decline of it 4 h after excision if maintained properly oxygenated.
Excised rat epithelia were visualized with a Nikon Eclipse E600FN upright microscope equipped with infrared differential interference contrast optics and a ×60 water immersion objective, which allowed us to distinguish clearly the individual ORNs and to position the recording pipette on the cell body or dendritic knob.
External solutions were exchanged using a multibarreled pipette (Sutter Instrument, Novato, CA) placed 30 μm from the cell. The pipette was pulled with a 700C puller (David Kopf Instruments, Tujunga, CA) so that each barrel had ∼10 μm tip diameter. In the experiments using odorants, the tip diameter was ∼1 μm and the stimuli were focused onto the olfactory cilia. The solutions were ejected from the pipette using a computer-controlled picospritzer.
Electrical recording and analysis
Electrical activity was recorded under whole cell, current-clamp conditions. Whole cell currents were measured under voltage-clamp. Capacitance (Cm) and series resistance (Rs) were properly cancelled; cells with Rs > 20 MΩ were discarded. We used an Axopatch-1D patch clamp amplifier for electrical recording and the pCLAMP software (Axon Instruments, Union City, CA) for data acquisition and analysis. Patch pipettes were made of glass capillaries (BRIS, Globe Scientific, Paramus, NJ), using a P-97 puller (Sutter Instrument, Novato, CA). Electrode resistances were 2–4 MΩ for recording from toad dissociated neurons and 5–7 MΩ for rat epithelium recordings. The seal resistance (>20 GΩ) was higher than the mean input resistance in all cells considered. Rs was the same for both ORN types (TNs: 12 ± 3 MΩ, n = 12; and PNs: 12 ± 3 MΩ, n = 13). Nystatin (200 μg/ml) was used in perforated-patch experiments; it was prepared immediately before the experiment from a 50 mg/ml stock solution in DMSO. Rs in the perforated patch experiments was similar to that used in the regular whole cell experiments (TNs: 16 ± 2 MΩ, n = 3; and PNs: 16 ± 2 MΩ, n = 3). The unspecific current (Iu) in toad ORNs was measured using 30-ms hyperpolarizing voltage pulses (−20 mV) from a holding potential (Vh) of −80 mV. ORNs, in which Iu was variable, were discarded. The input resistance was measured using −4 pA pulses under current clamp, from a holding current (Ih) of 0 pA.
Ca2+ currents
We studied the properties of the Ca2+ currents using the following approach: we first identified ORN responses as tonic or phasic under I-clamp and normal solutions; then we modified the ionic conditions to optimize the Ca2+ current measurements under V-clamp, exchanging both intracellular and extracellular solutions. The normal internal solution was replaced by a Cs+-internal solution; to accomplish this, we filled the tip of the patch pipette with normal internal solution and backfilled it with Cs+-internal solution. The amount of normal internal solution added to the tip gave us, in some cases but not always, enough time to determine the cell behavior applying a current step before the Cs+-solution reached the cell. The arrival of Cs+ was evident as the spike durations became longer until they eventually ceased, and the resting membrane polarization abruptly dropped to values close to 0 mV. Normal Ringer in the chamber was then replaced by perfusion with 0-Na+ Ringer, in which NaCl was replaced mole-for-mole by NMDG. In this manner, the conditions for measuring Ca2+ currents were rapidly attained (in ∼60 s).
The odorant used in this work was geraniol (3,7-dimethyl-2,6-octadien-1-ol).
All chemicals were from Sigma-Aldrich (St. Louis, MO), unless otherwise indicated.
RESULTS
Our main goal was to establish whether the tonic and phasic response patterns commonly recorded from ORNs upon odorant stimulation could be governed by their electrical properties. We addressed this problem by mimicking the odorant stimuli with sustained depolarizing current injections, and investigated what electrical membrane properties may contribute to determine ORNs' differential electrical firing patterns.
Tonic and phasic olfactory receptor neurons in isolation
We observed a variety of cell-specific spiking patterns in response to stimulating olfactory neurons with prolonged odor pulses under cell-attached conditions. Some cells fired continuously throughout the stimulus duration, whereas in other cells the action potentials ceased shortly after the stimulus onset. In some of these latter cases the transient firing pattern was caused by stimulus adaptation, but in other cases it did not appear to be due to adaptation, since a similar pattern was observed in their responses to slightly suprathreshold (non-adapting) odorant stimuli. This situation is illustrated by Fig. 1 A. Under the non-invasive, cell-attached patch-clamp modality, the response of one ORN to an odorant stimulus was sustained (Fig. 1 A, left; n = 6), whereas that of another ORN was transient (Fig. 1 A, right; n = 7). ORNs that were subsequently depolarized by stepping the pipette potential from 0 to +20 mV, rather than by a chemical stimulus, gave similar responses (Fig. 1 B, left and right; n = 4 and 3, respectively). All neurons classified as tonic (TN) in response to odorants behaved tonically in response to suprathreshold voltage pulses as well. Likewise, all neurons classified as phasic (PN) behaved phasic in response to suprathreshold voltage pulses. These observations suggested to us that electrical properties by themselves may determine the tonic or phasic nature of ORNs. In principle, these properties could include the passive membrane electrical parameters, the repertoire of voltage-gated conductances, or both.
FIGURE 1.

Tonic and phasic firing activity in toad olfactory receptor neurons. (A) An olfactory neuron responded with a sustained increase in action potential firing (left) and another ORN gave a brief train of action potentials (right) to an identical 5-μM stimuli of geraniol, under cell-attached conditions. (B) Prolonged depolarizations induced a sustained (left) and transient (right) firing activity in two other ORNs. Depolarizations were induced by +20 mV steps in the pipette potential in the absence of odorants; cell-attached V-clamp condition. (C) Sustained firing increase from an ORN to a 2-μM geraniol stimulus (left, top), under whole cell conditions. A similar response was triggered by a current step in the same cell (left, bottom). Another ORN responded to a 20-μM geraniol stimulus with a transient firing followed by a plateau (right, top), and with a comparable response when depolarized by a current step (right, bottom). Whole cell I-clamp conditions, Ih = 0 pA.
To examine the possibility that the cell electrical properties may be responsible for the differential behavior observed across ORNs, we applied a prolonged depolarization by injecting current in the absence of odorants under whole-cell I-clamp conditions. As shown in Fig. 1 C, a cell that gave a tonic response to stimulation with geraniol (top, left) responded with a similar firing pattern to a depolarizing I-step (bottom, left), whereas a separate ORN that gave a phasic response to the odorant stimulus responded in the same manner when depolarized with an I-step (bottom, right). These observations indicate that the differential firing patterns among ORNs can be determined by the electrical characteristics of the ORNs, independently of their transduction conductances.
Of 102 ORNs examined under I-clamp, 49% responded to depolarizing currents with a sustained increase in action potential firing (TNs); 36% gave an initial train of 1–6 spikes, followed by a depolarizing plateau (PNs); and 15% gave responses of intermediate characteristics (intermediate neurons, INs). These functionally different cell types were morphologically indistinguishable from each other. We chose to examine in detail the two most extreme cases, i.e., the tonic and phasic cells, by determining the factors that accounted for their differential responses to electrical stimulation.
The responses of a TN and of a PN to consecutive depolarizing current steps of increasing magnitudes are shown in Fig. 2, A and B, respectively. The tonic and phasic behavior was evident whenever the current pulse surpassed threshold, independently of the magnitude of pulse. Both cells had almost identical resting potentials (−90 mV for TNs and −89 mV for PNs). We found similar results in seven TNs and five PNs.
FIGURE 2.

Tonic and phasic responses under conventional and perforated whole cell current-clamp conditions. (A) Responses of a tonic neuron to a sequence of depolarizing currents of increasing amplitudes. (B) Responses of a phasic neuron to a similar series of current steps. (C) Both cell types were also observed under the perforated patch-clamp method, using nystatin as the perforating agent (see Methods). (Left) Response of a tonic neuron to a current step. (Right) Response of a phasic neuron to an identical stimulus.
Commonly, whole cell recording is attained by combining suction with a brief voltage pulse (∼0.5 ms, 1.5 V). As this procedure allows the loss of soluble cytosolic components into the pipette, it was important to check whether our observations might have been affected by this invasive procedure. To this purpose, we established the whole cell condition using the less invasive perforated patch method with nystatin (Horn and Marty, 1988), observing no difference in ORN electrical behavior by either method: TNs (Fig. 2 C, left) and PNs (Fig. 2 C, right) were also observed under perforated patch conditions. Of a total of six ORNs studied in this manner, three responded tonically and three phasically to depolarizing currents applied from a holding current of 0 pA. This result validates the use of the conventional whole cell method in the present study.
Tonic and phasic olfactory receptor neurons in the olfactory epithelium
The study of the electrophysiological bases for tonic and phasic behavior of ORNs can be most conveniently performed on dissociated cells. However, it is a reasonable concern that such a differential behavior might somehow originate as a result of the dissociation procedure and that it may not reflect the physiological situation in the epithelium. To address this issue, we conducted whole cell experiments on ORNs in freshly excised rat epithelia. We used rat instead of toad because the larger amount of mucus in this amphibian made it extremely difficult to seal the pipettes on the sensory neurons, in contrast to the rat. Moreover, the physiological features of the ORNs from both species appear to be quite conserved (Schild and Restrepo, 1998; Sanhueza et al, 2000). The cell in Fig. 3 A illustrates the responses of a TN and Fig. 3 B of a PN upon a series of current steps on increasing magnitude. As in isolated toad ORNs, tonic and phasic behavior was obvious in each case to all suprathreshold stimuli. From seven cells examined, two were tonic (Ri = 3.8 and 4.3 GΩ; at Ih = 0 pA, both cells fired actively, being their membrane potentials near −75 and −70 mV, respectively) and five cells were phasic (Ri = 2.2 ± 0.5 GΩ and Vm = −64 ± 7.1 mV, on average). This result shows that the rat olfactory epithelium contains ORNs with markedly different electrical behavior, closely resembling toad ORNs in isolation.
FIGURE 3.

Tonic and phasic ORN responses recorded in rat olfactory epithelium. (A) Responses of a tonic neuron to steps of depolarizing currents of increasing magnitudes, under voltage-clamp. (B) Responses of a phasic neuron to current steps.
Passive electrical membrane properties of ORNs
In principle, the passive electrical properties alone, independent of voltage-dependent conductances, could determine whether an ORN responds tonically or phasically to an injected current step. Therefore, we investigated whether input membrane resistance (Ri), membrane capacitance (Cm), and resting potential (Vr) influenced the electrical behavior of these sensory receptor neurons. We observed no relation between Cm and the tonic or phasic electrical behavior, as Cm was not significantly different between both cell types: 4.4 ± 1.5 pF (mean ± SD) in TNs and 4.1 ± 1.5 pF in PNs (Fig. 4 A). In contrast, we found a significant difference (Student t-test, t < 0.05) in Vr between TNs and PNs (Fig. 4 A): the average Vr value of TNs was −82 ± 13 mV (mean ± SD, n = 29), whereas that of PNs was −64 ± 13 mV (n = 21). Ri was also significantly different, being 4.2 ± 0.6 GΩ (mean ± SD, n = 5) in TNs and 2.9 ± 2.1 GΩ (n = 5) in PNs. This difference was due to an unspecific current (Iu) that was detected using hyperpolarizing voltage pulses under V-clamp. A −20 mV pulse from a holding potential of −80 mV revealed an Iu between 0 and 1 pA/pF for TNs, whereas in PNs this current was larger: Iu > 1 pA/pF. Due to the small magnitude of Iu, and to the presence of much larger voltage-gated currents at similar membrane potentials, a further characterization of this current was unfeasible; its presence was necessary and sufficient for explaining the difference in the electrical pattern between two ORNs with identical passive membrane parameters and no differences in their V-dependent currents (see below).
FIGURE 4.

(A) Passive membrane parameters of the tonic and phasic olfactory receptor neurons. (B) Distribution of the resting potential of both kinds of neurons.
Membrane potential influences electrical behavior of ORNs
Fig. 5 presents an ORN with a resting potential of −60 mV, which behaved as phasic when depolarized by an 18 pA stimulus (Fig. 5 A). When the membrane potential was raised to −90 mV (close to the average resting potential of tonic cells) by injecting current, an identical pulse induced a tonic response in this cell. This observation was verified in 33% of the cells examined (6 of 18), whereas the remaining 67% kept giving phasic responses (Fig. 5 B), suggesting that an additional factor than resting potential (Vr) was also important in establishing the sustained firing pattern. We propose that this factor corresponds to Iu. In Fig. 5, Iu was immeasurably small for the cell in Fig. 5 A and it was >1 pA/pF for the one in Fig. 5 B. Therefore, although membrane potential is relevant on determining the discharge pattern, it cannot account for the cell behavior in all cases.
FIGURE 5.

Membrane potential may determine whether a cell behaves as tonic or phasic. (A) A neuron that gave phasic responses at −60 mV (Vr) (top) became tonic when hyperpolarized to −90 mV by injecting current (bottom) (33%, n = 6 of 18). (B) Another cell, also phasic at −60 mV (Vr) (top), remained phasic at −90 mV (bottom) (67%, n = 12 of 18).
Tonic and phasic ORNs display similar whole cell currents
Differences in the individual V-gated ionic conductances could be another reason for the differential behavior of ORNs, since they shape the electrical responses. To investigate this possibility, we characterized the V-dependent conductances in PNs and TNs and examined whether any V-dependent conductances correlated with the cell type (i.e., TN versus PN). We studied the currents triggered by series of depolarizing voltage steps of increasing amplitude, once we had identified the cell as tonic (Fig. 6, Aa and Ca) or phasic (Fig. 6, Ba and Da). All families of whole cell currents exhibited an early inward current followed by outward currents, and they fell into two general types: one in which the outward currents measured at the end of the depolarizing step increased with voltage, reached a maximum and decreased to smaller values at further depolarizing potentials (Fig. 6, Ab and Bb), and another type in which the outward currents progressively increased with the magnitudes of the depolarizations (Fig. 6, Cb and Db). The four ORNs in Fig. 6 were held at −70 mV. The insets display the I-V curves measured at the end of the voltage steps (arrows) in every case. The I-V curves in the insets to Fig. 6, Ab and Bb present the characteristic N-shape of a Ca2+-dependent K+ component; these cells represent 50% of the neurons studied. As illustrated in the figure, the electrical behavior of TNs and PNs were not related to the shape of the I-V curves of their outward currents.
FIGURE 6.
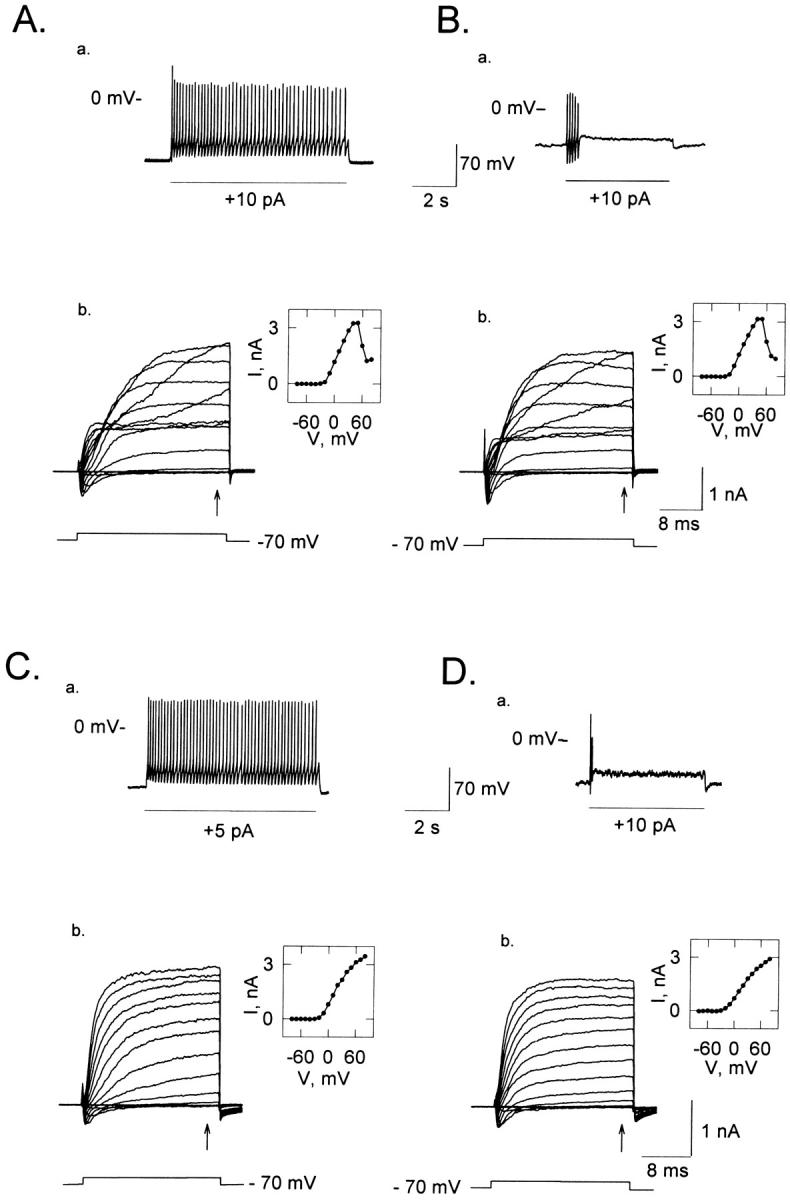
Whole cell currents from tonic and phasic olfactory neurons. A current step was applied under I-clamp each time to determine whether the cell was tonic or phasic, and subsequently a series of depolarizing voltage steps were given under voltage-clamp to study the voltage-dependent currents. Two general patterns of whole cell currents were found, showing no relationship with the cell behavior. (A) Tonic cell. (Aa) Electrical activity induced by an injection of 10 pA of depolarizing current. (Ab) Whole cell currents for the cell in Aa. The inset shows the I-V relation measured at the arrow. (B) Phasic cell. (Ba) Electrical activity induced by 10 pA of depolarizing current. Bb. Whole cell currents for the cell in Ba. The inset shows the I-V relation measured at the arrow. The ORNs in A and B both present the N-shape in their I-V curves. (C) Tonic cell. (Ca) Pattern of action potentials induced by an injection of +5 pA. (Cb) Whole cell currents for the ORN in Ca. As in previous cells, the inset shows the I-V relation measured at the arrow. (D) Phasic cell. (Da) Electrical activity induced by 10 pA of depolarizing current. (Db) Whole cell currents for the cell in Da. The inset shows the I-V relation measured at the end of the current trace (arrow).
The whole cell outward currents were substantially reduced in the absence of Ca2+ (Fig. 7 A), leaving the Ca2+-independent delay rectifier component. The Ca2+-dependent component was also prominent in cells with I-V curves that did not exhibit the N-shape, as indicated by the pronounced reduction of the net outward current observed under 0-Ca2+ Ringer (not shown). The insets to Fig. 7 A show the I-V relations measured in both conditions. On average, TNs and PNs exhibited virtually identical values of Ca2+-dependent K+ current (using as a reference value +40 mV): 548 ± 346 pA/pF (mean ± SD, n = 5) and 529 ± 360 pA/pF (n = 6), respectively, when measured at the end of a series of 25-ms pulses of increasing amplitude (to +40 mV), from a holding potential of –70 mV. Similarly, the magnitude of the delayed rectifier K+ current component was also virtually equal in TNs and PNs (94 ± 55 pA/pF and 97 ± 59 pA/pF, n = 5 and n = 6, respectively).
FIGURE 7.
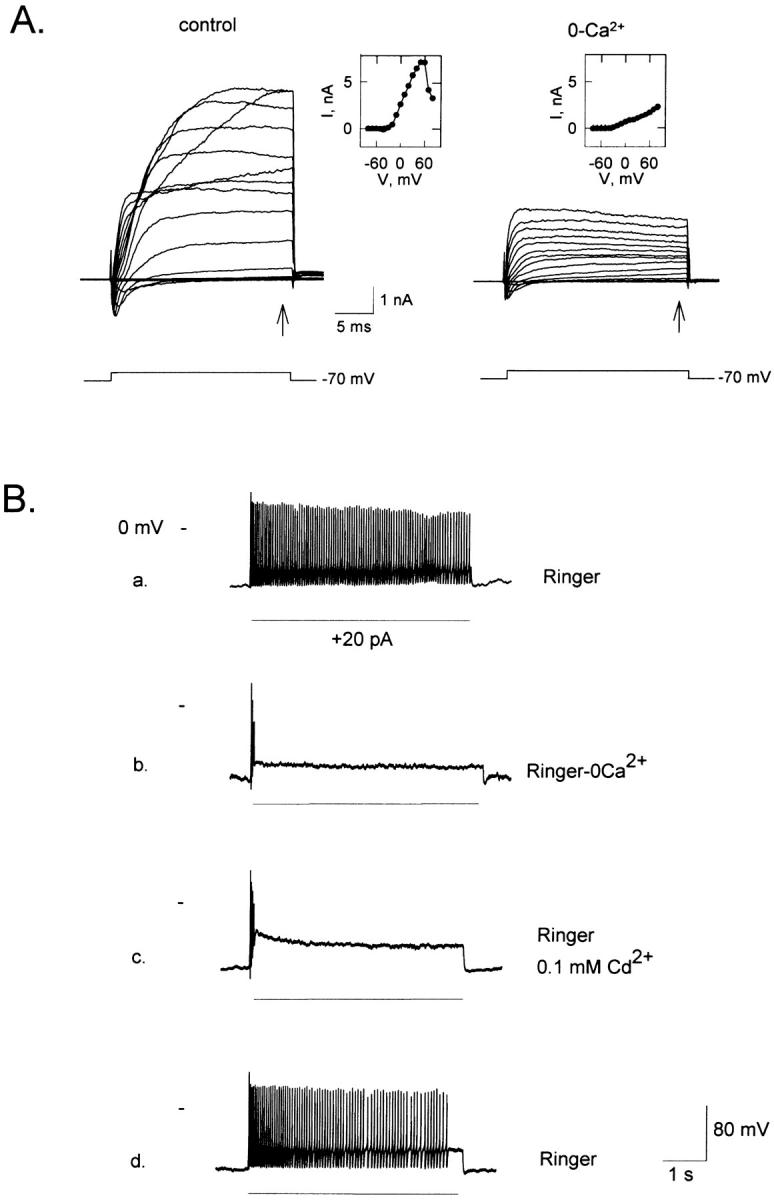
Ca2+ influx is necessary for the normal behavior of tonic cells. (A) Whole cell currents under normal Ringer (left) and under 0-Ca2+ Ringer (right); insets show the corresponding I-V curves measured at the arrows (n = 12). (Ba) Tonic cell response to a depolarizing current under normal Ringer. (Bb) Ca2+ removal (10−9 M) turned the cell phasic. (Bc) Supplementing normal Ringer with 0.1 mM Cd2+ produced a similar effect as removing external Ca2+. (Bd) The cell recovered after restoring normal Ringer (n = 4).
Altogether, these results indicate that tonic and phasic cells contain substantial Ca2+-dependent K+ and delayed rectifier K+ conductances and that neither of such K+ conductances appear to be related to the response type.
Tonic and phasic ORNs have similar Ca2+ and Na+ currents
Sodium and calcium conductances are found in all ORNs. We examined whether tonic and phasic ORNs exhibit differences on these conductances that could account for their dissimilar behavior. Ca2+ influx was necessary for maintained firing of TNs. As illustrated in Fig. 7 B, removal of extracellular Ca2+ changed a tonic response (Fig. 7 Ba) to a phasic response (Fig. 7 Bb); a similar effect was caused by supplementing 0.1 mM Cd2+, a Ca2+ channel blocker, to normal Ringer (Fig. 7 Bc). The cell recovered upon reestablishing the control Ringer solution (Fig. 7 Bd). Therefore, one determinant factor for the electrical behavior of an ORN may be the magnitude of its voltage-gated Ca2+ current.
Fig. 8 Aa shows the response of a TN to a depolarizing current step. Fig. 8 Ab presents the family of its Ca2+ currents to depolarizing voltage steps, after replacing Na+ by NMDG in the external solution and K+ by Cs+ in the internal solution (see Methods). The inset to Fig. 8 Ab illustrates the I-V curve plotted from these Ca2+ currents. Fig. 8, Ba and Bb, shows a similar experiment, conducted on a PN. No obvious differences can be observed between both cells regarding the relative size and kinetics of their Ca2+ currents. The average magnitude of the normalized Ca2+ currents was 28 ± 17 A/F (mean ± SD), ranging from 7 to 70 A/F (n = 17). Three of the 17 cells were identified as tonic and other three cells as phasic. The other 11 ORNs could not be identified because the Cs+ solution dialyzed the cell before it could be done. The Na+ currents from the same ORNs as in Fig. 8, A and B, look very similar as well (Fig. 8, Ac and Bc). The I-V relations for each family of currents are presented below them. No correlation was found between cell type and the Ca2+ and Na+ conductances. We also investigated whether Caudiverbera ORNs have an inward rectifier conductance. To this purpose, we explored a voltage range down to −130 mV in three TNs and three PNs, and we did not observe any indication of inward rectification (not shown).
FIGURE 8.
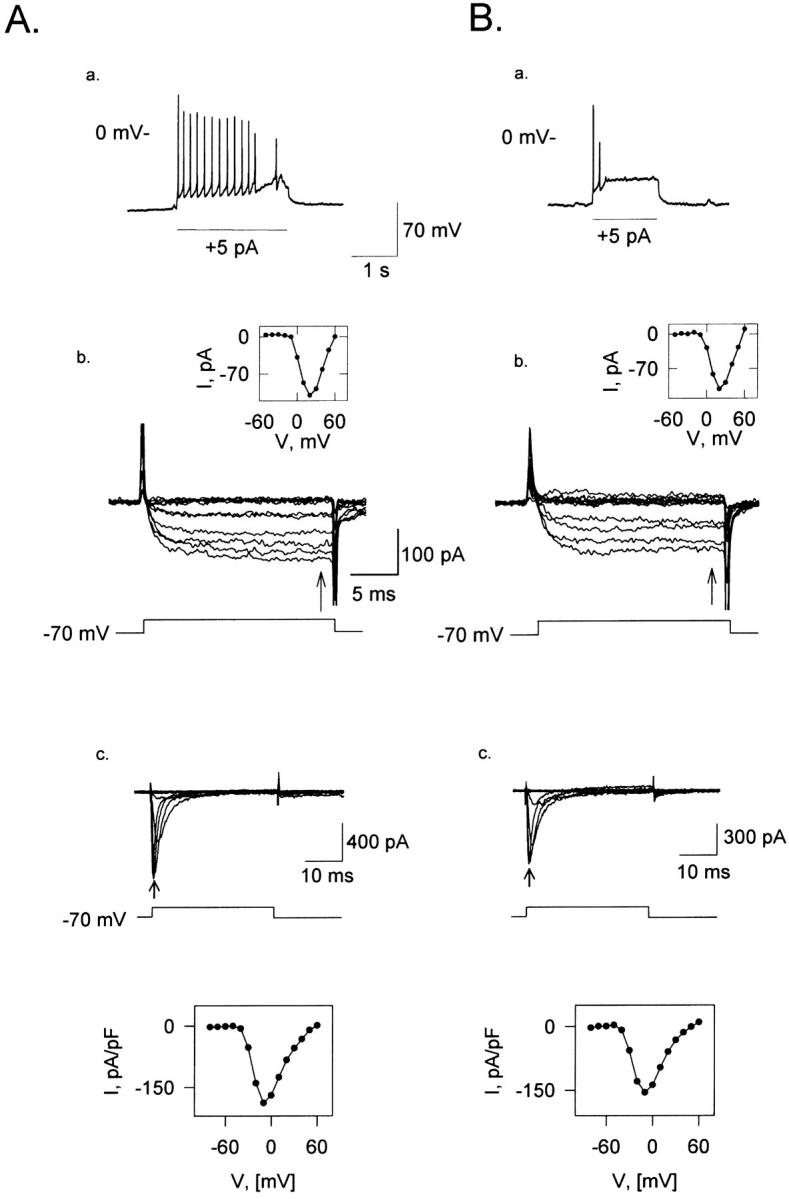
Tonic and phasic cells have similar Ca2+ and Na+ currents. The behavior of the ORN was determined after breaking into the cell, before the K+-internal solution that filled the pipette tip was replaced by the Cs+-internal solution that filled the rest of the pipette (see Methods). (Aa) TN response. (Bb) PN response. (Ab) Family of whole cell calcium currents of the cell in Aa.; Bb family of whole cell currents of the cell in Ba. The recordings in Ab and Bb, were obtained after normal Ringer was exchanged by another solution in which all NaCl had been replaced by NMDG (Vh = −70 mV). Insets in Ab and Bb: I-V relations for the Ca2+ currents for each cell, normalized by Cm (n = 6). Ac and Bc, Na+ current of the same neurons as in A and B. Insets in Ac and Bc: normalized values for these currents, measured at the arrows.
Altogether, these results indicate that the tonic and phasic behaviors of ORNs are not connected to differences in their voltage-dependent conductances. Thus, it appears that such conductances are not responsible for the generation of phasic versus tonic behaviors in these cells.
Simulation model of a tonic and a phasic ORN
The foregoing results provide strong evidence that tonic and phasic responses can be determined independently of their voltage-dependent or stimulus-induced conductance changes. Thus, it seems that the passive electrical properties are sufficient to specify the tonic or phasic nature of an ORN. To test this notion further, we asked whether basic theoretical considerations would yield a similar conclusion. Thus, we simulated an olfactory neuron, using the parameters describing the conductances of a representative Caudiverbera ORN, and examined whether tonic and phasic behaviors could be determined by modifying its passive electrical parameters, as in our experimental observations on these neuronal cells. For simplicity, our model includes only an inactivating inward current (Na+ current) and a single non-inactivating outward current (K+ current), both of them based on Hodgkin and Huxley-type currents, and an unspecific basal current (Iu). The small non-inactivating inward current (the Ca2+ current) was omitted in the model because its electrical effect is negligible due to its small magnitude; the importance of the Ca2+ current is increasing the intracellular Ca2+ level to activate the Ca2+-dependent K+ current (Fig. 7), which is included in the net outward current.
Fig. 9 A illustrates responses from a TN to pulses of increasing magnitude (2, 6, and 10 pA/pF; Fig. 9, Aa–Ac). To simulate this TN we set the unspecific conductance, gu, to 0.015 nS/pF and the reversal potential of this current, Vu, to −82 mV (average Vr of TNs; for the other parameters, refer to the Appendix). The resting potential of this model cell was −83 mV. To simulate a phasic cell we set gu = 0.11 nS/pF and Vu = −64 mV (average Vr of PNs). The resting potential of this cell was −70 mV; Fig. 9 B illustrates responses from a PN to pulses of increasing magnitude (2, 6, and 10 pA/pF; Fig. 9, Ba–Bc).
FIGURE 9.


The electrical behavior of a model olfactory receptor neuron. This figure displays the results of simulations of firing patterns elicited by depolarizations induced by current injection. (Aa) A subthreshold 2 pA/pF pulse does not induce action potential firing in the model tonic ORN. (Ab and Ac) Tonic electrical activity induced in the model ORN by a 6- and a 10-pA/pF depolarizing pulses, respectively. The parameters used for the TN are as follows: gu = 0.015 nS/pF, Vu = −82 mV; Vr = −83 mV (for the other parameters, refer to Appendix). (Ba) The subthreshold 2 pA/pF pulse does not induce action potential firing in the model PN. Bb and Bc. Electrical activity induced in the model phasic ORN by depolarizing pulses of 6 pA and 10 pA, respectively. The parameters used for the phasic neuron are as follows: gu = 0.11 nS/pF, Vu = −64 mV; Vr = −70 mV; for the other parameters, refer to Appendix. (C). Our tonic and phasic model neurons can reproduce the dependence on the membrane potential of the electrical activity, as the ORNs illustrated in the Fig. 5. Fig. 9, Ca and Cb, present two different ORNs, both of them with a membrane potential of −63 mV; the transformable ORN (phasic cell that changes to tonic upon hyperpolarization; right) have a gu = 0.045 nS/pF and a Vu = 60 mV; the nontransformable cell (phasic cell that does not change to tonic upon hyperpolarization; left) has a gu = 0.11 nS/pF and a Vu = −20 mV. When the model cells were hyperpolarized by negative current injection, a depolarizing pulse induced a tonic response in the ORN at the right (compare Cd to Cb), whereas the ORN at the left conserved its phasic pattern (compare Cc to Ca). Holding current was −7.8 pA/pF for the cell at the left, and −6.6 pA for cell at the right. Depolarizing pulses were 8 pA/pF for both cells.
We found that the firing pattern of a population of phasic cells can be changed to tonic upon hyperpolarization (see Fig. 5). Fig. 9, Ca–Cd, displays the results of the simulations of this experimental observation. Hyperpolarization can shift to tonic those phasic cells with low gu (gu value close to 0.045 nS/pF) and positive Vu, close to the reversal potential of the sodium current (VNa). The firing pattern of phasic cells with high gu (gu value close to 0.11 nS/pF) cannot be changed into tonic by hyperpolarization (see Fig. 9 legend). When changing the parameters gu and Vu we found the following cases: i), those with low gu (lower than 0.03 nS/pF), Vu between Vr and 0 mV, and high Vr are tonic; ii), those with low gu (close to 0.045 nS/pF) and positive Vu (close to VNa) have a low Vr and are phasic, inasmuch as these cells are turned tonic upon changing the Vr to hyperpolarized values near TNs' resting potential; and iii) those with high gu (0.11 nS/pF) and Vu between Vr and 0 mV have a low Vr and are phasic, as they cannot be transformed into tonic by hyperpolarization. Cells with high gu and Vu close to VNa are silent. The simulated cells in i can account for the main population of tonic cells; if Vu is changed to values close to VNa, they account for the few tonic neurons presenting Vr values more depolarized than the mean value for TNs. Simulated cells in ii and iii account for the main group of phasic cells including ORNs that can and ORNs that cannot be switched to tonic upon Vm manipulation. Our observations on the model cell are in agreement with the notion that the difference in firing patterns depends on the voltage-independent conductance (gu) and on the membrane potential.
DISCUSSION
In the present article we are reporting the existence of distinct populations of receptor neurons isolated from toad (Caudiverbera) olfactory epithelium, regarding the action potential firing patterns that they generate in response to sustained depolarizing current stimuli. A fraction of the isolated neurons was tonic (49%), another fraction was phasic (36%), and a third fraction was intermediate (15%). We established that the passive electrical properties of these neurons can, by themselves, specify their particular action potential firing patterns and that there is no correlation between tonic or phasic behavior of an ORN and their voltage-dependent conductances.
Tonic and phasic olfactory receptor neurons
The observation that tonic and phasic responses are generated by ORNs in the epithelium as well as in isolation strongly supports the notion that this is a physiological characteristic of this chemosensory tissue, rather than a situation caused by the dissociation procedure. This observation validates our approach of studying the basis for this differential behavior in isolated ORNs. The species difference, which we chose for experimental convenience (Results), does not appear to affect our conclusion and it is to be expected that the same result should be obtained in the toad epithelium. Furthermore, we propose that this feature may be shared by a wide variety of vertebrates.
ORN behavior and passive electrical parameters
We determined that TNs and PNs differed in resting potential and input resistance (Fig. 4 A). Both of these parameters could determine the electrical behavior of an olfactory neuron. Cells with low resting potentials (below −60 mV) were all phasic. The absence of TNs at these potentials is most likely due to Na+ channel inactivation. ORNs with resting potentials between −60 and −100 mV could be either tonic or phasic. In phasic cells with very negative resting potentials (Fig. 4 B), their low Ri correlates with a relatively large Iu (>1pA/pF); this would explain their transient firing pattern. It may be thought that the inability of these PNs to generate tonic responses could be due to membrane damage; however, the highly negative resting potentials of these cells are incompatible with this possibility. A fraction of the PNs (33%) having low resting potentials could be turned tonic by hyperpolarizing their membrane potentials with a steady current injection, indicating that membrane potential was important in determining the behavior of such cells. However, the behavior of the remaining fraction of PNs was not modified upon increasing their membrane potentials, a further indication that the firing pattern does not solely depend on Vm. As there were no fundamental differences in the ORN whole cell currents that could be correlated with their electrical behavior, we conclude that the reason for their differential behavior is related to their passive membrane parameters. The cell in Fig. 5 B represents an example of an ORN that was unaltered upon increasing its membrane potential; this cell exhibited a larger Iu than the ORN in Fig. 5 A, in which Iu was negligible.
We do not know the ionic basis for the unspecific current, which we could not study in detail because of its extremely small size (see Results); such a current may correspond to a Hodgkin and Huxley-type leakage current with a reversal potential of ∼−60 mV (Hodgkin and Huxley, 1952), or sodium channels opened at resting potential. Alternatively, it may be due to a small fraction of the excitatory transduction channels that are open in the absence of odorants (Kleene, 2000); under our experimental conditions, the related transduction current should have a reversal potential of 0 mV; an additional possibility is that it could correspond to a K+ conductance (Delgado and Labarca, 1993; Delgado et al, 2001). All of these possibilities would tend to reduce the input resistance of ORNs and are compatible to our model (Fig. 9, Appendix, see below). Indeed, if Iu consists of multiple components, the relative contribution of each of them may vary from cell to cell, giving rise to the different electrical patterns.
Simulated model for a Caudiverbera ORN
To test our conclusions, we simulated an olfactory neuron utilizing the parameters from a representative ORN. Our model cell responded tonically or phasically to suprathreshold depolarizing pulses, depending on the values given to the unspecific current, membrane potential and other parameters considered, in close agreement with our measurements on tonic and phasic neurons (Fig. 9; Appendix). These results strongly support the notion that the passive membrane properties are sufficient to determine the characteristic neuronal firing patterns triggered by depolarization. The simulations in Fig. 9 demonstrate that changes in both Vm and the unspecific conductance are sufficient to determine the phasic or tonic firing pattern of ORNs. Manipulation of Vu and gu affects Vm and also generates practically all the electrical patterns observed in ORNs. As mentioned in the previous paragraph, different relative contributions of the possible components of the voltage-independent conductance would yield variations in gu and Vu from cell to cell, providing the physiological basis for the parameter manipulations in the model. In extreme conditions, the model cells were turned silent upon increasing gu to 0.39 nS/pF, and cells with gu lower than 0.015 nS/pF were always tonic in the whole range of Vu, from VK to VNa (not shown). In our model, both the V-dependent currents and the externally applied depolarizing current (Ie) were normalized by the average capacitance of Caudiverbera ORNs and were expressed in pA/pF. The threshold Ie necessary for inducing action potential firing in the model cells was higher than that observed in the real ORNs; this was the most important difference between real ORNs and our simulated neurons. The model neuron responds as expected to any manipulation on the voltage-dependent conductances (not shown). Our observations on the model cell are in total agreement with the notion that the differences in firing patterns among ORNs can depend on the characteristics of the voltage-independent conductance (gu) and the membrane potential.
Membrane conductances and receptor neuron behavior
The voltage-dependent Ca2+ currents did not vary significantly across ORNs, when normalized values were compared (Fig. 8). In addition, we observed that the Ca2+ conductance plays a key role in allowing sustained firing, as removal of extracellular Ca2+ or blockage of the Ca2+ conductance by Cd2+ abolished tonic firing (Fig. 7 B), suggesting that Ca2+ influx is required for sustaining action potential firing. Our observations indicate that the Ca2+ current does not have an important electrical effect by itself on determining the differential response pattern, but it is necessary for the activation of the Ca2+-dependent K+ current. In addition to playing a role in shaping the different patterns of action potentials elicited by depolarizing stimuli in ORNs, the Ca2+-dependent K+ conductance appears to contribute to ORN adaptation in the newt (Kawai, 2002). Blocking this conductance with CTx or IbTx abolished an adaptive component that is present even in responses to depolarizing injected currents. Neither of such toxins seems to affect Caudiverbera somatic Ca2+-dependent K+ current (Delgado and Labarca, 1993; Madrid and Bacigalupo, unpublished observations), but we have not tested whether this current participates on adaptation. From the present study, it is clear that the Ca2+-dependent K+ current does not participate on determining the differential behavior of tonic and phasic ORNs in the Chilean toad, since this current is comparably prominent in both cell types. Similarly, no differences were detected with regard to the delayed rectifier current between TNs and PNs, ruling out an involvement of this current on defining the cell electrical behavior.
The observation that the Na+ current is present with indistinguishable features in tonic and phasic ORNs (Fig. 8) rules out a role for the Na+ conductance in specifying the discharge pattern.
Comparison to the behavior of chemoreceptor cells in other vertebrate species
It was reported that the majority (78%) of isolated mouse olfactory receptor neurons displayed transient (phasic) responses to sustained depolarizing current steps, whereas isolated vomeronasal receptor neurons (VRNs) from the same species exhibited mostly tonic responses (70%; Liman and Corey, 1996). Average resting potentials of ORNs and of VRNs were approximately −81 and −58 mV, respectively. Input resistances were similar in both cell types (∼3 GΩ), but their Cm differed significantly: 1.8 and 8.8 pF for ORNs and VRNs, respectively. With regard to their voltage-dependent conductances, differences were observed in the K+ currents: their onset and kinetics were slower and their size smaller in VRNs than in ORNs. The authors suggested that these distinct properties may be causing the differences in electrical behavior between VRN and ORN cells, but a detailed analysis of how they determine the particular electrical behaviors was not done. They proposed that VRNs with small K+ currents exhibited repetitive firing in response to steady depolarizations; in contrast, the presence of an inactivating K+ current as well as a prominent maintained K+ current in mouse ORNs would tend to prevent repetitive firing. However, Caudiverbera ORNs exhibit prominent sustained outward currents and lack the inactivating K+ current, present in mouse, but an important fraction of them is tonic whereas a comparable fraction is phasic. Furthermore, rat ORNs possess the inactivating current as in mouse but a significant proportion of them are tonic (29% of the cases, n = 7; Fig. 3).
Studies in isolated frog ORNs also reported the presence of tonic and phasic olfactory neurons, although in this case the majority of the cells (70%) presented an oscillatory spiking behavior during sustained odor stimulation, whereas only 20% were tonic and the other 10% were phasic (Reisert and Matthews, 2001). They only analyzed the oscillatory population and proposed that the oscillatory pattern depends on the dynamics of intracellular Ca2+, which would rely on the Na+/Ca2+ exchange system, and on fluctuations on the levels of cyclic nucleotides within the olfactory cilia, neither of which were directly measured. Possible involvement of membrane electrical parameters were not considered in their work. Under our experimental conditions, we did not observe evoked oscillatory behavior, but we cannot rule out that they may occur.
Physiological relevance of tonic and phasic electrical patterns
It is widely accepted that individual ORNs express a very small number of odorant receptor genes, possibly a single one (Malnic et al., 1999) and that each receptor molecule can recognize a variety of odorants that may have different chemical structures. The code for recognizing each particular odorant appears to be generated by a number of ORNs expressing different receptor genes whose products recognize this odorant, acting in a combinatorial fashion (Malnic et al., 1999; Duchamp-Viret et al., 2000, Ma and Shepherd, 2000). It may be expected that every ORN expressing the same receptor gene would respond in a similar manner to identical non-adaptive stimuli. However, our finding that a fraction of the ORNs is tonic whereas another fraction is phasic opens the possibility that ORNs having identical odor sensitivities (i.e., expressing the same odorant receptor gene and having the same odorant thresholds) may exhibit different electrical behavior in response to identical chemical stimuli if they differ in their passive membrane electrical parameters. This possibility implies that the participation of both neuronal types in olfactory coding would be fundamentally different. Our observations indicate that these ORN types can be found in the epithelia of the rat and likely in toad as well, suggesting that when an animal is exposed to sustained non-adapting odorant levels, some of the responsive ORNs would generate tonic responses whereas others would respond phasically, depending on their particular membrane passive electrical parameters.
Acknowledgments
We thank F. Pérez, C. Maureira, and G. Ugarte for their help. Special thanks to P. O'Day and S. Gordon for critical reading of the manuscript.
Supported by Fondo Nacional de Desarrollo Científico y Tecnológico grants 1990938 and 1020964, Presidential Chair in Science, and Ministerio de Planificación Nacional y Política Económica ICM grant P99-031-F to J.B.; and Fondo Nacional de Desarrollo Científico y Tecnológico grants 4000014 and 2990003 to R.M., who also held a Comisión Nacional de Investigación Científica y Tecnológica graduate fellowship.
APPENDIX
Simulation of firing pattern of the olfactory neurons resulted from solving the following differential equation,
 |
(1) |
where Cm is the ORN membrane capacitance in picofarads, V is the membrane potential in millivolts, t is time in milliseconds, and ie, iu, iK, and iNa are the externally applied current, the unspecific current, the potassium current, and the sodium current, respectively, expressed in picoamperes. Normalizing the currents of Eq. 1 by the membrane capacitance (set to 4 pF), we obtain:
 |
(2) |
where Ix ≡ ix/Cm, expressed in pA/pF.
The initial condition to run the model was V = −78 mV (t = 0), the average resting potential of ORNs. The externally applied current Ie was manipulated between 1 and 12 pA/pF.
The unspecific current Iu was calculated using the following formula:
 |
(3) |
where gu is the unspecific conductance in nS/pF and Vu is Iu reversal potential. We manipulated Vu between the VK (−99 mV) and VNa (+85 mV); both calculated with the Nernst equation. gu was set to 0.015 nS/pF for the tonic cell in the Fig. 9 A and 0.11 nS/pF for the phasic cell in Fig. 9 B.
The potassium current was calculated after Hodgkin and Huxley (1952):
 |
(4) |
where gK is the maximum potassium conductance, in nS/pF, and VK is the reversal potential of the potassium current. VK = −99 mV; gK was set to 10.0 nS/pF. The parameter n is a function of the voltage-dependent kinetic constants αn and βn:
 |
where
 |
and
 |
(5) |
Expressions for the voltage-dependent kinetic constants were translated from Hodgkin and Huxley (H&H) equations using the transformation: V(H&H) = −(V + 65).
The sodium current was calculated from the following expression, after Hodgkin and Huxley (1952):
 |
(6) |
where gNa is the maximum sodium conductance in nS/pF, and VNa is the reversal potential of the sodium current. VNa = +85 mV; gNa was set to 12.0 nS/pF. The parameters m and h are functions of the voltage-dependent kinetic constants α and β, following the same rule used for n:
 |
(7) |
and
 |
(8) |
The parameters describing the voltage-dependent kinetic constants were taken from Hodgkin and Huxley (1952), with the exception of αh; we had to make the inactivation more steeply voltage-dependent to simulate the transformation of phasic into tonic cells by membrane hyperpolarization. The potential values where the voltage-dependent kinetic constants are undetermined were amended.
A Fortran program was written to solve the problem, using Microsoft Power Station 4.0 Microsoft Developer Studio on a Pentium-based computer.
Rodolfo Madrid's current address is University of Washington, Health Sciences Ctr., 1959 NE Pacific St., Seattle, WA 98195-6485 USA.
References
- Bacigalupo, J., B. Morales, P. Labarca, G. Ugarte, and R. Madrid. 1997. Inhibitory responses to odorants in vertebrate olfactory neurons. In From Ion Channels to Cell-to-Cell Conversations. R. Latorre and J. C. Sáez, editors. Plenum Press, New York. pp.269–284.
- Chen, T.-Y., and K.-W. Yau. 1994. Direct modulation by Ca2+-calmodulin of cyclic nucleotide activated channel of rat olfactory receptor neurons. Nature. 368:545–548. [DOI] [PubMed] [Google Scholar]
- Delgado, R., V. Saavedra, O. Schmachtenberg, J. Sierralta, and J. Bacigalupo. 2001. Direct evidence for the presence of a Ca2+-dependent K+ channel in olfactory cilia. Chem. Senses. 26:1064. [Google Scholar]
- Delgado, R., and P. Labarca. 1993. Properties of whole cell currents in isolated olfactory neurons from the Chilean toad Caudiverbera caudiverbera. Am. J. Physiol. Cell Physiol. 264:C1418–C1427. [DOI] [PubMed] [Google Scholar]
- Dionne, V. E. 1992. Chemosensory responses in isolated olfactory receptor neurons from Necturus maculosus. J. Gen. Physiol. 99:415–433. [DOI] [PMC free article] [PubMed] [Google Scholar]
- Duchamp-Viret, P., A. Duchamp, and M. A. Chaput. 2000. Peripheral odor coding in the rat and frog: quality and intensity specification. J. Neurosci. 20:2383–2390. [DOI] [PMC free article] [PubMed] [Google Scholar]
- Firestein, S., G. M. Shepherd, and F. S. Werblin. 1990. Time course of the membrane current underlying sensory transduction in salamander olfactory receptor neurons. J. Physiol. (Lond.). 430:135–158. [DOI] [PMC free article] [PubMed] [Google Scholar]
- Getchell, T. V., and G. M. Shepherd. 1978. Adaptive properties of olfactory receptors analyzed with odor pulses of varying durations. J. Physiol. (Lond.). 282:541–560. [DOI] [PMC free article] [PubMed] [Google Scholar]
- Hodgkin, A. L., and A. F. Huxley. 1952. A quantitative description of membrane current and its application to conduction and excitation in nerve. J. Physiol. (Lond.). 117:500–544. [DOI] [PMC free article] [PubMed] [Google Scholar]
- Horn, R., and A. Marty. 1988. Muscarinic activation of ionic currents measured by a new whole cell recording method. J. Gen. Physiol. 92:145–159. [DOI] [PMC free article] [PubMed] [Google Scholar]
- Kandel, E., J. H. Schwartz, and T. M. Jessell. 2000. Principles of Neural Science, 4th Ed. McGraw-Hill, New York.
- Kawai, F. 2002. Ca2+-activated K+ currents regulate odor adaptation by modulating spike encoding of olfactory receptor cells. Biophys. J. 82:2005–2015. [DOI] [PMC free article] [PubMed] [Google Scholar]
- Kleene, S. J. 2000. Spontaneous gating of olfactory cyclic-nucleotide-gated channels. J. Membr. Biol. 178:49–54. [DOI] [PubMed] [Google Scholar]
- Kleene, S. J., and R. C. Gesteland. 1991. Calcium-activated chloride conductance in frog olfactory cilia. J. Neurosci. 11:3624–3629. [DOI] [PMC free article] [PubMed] [Google Scholar]
- Kurahashi, T. 1989. Activation by odorants of cation-selective conductance in the olfactory receptor cell isolated from the newt. J. Physiol. (Lond.). 419:177–192. [DOI] [PMC free article] [PubMed] [Google Scholar]
- Kurahashi, T., and K.-W. Yau. 1993. Co-existence of cationic and chloride components of odorant-induced current of vertebrate olfactory receptor neurons. Nature. 363:71–74. [DOI] [PubMed] [Google Scholar]
- Liman, E., and D. Corey. 1996. Electrophysiological characterization of chemosensory neurons from the mouse vomeronasal organ. J. Neurosci. 16:4625–4637. [DOI] [PMC free article] [PubMed] [Google Scholar]
- Lowe, G., and G. H. Gold. 1993a. Nonlinear amplification by calcium-dependent chloride channels in olfactory receptor cells. Nature. 366:283–286. [DOI] [PubMed] [Google Scholar]
- Lowe, G., and G. H. Gold. 1993b. Contribution of the ciliary cyclic nucleotide-gated conductance to olfactory transduction in the salamander. J. Physiol. 462:175–196. [DOI] [PMC free article] [PubMed] [Google Scholar]
- Lynch, J. W., and P. H. Barry. 1991. Properties of transient K+ currents and underlying single K+ channels in rat olfactory receptor neurons. J. Gen. Physiol. 97:1043–1072. [DOI] [PMC free article] [PubMed] [Google Scholar]
- Ma, M., and G. M. Shepherd. 2000. Functional organization of mouse olfactory receptor neurons. Proc. Natl. Acad. Sci. USA. 97:12869–12874. [DOI] [PMC free article] [PubMed] [Google Scholar]
- Malnic, B., J. Hirono, T. Sato, and L. B. Buck. 1999. Combinatorial receptor codes for odorants. Cell. 96:713–723. [DOI] [PubMed] [Google Scholar]
- Morales, B., P. Labarca, and J. Bacigalupo. 1995. A ciliary K+-conductance sensitive to charybdotoxin underlies inhibitory responses in toad olfactory receptor neurons. FEBS Lett. 359:41–44. [DOI] [PubMed] [Google Scholar]
- Morales, B., R. Madrid, and J. Bacigalupo. 1997. Calcium mediates the activation of the inhibitory current induced by odorants in toad olfactory receptor neurons. FEBS Lett. 402:259–264. [DOI] [PubMed] [Google Scholar]
- Morales, B., G. Ugarte, P. Labarca, and J. Bacigalupo. 1994. Inhibitory K+ currents activated by odorants in toad olfactory neurons. Proc. R. Soc. Lond. B Biol. Sci. 257:235–242. [DOI] [PubMed] [Google Scholar]
- Nakamura, T., and G. H. Gold. 1987. A cyclic-nucleotide gated conductance in olfactory-receptor cilia. Nature. 325:442–444. [DOI] [PubMed] [Google Scholar]
- Reisert, J., and H. R. Mathews. 2001. Responses to prolonged odor stimulation in frog olfactory receptor cells. J. Physiol. (Lond.). 534:179–191. [DOI] [PMC free article] [PubMed] [Google Scholar]
- Sanhueza, M., and J. Bacigalupo. 1999. Odor suppression of voltage-gated currents contributes to the odor-induced response in olfactory neurons. Am. J. Physiol. Cell Physiol. 277:C1086–C1099. [DOI] [PubMed] [Google Scholar]
- Sanhueza, M., O. Schmachtenberg, and J. Bacigalupo. 2000. Excitation, inhibition and suppression by odors in isolated toad and rat olfactory receptor neurons. Am. J. Physiol. Cell Physiol. 279:C31–C39. [DOI] [PubMed] [Google Scholar]
- Schild, D., and D. Restrepo. 1998. Transduction mechanisms in vertebrate olfactory receptor cells. Physiol. Rev. 78:429–466. [DOI] [PubMed] [Google Scholar]
- Trotier, D. 1986. A patch clamp analysis of membrane currents in salamander olfactory cells. Pflugers Arch. 407:589–595. [DOI] [PubMed] [Google Scholar]