

Abstract
Slab geometric boundary conditions are applied in the molecular dynamics simulation of a simple membrane-channel system. The results of the simulation were compared to those of an analogous system using normal three-dimensional periodic boundary conditions. Analysis of the dynamics and electrostatics of the system show that slab geometric periodicity eliminates the artificial bulk water orientational polarization that is present while using normal three-dimensional periodicity. Furthermore, even though the water occupancy and volume of our simple channel is the same when using either method, the electrostatic properties are considerably different when using slab geometry. In particular, the orientational polarization of water is seen to be different in the interior of the channel. This gives rise to a markedly different electric field within the channel. We discuss the implications of slab geometry for the future simulation of this type of system and for the study of channel transport properties.
INTRODUCTION
Current developments in the molecular dynamics (MD) simulation of biomolecular systems have made it possible to perform moderately large-scale calculations on atomistic systems of biological relevance such as proteins and DNA molecules in solutions (Tuckerman and Martyna, 2000; Hansson et al., 2002). Simulation studies also have been shown to be very effective in their application to a variety of problems pertaining to biomembranes (Forrest and Sansom, 2000), including membrane channels (Sansom, 1998; Roux, 2002). They have been able to reliably reproduce and provide microscopic structural and dynamical insight to various experimentally determined bulk properties in the liquid crystal phase of neat lipid bilayers (Essmann and Berkowitz, 1999; Nagle and Tristram-Nagle, 2000).
The use of periodic boundary conditions in three dimensions for avoiding so-called “edge effects” has allowed for the simulation of bulk materials for years. In the case of membrane simulations, they have been very successful in describing exactly the sort of multilamellar bilayer system geometry employed in experimental studies of membranes. Such geometry is easily mimicked in simulation by the construction of a central simulation cell (usually a rectangular box) with a bilayer slab in the center and a water slab above and below this bilayer. The cell is duplicated in all three dimensions, forming an effectively infinite multilamellar bilayer system (Tobias, 2001). Although in both cases of experiment and simulation, neighboring bilayers may interact with one another, this sort of geometry is considered to be a firm ground for the simulation of bilayers and subsequent comparison of results with experiments. Also, since there is a twofold rotational symmetry around axes perpendicular to the bilayer normal, any sort of interaction effects between images in the dimension normal to the bilayer are considered to be effectively cancelled.
The application of three-dimensional periodic boundary conditions in simulation lends itself to the usage of Ewald sums for the treatment of long-range electrostatic interactions between partial charges in the model system at hand. Such a treatment of the electrostatic interaction is necessary because the Coulombic energy decays very slowly (∼1/r) with the interparticle distance, r. The development of particle mesh Ewald (PME) methods in the treatment of electrostatic interactions (Essmann et al., 1995; Deserno and Holm, 1998) has been quite successful in calculating long-range electrostatics by providing a feasible algorithmic complexity of N log N, where N is the number of particles in the system (Deserno and Holm, 1998). However, it has been found that despite the facility of such implementations of the Ewald sum, their usage may introduce an artificial crystalline ordering thereby creating stability in the system that otherwise would not be present (Elcock, 2002). Such an artifact has been shown to be present when simulating peptides in implicit water solvent (Hunenberger and McCammon, 1999; Weber et al., 2000) while employing Ewald sums with three-dimensional periodic boundary conditions. Similar studies have shown that such artifacts are not as blatant when simulating small peptides in commonly used explicit water models because of the large dielectric constant they provide for the solute (Smith and Pettitt, 1996; Smith et al., 1997). However, the apparent absence of artifacts when using explicit water models might be seen only when simulating solutes having a small solvent-excluded volume compared to the size of the simulation cell (Luty and van Gunsteren, 1996; Hunenberger and McCammon, 1999). More recent simulation studies employing Ewald summation for a helical peptide in explicit water have shown a tendency of the peptide to unfold to larger extents when a larger simulation cell is used (Weber et al., 2000). This is indicative of the artificial stability imposed by the usage of such an electrostatic treatment even if explicit water solvent is used.
Based upon the above arguments for the simulation of multilamellar bilayers and of proteins in bulk solvent, we may conclude that the appropriate treatment of electrostatic interactions is an important matter to address when performing such simulations. If a simulation can be justifiably performed using the Ewald summation technique when the system is periodic in three dimensions, what then of simulations of membranes with embedded proteins such as ion channels? Clearly the system geometry of a membrane slab with an embedded protein with long, pore-forming, membrane-spanning helices or β-barrels is not comparable to that of plain bilayer systems or globular proteins in bulk solvent. In some cases, due to their structures, membrane-embedded proteins can be expected to provide extremely large, persistent dipoles in one direction (the dimension perpendicular to the bilayer normal) in a way that globular proteins do not. As a result, the use of periodic boundary conditions in three dimensions may produce severe artifacts due to interactions between dipoles. The use of a simple cutoff in this case is also not recommended, since it is known that the application of cutoffs distorts the electrostatic properties in bilayer systems unless the cutoff range is very large. Nonetheless, many studies have been done using a simple cutoff approach for electrostatic interactions if not the ordinary implementation of PME for long-range electrostatics (Sansom, 1998; Forrest and Sansom, 2000; Sansom et al., 2000).
The physiological importance of integral membrane channels hinges on their capability of selectively allowing the passage of ions or other small molecules such as water. Therefore, it is essential that simulations of these proteins that are to lead to our understanding of their structure and dynamics and that of their permeant species provide a correct electrostatic picture. It has been shown via MD simulations of explicit proteins that the permeation of water is highly dependent upon the polar lining of the pore in membrane channels (Sansom et al., 2002). Similar conclusions have been drawn using simple models of pores (Allen et al., 2002). It has also been shown that the interaction of water with protein and the consequent orientational polarization of water are extremely important in its passage through channels (de Groot and Grubmuller, 2001; Sansom et al., 2002; Tajkhorshid et al., 2002). Studies of water and ions in confined cylindrical pores have shown that transport properties in such pores are dependent upon the electric fields and orientational properties of the solvent within (Kohlmeyer et al., 1998). Analogous MD studies have shown that water permeation through carbon nanotubes has a critical dependence on the orientation of interior water and its interaction with the nanotube walls, affecting its ability to form hydrogen-bonded networks and permeate efficiently (Hummer et al., 2001). It has also been shown that the orientation of dipolar fluids in confined spaces is extremely sensitive to the electrostatic environment (Klapp and Schoen, 2002).
With these considerations in mind, one can begin to probe treatments of electrostatic interactions in simulations of membrane channels to find what is most suitable. A first pass at such an undertaking has been taken by Tieleman and co-workers (Tieleman et al., 2002), where some differences were seen in the orientation of water inside alamethicin channels embedded in palmitoyloleoylphosphatidylcholine (POPC) bilayers and membrane-mimetic octane slabs upon the comparison of treatments using reaction field, PME, and simple cutoff. By simple observation of the required design of membrane-channel systems, however, it seems logical that for more realistic simulations, slab geometry with its two-dimensional periodicity is the most desirable one (Tobias, 2001). Therefore one needs to use a method that provides an efficient implementation of the Ewald summation technique in slab geometry. Most implementations of two-dimensional Ewald sums for systems in three dimensions with two-dimensional periodicity are quite cumbersome, having a complexity of anywhere from N2 to N5/3 (de Joannis et al., 2002). New modifications to such methods have been faster (Kawata and Mikami, 2002) but not comparable to their three-dimensional counterparts.
Given the current state of affairs in the computation of two-dimensional Ewald sums, perhaps a more desirable method for performing three-dimensional simulations having two-dimensional periodicity is that proposed by Yeh and Berkowitz (Yeh and Berkowitz, 1999). The use of this method for membrane-embedded proteins would involve the extension of the dimension of the simulation cell parallel to the bilayer normal (usually the z-dimension) so that the dipole of the central membrane protein interacts artificially in a negligible way with its neighboring image dipoles from above and below. In this case a three-dimensional Ewald sum may be used for the electrostatic energy, but with the inclusion of a shape term for such slab conditions. The importance of such a shape term has been demonstrated in its effect on simulations of water near charged surfaces (Yeh and Berkowitz, 2000) and in obtaining the correct behavior of simulated confined dipolar fluids (Klapp and Schoen, 2002). It has also been shown, analytically, that this method is a good approximation to the exact two-dimensional Ewald summation method (Arnold et al., 2002; Bródka and Grzybowski, 2002). This method is termed the Ewald sum in three dimensions with a correction term (EW3DC). Such a method will generally have the same computational efficiency as whatever means used to calculate the three-dimensional Ewald sum (i.e., PME should prove most efficient). The only trade-off is that the large extension of the z-dimension of the simulation cell forces the use of a larger reciprocal space cutoff. Hence, though the calculation will scale in the same manner as used to calculate the three-dimensional sum, a slight increase in computational cost can be expected. If used with care, the EW3DC method converges to the result of actual two-dimensional methods, but with a much smaller computational overhead. Additional improvements to this method recently have been developed which reduce error, thereby reducing the requirement for the extension of the z-dimension of the simulation cell and increasing computational speed (Arnold et al., 2002). It should be sufficient, however, to use only the single correction term in this work to show the implications of using slab geometry in membrane-channel-type systems.
In this work we investigate some structural, dynamical, and electrostatic properties of water in a simple model channel embedded in a hydrated membrane bilayer by MD simulation. The effects of employing slab geometry with the EW3DC method for long-range electrostatics are compared to those obtained using regular three-dimensional periodicity and Ewald summation with “tinfoil” boundary conditions for long-range electrostatics.
METHODS
To understand how the implementation of slab boundary conditions affects the electrostatic properties in a membrane-channel system as compared to treatment with three-dimensional periodic boundaries, we considered a six-helix alamethicin bundle in a POPC bilayer. This particular type of system has been thoroughly studied using MD simulation (Tieleman et al., 1998, 1999, 2002) and in experiment (Sansom, 1993; Cafiso, 1994; Woolley et al., 1997). It is a very attractive type of channel for simulation study because of its simplicity.
Starting structure
A starting configuration for our system was taken from the starting structure of Tieleman (the structure can be downloaded at http://moose.bio.ucalgary.ca/download.html) (Tieleman et al., 1998). This configuration consists of six alamethicin helices arranged in a nearly symmetrical bundle inside a POPC bilayer with water (Fig. 1). We then added 2532 SPC water molecules to the bulk water of this system on the exterior of the bilayer. The final starting structure after making this modification contained 6059 SPC water molecules, one sodium ion, 102 POPC molecules, and six alamethicin peptides in the Rf30 form making a total of 24489 atoms. Five of the alamethicin peptides were modeled with protonated Glu-18 side chains, whereas the sixth was not. Reasoning for these protonation states is discussed elsewhere (Tieleman et al., 1998).
FIGURE 1.
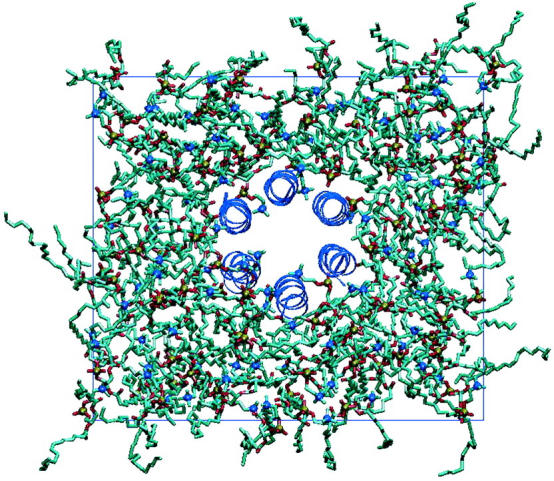
A top-down view of the membrane-channel system. The six alamethicin helices are arranged very symmetrically in the center of the membrane. The x and y simulation boundaries are delimited by the rectangular blue line.
Simulation details
Molecular dynamics simulations were run at the North Carolina Supercomputing Center using the GROMACS package (Berendsen et al., 1995; Lindahl et al., 2001). All simulations used a time step of 4 fs. The forcefield parameters for lipids were based on the work of Berger (Berger et al., 1997), and those of the protein are described by Tieleman (Tieleman et al., 1999). The LINCS algorithm was used to constrain all bonds in the system (Hess et al., 1997). Periodic boundary conditions were applied in all three dimensions. Long-range electrostatics in the cases of both slab (Yeh and Berkowitz, 1999) and tinfoil Ewald lattice sums were handled using PME (Essmann et al., 1995). The temperature in all simulations was maintained at 300 K using the Nose-Hoover scheme with a thermostat relaxation time of 0.5 ps. The analysis of subsequent results was performed using a combination of GROMACS analysis utilities and our own code. Channel pore radius profiles were calculated with the HOLE algorithm (Smart et al., 1996). Molecular graphics were rendered using visual molecular dynamics (VMD) (Humphrey et al., 1996) and Raster3D (Merrit and Bacon, 1997).
The system was equilibrated in an NPT ensemble using the Parrinello-Rahman pressure coupling scheme (Parrinello and Rahman, 1981; Nose and Klein, 1983) with a barostat relaxation time of 2.0 ps at a pressure of 0 atm for 10 ns. It has been shown that over a timescale such as this, the entire structural space for this protein cannot be sampled (Tieleman et al., 2002). Therefore, since we are interested in analyzing the effects of boundary conditions on the behavior of interior water, the coordinates of the protein were restrained isotropically to their initial positions with a force constant of 103 kJ/mol/nm2 to ensure that the water occupancy inside the channel remained relatively constant. Such restraints are reasonable if we are only interested in the behavior of water inside a channel with a protein-like structure and charge distribution. We do not claim to obtain any biologically significant information about this channel through our simulation. The size of the simulation cell over the last 2 ns of the equilibration was stable. The average length of the box in the z-direction was 9.21 nm, and the area of the membrane-channel system converged to 36.35 nm2 in the xy-plane.
The final structure of this equilibration was used as the starting structure for two additional runs. The first of the runs (to be referred to as the “3dc” run) was done in a canonical ensemble (NVT) with the z-dimension of the box extended to 30 nm and with the EW3DC method for slab geometry. The second (to be referred to as the “tinfoil” run) was done in a constant area and constant normal pressure ensemble (NPNAT) with PN = 0 atm and with regular tinfoil Ewald. Again, the protein atoms were restrained to their initial positions. Each of these systems was evolved for 5 ns and analyzed over the last 3 ns of their respective trajectories.
RESULTS AND DISCUSSION
System structure
Fig. 2, a and b, shows typical snapshots from the 3dc and tinfoil trajectories. The difference in the system geometry also can be visualized in the systems' density profiles (Fig. 3, a and b). The vapor phase in the 3dc system can be clearly seen at z > ∼5 nm and z < ∼ −5 nm. Otherwise the systems' structures are generally the same. The water occupancy of a channel was defined to be the number of water oxygen atoms found between the centers of mass of the N-term and C-term Cα of the alamethicin helices in the z dimension and within a 1.5-nm radius of the line connecting these centers of mass. The water density profiles in Fig. 4 and water occupancy in Fig. 5 is seen to be very similar in both channels over their trajectories. The average occupancy of the 3dc channel was 67 ± 4 molecules whereas the occupancy of the tinfoil channel was 66 ± 3 molecules. The similar occupancy may be expected since the restrained proteins sterically provide the same channel pore shape. The radius of the channel pore as a function of the pore-axis (z) in both systems can be seen in Fig. 6. The most sterically constraining regions of the pore can be seen in the plots at ∼−0.5 nm and at ∼1.2 nm. These regions are due to the Gln-7 and Glu-18 side chains, respectively, which protrude into the pore. They can be visualized in Fig. 7 a where they provide confined regions for the passage of water. One might describe the shape of the pore as a sort of “double” hourglass.
FIGURE 2.

Comparison of the 3dc (a) and tinfoil (b) system setup. The blue rectangular boxes indicate the simulation cell boundaries.
FIGURE 3.

Mass density profiles of the components of the 3dc (a) and the tinfoil (b) systems. The vertical dotted lines in (b) indicate the z-boundary of the box of the tinfoil system.
FIGURE 4.

Mass density profile of water in the channel region of the 3dc and tinfoil systems. The water occupies the interior of the channel in the same way in both systems.
FIGURE 5.

The time evolution of the channel occupancy for the 3dc (a) and tinfoil (b) simulations. The statistical character of both occupancies is the same and produces equivalent average occupancies within uncertainty.
FIGURE 6.

Average pore radius profiles as determined by the program HOLE. The vertical lines on each profile indicate the standard error in the pore radius and were determined by averaging the results of HOLE on protein structures saved over the last 3 ns of the 3dc and tinfoil trajectories at 500-ps intervals. The profiles are almost exactly the same.
FIGURE 7.

(a) Snapshot of the water in the alamethicin pore in the 3dc system. The smooth molecular surface of four of the alamethicin helices is shown to provide a view of the channel cross section. Headgroup phosphorous atoms are shown as yellow spheres and headgroup nitrogen atoms are shown as blue spheres. The “double hourglass” structure provides constrained regions for the passage of water. (b) Smooth molecular surface of four of the alamethicin helices. The blue spheres are the positions at which the sodium ion was placed to monitor the electric field it experienced in the bulk water and inside the pore.
Water diffusion
Not only is the occupancy of each channel the same, but the diffusive motion of water in the pores is quite similar. Fig. 8 shows the diffusion coefficient of water in the z-dimension as a function of the channel (z) axis for both systems. It can be seen that in both systems, the diffusion coefficient falls to a value as low as ∼1/12 of its bulk value (∼5 × 10⁻⁹ m2/s) in the narrowest region of the pore. This result is in agreement with that observed by Tieleman (Tieleman et al., 1999). The diffusion coefficient in the regions of the water liquid-vapor interface (z ∼ ±4 nm) in the 3dc system is seen to be slightly lower (4.2 × 10⁻⁹ m2/s) than the value of the diffusion coefficient of water in the bulk.
FIGURE 8.

Diffusion coefficient along the z-axis as a function of z for the 3dc and tinfoil systems.
Water orientation
The most striking difference in the structure of water in the two systems is their respective orientational polarization. This can be gleaned from analyzing the orientation of water with respect to the z-axis. Fig. 9 shows the average cosine of the angle between the water dipole and the z-axis as a function of z. The water dipole vector is defined such that it points from the water oxygen to the center of mass of its hydrogen atoms. The very strong orientation at ∼ ±2 nm corresponds to the water dipoles pointing toward the bilayer center due to the headgroup dipoles of the POPC bilayer (Tieleman et al., 1997). The two dotted vertical lines in this graph are drawn at the beginning and end of the channel as defined by the center of mass of the N- ( −1.34 nm) and C- (∼1.62 nm) terminal Cα of all of the helical peptides.
FIGURE 9.

Average cosine of the angle between the water dipole and the z-axis as a function of z for the 3dc and tinfoil systems in the cases of “restrained” system (solid lines) and “frozen” system (dashed lines). The vertical dotted lines delimit the channel boundaries.
It can be seen that there is a net effect on the orientation of water in the bulk (regions z < −3 nm and z > ∼3 nm in the figure) of the tinfoil system (i.e., the curve is nonzero in these regions). This effect was also noted in previous simulations using tinfoil Ewald on the same type of system (Tieleman et al., 2002). The bulk water orientation was, however, made less noticeable in those simulations by the presence of a 0.5 M salt solution because of the ions' redistribution to compensate for the effect of the large protein dipoles. However, this seemingly corrective effect on the orientational polarization of water might prove suspect if one were interested in the behavior and distribution of ions in such a system. It was also found that the effect could not be removed by the addition of a 4-nm layer of water to the bulk phase. This effect in the bulk water disappears upon the effective removal of periodicity in the z-dimension in the 3dc system. Fig. 9 demonstrates that water is randomly oriented in the bulk for the 3dc system by showing that the average cosine of the angle between the z-axis and a water dipole is zero. The value of zero for the average cosine can have two meanings: that the water dipole is orthogonal to the z-axis on average or that the water dipole is randomly oriented. To validate that, indeed, our value of zero in the bulk water region of Fig. 9 indicates random orientation, we calculated the average second order Legendre polynomial, < 1/2 (3 cos(θ) − 1) >, as a function of z. This also produces a value of zero in the region of bulk water. Hence, the ordering of water in the bulk region of the 3dc system is random.
The average dipole moment of the protein and sodium ion (net neutral charge) in both systems is nearly the same since the protein was restrained to its initial configuration throughout both trajectories. The z-component of the dipole moment of these species was calculated to be ∼345 D, whereas the average net dipole moment was calculated to be ∼361 D. It is clear that the z-component is the major contributor to the net dipole moment of the protein and sodium ion in both cases. The average z-component of the dipole moment of the entire system in the 3dc and tinfoil systems was calculated to be ∼362 D and ∼1102 D, respectively, whereas the average net dipole moment was calculated to be 603 D and 1157 D, respectively. It is striking that the system dipole moments, both net and their z-components, are so different in the case of the 3dc and tinfoil systems. The magnitude of the z-component of the protein dipole moment (345 D) is close to the value of the z-component of the 3dc system dipole moment (362 D), but it is nearly three times less than that of the tinfoil system (1102 D). A qualitative explanation for this can be formulated due to the orientation of water in the system. In the case of the tinfoil system, the protein image dipoles above and below the central cell strongly couple water's orientation to the electric field lines of the central and image protein dipoles. This would explain the nonrandom ordering of water in the bulk of the tinfoil system demonstrated in Fig. 9. The array of repeated protein dipoles in the z-dimension works together to create an overall effect on the orientation of water. On the other hand, the z-component of the 3dc system's dipole moment is much less because the water orientation is allowed to compensate for only the protein dipole in the central cell. Hence, the water ordering is more nearly random in the bulk.
There are also very distinct differences in the water orientation in the interior of the channel. Overall, the protein seems to have a greater interior orienting effect in the 3dc system than in the tinfoil system. This behavior may be linked with the observed behavior in the bulk and most likely occurs for the same reason. The most distinctive difference between the two profiles lies in the interval of z between 0 and 1 nm. This region of the channel has been assigned to Glu-18 (Tieleman et al., 2002). One of the Glu-18 residues carries a negative charge; thus it is likely that the orientation of water in this region is due to the charge. Here the average orientation of water in the 3dc system is opposite to that seen in the tinfoil system. It is also greater in magnitude.
Electrostatic differences due to water
Differences in the polarization of water in the bulk and in the channel for the two systems would be expected to produce substantial changes in the electric field inside the channel. We originally chose to loosely restrain the protein atoms to their initial positions because it would allow for a more “natural” behavior of the system than we would observe if the protein atoms were entirely frozen to their initial positions. However, it may be argued that the subtle differences in the loosely restrained channel pore may cause differences in the way water orients, thus drastically affecting the local electric field in the channel. To put these doubts to rest, we decided to perform two additional 5-ns simulations analogous to the “3dc” and “tinfoil” simulations described in the Methods section, but with the POPC, protein, and sodium atoms frozen in identical configurations throughout the trajectories. With such constraints imposed, we allow only water to move. Hence there is absolutely no question as to whether our results depend on the subtle differences in the time evolution of the protein and POPC structures because their configurations are guaranteed to be exactly the same in both systems. For brevity, we will abide by our convention and refer to these additional simulation systems as the frozen-3dc and frozen-tinfoil systems.
Upon performing analysis on the final 3 ns of these trajectories, we find that the water orientation profiles along the z-axis (Fig. 9) are nearly identical in their shape and features to those displayed for the systems where the protein was merely restrained. The artificial ordering of water in the bulk is again seen in the frozen-tinfoil system. The difference in the polarization of water inside the channel is also visibly the same as in the previously described unfrozen case.
To characterize the electrostatic differences in the systems employing different boundary conditions, the z-component of the electric field experienced by the sodium ion was explicitly calculated at various positions along the channel axis. We did so by performing five additional 1-ns simulations starting from the final structures of the 5-ns frozen runs. In each run, the POPC and protein were again held frozen to identical configurations. The sodium ion was also held frozen to an identical location in each system, but for each of the five systems, we placed the ion in a different location along the channel (z) axis. Two of these locations were in the bulk water and the other three were in the interior of the channel. The ion was also placed at several additional locations along the interior channel axis for short, 100-ps simulations to provide a more fine-grained picture of the electric field in this region. Fig. 7 b shows the locations of the sodium ion with respect to the protein for these calculations.
The electric field experienced by the sodium ion at these locations is shown in Fig. 10. Both profiles have very similar character. As expected, the electric field in both systems is zero in the bulk water. The largest magnitude of the electric field in the frozen-3dc system is ∼19.2 V/nm and occurs at z ∼ −0.9 nm. The largest value of the electric field in the frozen-tinfoil system occurs in the same position along z and is ∼10.1 V/nm (∼53% of that in the 3dc system). The water orientation profiles in Fig. 9 reflect this extremum in the electric field for both systems. The region along the channel axis corresponding to the positive and negative extrema of the electric field in both systems corresponds to the narrow region of the pore due to Gln-7. Thus, the different extents to which the water is locally ordered due to Gln-7 in each system gives rise to very different local electric fields.
FIGURE 10.

Electric field (z-component) calculations for the frozen-3dc and frozen-tinfoil systems. Error bars for the points in the bulk water (± 3.5 nm) and a few points in the channel interior were calculated by dividing the latter 800-ps portion of each of the 1-ns trajectories into eight 100-ps trajectories. The other points are a result of averaging over the last 50 ps of a series of 100-ps trajectories. The vertical dotted lines delimit the channel boundaries.
Generally, the electric field tends to be higher in the case of slab geometry in the widest region of the pore near the center of the channel. The difference in the orientation of the water seen in the region of Glu-18 (0 nm < z < 1 nm; see Fig. 9) is again reflected in the electric field. The effect of the single negatively charged Glu residue in this region is more pronounced in the frozen-3dc system than in the frozen-tinfoil system. The point at which the ion experiences a minimum in the electrostatic potential due to the negative charge is near z = 0.8 nm in the frozen-3dc system and in the range 0.3 nm < z < 1.2 nm in the frozen-tinfoil system.
These differences would definitely have ramifications if one were to study ion transport within a channel such as this. It is clear that the electrostatic differences in the two systems are due only to the orientation of water since the coordinates of the protein atoms are the same in both cases. Also, since the water occupancy of the channels is the same, the differences in the electric field cannot be due to differences in the occupancy. The contribution to the electric field from the POPC bilayer was the same in both systems (data not shown). This result reinforces the subtle importance of water as a very sensitive polarizable medium.
CONCLUSIONS
Ewald methods have been used for many years by simulators when dealing with systems employing three-dimensional periodic boundary conditions. It was shown recently that the Ewald method devised for systems with three-dimensional boundary conditions can also be applied to systems with slab geometry if the correct surface term is considered (Yeh and Berkowitz, 1999). It has also been suggested that this geometry may be of interest for the simulation of “inhomogeneous” lipid membrane systems such as membrane-channel systems (Tobias, 2001; Tieleman et al., 2002). In this work, we applied this method for the feasible and efficient MD simulation of a membrane-channel type system. We have shown that the effective removal of z-periodicity intrinsic to the method provides a different orientational polarization of water in the channel interior. Furthermore, the artificial ordering of bulk water due to image protein dipoles that is seen when employing normal three-dimensional periodicity vanishes when slab geometry is used. These changes to the structure of water in the system using slab geometry lead to a different electric field inside the channel even though many other qualitative properties are the same in both systems such as the occupancy of the channel, the channel structure and pore size, and the diffusion of water inside the channel.
Yang and co-workers have found in their simulation studies on model ion channels using three-dimensional periodicity and a spherical Ewald sum that properties such as the electrostatic potential, local water density, ion current, and occupancy of the channel are invariant upon the implementation of different simulation cell sizes (Yang et al., 2002). It has also been found in simulations of the same channel presented in this work that the orientation of water seen in the bulk is insensitive to the addition of a 4-nm layer of water to the bath outside the membrane (Tieleman et al., 2002) when using a spherical Ewald sum. This means that even if convergence is achieved in simulations where full three-dimensional periodicity is applied, the converged result can be different from the result that could be obtained using slab geometry. Note that when three-dimensional periodicity is used in our system the ordering of water in the bulk is observed. This ordering is relieved when employing slab geometry.
If one were to study the behavior of a charged species such as an ion in a channel, one might observe very different forces on the ion upon implementing slab geometry rather than three-dimensional periodic boundary conditions. Hence, if the timescale were large enough, different conductance and dynamic behavior of the ion might be observed inside the channel when using these different boundary conditions. This result would be most crucial for channels that have a good amount of water in their interior for the passage of their permeant species, their average structure, and the behavior of solutions near their surface. The effect would be most pronounced in channels with a large dipole moment along their conduction axis.
In demonstrating the difference in the orientational polarization of water and the electric field inside channels upon employing slab geometry as opposed to three dimensional boundry conditions, we have chosen a six-helix alamethicin bundle. This is a system in which the protein dipole may be particularly pronounced since the protein consists of parallel rather than antiparallel helices. The calculated dipole moment of our alamethicin bundle and its counterion was ∼361 D in magnitude and had a channel-axis (z) component of 345 D. Such a dipole provides a sizable asymmetry in the z-dimension of our system. Other membrane channels consisting of antiparallel helices or β-barrels may or may not provide such an asymmetry as to cause unavoidable artifacts.
As an example, we calculated the net dipole moment of halorhodopsin (PDB identifier 1e12) by placing GROMACS (van der Spoel et al., 2001) charges on the protonated structure determined by Kolbe and co-workers (Kolbe et al., 2000). Halorhodopsin is a structural neighbor of the family of G-protein coupled receptors and a member of the archaeal rhodopsins. It is a chloride pump consisting of seven antiparallel transmembrane helices. Water is well known to line the extracellular vestibule of the pump leading to the chloride binding site. Thus, in studying such a membrane protein using MD, one might give thought to the behavior of water and how it affects the interior chloride ion. The termini of the available structure were capped appropriately for biological pH, and missing residues were completed. The dipole moment of this protein along with a chloride ion in its interior binding site (neutral net charge) along the channel axis was determined to be ∼395 D. This dipole magnitude is quite large and would provide a sizable asymmetry along the channel axis of a membrane-channel system.
We have provided a simulation study that shows the structural and electrostatic differences in a membrane-channel system where the differences are easily demonstrable. However, our account of the differences upon employing slab geometry is by no means exhaustive. Different channels may provide different asymmetries in the membrane. In some cases, the implementation of three-dimensional periodicity may give results consistent with slab geometry. Thus, we cannot conclude that previous MD studies' observations pertaining to the electostatic and structural properties of water in membrane channels are riddled with artifacts. However, the apparent benefit one might gain from the use of slab geometry is that the two-dimensional character of the natural biological membrane is mimicked in slab geometry by representing the system with crystalline ordering in two dimensions rather than three (Tobias, 2001). In other words, a natural membrane bound channel will have a variety of other membrane-anchored proteins in its vicinity along the membrane plane, but never directly above or below it. Given the apparent benefits and given that the implementation of slab geometry is nearly as computationally inexpensive as regular three-dimensional geometry in MD simulation, we can recommend its usage in future simulations of this type. Though in some cases one can speculate that the results may be the same, the only real way to know whether the results of three-dimensional and slab geometry converge in a particular membrane-channel system is to test the results of both methods for that particular system. That is exactly what we have done in this work.
If a channel macro-dipole is found to contribute a sizable enough asymmetry along its conduction axis to warrant attention to the polarization of water within the interior, it is very likely that special attention should be paid to narrow channels that have continuous water occupancy. In these cases, water is confined and its rotational degrees of freedom are particularly influenced by interaction with the channel wall (de Groot and Grubmuller, 2001; Hummer et al., 2001; Sansom et al., 2002; Tajkhorshid et al., 2002). Channels with a larger pore diameter allow their permeant species to pass with fewer boundary forces due to the channel wall because of the effective “screening” that occurs due to the large amount of water occupying the pore (Corry et al., 1999).
There are also ramifications of the implementation of slab geometry for the simulation of membrane and membrane-channel systems where the aqueous solution on either side of the membrane is electrolytic or contains some uncharged solute. The concentration of a solute on either side of the membrane in slab geometry need not be the same in the aqueous baths on each side of the membrane. If three-dimensional periodicity is taken, such a system must necessarily have an equivalent concentration of species on either side of the membrane since the central simulation cell has access to its images above and below via the image convention. There has been much interest in the study of transport through channels due to natural biological gradients (for an example, see the work of Zhu, Tajkhorshid, and Schulten (Zhu et al., 2002)). Simulation in slab geometry provides a means for the study of the permeation of species through channels under the influence of real concentration gradients, osmotic pressures, and electrochemical potentials due to differences in the concentration of electrolyte.
Our results not only lend insight to the usage of appropriate boundary conditions for certain membrane-channel simulations, but also to the usage of continuum solvent models for the simulation of such systems. Since the orientational polarization of water in the interior of a channel plays such an important role in the electrostatic field experienced by its permeant species, it is not hard to imagine that if a simple choice in boundary conditions can so drastically affect the polarization of explicit water, then the difficulties in modeling such a system using implicit continuum solvent models are compound. A recent study of the gramicidin channel by Edwards and co-workers (Edwards et al., 2002) has illustrated these difficulties very clearly. If interior water is present in a membrane channel, the subtleties of the electric field experienced by the permeant species hinges on its orientational behavior.
Many MD studies of membrane channels appeal to the subject of transport. Indeed, the ideal goal in simulating such systems is to relate channel structural features to their transport capabilities. For example, studies of simple channels such as gramicidin-A are often aimed at quantifying the free-energy profile for ion permeation across these channels (Pullman, 1987; Roux and Karplus, 1991; Partenskii and Jordan, 1992). It has been found that although these free-energy descriptions are qualitatively sensible, they do not lead to accurate predictions of conductance (McGill and Schumaker, 1996; Edwards et al., 2002). Often the blame for these inaccuracies falls on the forcefields used to derive them. In the case of ion channels, the interactions between an ion and the rest of the system can be described as dispersive and electrostatic. Since it is generally accepted that the dispersive interactions between atomic sites in MD simulations are reasonably described, the blame must fall on the partial charges assigned to atomic sites on the protein and lipid models. Therefore, in the case of ion channels, “blaming” the forcefield amounts to “blaming” partial charges on atomic sites in forcefield models. If this is the case, then it is essential that the forces arising from the interaction of these partial charges are treated appropriately given the situation at hand before we begin condemning forcefield models. This is not to say that partial charges on MD models are usually correct, but that their correctness may best be questioned after their appropriate implementation is ensured. Since a two-dimensional periodicity better mimics a true membrane-channel system, treating such systems with slab geometry may be a step toward a more appropriate treatment.
Acknowledgments
We thank Prof. D. P. Tieleman for providing us with a copy of his most recent work on this topic (Tieleman et al., 2002) before its publication and for his helpful suggestions. Computational support from the North Carolina Supercomputing Center is gratefully acknowledged.
This work was supported by the National Science Foundation under grant MCB0077499 and also in part by the Molecular and Cellular Biophysics Program at the University of North Carolina at Chapel Hill under the U.S. Public Health Service training grant T32 GM08570.
References
- Allen, R., S. Melchionna, and J.-P. Hansen. 2002. Intermittent permeation of cylindrical nanopores by water. Phys. Rev. Lett. 89:175502. [DOI] [PubMed] [Google Scholar]
- Arnold, A., J. de Joannis, and C. Holm. 2002. Electrostatics in periodic slab geometries I. J. Chem. Phys. 117:2496–2502. [DOI] [PubMed] [Google Scholar]
- Berendsen, H. J. C., D. van der Spoel, and R. van Drunen. 1995. GROMACS: a message-passing parallel molecular dynamics implementation. Comput. Phys. Commun. 91:43–56. [Google Scholar]
- Berger, O., O. Edholm, and F. Jahnig. 1997. Molecular dynamics simulations of a fluid bilayer of dipalmitoylphosphatidylcholine at full hydration, constant pressure, and constant temperature. Biophys. J. 72:2002–2013. [DOI] [PMC free article] [PubMed] [Google Scholar]
- Bródka, A., and A. Grzybowski. 2002. Electrostatic interactions in computer simulations of a three-dimensional system periodic in two directions: Ewald-type summation. J. Chem. Phys. 117:8208–8211. [Google Scholar]
- Cafiso, D. S. 1994. Alamethicin: a peptide model for voltage gating and protein membrane interactions. Annu. Rev. Biophys. Biomol. Struct. 23:141–165. [DOI] [PubMed] [Google Scholar]
- Corry, B., S. Kuyucak, and S.-H. Chung. 1999. Test of Poisson-Nernst-Planck theory in ion channels. J. Gen. Physiol. 114:597–599. [DOI] [PMC free article] [PubMed] [Google Scholar]
- de Groot, B. L., and H. Grubmuller. 2001. Water permeation across biological membranes: mechanism and dynamics of aquaporin-1 and GlpF. Science. 294:2353–2357. [DOI] [PubMed] [Google Scholar]
- de Joannis, J., A. Arnold, and C. Holm. 2002. Electrostatics in periodic slab geometries II. J. Chem. Phys. 117:2503–2512. [DOI] [PubMed] [Google Scholar]
- Deserno, M., and C. Holm. 1998. How to mesh up Ewald sums. J. Chem. Phys. 109:7678–7701. [Google Scholar]
- Edwards, S., B. Corry, S. Kuyucak, and S. Chung. 2002. Continuum electrostatics fails to describe ion permeation in the gramicidin channel. Biophys. J. 83:1348–1360. [DOI] [PMC free article] [PubMed] [Google Scholar]
- Elcock, A. H. 2002. Modeling supramolecular assemblages. Curr. Opin. Struct. Biol. 12:154–160. [DOI] [PubMed] [Google Scholar]
- Essmann, U., and M. L. Berkowitz. 1999. Dynamical properties of phospholipid bilayers from computer simulation. Biophys. J. 76:2081–2089. [DOI] [PMC free article] [PubMed] [Google Scholar]
- Essmann, U., L. Perera, M. L. Berkowitz, T. Darden, H. Lee, and L. Pedersen. 1995. A smooth particle mesh Ewald method. J. Chem. Phys. 103:8577–8593. [Google Scholar]
- Forrest, L. R., and M. S. P. Sansom. 2000. Membrane simulations: bigger and better? Curr. Opin. Struct. Biol. 10:174–181. [DOI] [PubMed] [Google Scholar]
- Hansson, T., C. Oostenbrink, and W. F. van Gunsteren. 2002. Molecular dynamics simulations. Curr. Opin. Struct. Biol. 12:190–196. [DOI] [PubMed] [Google Scholar]
- Hess, B., H. Bekker, H. J. C. Berendsen, and J. G. E. M. Fraaige. 1997. LINCS: a linear constraint solver for molecular simulations. J. Comput. Chem. 18:1463–1472. [Google Scholar]
- Hummer, G., J. C. Rasaiah, and J. P. Noworyta. 2001. Water conduction through the hydrophobic channel of a carbon nanotube. Nature. 414:188–190. [DOI] [PubMed] [Google Scholar]
- Humphrey, W., A. Dalke, and K. Schulten. 1996. VMD: visual molecular dynamics. J. Mol. Graph. 14:33–38. [DOI] [PubMed] [Google Scholar]
- Hunenberger, P. H., and J. A. McCammon. 1999. Effect of artificial periodicity in simulations of biomolecules under Ewald boundary conditions: a continuum electrostatics study. Biophys. Chem. 78:69–88. [DOI] [PubMed] [Google Scholar]
- Kawata, M., and M. Mikami. 2002. Computationally efficient method to calculate the Coulomb interactions in three-dimensional systems with two-dimensional periodicity. J. Chem. Phys. 116:3430–3448. [Google Scholar]
- Klapp, S. H. L., and M. Schoen. 2002. Spontaneous orientational order in confined dipolar fluid films. J. Chem. Phys. 117:8050–8062. [Google Scholar]
- Kohlmeyer, A., C. Hartnig, and E. Spohr. 1998. Orientational correlations near interfaces. Computer simulations of water and electrolyte solutions in confined environments. J. Mol. Liq. 78:233–253. [Google Scholar]
- Kolbe, M., H. Besir, L. Essen, and D. Oesterhelt. 2000. Structure of the light-driven chloride pump halorhodopsin at 1.8 angstrom resolution. Science. 288:1390–1396. [DOI] [PubMed] [Google Scholar]
- Lindahl, E., B. Hess, and D. van der Spoel. 2001. Gromacs 3.0: a package for molecular simulation and trajectory analysis. J. Mol. Mod. 7:306–317. [Google Scholar]
- Luty, B. A., and W. F. van Gunsteren. 1996. Calculating electrostatic interactions using the particle-particle particle-mesh method with nonperiodic long-range interactions. J. Phys. Chem. 100:2581–2587. [Google Scholar]
- McGill, P., and M. F. Schumaker. 1996. Boundary conditions for single ion diffusion. Biophys. J. 71:1723–1742. [DOI] [PMC free article] [PubMed] [Google Scholar]
- Merrit, E. A., and D. J. Bacon. 1997. Raster3D: photorealistic molecular graphics. Methods Enzymol. 277:505–524. [DOI] [PubMed] [Google Scholar]
- Nagle, J. F., and S. Tristram-Nagle. 2000. Lipid bilayer structure. Curr. Opin. Struct. Biol. 10:474–480. [DOI] [PMC free article] [PubMed] [Google Scholar]
- Nose, S., and M. L. Klein. 1983. Constant pressure molecular dynamics for molecular systems. Mol. Phys. 50:1055–1076. [Google Scholar]
- Parrinello, M., and A. Rahman. 1981. Polymorphic transitions in single crystals: a new molecular dynamics method. J. Appl. Phys. 52:7182–7190. [Google Scholar]
- Partenskii, M. B., and P. C. Jordan. 1992. Theoretical perspectives on ion-channel electrostatics: continuum and microscopic approaches. Q. Rev. Biophys. 25:477–510. [DOI] [PubMed] [Google Scholar]
- Pullman, A. 1987. Energy profiles in the gramicidin A channel. Q. Rev. Biophys. 20:173–200. [DOI] [PubMed] [Google Scholar]
- Roux, B. 2002. Theoretical and computational models of ion channels. Curr. Opin. Struct. Biol. 12:182–189. [DOI] [PubMed] [Google Scholar]
- Roux, B., and M. Karplus. 1991. Ion transport in a gramicidin-like channel: dynamics and mobility. J. Phys. Chem. 95:4856–4868. [Google Scholar]
- Sansom, M. S. P. 1993. Structure and function of channel-forming peptaibols. Q. Rev. Biophys. 26:365–421. [DOI] [PubMed] [Google Scholar]
- Sansom, M. S. P. 1998. Models and simulations of ion channels and related membrane proteins. Curr. Opin. Struct. Biol. 8:237–244. [DOI] [PubMed] [Google Scholar]
- Sansom, M. S. P., P. Bond, O. Beckstein, P. Biggin, J. Faraldo-Gomez, R. J. Law, G. Patargias, and P. Tieleman. 2002. Ion Channels—from Atomic Resolution Physiology to Functional Genomics. Wiley, Chichester. p 66–83.
- Sansom, M. S. P., I. H. Shrivastava, K. M. Ranatunga, and G. R. Smith. 2000. Simulations of ion channels–watching ions and water move. Trends Biochem. Sci. 25:368–374. [DOI] [PubMed] [Google Scholar]
- Smart, O. S., J. G. Neduvelil, X. Wang, B. A. Wallace, and M. S. P. Sansom. 1996. HOLE: a program for the analysis of the pore dimensions of ion channel structural models. J. Mol. Graph. 14:354–360. [DOI] [PubMed] [Google Scholar]
- Smith, P. E., H. D. Blatt, and B. M. Pettitt. 1997. On the presence of rotational Ewald artifacts in the equilibrium and dynamical properties of a zwitterionic tetrapeptide in aqueous aolution. J. Phys. Chem. B. 101:3886–3890. [Google Scholar]
- Smith, P. E., and B. Pettitt. 1996. Ewald artifacts in liquid state molecular dynamics simulations. J. Chem. Phys. 105:4289–4293. [Google Scholar]
- Tajkhorshid, E., P. Nollert, M. Ø. Jensen, L. J. W. Miercke, J. O'Connell, R. M. Stroud, and K. Schulten. 2002. Control of the selectivity of the aquaporin water channel family by global orientational tuning. Science. 296:525–530. [DOI] [PubMed] [Google Scholar]
- Tieleman, D. P., J. Breed, H. J. C. Berendsen, and M. S. P. Sansom. 1998. Alamethicin channels in a membrane: molecular dynamics simulations. Faraday Discuss. 111:209–223. [DOI] [PubMed] [Google Scholar]
- Tieleman, D. P., B. Hess, and M. S. P. Sansom. 2002. Analysis and evaluation of channel models: simulations of alamethicin. Biophys. J. 83:2393–2407. [DOI] [PMC free article] [PubMed] [Google Scholar]
- Tieleman, D. P., S. J. Marrink, and H. J. C. Berendsen. 1997. A computer perspective of membranes: molecular dynamics studies of lipid bilayer systems. Biochim. Biophys. Acta. 1331:235–270. [DOI] [PubMed] [Google Scholar]
- Tieleman, D. P., M. S. P. Sansom, and H. J. C. Berendsen. 1999. An alamethicin channel in a lipid bilayer: molecular dynamics simulation. Biophys. J. 76:1757–1769. [DOI] [PMC free article] [PubMed] [Google Scholar]
- Tobias, D. J. 2001. Electrostatics calculations: recent methodological advances and applications to membranes. Curr. Opin. Struct. Biol. 11:253–261. [DOI] [PubMed] [Google Scholar]
- Tuckerman, M. E., and G. J. Martyna. 2000. Understanding modern molecular dynamics: techniques and applications. J. Phys. Chem. B. 104:159–178. [Google Scholar]
- van der Spoel, D., A. R. van Buuren, E. Apol, P. J. Meulenhoff, D. P. Tieleman, A. L. T. M. Sijbers, B. Hess, K. A. Feenstra, E. Lindahl, R. van Drunen, and H. J. C. Berendsen. 2001. Gromacs User Manual Version 3.0. Nijenborgh. AG Grongen, The Netherlands.
- Weber, W., P. H. Hunenberger, and J. A. McCammon. 2000. Molecular dynamics simulations of a polyalanine octapeptide under Ewald boundary conditions: influence of artificial periodicity on peptide conformation. J. Phys. Chem. B. 104:3668–3675. [Google Scholar]
- Woolley, G. A., P. C. Biggin, A. Schultz, L. Lien, D. C. Jaikaran, J. Breed, K. Crowhurst, and M. S. P. Sansom. 1997. Intrinsic rectification of ion flux in alamethicin channels: studies with an alamethicin dimer. Biophys. J. 73:770–778. [DOI] [PMC free article] [PubMed] [Google Scholar]
- Yang, Y., D. Henderson, P. Crozier, R. L. Rowley, and D. D. Busath. 2002. Permeation of ions through a model biological channel: effect of periodic boundary conditions and cell size. Mol. Phys. 100:3011–3019. [Google Scholar]
- Yeh, I., and M. L. Berkowitz. 1999. Ewald summation for systems with slab geometry. J. Chem. Phys. 111:3155–3162. [Google Scholar]
- Yeh, I., and M. L. Berkowitz. 2000. Effects of the polarizability and water density constraint on the structure of water near charged surfaces: molecular dynamics simulations. J. Chem. Phys. 112:10491–10495. [Google Scholar]
- Zhu, F., E. Tajkhorshid, and K. Schulten. 2002. Pressure-induced water transport in membrane channels studied by molecular dynamics. Biophys. J. 83:154–160. [DOI] [PMC free article] [PubMed] [Google Scholar]