

Abstract
We have constructed a model of the upper part of the glycolysis in the pancreatic β-cell. The model comprises the enzymatic reactions from glucokinase to glyceraldehyde-3-phosphate dehydrogenase (GAPD). Our results show, for a substantial part of the parameter space, an oscillatory behavior of the glycolysis for a large range of glucose concentrations. We show how the occurrence of oscillations depends on glucokinase, aldolase and/or GAPD activities, and how the oscillation period depends on the phosphofructokinase activity. We propose that the ratio of glucokinase and aldolase and/or GAPD activities are adequate as characteristics of the glucose responsiveness, rather than only the glucokinase activity. We also propose that the rapid equilibrium between different oligomeric forms of phosphofructokinase may reduce the oscillation period sensitivity to phosphofructokinase activity. Methodologically, we show that a satisfying description of phosphofructokinase kinetics can be achieved using the irreversible Hill equation with allosteric modifiers. We emphasize the use of parameter ranges rather than fixed values, and the use of operationally well-defined parameters in order for this methodology to be feasible. The theoretical results presented in this study apply to the study of insulin secretion mechanisms, since glycolytic oscillations have been proposed as a cause of oscillations in the ATP/ADP ratio which is linked to insulin secretion.
INTRODUCTION
The study of stimulus-secretion coupling in the pancreatic β-cell is of greatest importance for the understanding of glucose homeostasis and diabetes. The prevailing main hypothesis of the glucose-mediated stimulus-secretion pathway is that glucose enters the β-cell via a membrane-bound glucose transporter and is metabolized in the glycolysis, whose end product, pyruvate, enters the mitochondria. These events are thought to raise the [ATP]/[ADP] ratio, a raise which closes ATP-sensitive potassium (KATP) channels in the cell membrane (Corkey et al., 1988). The resulting membrane depolarization opens voltage sensitive calcium (CaV) channels, resulting in an increased cytosolic calcium concentration (Hellman et al., 1994). Such an increase, in turn, is well correlated with insulin secretion from secretory vesicles (Newgard and McGarry, 1995; Jonas et al., 1998).
A distinguishing feature of the secretory machinery is that insulin is secreted in a pulsatory manner with a period on the order of minutes (Lang et al., 1979). Notably, these oscillations are lost in type II diabetes (Polonsky et al., 1988). Membrane potential exhibits oscillations in the form of bursts, with periods on the order of minutes as well as faster burst patterns with periods in the order of seconds (Liu et al., 1998). These bursts, in turn, are synchronized with calcium entry into the cell (Dryselius et al., 1999).
Due to the complexity of this system, mathematical modeling and numerical simulation is necessary to enable a compact representation of the current knowledge and as a tool to make meaningful quantitative predictions guiding future experimental studies. Thus, the β-cell has attracted the attention of theoretical investigators, who have suggested several mathematical models explaining the faster bursting pattern of β-cells (Sherman, 1996; Chay, 1997). Regarding the slower oscillations, which due to the period similarity and correlation with the insulin secretion are considered to be crucial, an increasing amount of experimental data suggests that they are the result of an oscillatory glycolysis. Experimental data supporting this theory include coordinated oscillations in the [ATP]/[ADP] ratio, glucose-6-phosphate (G6P) concentration, calcium concentration, and insulin secretion (Nilsson et al., 1996; Deeney et al., 2001), as well as calcium-independent oscillatory oxygen consumption (Porterfield et al., 2000). There is thus a need for modeling studies of this area of β-cell biochemistry. We here suggest a theoretical model of glycolytic oscillations in the β-cell and present some predictions and conclusions based on this model concerning the control of the occurrence and frequency of oscillations.
The third enzyme of the glycolysis, phosphofructokinase (PFK), has for a long time been known to cause oscillations in the glycolysis in yeast and muscle (Goldbeter and Caplan, 1976; Hess, 1997). There are several indications that it is also playing a role for the occurrence of oscillations in β-cell glycolysis as well (Tornheim, 1997). PFK has also from a clinical perspective been shown to be crucial for normal insulin secretion (Ristow et al., 1999). Given the currently available data on glycolytic enzymes in the pancreatic β-cell, we construct a minimal model coupling glucose to the PFK catalyzed reaction.
The earliest model of oscillatory PFK dynamics is due to Higgins (1964), who explained glycolytic oscillations in yeast with the activation of PFK by one of its products, fructose-1,6-bisphosphate (FBP). The model of Goldbeter and Lefever (1972), also concerning yeast glycolysis, focused on the activation by the other product, ADP. As experimental data later accumulated, it became clear that glycolytic oscillations in muscle primarily depend on PFK activation by FBP (Tornheim and Lowenstein, 1975; Tornheim, 1988). More recently, Yaney et al. (1995) demonstrated that pancreatic PFK to a great deal is comprised by the muscle isozyme, and also for the first time directly demonstrated the activation of pancreatic PFK by FBP. Consequently, we will here focus on this mechanism.
Previous models of β-cell glycolysis have mainly focused on steady-state analysis. Achs et al. (1991) constructed a very detailed model, consequently more difficult to validate, while other workers (Sweet and Matschinsky, 1995; Sweet et al., 1996, 1997) created a simpler core model focused on the regulatory properties of glucokinase, the first enzyme in the glycolytic pathway in β-cells.
In this study we propose the first model of glycolytic oscillations in the β-cell that we are aware of, although models of muscle glycolysis with emphasis on oscillatory behavior based on PFK dynamics exist (Tornheim, 1979; Smolen, 1995) and are based on the same mechanism. Methodologically, our study differs from these in the respect that we especially address the factors which are presently less known experimentally. We then analyze the qualitative behavior of the model in terms of these factors, which include concentrations of enzymes and some of the allosteric regulatory properties of PFK. Two main aspects of the qualitative behavior of the model are considered, the parameter ranges that produce oscillatory behavior, and the frequency of oscillations and control thereof.
We will emphasize the use of an operationally well-defined mathematical formulation of the model, meaning that the model parameters reflect the degrees of freedom biochemists observe in an as high degree as possible. This is important to validate the model in terms of experimental uncertainties.
METHODS AND MODEL
Our analysis concerns up to six biochemical reactions, as illustrated in Fig. 1. Cytosolic glucose (Glc) is phosphorylated in a reaction catalyzed by glucokinase (GK), resulting in the formation of G6P. G6P is converted to fructose 6-phosphate (F6P) in the reaction catalyzed by glucose-6-phosphate isomerase (GPI), followed by the PFK reaction which phosphorylates F6P to form FBP. Notable about this reaction is the autocatalysis mentioned in the introduction; FBP is an activator of PFK. FBP is removed through the fructose-bisphosphate aldolase (FBA) catalyzed reaction which produces dihydroxyacetone-phosphate (DHAP) and glyceraldehyde-3-phosphate (G3P). DHAP is converted to G3P by triose-phosphate isomerase (TPI). Finally, G3P is removed by glyceraldehyde-3-phosphate dehydrogenase (GAPD). The primary data source on the activities of the different glycolytic enzymes in the β-cell are the papers by Trus et al. (1981) and Shimizu et al. (1988). To obtain a manageable model, we apply the method of separation of timescales and consider the reactants of enzymes displaying high activity to be maintained at an approximate equilibrium. Thus, we consider the GPI and TPI reactions as an equilibria. The enzymes of the lower part of the glycolysis all exhibit an activity at least an order of magnitude greater than GK, PFK, and FBA (Trus et al., 1981; Shimizu et al., 1988). A possible exception is GAPD, whose activity was measured in the backward direction by Shimizu et al. (1988). The backward activity was found to be 10 times greater than that of FBA, but the forward activity may be as low as 10 times lower than the backward activity (Velick and Furfine, 1963). However, Trus et al. (1981) found the forward GAPD activity to be almost 10 times greater than that of PFK and 400 times higher than that of GK.
FIGURE 1.
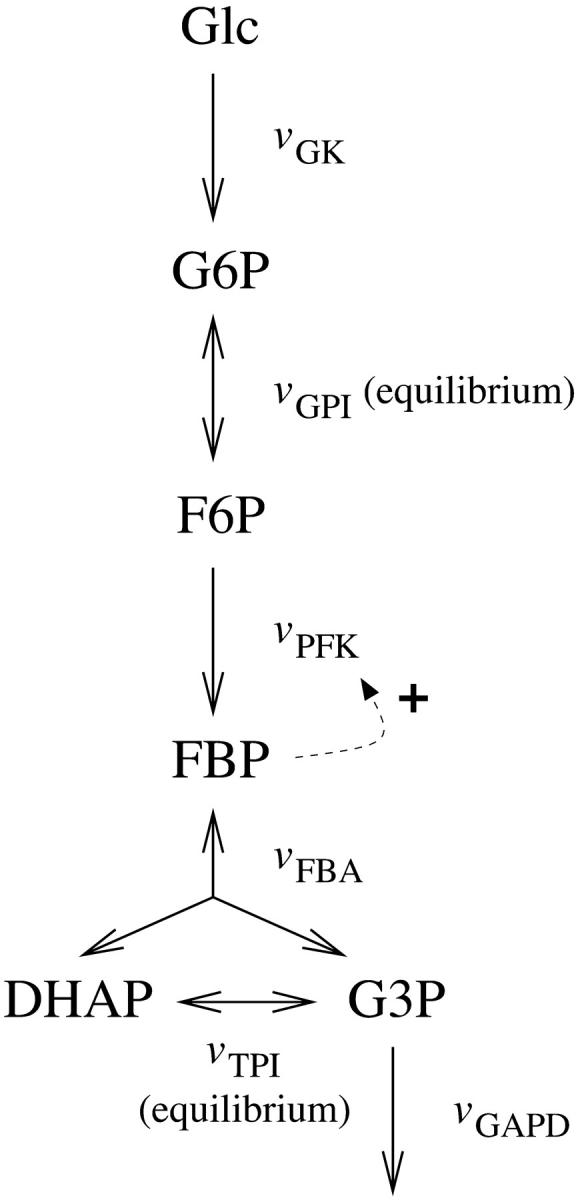
Schematic representation of the model. The fluxes over the enzyme catalyzed reactions are denoted v. The dashed arrow represents the allosteric activation of PFK by FBP. The basic model is truncated after FBA, whereas the extended model takes all reactions into account.
The main analysis is made using a basic model which is truncated after FBA, and thus assumes the results of Trus et al. (1981) to hold. A more thorough analysis of the removal of FBP demands inclusion of GAPD. This is achieved with an extended model.
The GK and PFK reactions are at physiological conditions practically irreversible and are here considered as such. Adenine nucleotides were omitted from the model since the dynamics of the processes generating and consuming them are poorly understood, and since experimental data (Tornheim and Lowenstein, 1975; Tornheim, 1988) suggest that FBP-dependent activation of PFK is the primary positive feedback loop generating oscillations, although the activator AMP in these experiments had to be present in order for FBP to activate PFK.
We formulate the basic model in terms of two dimensionless variables,  and
and  . The parameters
  and
and  represent the half-activation points for PFK (in the absence of any allosteric modifier) and FBA respectively. The GPI equilibrium has an equilibrium constant
  , and when introducing
  the model can be written as
 |
(1) |
where the fluxes v over the different enzymatic reactions are defined in Fig. 1.
The extended model incorporates the TPI and GAPD reactions. The TPI reaction exhibits a very large limiting rate and is here considered as an equilibrium with equilibrium constant KeqTPI. The extended model is then written as
 |
(2) |
where  and g =
  .
.  is the half-activation point (or Michaelis constant) of GAPD with respect to G3P.
The main analysis of the glycolytic oscillator is performed on the basic model. The extended model is used when analyzing the control over the removal of FBP, this control being exerted both by FBA and by GAPD. In the limiting case, when VGAPD ≫ VFBA (as suggested by Trus et al. (1981)), the basic model applies also here. All computations were made using the program XPPAUT (http://www.math.pitt.edu/∼bard/xpp/xpp.html).
Rate equations
GK
Glucose phosphorylation is in β-cells performed mainly by glucokinase (hexokinase D) (Schuit et al., 1999). The reaction may at physiological conditions be considered to be irreversible and also saturated with respect to MgATP because of the low half-activation point with respect to this substrate (Takeda et al., 1993). The flux-concentration curve of GK is slightly sigmoidal, and vGK is modeled with a Hill equation,
 |
(3) |
where  is the half-activation point of GK with respect to glucose, and where hGK is the Hill coefficient.
PFK
We assume that PFK with respect to its substrates, F6P and MgATP, follows rapid equilibrium random bimolecular kinetics (Merry and Britton, 1985). The enzyme may at physiological conditions be considered to be fully saturated with respect to MgATP (Bosca et al., 1985).
Mammalian M-type PFK exhibits sigmoidal kinetics toward F6P. The allosteric modifier FBP exerts its influence by displacing the effective value of the half-activation point toward lower F6P concentrations, whereas the limiting rate (reaction rate approached upon addition of excess F6P) seems to remain constant regardless of FBP concentration (Uyeda, 1979). We may operationally define a parameter β as the factor by which the half-activation point gets multiplied in the limiting case of addition of excess FBP (see Fig. 2 a). Further, some experiments suggest the Hill coefficient is lowered by FBP (Bloxham and Lardy, 1973; Uyeda, 1979; Otto et al., 1977), although this effect is not apparent in other studies (Tornheim and Lowenstein, 1976).
FIGURE 2.

(a) Flux-concentration curves of normalized PFK flux and F6P. The different curves correspond to different FBP concentrations. The half-activation point is multiplied by a factor  upon the presence of excess FBP. (b) Flux-concentration curves of normalized PFK flux and the allosteric activator FBP, with σ = 0.25. The two different curves correspond to the two different estimates of X0.5.
The most frequent way of describing PFK kinetics has been to use some kind of Monod-Wyman-Changeux (MWC) rate equation (Blangy et al., 1968; Goldbeter and Lefever, 1972; Otto et al., 1977; Venieratos and Goldbeter, 1979; Pettigrew and Frieden, 1979; Termonia and Ross, 1981). However, there are problems with this approach when applied to mammalian M-type PFK, directly evident by a lack of ability of the MWC model to fit experimental data (Smolen, 1995). Furthermore, it has been argued from a mechanistic perspective that M-type PFK exists in at least three different states in contrast to the two states of the MWC model (Kemp and Foe, 1983). In the MWC model, the limiting rate, Hill coefficient, and β are interrelated in a complex manner through the model parameters and cannot be varied independently (Goldbeter, 1976). This may account for the difficulty of finding a parameter set accounting for experimentally observed kinetic behavior.
Instead, we use a phenomenological Hill-type equation extended to account for allosteric modifiers (Hofmeyr and Cornish-Bowden, 1997). An advantage with this equation is that among its parameters we find precisely the operationally well-defined entities discussed above; the limiting rate, Hill coefficient, and β may thus be varied independently. The rate equation is written
 |
(4) |
where VPFK is the limiting rate, hPFK is the Hill coefficient,  and
and  is the half-activating point when no modifier is present, and
  . In addition,
  , where X0.5 is a parameter which may be interpreted as being proportional to the dissociation constant for PFK and the activator FBP, and hFBP determines the sigmoidicity of the allosteric modifier effect. We propose the following operational definition of X0.5. Provided that σ > 0, at the point where [FBP] = X0.5, and thus qπ = 1, the relation
 |
(5) |
holds, where vPFK(σ) is the limiting rate at the particular value of σ considered, obtained when π → ∞. This is easily verified; Eq. 5 is the ratio between Eq. 4 with qπ = 1 and the limit of the same equation when π → ∞. Note that Eq. 5 is completely independent of hFBP.
A potential drawback of Eq. 4 is that it does not account for the possible decrease in sigmoidicity at high FBP concentrations. This effect may be simulated by replacing hPFK with an effective value hPFK* depending on FBP:
 |
(6) |
where hact represents the Hill coefficient in the limiting case of excess FBP. The factor  implies a hyperbolic dependence on FBP, an assumption made in the absence of detailed experimental data on the dependence of hPFK* on FBP. Equation 5 assumes a slightly different form with hPFK* depending on FBP;
  is evaluated when qπ = 1, the term
  becomes
  and in the second term in the denominator, α is evaluated with qπ = 1.
The study of the kinetic properties of PFK is further complicated by the fact that the active form of PFK is a tetramer, though the enzyme is present also as a monomer, dimer, as well as octamer and/or hexadecamer (Cai et al., 1997). The tetramer is considered to be the most active oligomer (Rais et al., 2000) because of a greater affinity toward F6P, but the effects of enzyme concentration on the equilibrium between different oligomers should be considered. The physiological PFK concentration is in the order of 0.1–1 mg/ml (Trus et al., 1981; Shimizu et al., 1988). At this concentration PFK mainly exists in a rapid equilibrium between tetramer and octamer (Cai et al., 1997). A simple approximative relation between VPFK and  , discussed in detail in the appendix, is then
 |
(7) |
where KT and KO are the  values of pure tetramer and octamer, respectively, and where KPFK is the equilibrium constant of the rapid equilibrium between tetramer and octamer. The parameter kcat is a standard catalytic constant such that VPFK = kcatEPFK where EPFK is the enzyme concentration. Because of the simplifying assumption that PFK only exists in tetrameric and octameric form, Eq. 7 should be viewed as reflecting a qualitative relationship rather than an exact quantitative one. As shown in the appendix, when the tetramer concentration equals that of the octamer,
 |
(8) |
a relation useful for the estimation of kcatKPFK.
That the effective value  indeed varies with enzyme concentration has been confirmed (Bosca et al., 1985), albeit in a study where the enzyme concentration was increased from ∼1% to 100% of physiological concentration, resulting in a decrease of
  , not surprisingly since the enzyme at the lower concentration exists mainly as monomer or dimer.
FBA
The basic model is truncated after FBA, and the flux over the FBA catalyzed reaction is modeled using a Michaelis-Menten equation,
 |
(9) |
The extended model involves a reversible rate equation for FBA. This equation is based on a sequential mechanism of the FBA reaction, where G3P is released before DHAP (Horecker et al., 1972), and was derived using the methodology outlined e.g. by Hofmeyr and Cornish-Bowden (1997), where quasi-equilibrium between the different enzyme-ligand complexes is assumed. The resulting rate equation is written
 |
(10) |
where  is the equilibrium constant of the FBA reaction. Introducing
  as the half-saturating point of the backward reaction with regard to G3P and
  as the same parameter with regard to DHAP, one obtains
  and
and  ).
).
GAPD
GAPD converts G3P, NAD+ and Pi to 1,3-bisphospho-glycerate and NADH. We make the approximation of constant NAD+, NADH, and Pi concentrations, and since the extended model is truncated after the GAPD reaction, we describe the GAPD reaction with a simple irreversible Michaelis-Menten equation:
 |
(11) |
Parameter estimations
We will use a standard parameter set, presented in Table 1, as a basis for the further investigations. These values should be assumed to apply when nothing else is stated. Because of experimental uncertainties and the variable chemical milieu in the cytosol, the model is analyzed in terms of ranges of many of the parameters.
TABLE 1.
Default values for the model parameters
 |
8 mM |
|---|---|
 |
4 mM |
| X0.5 | 10 μM |
 |
5 μM |
 |
0.5 mM |
 |
0.275 mM |
 |
5 μM |
 |
0.3 |
 |
0.1 mM |
 |
1/22 |
| kcatKPFK | 233 μmol/(gdw min) |
| hGK | 1.7 |
| hPFK | 2.5 |
| hact | 1 |
| hFBP | 2.5 |
| α |  |
| VGK | 10 μmol/(gdw min) |
| VPFK | 100 μmol/(gdw min) |
| VFBA | 25 μmol/(gdw min) |
| VGAPD | 250 μmol/(gdw min) |
These values are used throughout the study if nothing else is stated. hPFK* is the effective Hill coefficient as defined by Eq. 6. Enzyme activities are given in units of μmol/(gdw min), dw standing for dry weight. This unit is used to simplify comparisons with other models and experimental data.
GK
The kinetic behavior of GK is comparably well-characterized, and we use a  value of 8 mM and a Hill coefficient of 1.7 (Gidh-Jain et al., 1993; Cárdenas, 1997; Matschinsky et al., 1998).
PFK
In addition to FBP, mammalian M-type PFK also has well-characterized activating sites for AMP, citrate and 3-P-glyceric acid, and an inhibitory site for ATP (Kemp and Foe, 1983). These effectors affect the apparent value of the parameter  , which needs to be taken into account when evaluating experimental data, since at least some amount of ATP and AMP usually is present in the experimental setting. Also, as discussed above, the apparent
  value varies with enzyme concentration (Bosca et al., 1985) and pH (Pettigrew and Frieden, 1979) and is also impossible to obtain directly, since both the substrate ATP and the product FBP are also allosteric modifiers. These difficulties lead us to treat
  as a variable, in the sense that we evaluate different scenarios using different (fixed or varying with VPFK) values of
  . Nevertheless, we have to confine the values used to a range matching experimentally observed data.
Various experiments (Bosca et al., 1985; Foe and Kemp, 1985; Otto et al., 1977; Tornheim and Lowenstein, 1976; Meienhofer et al., 1980) lead us to estimate a range of 1–8 mM for  . In the simulations where Eq. 7 is applied, we use a value of 2 mM for KT and we make the arbitrary assumption that KO = 15KT, which leads to effective
  values of ∼3–7 mM in the ranges of VPFK investigated, in rough agreement with data obtained from in vitro experiments on PFK at physiological concentration of the enzyme (Bosca et al., 1985). We point out that the arbitrary choice for KO does not influence the model very much, in contrast to the parameter KT. The parameter product kcatKPFK is estimated from the experiments of Cai et al. (1997). In that study, the concentrations of tetramer equaled that of octamer at a PFK concentration of ∼1.5 mg/ml. With a specific activity of PFK of ∼200 μmol/(mg min) (Uyeda, 1979), VPFK = 100 μmol/(gdw·min) corresponds to a PFK concentration of ∼0.2 mg/ml. This leads us to assume in our model that the tetramer and octamer concentrations are equal when VPFK = 700 μmol/(gdw min), and we thus obtain kcatKPFK = 233 μmol/(gdw min) using Eq. 8.
We estimate hPFK to be 2.5 (Tornheim and Lowenstein, 1976; Bosca et al., 1985; Meienhofer et al., 1980). The Hill coefficient hPFK is assumed to vary with FBP concentration unless otherwise stated, and we set hact to 1. The value of β appears to be ∼0.2 (Tornheim and Lowenstein, 1976), so that  . The parameters X0.5 and hFBP may be estimated from the experiments in which the activation of β-cell PFK by FBP has been demonstrated (Yaney et al., 1995). We estimate X0.5 from a plot of vPFK versus [FBP] in that study by use of Eq. 5. In this way, we obtain a value of ∼20 μM for X0.5 for both constant and variable hPFK. A drawback with this data is that its resolution is rather low, which is why we will also consider other experimental data on M-type PFK. Using the same method, we obtain a value of ∼10 μM from the studies of Foe et al. (1983) and Tornheim (1985). Note that the available experimental data only allow a crude estimation of the parameter. We will unless otherwise indicated use the lower value, but certainly investigate the effects of the higher value. The FBP-vPFK curve appears hyperbolic in the experiments on β-cell PFK (Yaney et al., 1995), which would suggest a value near 1 for hFBP. On the other hand, again the other experimental studies on M-type PFK (Foe et al., 1983; Tornheim, 1985) suggest otherwise, implying a sigmoid shaped relationship. We will unless otherwise stated set hFBP to 2.5, but also study the model behavior when hFBP = 1. Fig. 2 a shows a plot of normalized PFK activity versus F6P concentration using our PFK rate equation with varying hPFK at three different FBP concentrations. This plot represents experimental results of Tornheim and Lowenstein (1976) and Bosca et al. (1985); it assumes an effective
  value of 4 mM approaching 0.8 mM upon addition of the activator FBP. Fig. 2 b shows a plot of normalized PFK activity versus FBP concentration at the two different X0.5 values 10 μM and 20 μM (with σ = 0.25 and hFBP = 2.5). This plot represents experimental results of Foe et al. (1983); Tornheim (1985) and of Yaney et al. (1995), respectively.
FBA
FBA exists in man in three isozyme forms; A (muscle), B (liver), and C (brain), of which at least type B and C (the latter which has a larger  value) are present in β-cells (Inagaki et al., 1988; Wang et al., 2000). The effective value of
  in β-cells is therefore estimated to be in the range of 5–15 μM based on experimental measurements (Horecker et al., 1972; Kusakabe et al., 1994). For the reversible rate equation, we used parameter values as follows:
  (Veech et al., 1969),
  , and
, and  (Horecker et al., 1972), so that p = 0.01 and r = 0.4 (obtained with the value of
  estimated below).
GAPD
We considered the value of the parameter  to lie between 2.5 μM (Velick and Furfine, 1963) and 9 μM (MacDonald, 1989). We use the value
  in the extended model.
Other parameters
The equilibrium constant  of the GPI catalyzed reaction is 0.3 (Alberty, 2000), and the equilibrium constant of the TPI catalyzed reaction in the backward direction (G3P converted to DHAP) is 22 (Veech et al., 1969), so that
  . Measurements of the three limiting rates V of our model, which are proportional to the enzyme concentrations and thus exhibit large natural variations, are subject to considerable experimental uncertainties (Albe et al., 1990). The limiting rates are therefore allowed to vary over large ranges guided by experimental data (Trus et al., 1981; Shimizu et al., 1988). The default values are listed in Table 1. Throughout this work, the unit for the limiting rates is μmol/(gdw min), (dw standing for weight of dry tissue) which was used to simplify comparisons with experimental data. When converting this unit to M/s for the numerical calculations, an assumption of a dry weight:wet weight ratio of 1:4 was made based on experimental data (Erecinska et al., 1992).
Phase plane analysis
Additional insights may be gained by means of a phase plane analysis of the basic model. A similar analysis of the PFK reaction in yeast has been made previously (Venieratos and Goldbeter, 1979). The dynamical system is characterized by the fixpoint at which the derivatives in Eq. 1 are both zero. If all eigenvalues of the Jacobian of Eq. 1 have negative real part, the fixpoint is stable, and the system evolves toward this steady state over time. If the Jacobian has eigenvalues with positive real part, the fixpoint is unstable, and the system may enter a limit cycle, an oscillatory stationary mode. As was pointed out earlier (Venieratos and Goldbeter, 1979) and as shown in the appendix, the fixpoint is unstable if the condition
 |
(12) |
is fulfilled at the fixpoint for the curve in the phase plane where  , hereafter referred to as the π nullcline (the σ nullcline is defined in the same way).
RESULTS
Numerical integration
Numerical integration of the basic model (Eq. 1) shows that the variables of the system may exhibit continuous oscillations. We start with the standard parameter set (with a stimulatory glucose concentration of 10 mM) and the results are shown in Fig. 3 a, where the time course of the concentrations of F6P and FBP is shown. The time scale of the oscillations roughly fits what is known experimentally from pancreatic β-cells of slow oscillations thought to have metabolic origin (Hellman et al., 1994; Tornheim, 1997). Further, the shapes of the curves fit with data obtained from muscle cell extracts, with regard to the sawtooth shape of the F6P curve and the pulsatile FBP curve (Tornheim, 1988). The average F6P concentration is in the order of 10 times higher than available data on β-cells (Trus et al., 1980). A more detailed model, including adenine nucleotide modulation of PFK, might give results more closely resembling these experimental data, for example by reducing the effective value of  . The FBP concentration immediately after the pulse is very low, as shown in Fig. 3 b, which is a magnification of a part of the simulation. Decreasing
  to 2 mM markedly decreases the oscillation period (Fig. 3 c), and the amplitudes of both the F6P and FBP oscillations are seen to be halved. We conclude that
  has a crucial influence on the oscillatory behavior.
FIGURE 3.

(a) Oscillations in the glycolysis as modeled by Eq. 1, obtained by numerical integration. The dotted line represents F6P, while the solid line represents FBP. The curve shapes and oscillation period resembles experimental data obtained from muscle extracts. Parameter values are listed in Table 1, glucose concentration was set to the stimulatory level 10 mM. (b) Magnification of a part of panel a. The F6P concentration decreases to a very low level during a brief part of the oscillation period. Available experimental data are of too low resolution to allow comparison to this result. (c) Decreasing  to 2 mM halves the oscillation period, as well as the amplitudes of the oscillations.
Phase plane analysis
One way to illustrate these events is to employ phase plane analysis. As stated in Eq. 12, the π nullcline has to have sufficiently negative slope in the (π, σ) plane in order for the steady state to become unstable. We have plotted the nullclines in the (π, σ) plane in Fig. 4 a for a nonstimulatory and a stimulatory glucose concentration. The stable limit cycle in the figure emerges when the glucose concentration is raised to a stimulatory concentration, where we can see that the π nullcline has a negative slope at the steady state. The negative slope of the π nullcline is caused by the autocatalysis of PFK. We remark here that the nullclines are completely independent of  , meaning that this parameter will not have any influence on the location of the threshold of oscillations in the (π, σ) plane. Fig. 4 a was produced using a variable Hill coefficient hPFK* (cf. Eq. 6). Instead using a fixed value of 2.5 produced small changes in the nullclines and the limit cycle. However, when using both a fixed hPFK and a low Hill coefficient hFBP of the allosteric activation by FBP (hFBP = 1) as suggested by experiments on β-cell PFK, the amplitude of oscillation is severely diminished, which can be seen in Fig. 4 b. Keeping this low hFBP value but reinstating the variable hPFK* counteracts this modulation of the oscillations (Fig. 4 b, dotted line). Thus, with a variable hPFK*, the system is more robust to changes in hFBP, with oscillations of significant amplitude occurring also with a hFBP value of 1.
FIGURE 4.

(a) Phase plane analysis of the model. The solid line with filled circles is the π nullcline. The dotted line is the σ nullcline at a subthreshold glucose concentration of 5 mM. This nullcline intersects the π nullcline at a point where the slope of the latter is positive and this point is thus a stable steady state. The dashed line is the σ nullcline at a superthreshold glucose concentration of 15 mM and this nullcline intersects the π nullcline at a point where the slope of the latter is sufficiently negative for the inequality (12) to hold, making the steady state unstable. A stable limit cycle then exists, in the diagram depicted as the closed thicker solid line. The arrow indicates the direction by which the limit cycle is transversed over time. Parameter values are listed in Table 1. (b) The Hill coefficient of the allosteric activation of PFK by FBP is in this diagram set to 1, parameters are otherwise the same as in panel (a). The dashed line is the π nullcline and the solid line is the corresponding limit cycle appearing at a superthreshold glucose concentration of 15 mM (for clarity, the σ nullclines are not included in this diagram). When, in addition, the Hill coefficient of the substrate F6P is fixed (i.e., hact = 2.5), the amplitude of oscillations is significantly lowered. This is evident from the dotted limit cycle and corresponding π nullcline drawn as a solid line with filled circles.
Bifurcation analysis
More generally, one may investigate the model for a range of glucose concentrations while keeping the rest of the model parameters constant. This has been done by means of bifurcation analysis (Fig. 5 a). At subthreshold (0–9.7 mM) glucose concentrations, the system enters a steady state, which at the threshold becomes unstable through a supercritical Hopf bifurcation, where a stable limit cycle emerges. Because of glucose saturation, a more complete picture is obtained if instead varying VGK, keeping [Glc] fixed at 10 mM (Fig. 5 b). This analysis reveals a second (subcritical) Hopf bifurcation at VGK ≈ 38 μmol/(gdw min), and the steady state again becomes stable at higher values of vGK. Because of the subcriticality, there is an interval in which the stable steady state coexists with the stable limit cycle, a result which also was reported in an earlier study of PFK dynamics (Venieratos and Goldbeter, 1979). The period of oscillation is shown in Fig. 5 c and is, when increasing VGK, seen to initially decrease after the supercritical Hopf bifurcation is passed. At higher values of VGK the period instead increases until the subcritical Hopf bifurcation is reached. Indeed, Lenzen et al. (2000) observed a significantly increased oscillation period of slow calcium oscillations as [Glc] was increased from 10 mM to 20 mM, providing indirect support for this result, since vGK is an increasing function of both VGK and [Glc], directly proportional in the former case and slightly sigmoidal with VGK as the upper limit in the latter case. However, Bergsten and Hellman (1993) and Cunningham et al. (1996) observed no such period increase when increasing [Glc]. This is not necessarily contradicting our results, since 5 c exhibits a plateau where the oscillation period is relatively insensitive to VGK. If VGK lies at this plateau, the oscillation period may appear independent of [Glc].
FIGURE 5.

In all panels, unless stated otherwise, parameters are as listed in table 1. (a) Bifurcation diagram of the system which shows the general model behavior over glucose concentrations in the range 1–30 mM. The solid thick line represents a steady stable state, the dotted line represents an unstable steady state. The thinner solid lines represent the upper and lower extreme values of σ of the limit cycle, emerging from the Hopf bifurcation marked with a square. The inset shows a magnification around the Hopf bifurcation. (b) A more complete diagram is obtained when letting VGK vary over the range 1–40 μmol/(gdw min), keeping [Glc] fixed at 10 mM. A second Hopf bifurcation is revealed. The thin dotted lines represent an unstable limit cycle. (c) The oscillation period varies with VGK. The solid line was obtained with all parameters except VGK as in Table 1; the dashed line was obtained with X0.5 = 20 μM. [Glc] was set to the stimulatory level 10 mM. (d) Bifurcation diagram relating the two Hopf bifurcations to the glucose concentration and VGK. The bifurcations are represented by the solid lines. Stable oscillations occur when the two bifurcation parameters lie within the shaded area. Note how the oscillatory glucose region changes less with VGK for higher values of this parameter.
The relation between VGK, [Glc], and the bifurcations was also investigated, and the results are shown in Fig. 5 d. Noteworthy is that the glucose concentration threshold for oscillations (the supercritical Hopf bifurcation) does not change much with VGK in the higher region of VGK values. On the other hand, the opposite is true at lower VGK values, where the threshold strongly varies with the parameter. This may provide one explanation for the experimentally observed phenomenon that moderate overexpression of GK potentiates insulin secretion and lowers the glucose threshold, whereas excessive overexpression does not make any further difference (Wang and Iynedjian, 1997).
In the same manner, we have analyzed the model in terms of parameters related to PFK. In the following, we will relate the different parameters analyzed to VGK, which is directly proportional to vGK, while holding [Glc] fixed at 10 mM. The reason for this is of course that vGK is readily controlled experimentally by varying the glucose concentration. A bifurcation diagram relating VPFK, VGK and the bifurcations is shown in Fig. 6 a. The lesson to be learned here is basically that the bifurcation points do not vary with VPFK, except for very low values of the parameter. Variation of VPFK does however change the period of oscillations, which decreases with increasing values of the parameter as can be seen in Fig. 6 c. Here,  was set to the intermediate value of 3 mM, to facilitate comparison with the curved obtained when applying Eq. 7 as described below. Variation of
  produces the opposite result: the oscillation period increases with increasing parameter values (Fig. 6 b). Noteworthy is that the relation appears perfectly linear, and again we consider Fig. 4 a and the limit cycle in the phase plane (π, σ). The location of the nullclines in phase plane is completely independent of
  . During the phase where π is low,
  . The limit cycle closely follows the π nullcline. The time course of the system is here one-dimensional in the sense that almost only
  determines how quickly the limit cycle is followed, and
  is exactly inversely proportional to
  , cf. Eq. 1. The greatest part of one oscillation period is spent in this phase. Also in the phase when π is high,
  is almost independent of π because the allosteric modifier effect exhibits saturation. Thus here too, the value of
  is dominant in determining the speed by which the limit cycle is followed in the downwards σ direction. The horizontal phases of the limit cycle in Fig. 4 a are followed very fast. Thus, oscillation period is almost linearly proportional to
  .
.
FIGURE 6.

In all panels, unless stated otherwise, parameters are as listed in Table 1 and [Glc] is set to the stimulatory level 10 mM. (a) Bifurcation diagram relating the limiting rates of GK and PFK to the Hopf bifurcations. Note that the bifurcation points are almost independent of VPFK except for low values of the parameter. (b) The oscillation period varies linearly with  . (c) The oscillation period varies with VPFK. The solid line was obtained using a fixed value of 3 mM for
  . The dashed line was obtained when applying Eq. (7), with KT = 2 mM and KO = 30 mM. This shows that the equilibrium between PFK tetramer and octamer exerts a stabilizing effect on the oscillation period with respect to variations in VPFK. (d) Bifurcation diagram relating the limiting rate of GK to X0.5. There is no dramatic effect on the bifurcation points as X0.5 is varied along its estimated range.
When applying the relation given by Eq. 7 between VPFK and  , it becomes clear that an increase in
  mediated by an increase in VPFK stabilizes the system with regard to variations in PFK concentration; the variation in oscillation period with VPFK is less marked (Fig. 6 c). Finally, we consider the parameter X0.5. The bifurcation diagram of Fig. 6 d reveals only a slight shift toward higher VGK values for the oscillatory region as X0.5 increases from 10 to 20 μM. Moreover, the doubling of this parameter does not produce any marked change in oscillation period as is evident from Fig. 5 c.
The two parameters related to FBA both exhibit a significant influence on the basic model. The bifurcation diagram of Fig. 7 a shows that the bifurcation points are shifted toward higher values of VGK as VFBA increases, almost linearly. This leads us to propose that, when VGAPD ≫ VFBA, the system with regard to the thresholds conveniently would be characterized by the VGK/VFBA ratio. One should note that FBA activity was experimentally found to be higher than GK activity (Trus et al., 1981; Shimizu et al., 1988) and that the regions of the diagram with higher values of VFBA hence are more plausible. The oscillation period drops dramatically as VFBA is increased near the first bifurcation point, but otherwise remains stable as the parameter varies (not shown). On the other hand, the oscillatory region is shifted toward lower values of VGK as  increases (Fig. 7 b), while the oscillation period decreases (not shown). Thus, the basic model predicts that FBA concentration, as well as that of GK and PFK, may play an important role in determining the dynamics of the glycolysis. This means that accurate measurements of the parameter S0.5FBA are necessary to gain a full characterization of the oscillatory system.
FIGURE 7.

In both panels, unless stated otherwise, parameters are as listed in Table 1 and [Glc] is set to the stimulatory level 10 mM. (a) Bifurcation diagram relating VFBA, VGK, and the bifurcation points, showing an almost linear relationship. (b) Bifurcation diagram showing the location of the bifurcation points with respect to VGK and  . The latter parameter is estimated to lie in the range 5–15 μM. The bifurcation points are displaced toward lower VGK values as
  increases.
Extended model
To obtain more general results to account for the possible situation where VFBA and VGAPD are of similar magnitudes, bifurcation analyses of the extended model involving VGK, VFBA, and VGAPD were made. With VGAPD = 250 μmol/(gdw min), which is in the order of what Trus et al. (1981) reported, the bifurcation diagram shown in Fig. 8 a with VGK and VFBA as bifurcation parameters is obtained. Evidently, VFBA has significant control over the oscillatory region at lower values of the parameter, which is successively lost as the parameter increases. Not surprisingly, VFBA and VGAPD share control when their values are similar. A bifurcation analysis with VGAPD as bifurcation parameter (Fig. 8 b) reveals that VGAPD has moderate control over the oscillatory region when VGAPD = 10VFBA. As VGAPD is lowered, its control increases. Thus, if the experimental values of Shimizu et al. (1988) reflect reality, VGAPD does have significant control over the system. What about VFBA in this case? Fig. 8 c shows a bifurcation diagram obtained with VGAPD = 35 μmol/(gdw min). One notices that VFBA has almost no control at the operating point VFBA = 25 μmol/(gdw min). VFBA has to be significantly lower than VGAPD in order to gain control. On the other hand, with a fourfold higher FBA activity VFBA = 100 μmol/(gdw min), VGAPD is in Fig. 8 d seen to have more control over the oscillatory region (almost linear borders) than was the case with the lower FBA activity.
FIGURE 8.

In all panels, unless stated otherwise, parameters are as listed in Table 1 and [Glc] is set to the stimulatory level 10 mM. (a) Bifurcation diagram showing the dependence of the oscillatory region on VFBA for the extended model. FBA exerts significant control at lower values of VFBA, but loses control as this parameter increases. (b) This diagram shows the dependence of the oscillatory region on VGAPD, which at higher values (an order of magnitude greater than VFBA) has little control over the oscillatory region. (c) This diagram is the same as (a), except with VGAPD = 35 μmol/(gdw min). FBA is seen to have no significant control over the oscillatory region except at very low values of the parameter. (d) This diagram is the same as b, except with VFBA = 100 μmol/(gdw min). GAPD is seen to have significant control over the oscillatory region throughout the region of VGAPD examined. We may draw the conclusion that GAPD has most of the control when VFBA ≈ VGAPD, but loses this control in favor of FBA if VFBA is decreased to a level an order of magnitude lower than VGAPD.
DISCUSSION
Our model, based on kinetic data on the enzymes in the upper part of the glycolysis in the pancreatic β-cell, predicts an oscillatory behavior of β-cell glycolysis in a significant region of parameter space. The threshold glucose concentration is in general found at 5–10 mM (Fig. 5 d), which is the same range as the threshold glucose concentration experimentally seen to induce slow calcium oscillations (Liu et al., 1996). However, the threshold depends on model parameters, most notably the limiting rates V of the different reactions, which are directly proportional to enzyme concentrations. Here one should note that our model suggests that control over different aspects of the behavior of the initial steps in glycolysis is exerted by different enzymes. The GK and FBA and/or GAPD concentrations have a large influence on at which glucose concentrations glycolytic oscillations occur. PFK concentration has little control over this, but instead influences the frequency of oscillations as seen in Fig. 6 c. These results point toward the need for accurate quantitative data regarding these enzyme concentrations to characterize the dynamics of glycolysis in the pancreatic β-cell. The parameter  has a well-defined control over oscillation period, the relationship being essentially linear. This should be possible to test experimentally, since the effective value
  may be altered by several chemical agents.
Robustness of the model
Robustness is a feature of general importance for biological systems. Thus, noting that the oscillation period of our glycolytic oscillator is quite sensitive to PFK concentration (Fig. 6 c, solid line), the question if there exists any mechanism which counteracts this sensitivity is justifiable. From this starting point, we observe that the sensitivity of the oscillation period to PFK concentration is reduced if the relation of Eq. 7 is applied, since the parameters VPFK and  have opposite effects on the oscillation period, as shown by our computations (Fig. 6 c, dashed line). The glycolytic oscillation period is therefore stabilized through the equilibrium between the tetramer and octamer forms of PFK.
The PFK activation by FBP appears hyperbolic in some experiments (Yaney et al., 1995) and sigmoidal in others (Foe et al., 1983; Tornheim, 1985). We found that the model is robust in terms of the sensitivity to variation in this sigmoidicity if the sigmoidicity of the flux-concentration relationship between F6P and vPFK decreases as FBP concentration increases, as some experiments suggest (Bloxham and Lardy, 1973; Uyeda, 1979; Otto et al., 1977). This decrease in hPFK would therefore stabilize oscillations if the sigmoidicity of the PFK activation by FBP varies for instance due to variations in the chemical environment.
GK as glucose sensor
GK has, through experiments and by virtue of methods from metabolic control theory (MCT) been proposed to be the primary control point of the glycolysis (Sweet and Matschinsky, 1995; Matschinsky et al., 1998; Wang and Iynedjian, 1997), the notion of control here being the relative steady state glycolytic flux change per relative enzyme concentration change. In the experiments of Shimizu et al. (1988), the flux-concentration curve between glycolytic flux and glucose matches the flux-concentration curve of GK closely. This also applies to the present model. Since we have approximated the GK reaction as being fully irreversible, GK alone determines the flux through glycolysis at steady state, or the average flux over an oscillation period if oscillations are present.
However, two control properties which standard MCT is not applicable to in a straightforward manner, but which still are of great importance for the insulin secretion system, are, first, the control over oscillation period and, second, the control of the boundary of the onset of the Hopf bifurcation at which a stable fixpoint is replaced by an attractive limit cycle as [Glc] is increased. In the situation where VGAPD ≫ VFBA, judging from the bifurcation diagram of Fig. 7 a, FBA as well is seen to exert this type of control. Because of the almost linear relations apparent from Fig. 7 a, we propose that a sound characteristic of the glucose sensing system in this case would be the ratio VGK/VFBA. The analysis of the extended model shows that as VGAPD approaches VFBA, GAPD gradually overtakes control from FBA. In the case when VFBA ≈ VGAPD, the ratio VGK/VGAPD would be a good characteristic (Fig. 8), although the influence of product inhibition on GAPD should be subject to further investigation since it to some degree affects the control exerted by the enzyme.
It should be possible to investigate experimentally the validity of the results of Fig. 7 a and Fig. 8. Specifically, it would be desirable to obtain a better estimate of the operating point of β-cells with regard to the parameters VGK, VFBA, and VGAPD.
It is evident from Fig. 5 d that at higher values of VGK, the effects of variations in this parameter become less important both regarding oscillation period and the boundary of the onset of oscillations. We may here speak of GK losing its control strength at higher concentrations. Experimental data which relate overexpression of β-cell GK to stimulus-secretion coupling (Wang and Iynedjian, 1997) indirectly support this result. The authors found that moderate overexpression lowered the [Glc] level needed to reach maximum insulin secretion, but that a further increased overexpression failed to exert any additional effect.
In conclusion, this study shows that oscillations in the glycolysis of pancreatic β-cell are plausible from a theoretical perspective, given the current knowledge of β-cell biochemistry.
We argue that equations with operationally well-defined parameters, such as those used in this study, are particularly useful when performing systems level investigations. Here, this is exemplified by the straightforward incorporation of biochemical reasoning about experimental uncertainties into the model. Also, operationally well-defined parameters make it possible to directly connect biochemical observations to emerging properties at the systems level. This is exemplified by the analyses in this work, where we were able to pinpoint mechanisms involved in stabilizing the glycolytic oscillation period.
There is a large step from the single PFK catalyzed reaction to the entire glycolysis and the whole β-cell biochemistry and furthermore to whole islet behavior. In particular, the coupling of glycolytic oscillations to whole-cell [ATP]/[ADP] ratio oscillations needs to be thoroughly investigated. Adenine nucleotides are allosteric effectors of PFK, and oscillations in their concentrations may modulate the oscillatory behavior, even though they are not the primary generators of oscillations. Nevertheless, experiments have indicated a substantial contribution of PFK on β-cell secretory function (Tornheim, 1997; Ristow et al., 1999) and it is our belief that the understanding and stepwise integration of smaller biochemical subsystems into larger models can provide important insights into the global behavior and dynamics in which these smaller, more local subsystems may retain some of their qualitative behavior. This means that this minimal model may provide important initial insights into the stimulus-secretion machinery.
Acknowledgments
We thank Jeanette Hellgren-Kotaleski (NADA, KTH), P-O Berggren, Martin Köhler and Anneli Björklund (Dept. of Molecular Medicine, KI), and Valdemar Grill (NTNU, Norway) for interesting discussions and helpful suggestions on the manuscript.
This work was supported by the Parallel Scientific Computing Institute (PSCI) at the Department of Numerical Analysis and Computer Science (NADA), at the Royal Institute of Technology (KTH).
APPENDIX
Stability analysis of the PFK reaction
The basic model, as represented by Eq. 1, is reformulated as
 |
(A1) |
where
 |
and
 |
Here we have set  ,
, . Differentiation of the system (Eq. A1) results in the Jacobian J:
 |
where  and so forth. According to the principle of linearized stability, a fixpoint of the system (Eq. A1) is unstable when at least one eigenvalue of J has a positive real part at the fixpoint. The eigenvalues λ of J are the solutions to the characteristic equation
 |
(A2) |
Thus, a condition for a fixpoint in order for it to be unstable is
 |
(A3) |
To reformulate this condition in terms of the FBP nullcline in the phase plane, we consider the differential of  :
:
 |
On the FBP nullcline (and on any contour on which  is constant),
  , and thus
 |
(A4) |
Equations. A3 and A4 together give the condition
 |
(A-5) |
for the FBP nullcline on the fixpoint in order for the latter to be unstable, which is the same condition as Eq. 12. Since the third term on the left side of Eq. A2 always is positive (both A and B will always increase with respective increase in σ and π), the eigenvalues will, at the verge of instability where the left side of Eq. A3 vanishes, be purely imaginary, which means that the system here undergoes a Hopf bifurcation.
Apparent substrate dissociation constant of PFK
According to the derivation of the different types of Hill equations made by Hofmeyr and Cornish-Bowden (1997),  may be interpreted as being proportional to a dissociation constant between F6P and PFK. Viewing PFK as mainly existing as tetramer and octamer, we consider
  to effectively behave as an apparent dissociation constant (which may only be approximately true) and write
 |
(A6) |
where T and O indicate the concentration of free enzyme in tetramer and octamer conformation respectively, and where F6PT and F6PO denote the concentrations of the two different substrate-enzyme complexes. F6P has a dissociation constant with respect to each of the two oligomers. Denoting these two constants as KT and KO, we have
 |
(A7) |
Equations A6 and A7 give the relation
 |
We make the assumption that the tetramer and octamer exist in an equilibrium independent of substrate binding and thus consider the total concentrations of tetramer and octamer and the corresponding apparent equilibrium constant KPFK:
 |
Denoting the total enzyme concentration Etot, so that  , we obtain
 |
(A8) |
When making the approximation  , we obtain
 |
(A9) |
where we have used the standard definition VPFK = kcatEtot. Assuming that F6P has greater affinity to the tetramer than to the octamer, i.e. KT < KO, Eq. A9 tells us how the value of the apparent substrate-enzyme dissociation constant  would increase when the PFK concentration is raised. However, we stress that Eq. A9 is of an approximative nature and should only be viewed as reflecting a qualitative relationship, not to be quantitatively exact. Finally, from Eq. A8 it is apparent that when Otot = Ttot,
 |
(A10) |
Abbreviations used: (Metabolite abbreviations) Glc, intracellular glucose; G6P, glucose-6-phosphate; F6P, fructose-6-phosphate; FBP, fructose-1,6-bisphosphate; DHAP, Dihydroxyacetone-phosphate; G3P, Glyceraldehyde-3-phosphate. (Enzyme abbreviations) GK, glucokinase (E.C. 2.7.1.1); GPI, glucose-6-phosphate isomerase (E.C. 5.3.1.9); PFK, phosphofructokinase (E.C. 2.7.1.11); FBA, fructose-bisphosphate aldolase (E.C. 4.1.2.13); TPI, triose-phosphate dehydrogenase (E.C. 5.3.1.1); GAPD, glyceraldehyde-3-phosphate dehydrogenase (E.C. 1.2.1.12).
References
- Achs, M. J., L. Garfinkel, and D. Garfinkel. 1991. A computer model of pancreatic islet glycolysis. J. Theor. Biol. 150:109–135. [DOI] [PubMed] [Google Scholar]
- Albe, K. R., M. H. Butler, and B. E. Wright. 1990. Cellular concentrations of enzymes and their substrates. J. Theor. Biol. 143:163–195. [DOI] [PubMed] [Google Scholar]
- Alberty, R. A. 2000. Calculating apparent equilibrium constants of catalyzed reactions at pH 7. Biochem. Educ. 28:12–17. [PubMed] [Google Scholar]
- Bergsten, P., and B. Hellman. 1993. Glucose-induced amplitude regulation of pulsatile insulin secretion from individual pancreatic islets. Diabetes. 42:670–674. [DOI] [PubMed] [Google Scholar]
- Blangy, D., H. Buc, and J. Monod. 1968. Kinetics of the allosteric interactions of phosphofructokinase from Escherichia coli. J. Mol. Biol. 31:13–35. [DOI] [PubMed] [Google Scholar]
- Bloxham, D., and H. Lardy. 1973. Phosphofructokinase. In The Enzymes, 3rd ed, Vol. VIII. P. Boyer, editor. Academic Press, New York. 239–278.
- Bosca, L., J. J. Aragon, and A. Sols. 1985. Modulation of muscle phosphofructokinase at physiological concentrations of enzyme. J. Biol. Chem. 260:2100–2107. [PubMed] [Google Scholar]
- Cai, G.-Z., T. P. Callaci, M. A. Luther, and J. C. Lee. 1997. Regulation of rabbit muscle phosphofructokinase by phosphorylation. Biophys. Chem. 64:199–209. [DOI] [PubMed] [Google Scholar]
- Cárdenas, M. L. 1997. Kinetic behaviour of vertebrate hexokinases with emphasis on hexokinase D (IV). Biochem. Soc. Trans. 25:131–135. [DOI] [PubMed] [Google Scholar]
- Chay, T. R. 1997. Effects of extracellular calcium on electrical bursting and intracellular and luminal calcium oscillations in insulin secreting pancreatic β-cells. Biophys. J. 73:1673–1688. [DOI] [PMC free article] [PubMed] [Google Scholar]
- Corkey, B. E., K. Tornheim, J. T. Deeney, M. C. Glennon, J. C. Parker, F. M. Matschinsky, N. B. Ruderman, and M. Prentki. 1988. Linked oscillations of free Ca2+ and the ATP/ADP ratio in permeabilized RINm5F insulinoma cells supplemented with a glycolyzing cell-free muscle extract. J. Biol. Chem. 263:4254–4258. [PubMed] [Google Scholar]
- Cunningham, B. A., J. T. Deeney, C. R. Bliss, B. E. Corkey, and K. Tornheim. 1996. Glucose-induced oscillatory insulin secretion in perifused rat pancreatic islets and clonal beta-cells (HIT). Am. J. Physiol. 271:E702–E710. [DOI] [PubMed] [Google Scholar]
- Deeney, J. T., M. Köhler, K. Kubik, G. Brown, V. Schultz, K. Tornheim, B. E. Corkey, and P. O. Berggren. 2001. Glucose-induced metabolic oscillations parallel those of Ca(2+) and insulin release in clonal insulin-secreting cells. A multiwell approach to oscillatory cell behavior. J. Biol. Chem. 276:36946–36950. [DOI] [PubMed] [Google Scholar]
- Dryselius, S., E. Grapengiesser, B. Hellman, and E. Gylfe. 1999. Voltage-dependent entry and generation of slow Ca2+ oscillations in glucose-stimulated pancreatic β-cells. Am. J. Physiol. 276:E512–E518. [DOI] [PubMed] [Google Scholar]
- Erecinska, M., J. Bryla, M. Michalik, M. D. Meglasson, and D. Nelson. 1992. Energy metabolism in islets of Langerhans. Biochim. Biophys. Acta. 1101:273–295. [DOI] [PubMed] [Google Scholar]
- Foe, L. G., and R. G. Kemp. 1985. Isolation and characterization of phosphofructokinase C from rabbit brain. J. Biol. Chem. 260:726–730. [PubMed] [Google Scholar]
- Foe, L. G., S. P. Latshaw, and R. G. Kemp. 1983. Binding of hexose bisphosphates to muscle phosphofructokinase. Biochemistry. 22:4601–4606. [DOI] [PubMed] [Google Scholar]
- Gidh-Jain, M., J. Takeda, L. Z. Xu, A. J. Lange, N. Vionnet, M. Stoffel, P. Froguel, G. Velho, F. Sun, D. Cohen, P. Patel, Y. D. Lo, A. T. Hattersley, H. Luthman, A. Wedell, R. S. Charles, R. W. Harrison, I. T. Weber, G. I. Bell, and S. J. Pilkis. 1993. Glucokinase mutations associated with non-insulin-dependent (type2) diabetes mellitus have decreased enzymatic activity:implications for structure/function relationships. Proc. Natl. Acad. Sci. USA. 90:1932–1936. [DOI] [PMC free article] [PubMed] [Google Scholar]
- Goldbeter, A. 1976. Kinetic cooperativity in the concerted model for allosteric enzymes. Biophys. Chem. 4:159–169. [DOI] [PubMed] [Google Scholar]
- Goldbeter, A., and S. R. Caplan. 1976. Oscillatory enzymes. Annu. Rev. Biophys. Bioeng. 5:449–476. [DOI] [PubMed] [Google Scholar]
- Goldbeter, A., and R. Lefever. 1972. Dissipative structures for an allosteric model. Biophys. J. 12:1302–1315. [DOI] [PMC free article] [PubMed] [Google Scholar]
- Hellman, B., E. Gylfe, P. Bergsten, E. Grapengiesser, P. E. Lund, A. Berts, A. Tengholm, D. G. Pipeleers, and Z. Ling. 1994. Glucose induces oscillatory Ca2+ signalling and insulin release in human pancreatic beta cells. Diabetologia. 37:S11–S20. [DOI] [PubMed] [Google Scholar]
- Hess, B. 1997. Periodic patterns in biochemical reactions. Q. Rev. Biophys. 30:121–176. [DOI] [PubMed] [Google Scholar]
- Higgins, J. 1964. A chemical mechanism for oscillation of glycolytic intermediates in yeast cells. Proc. Natl. Acad. Sci. USA. 51:989–994. [DOI] [PMC free article] [PubMed] [Google Scholar]
- Hofmeyr, J.-H., and A. Cornish-Bowden. 1997. The reversible Hill equation:how to incorporate cooperative enzymes into metabolic models. Comput. Appl. Biosci. 13:377–385. [DOI] [PubMed] [Google Scholar]
- Horecker, B. L., O. Tsolas, and C. Y. Lai. 1972. Aldolases. In The Enzymes, 3rd ed, Vol. VII. P. Boyer, editor. Academic Press, New York. 213–258.
- Inagaki, H., H. Haimoto, S. Hosoda, and K. Kato. 1988. Aldolase C is localized in neuroendocrine cells. Experientia. 44:749–751. [DOI] [PubMed] [Google Scholar]
- Jonas, J.-C., P. Gilon, and J.-C. Henquin. 1998. Temporal and quantitative correlations between insulin secretion and stably elevated or oscillatory cytoplasmic Ca2+ in mouse pancreatic β-cells. Diabetes. 47:1266–1273. [DOI] [PubMed] [Google Scholar]
- Kemp, R. G., and L. G. Foe. 1983. Allosteric regulatory properties of muscle phosphofructokinase. Mol. Cell. Biochem. 57:147–154. [DOI] [PubMed] [Google Scholar]
- Kusakabe, T., K. Motoki, and K. Hori. 1994. Human aldolase C:characterization of the recombinant enzyme expressed in Escherichia coli. J. Biochem. (Tokyo). 115:1172–1177. [DOI] [PubMed] [Google Scholar]
- Lang, D. A., D. R. Matthews, J. Peto, and R. C. Turner. 1979. Cyclic oscillations of basal plasma glucose and insulin concentrations in human beings. N. Engl. J. Med. 301:1023–1027. [DOI] [PubMed] [Google Scholar]
- Lenzen, S., M. Lerch, T. Peckmann, and M. Tiedge. 2000. Differential regulation of [Ca2+]i oscillations in mouse pancreatic islets by glucose, α-ketoisocaproic acid, glyceraldehyde and glycolytic intermediates. Biochim. Biophys. Acta. 1523:65–72. [DOI] [PubMed] [Google Scholar]
- Liu, Y. J., E. Grapengiesser, E. Gylfe, and B. Hellman. 1996. Crosstalk between the cAMP and inositol trisphosphate-signalling pathways in pancreatic β-cells. Arch. Biochem. Biophys. 334:295–302. [DOI] [PubMed] [Google Scholar]
- Liu, Y. J., A. Tengholm, E. Grapengiesser, B. Hellman, and E. Gylfe. 1998. Origin of slow and fast oscillations of Ca2+ in mouse pancreatic islets. J. Physiol. 508:471–481. [DOI] [PMC free article] [PubMed] [Google Scholar]
- MacDonald, M. J. 1989. Does glyceraldehyde enter pancreatic islet metabolism via both the triokinase and the glyceraldehyde phosphate dehydrogenase reactions? A study of these enzymes in islets. Arch. Biochem. Biophys. 270:15–22. [DOI] [PubMed] [Google Scholar]
- Matschinsky, F. M., B. Glaser, and M. A. Magnuson. 1998. Pancreatic β-cell glucokinase. Closing the gap between theoretical concepts and experimental realities. Diabetes. 47:307–315. [DOI] [PubMed] [Google Scholar]
- Meienhofer, M. C., D. Cottreau, J. C. Dreyfus, and A. Kahn. 1980. Kinetic properties of human F4 phosphofructokinase. FEBS Lett. 110:219–222. [DOI] [PubMed] [Google Scholar]
- Merry, S., and H. G. Britton. 1985. The mechanism of rabbit muscle phosphofructokinase at pH8. Biochem. J. 226:13–28. [DOI] [PMC free article] [PubMed] [Google Scholar]
- Newgard, C. B., and J. D. McGarry. 1995. Metabolic coupling factors in pancreatic beta-cell signal transduction. Annu. Rev. Biochem. 64:689–719. [DOI] [PubMed] [Google Scholar]
- Nilsson, T., V. Schultz, P.-O. Berggren, B. E. Corkey, and K. Tornheim. 1996. Temporal patterns of changes in ATP/ADP ratio, glucose 6-phosphate and cytoplasmic free Ca2+ in glucose-stimulated pancreatic β-cells. Biochem. J. 314:91–94. [DOI] [PMC free article] [PubMed] [Google Scholar]
- Otto, M., R. Heinrich, G. Jacobasch, and S. Rapoport. 1977. A mathematical model for the influence of anionic effectors on the phosphofructokinase from rat erythrocytes. Eur. J. Biochem. 74:413–420. [DOI] [PubMed] [Google Scholar]
- Pettigrew, D. W., and C. Frieden. 1979. Rabbit muscle phosphofructokinase. J. Biol. Chem. 254:1896–1901. [PubMed] [Google Scholar]
- Polonsky, K. S., B. D. Given, L. J. Hirsch, H. Tillil, E. T. Shapiro, C. Beebe, B. H. Frank, J. A. Galloway, and E. V. Cauter. 1988. Abnormal patterns of insulin secretion in non-insulin-dependent diabetes mellitus. N. Engl. J. Med. 318:1231–1239. [DOI] [PubMed] [Google Scholar]
- Porterfield, D. M., R. F. Corkey, R. H. Sanger, K. Tornheim, P. J. Smith, and B. E. Corkey. 2000. Oxygen consumption oscillates in single clonal pancreatic beta-cells (HIT). Diabetes. 49:1511–1516. [DOI] [PubMed] [Google Scholar]
- Rais, B., F. Ortega, J. Puigjaner, B. Comin, F. Orosz, J. Ovadi, and M. Cascante. 2000. Quantitative characterization of homo- and heteroassociations of muscle phosphofructokinase with aldolase. Biochim. Biophys. Acta. 1479:303–314. [DOI] [PubMed] [Google Scholar]
- Ristow, M., H. Carlqvist, J. Heibnick, M. Vorgerd, W. Krone, A. Pfeiffer, D. Müller-Wieland, and C.-G. Östenson. 1999. Deficiency of phosphofructo-1-kinase/muscle subtype in humans is associated with impairment of insulin secretory oscillations. Diabetes. 48:1557–1561. [DOI] [PubMed] [Google Scholar]
- Schuit, F., K. Moens, H. Heimberg, and D. Pipeleers. 1999. Cellular origin of hexokinase isoforms in pancreatic islets. J. Biol. Chem. 274:32803–32809. [DOI] [PubMed] [Google Scholar]
- Sherman, A. 1996. Contributions of modeling to understanding stimulus- secretion coupling in pancreatic β-cells. Am. J. Physiol. 271:E362–E372. [DOI] [PubMed] [Google Scholar]
- Shimizu, T., J. C. Parker, H. Najafi, and F. M. Matschisky. 1988. Control of glucose metabolism in pancreatic β-cells by glucokinase, hexokinase, and phosphofructokinase. Model study with cell lines derived from β-cells. Diabetes. 37:1524–1530. [DOI] [PubMed] [Google Scholar]
- Smolen, P. 1995. A model for glycolytic oscillations based on skeletal muscle phosphofructokinase kinetics. J. Theor. Biol. 174:137–148. [DOI] [PubMed] [Google Scholar]
- Sweet, I. R., G. Li, H. Najafi, D. Berner, and F. M. Matschinsky. 1996. Effect of a glucokinase inhibitor on energy production and insulin release in pancreatic islets. Am. J. Physiol. 271:E606–E625. [DOI] [PubMed] [Google Scholar]
- Sweet, I. R., and F. M. Matschinsky. 1995. Mathematical model of β-cell glucose metabolism and insulin release. I. Glucokinase as glucosensor hypothesis. Am. J. Physiol. 268:E775–E788. [DOI] [PubMed] [Google Scholar]
- Sweet, I. R., H. Najafi, G. Li, J. Grodberg, and F. M. Matschinsky. 1997. Measurement and modelling of glucose-6-phosphatase in pancreatic islets. Am. J. Physiol. 272:E696–E711. [DOI] [PubMed] [Google Scholar]
- Takeda, J., M. Gidh-Jain, L. Z. Xu, P. Frogue, G. Velho, M. Vaxillaire, D. Cohen, F. Shimada, H. Makino, S. Nishi, M. Stoffel, N. Vionnet, R. S. Charles, R. W. Harrison, I. T. Weber, G. I. Bell, and S. J. Pilkis.1993. Structure/function studies of human β-cell glucokinase. J. Biol. Chem. 268:15200–15204. [PubMed] [Google Scholar]
- Termonia, Y., and J. Ross. 1981. Oscillations and control features in glycolysis:Numerical analysis of a comprehensive model. Proc. Natl. Acad. Sci. USA. 78:2952–2956. [DOI] [PMC free article] [PubMed] [Google Scholar]
- Tornheim, K. 1979. Oscillations of the glycolytic pathway and the purine nucleotide cycle. J. Theor. Biol. 79:491–541. [DOI] [PubMed] [Google Scholar]
- Tornheim, K. 1985. Activation of muscle phosphofructokinase by fructose 2,6- bisphosphate and fructose 1,6-bisphosphate is differently affected by other regulatory metabolites. J. Biol. Chem. 260:7985–7989. [PubMed] [Google Scholar]
- Tornheim, K. 1988. Fructose 2,6-bisphosphate and glycolytic oscillations in skeletal muscle extracts. J. Biol. Chem. 263:2619–2624. [PubMed] [Google Scholar]
- Tornheim, K. 1997. Are metabolic oscillations responsible for normal oscillatory insulin secretion? Diabetes. 46:1375–1380. [DOI] [PubMed] [Google Scholar]
- Tornheim, K., and J. M. Lowenstein. 1975. The purine nucleotide cycle. Control of phosphofructokinase and glycolytic oscillations in muscle extracts. J. Biol. Chem. 250:6304–6314. [PubMed] [Google Scholar]
- Tornheim, K., and J. M. Lowenstein. 1976. Control of phosphofructokinase from rat skeletal muscle. J. Biol. Chem. 251:7322–7328. [PubMed] [Google Scholar]
- Trus, M., H. Warner, and F. Matschinsky. 1980. Effects of glucose on insulin release and on intermediary metabolism of isolated perifused pancreatic islets from fed and fasted rats. Diabetes. 29:1–14. [DOI] [PubMed] [Google Scholar]
- Trus, M. D., W. S. Zawalich, P. T. Burch, D. K. Berner, V. A. Weill, and F. M. Matschinsky. 1981. Regulation of glucose metabolism in pancreatic islets. Diabetes. 30:911–922. [DOI] [PubMed] [Google Scholar]
- Uyeda, K. 1979. Phosphofructokinase. Adv. Enzymol. Relat. Areas Mol. Biol. 48:193–244. [DOI] [PubMed] [Google Scholar]
- Veech, R. L., L. Raijman, K. Dalziel, and H. A. Krebs. 1969. Disequilibrium in the triose phosphate isomerase system in rat liver. Biochem. J. 115:837–842. [DOI] [PMC free article] [PubMed] [Google Scholar]
- Velick, S. F., and C. Furfine. 1963. Glyceraldehyde-3-Phosphate Dehydrogenase. In The Enzymes, 3rd ed, Vol. VII. P. Boyer, editor. Academic Press, New York. 243–273.
- Venieratos, D., and A. Goldbeter. 1979. Control analysis of glycolytic oscillations. Biochimie. 61:1247–1256. [DOI] [PubMed] [Google Scholar]
- Wang, H., P. A. Antinozzi, K. A. Hagenfeldt, P. Maechler, and C. B. Wollheim. 2000. Molecular targets of a human HNF1 alpha mutation responsible for pancreatic beta-cell dysfunction. EMBO J. 19:4257–4264. [DOI] [PMC free article] [PubMed] [Google Scholar]
- Wang, H., and P. B. Iynedjian. 1997. Modulation of glucose responsiveness of insulinoma β-cells by graded overexpression of glucokinase. Proc. Natl. Acad. Sci. USA. 94:4372–4377. [DOI] [PMC free article] [PubMed] [Google Scholar]
- Yaney, G. C., V. Schultz, B. A. Cunningham, G. A. Dunaway, B. E. Corkey, and K. Tornheim. 1995. Phosphofructokinase isozymes in pancreatic islets and clonal β-cells (INS-1). Diabetes. 44:1285–1289. [DOI] [PubMed] [Google Scholar]