Abstract
The light-induced oxidation of water by Photosystem II (PS II) of higher plants, algae, and cyanobacteria, is the main source of atmospheric oxygen. The discovery of the flash-induced period four oscillations in the oxygen evolution made by Pierre Joliot in 1969 has a lasting impact on current photosynthesis research. Bessel Kok explained such oscillations by introducing the cycle of flash-induced transitions of states (S-states) of an oxygen-evolving complex governed by the values of miss and double hit. Although this Kok model has been successfully used over 30 years for interpretation of experimental data in photosynthesis, until now there has been no simple analytical solution for it. Such an analytical solution for individual S-states and for oxygen evolution is presented here. When only the S1 state is present before flash series, and when both the miss and double hit are zero, the oxygen evolved by the PSII after the nth flash, Y(n), is given by the following equation: 4Y(n) = 1 + (−1)n−1 − 2 cos((n − 1)π/2). It is found here that binary oscillations of the secondary acceptor semiquinone at the acceptor side of the reaction center of PS II and release of reducing equivalents from reaction center to b6f complex can also be determined in the framework of the Kok model. The simple solutions found here for individual S-states, semiquinone, and oxygen evolution provide a basis for quantitative description of the charge accumulation processes at the donor and acceptor sides of PSII. It also provides a rare example of a significant problem in biology, which can be solved analytically.
INTRODUCTION
Photosystem II (PSII) is a light-dependent water:plastoquinone-oxidoreductase that uses light energy to oxidize water and to reduce plastoquinone (reviewed in Ke, 2001; Renger, 2001). The overall reaction driven by PSII is described by the following equation:
 |
(1) |
Here PQ and PQH2 are oxidized and reduced plastoquinone molecules.
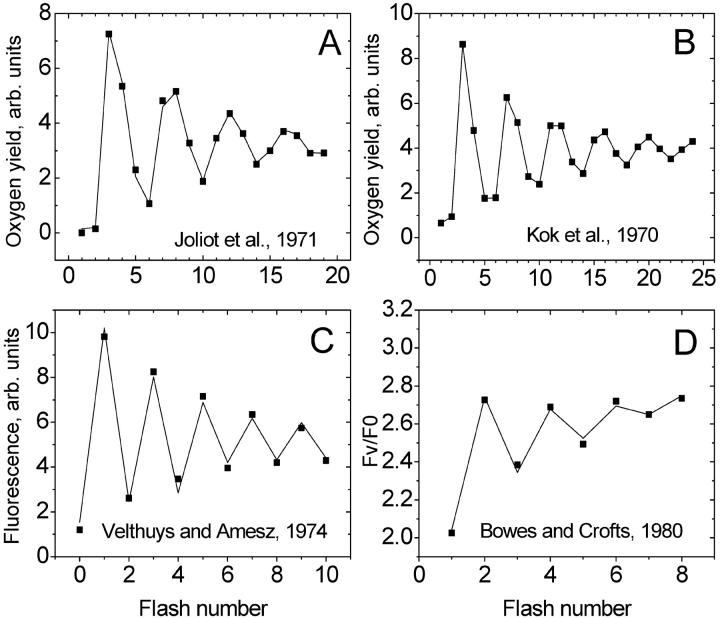
The activation of PSII by a series of single turnover flashes leads to oxygen evolution with a periodicity of four (Joliot et al., 1969, 1971; Joliot and Kok, 1975; see Fig. 1 A). It was explained by introducing the concept of the S-states of the oxygen-evolving complex, where each S-state has a different number of oxidizing equivalents (Kok et al., 1970; Joliot and Kok, 1975). The original Kok model explains the observed pattern of oxygen evolution by introducing five discrete states—S0, S1, S2, S3, and S4—that could be accessed by four light activations of PS II (Fig. 2). The transient state, S4, is usually excluded from the consideration in kinetic models of oxygen evolution (Joliot and Kok, 1975). To describe damping of the oscillations, the Kok model introduces misses, which characterize the failure to advance the S-states, and double hits, which characterize the advancement of S-states two at a time (Fig. 2). Double hits were introduced to take into account the double light activation of PS II due to the duration of a long flash (Kok et al., 1970). They are absent if one uses short laser flashes instead of xenon flashes (Joliot and Kok, 1975). Kok et al. (1970) did not initially exclude the possibility that misses are different for each transition. However, they found that equal misses provide a satisfactory fitting of experimental points.
FIGURE 1.
Classical experiments describing flash-induced charge accumulation at the donor (A and B) and acceptor (C and D) sides of Photosystem II. (A and B) Flash-induced oxygen evolution in spinach chloroplasts measured by Joliot et al. (1971) and by Kok et al. (1970), respectively. (C and D) Flash-induced binary oscillations of fluorescence measured by Velthuys and Amesz (1974) and by Bowes and Crofts (1980), respectively.
FIGURE 2.
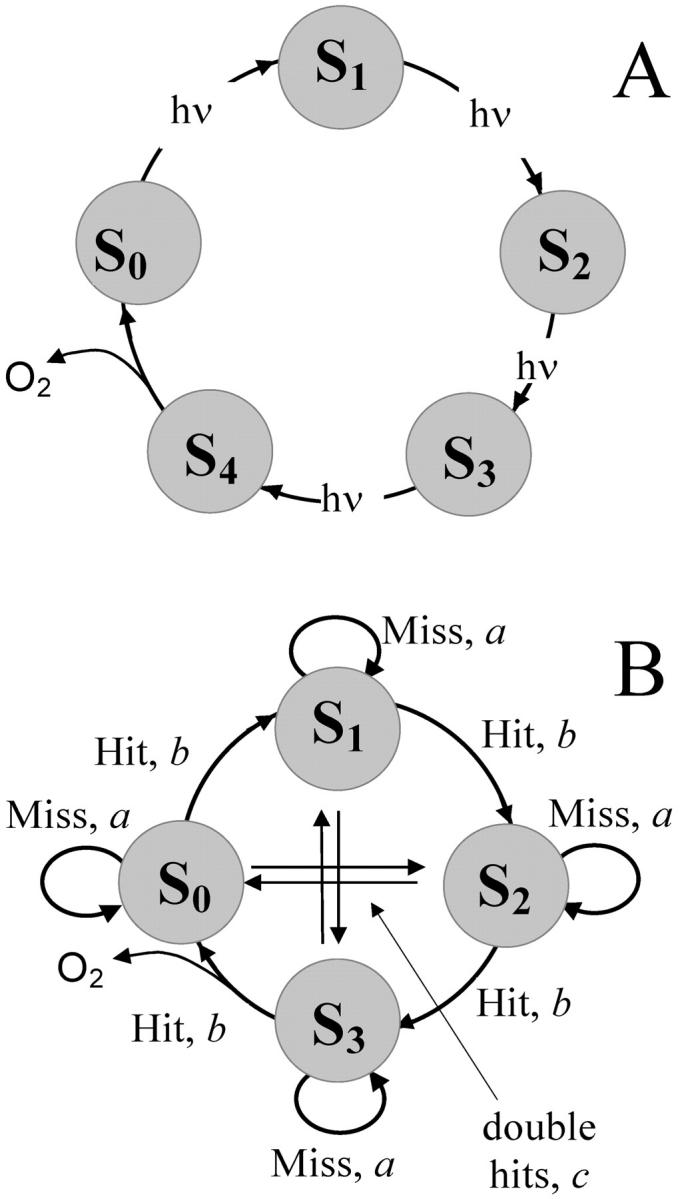
(A) The Kok model (Kok et al., 1970) explaining period four in flash-induced oxygen evolution. (B) The same model with respective letter notations for misses (a), hits (b), and double hits (c).
The Kok model has been successfully used over 30 years for interpretation of experimental data in photosynthesis (see, for example, Messinger and Renger, 1994). From a mathematical point of view, the Kok model is a difference equation with constant coefficients, the general form of solution for which is known (see, e.g., Srang, 1980). Many significant advances in adapting this general theory to oxygen evolution have been achieved (see, for example, Delrieu, 1974; Lavorel, 1976; Thibault, 1978; Jursinic, 1981; Beckwith and Jursinic, 1982; Mar and Govindjee, 1972; Meunier and Popovic, 1991; Lavergne, 1991; Meunier et al., 1996; Burda and Schmid, 1996). However, the final analytical solution for any initial conditions has not been found. Here I present such a solution for arbitrary initial conditions (see Eq. 10 below).
THE KOK MODEL
The Kok model as a Markov chain
The Kok model of oxygen evolution can be naturally formulated as a Markov chain (Delrieu, 1974), i.e., a stochastic process with discrete states and discrete time (reviewed in Feller, 1970). The Markov chain can be defined by introducing the following.
The row vector of probabilities of S-states, p(n) = (p0(n), p1(n), p2(n), and p3(n)), where pi(n) is the probability to find the oxygen-evolving complex of PSII in the Si state
 after the nth flash (n = 0,1,2, …). For n = 0 row vector, p(0) = (p0(0), p1(0), p2(0), and p3(0)) ≡ (s0, s1, s2, s3) describes the initial (before-the-first-flash) conditions.
- The matrix
 of the transition probabilities
where a is the miss, b is the hit, and c is the double hit, a + b + c = 1. Each element qij (i, j = 1, 2, 3, 4) of this matrix is the transition probability for flash-induced transfer of the oxygen-evolving complex from state Si−1 to state Sj−1. The probability of triple hits is assumed to be zero. Fig. 2 B shows a graphic representation of the matrix of transition probabilities for the Kok model.
(2)
Probabilities of individual S-states for different flash numbers
The probability for the oxygen-evolving complex to be in the Si state after the nth flash is given by the i + 1th component of the row vector p(n) = (p0(n), p1(n), p2(n), and p3(n)), which, in turn, can be evaluated from the equation
 |
(3) |
This equation says that the probability of a certain state of the oxygen evolving complex after the nth flash is determined by the probabilities of the state of oxygen evolving complex after the n − 1 flash, p(n − 1), and by the matrix of one-step transition probabilities, Q. One can consider Eq. 3 as a balance equation, which shows how the probabilities of S-states are redistributed after the nth flash.
From Eq. 3, one obtains
 |
(4) |
Thus, the probability of certain state of the oxygen-evolving complex after the nth flash is determined by the probabilities of the state of oxygen-evolving complex at the initial moment of time, p(0), and by the nth power of the matrix of one-step transition probabilities, Q, given by Eq. 2.
Oxygen evolution by PSII after the nth flash is determined by the probability of the oxygen-evolving complex to be in the S3 and S2 states after the (n − 1) flash. In the general case, hits and misses should be different for each Si. Here, we consider the simplest case when hits (b) and double hits (c) do not depend on S-states:
 |
(5) |
Thus, to determine the oxygen evolution by PSII, one should find the probabilities of S3 and S2 states for each flash. Equation 4 shows that to find the probabilities p0(n), p1(n), p2(n), and p3(n), one needs to calculate the nth power of the matrix Q of transition probabilities.
Eigenvalues of matrix Q of transition probabilities
As can be checked directly, the characteristic equation for matrix Q, |Q − λI| = 0, where I is the identity matrix, has the following solutions for λ:
 |
(6) |
where a, b, and c are miss, hit, and double-hit, respectively; r = [(a − c)2 + b2]1/2; ϕ = arcsin(b/r); and i2 = −1.
General solution of the Kok model
The matrix Q in Eq. 2 can be diagonalized,
 |
(7) |
where Λ is the diagonal matrix with eigenvalues of matrix Q given by Eq. 6, and U is unitary matrix  :
:
 |
(8) |
Thus, Eq. 4 can be written as
 |
(9) |
This expression provides a simple way to calculate the probabilities of states of the oxygen-evolving complex after the nth flash via eigenvalues λi, and via probabilities of states before the flash series, p(0). By multiplying all terms in Eq. 9 one can find the probabilities of individual S-states:
 |
(10) |
where r = [(a − c)2 + b2]1/2, ϕ = arcsin(b/r), n = number of the flashes, and si = pi(0) are initial conditions for Si; sb = s0 − s1 + s2 − s3; s02 = s0 − s2; s31 = s3 − s1; s13 = s1 − s3, etc.
Equation 10 provides the general solution of the Kok model and describes the flash number dependence of individual S-states for arbitrary initial conditions. To write down this solution in traditional notations where α is used for miss and β is used for double hit, one needs to make the following replacements in Eq. 10: a → α, b → 1 − α − β, c → β.
Because the sum of a sine and a cosine function must be another sine function, the general solution is the sum of the term,  , describing binary oscillations and the quarternary oscillation term (damped sine function), the relative amplitude of which depends on initial conditions. While some quarternary terms have negative values, after adding together they nevertheless produce the probability of the individual state, which is always positive or zero. It can be checked directly that for each flash, p0(n) + p1(n) + p2(n) + p3(n) = 1.
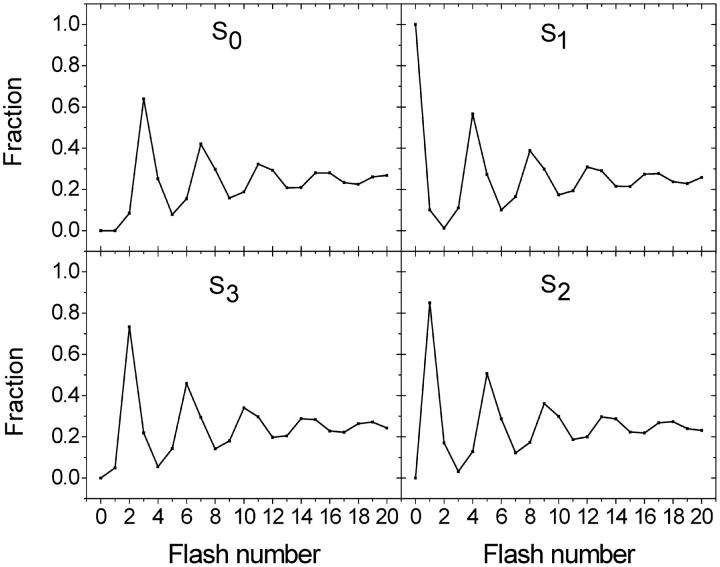
Fig. 3 shows the flash number dependence of individual S-states, calculated from Eq. 10 for a particular value of parameters. Maxima and minima reached by the respective S-state depend on the initial conditions.
FIGURE 3.
Flash number dependence of individual S-states, calculated from Eq. 10 using the following parameters: miss, 0.1; double hit, 0.05. Initial conditions: s0 = 0; s1 = 1; s2 = 0; and s3 = 0.
Oxygen evolution after the nth flash is determined by Eq. 5:
 |
(11) |
where  are given by Eq. 10.
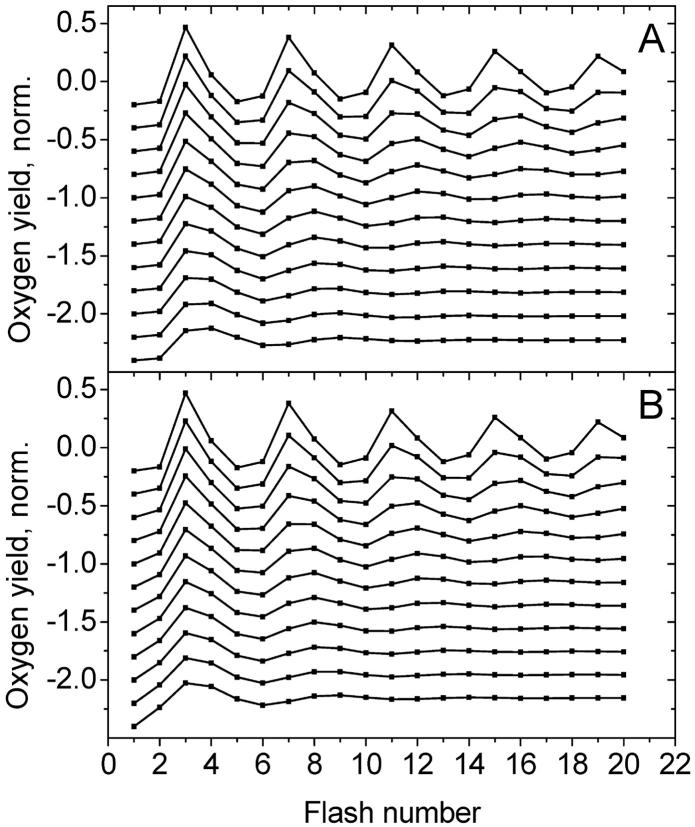
Fig. 4 shows the flash-induced oxygen evolution calculated from Eq. 11 for different values of miss (A) and double hit (B). Increase of miss (at zero double hit) leads to a significant reduction of the sharpness of the oscillation pattern. It also increases the apparent period of oscillations.
FIGURE 4.
Flash-induced oxygen evolution calculated from Eq. 11 for different miss (A) and double hit (B) parameters. In A, the value of miss is increasing from 0.025 (top curve) to 0.3 (bottom curve) with step 0.025. Double hit is 0.02. In B, the value of double hit is increasing from 0.025 (top curve) to 0.3 (bottom curve) with step 0.025. Miss is 0.02. The distribution of the states at the beginning of the flash series was assumed to be s0 = 0.25 and s1 = 0.75 for both A and B. Traces are shifted vertically to improve their visibility.
The increase of double hit (at zero miss) leads to disappearance of oscillations and to the increase of the amplitude of oxygen yield after the second flash. Other than that, the effects of miss and double hit on the pattern of oscillations are similar.
Equation 10 can be rewritten as a single equation,
 |
(12) |
where 
 , and index k in sk is the congruent modulo 4 index taking only values 0, 1, 2, and 3; thus, for example, s4 = s0, s5 = s1, and s6 = s2.
Period of oscillations
Equation 12 shows that the general solution includes the term  describing damped oscillations with period
 |
(13) |
When a miss is equal to a double hit, ϕ = π/2 and the period of oscillations is exactly four: T = 2π/(π/2) = 4. In all other cases, the period is larger than 4. In a particular case of zero double hit, the period is equal to ∼4, 4.14, 4.30, 4.50, 4.74, and 5.03 for misses 0, 0.05, 0.1, 0.15, 0.2, and 0.25, respectively. Thus, increasing the miss parameter in this case leads to an increase in the period of oscillations. This can explain the deviation of the maximum of oscillations of oxygen evolution from the “classical” pattern 3, 7, 11, etc. Such deviation can be seen in Fig. 1 A, where the maximum of oxygen evolution is observed after the eighth flash (i.e., pattern 3, 8, and 13 is observed). Fitting of data shown in Fig. 1 gave T ≈ 4.31 for Fig. 1 A and T ≈ 4.17 for Fig. 1 B.
Simplified equations for particular cases
Equations for individual S-states and oxygen evolution can be further simplified for particular cases of parameters or initial conditions.
Initial conditions
For initial conditions s0 = 0, s1 = 1, s2 = 0, and s3 = 0 frequently observed experimentally (reviewed in Ke, 2001), above equations take a simpler form. For example, for p3(n) we have:
 |
(14) |
Double hits are zero (c = 0)
When double hits are zero (c = 0), Eq. 11 for oxygen evolution takes the form:
 |
(15) |
This is further simplified if only S1 is present before the flash series:
 |
(16) |
Binary oscillations of semiquinone in PSII
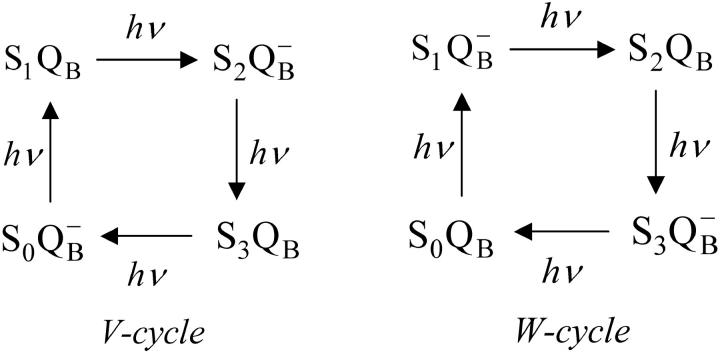
Fig. 5 shows that the same scheme describes the accumulation of charges at the donor and acceptor sides. Depending on initial conditions for QB, there are two possible cycles—the so-called V- and W-cycles (Shinkarev and Wraight, 1993a). Single turnover of the oxygen-evolving complex in each cycle is accompanied by two turnovers of the acceptor quinone complex. These schemes indicate that the general equation for behavior of the acceptor side of PSII can be obtained by summing the solutions for respective S-states. Let us consider V-cycle only, for certainty. By adding p0 and p2 from Eq. 10 one can obtain the equation for binary oscillations of  as function of flash number, n:
 |
(17) |
where, as before, si = pi(0), sb = s0 − s1 + s2 − s3, and b is the hit.
FIGURE 5.
Schemes of flash-induced transitions in PSII, indicating coexistence of S-state transitions at the donor side and QB transitions at the acceptor side (Shinkarev and Wraight, 1993a).
When the value of hit, b, is close to 1, the term (1 − 2 b) is negative. In this case (1 − 2 b)n is positive for each even n, and is negative for each odd n. This alternating adding and subtraction of (1 − 2 b)n in Eq. 17 is modulated by the value of initial conditions, sb = s0 − s1 + s2 − s3, and provides a basis for the observed binary oscillations (see Shinkarev and Wraight, 1993b, and references cited therein, for alternative description of binary oscillations in the case of unequal misses). When PSII is in the state S1QB before the first flash (i.e., sb = s1 = 1), oscillations of semiquinone are described by a very simple equation:
 |
(18) |
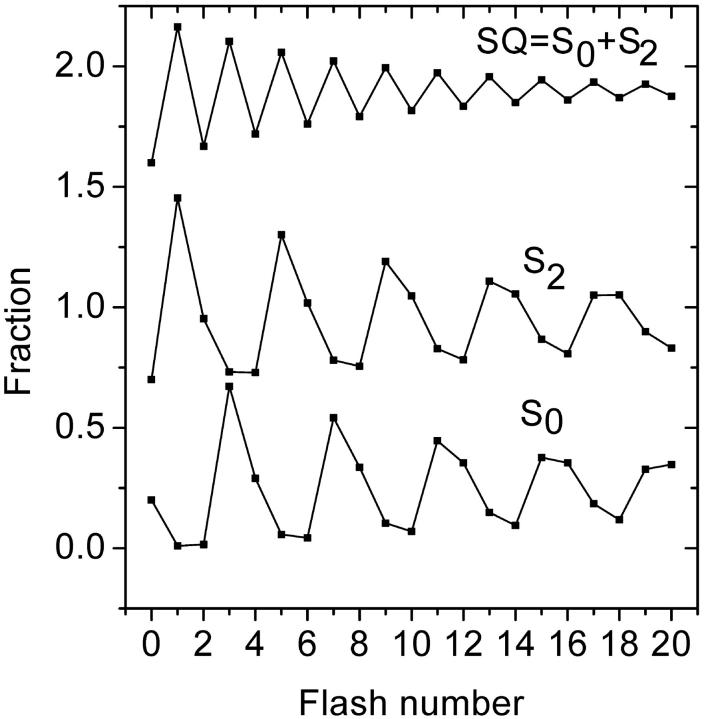
Fig. 6 (top curve) shows binary oscillations of  described by Eq. 18 as well as probabilities for S0 and S2. This figure illustrates how adding two period four oscillations for S0 and S2 leads to period two oscillations for
  One can see how the maxima of S0 and S2 are forming maxima for binary oscillations.
FIGURE 6.
Flash number dependence of the semiquinone  calculated using Eq. 17. Fractions of S0 and S2 states were calculated using Eq. 10. Miss, 0.05; double hit, 0.01. It is assumed that at the beginning of the flash series, 80% of PSII are in the S1 state and 20% are in the S0 state. Traces for S2 and
  are shifted up to improve their visibility.
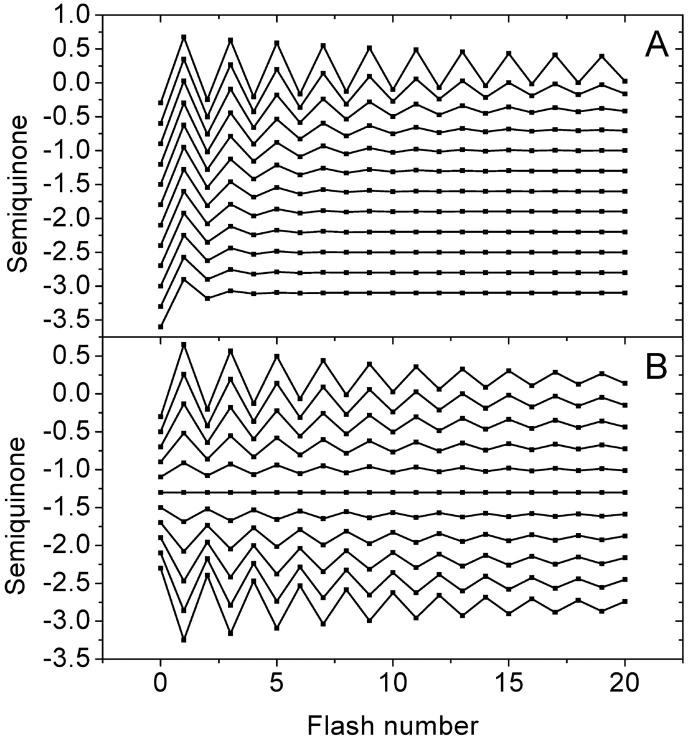
Fig. 7 shows  binary oscillations for different value of misses (Fig. 7 A) and for different initial conditions (Fig. 7 B). Depending on initial conditions, oscillations can change their direction. There are no oscillations when s1 = s2 = 0.5.
FIGURE 7.
Dependence of binary oscillations on different factors. (A) Effect of miss on the flash number dependence of  , calculated for V-cycle (Fig. 5) using Eq. 17. Miss is increasing from 0.025 (top curve) to 0.3 (bottom curve) with step 0.025. Initial conditions, s0 = 0; s1 = 1. Double hit is zero. (B) Effect of initial conditions on the flash number dependence of the relative concentrations
  Traces are calculated from Eq. 17. Initial conditions for S0 is changing from 1 (top) to 0 (bottom) with step 0.1. It is assumed that s1 = 1 − s0. Traces are shifted vertically to improve their visibility.
Similarly, by adding p1 and p3 one can obtain the equation for binary oscillations of the oxidized form of QB in the V-cycle or semiquinone  in the W-cycle.
Release of electrons from PSII
Knowing the flash number dependence of semiquinone one can quantitatively estimate the release of reducing equivalents from the acceptor side of PSII and periodic activation of b6f complex by plastoquinol. Indeed, the release of electrons from PSII occurs only when QB semiquinone obtains a second electron from QA and forms plastoquinol, QBH2. The amount of plastoquinol formed in PSII immediately after the nth flash is proportional to semiquinone formed by the previous flash and can be described by the following simple equation:
 |
(19) |
Here, sb = s0 − s1 + s2 − s3, b is the hit, and const is the respective proportionality constant.
Decay of period two and period four oscillations
Fig. 6 shows that binary oscillations decay faster than period four oscillations. This property of the Kok model is observed for a wide set of parameters. Indeed, from Eq. 17 it follows that the decay of binary oscillations is determined by the value of the |2 b − 1|, whereas the decay of period four oscillations is determined by the value of  It is easy to see that r ≥ b. Therefore, r ≥ b > |2 b − 1| for any 0.5 ≤ b < 1.
Number of independent parameters
The general solution for the individual S-states described by Eq. 10 allows specifying the number of independent parameters that govern observed period four oscillations in the Kok model. Each solution depends on values of b, r, and ϕ, as well as on the values of initial conditions s0, s1, s2, and s3. However, one should take into account that r, b, and ϕ are interdependent, because r × sin ϕ = b. The same is true for s0, s1, s2, and s3, because s0 + s1 + s2 + s3 = 1. Thus, in the general case, only five independent parameters, for example, b, r, s0, s1, and s2, or a (miss), c (double hit), s0, s1, and s2, govern the pattern of oscillation for a particular S-state.
Finding the parameters governing oxygen evolution
The simple solution found here provides a basis for quantitative description of the charge accumulation processes at the donor and acceptor sides of Photosystem II. It also significantly simplifies the finding of unknown parameters of the model by standard nonlinear regression analysis implemented in many widely used software packages such as Microcal Origin and others. One can directly use Eq. 11 to find unknown parameters b and r as well as the values of initial conditions s0, s1, and s2 and then calculate miss, double hit, and initial conditions, or one can directly write Eq. 11 as function of miss, double hit, s0, s1, and s2, and determine these parameters by nonlinear regression analysis.
Fitting experimental points of Fig. 1 A with Eq. 11 gave the following parameters: a = 0.12, b = 0.86, c = 0.02, s0 = 0.32, s1 = 0.68, and s2 = 0. Fitting the experimental points in Fig. 1 B (shown by solid lines) gave the following parameters: a = 0.08, b = 0.89, c = 0.03, s0 = 0.24, s1 = 0.69, and s2 = 0.02. Thus, the experiment shown in Fig. 1 A has less double hits and larger misses than the experiment shown in Fig. 1 B.
Finding the parameters governing binary oscillations of semiquinone
Equation 17 provides a basis for quantitative description of charge accumulation processes at the acceptor side of Photosystem II. It also significantly simplifies finding unknown parameters that govern observed binary oscillations. Fitting the experimental points of Fig. 1, C and D, with Eq. 11 (shown by solid lines), gave b = 0.91 for Fig. 1 C and b = 0.83 for Fig. 1 D. Thus, the experiment shown in Fig. 1 C has a larger hit than the experiment shown in Fig. 1 D.
Binary oscillations of semiquinone can be used to characterize oxygen evolution
Because flash-induced transitions of the oxygen evolving complex and quinone acceptor are described by the same scheme (see Fig. 5) one can ask the following question. Is it enough to measure binary oscillations of semiquinone to characterize damping of period four oscillations of oxygen evolution? In the general case, the answer is negative, because analysis of binary oscillations allows one to determine only hit, b, while oxygen evolution damping is determined by two parameters (for example, by miss, a, and hit, b).
However, if one uses laser instead of xenon flashes, then double hit is zero and both r and ϕ in Eq. 10 depend only on a single parameter (hit, b, or miss, a = 1 − b). In this particular case, binary oscillations of semiquinone can be used to characterize damping of period four oscillations of oxygen evolution.
CONCLUSIONS
Quantitative analysis of flash-induced oxygen evolution in photosynthesis, which is the main source of atmospheric oxygen on Earth, is presented. The discussion is limited to the Kok model (Kok et al., 1970). While this model has been successfully used over 30 years for interpretation of experimental data in photosynthesis, until recently there was no simple solution for it. Such a solution is presented and discussed here. This solution allows determination of parameters of the Kok model via standard nonlinear regression analysis implemented in many widely used software packages such as Microcal Origin. The simple analytical solution for oxygen evolution found here made obsolete many previous quantitative approaches to the analysis of oxygen evolution based on the Kok model.
Correlation of S-states transitions at the donor side of the PS II and secondary acceptor quinone (QB) transitions at the acceptor side lead to the recognition of two different reaction sequence cycles of Photosystem II, so-called cycles V and W (Shinkarev and Wraight, 1993a). In each of these cycles the binary oscillations of the QB semiquinone can be obtained from the solution for individual S-states. Thus, the Kok model allows simultaneous description of individual S-states,  QBH2, and oxygen evolution with the same parameters.
Acknowledgments
The useful discussions with Tony Crofts, Govindjee, Derrick Kolling, and Colin Wraight are gratefully acknowledged.
This work was partially supported by National Institutes of Health grant GM 53508.
Abbreviations used: a, b, c, miss, hit, and double hit in the Kok model; n, number of the flashes; PQ, plastoquinone; PSII, Photosystem II; pi(n) is the probability to find the oxygen evolving complex of PSII in the Si state (i = 0,1,2,3) after the nth flash (n = 0,1,2, …); p(n) = (p0(n), p1(n), p2(n), and p3(n)), the row vector of probabilities of S-states after nth flash; Q = {qij}, matrix of transition probabilities, each element of which, qij (i, j = 1, 2, 3, 4), is the probability for flash-induced transfer of the oxygen-evolving complex from state Si−1 to state Sj−1;  , semiquinone form of secondary acceptor quinone; r = [(a − c)2 + b2]1/2; Si, S-states of oxygen-evolving complex; s0 = p0(0), s1 = p1(0), s2 = p2(0), s3 = p3(0), initial conditions for S-states; sb = s0 − s1 + s2 − s3; sij = si − sj where i and j are congruent modulo 4 indexes; V- and W-cycles, correlated cycles of transitions of donor and acceptor sides of PSII; U, unitary matrix, transforming matrix Q to diagonal form; Y(n), oxygen yield after nth flash; λ1, λ2, λ3, and λ4, eigenvalues of matrix Q; Λ is the diagonal matrix with eigenvalues λ1, λ2, λ3, and λ4 of matrix Q; ϕ = arcsin(b/r); ρ =
  ; θk = arcsin[(sk − sk+2)/ρ].
References
- Beckwith, A. C., and P. A. Jursinic. 1982. An alternative approach to the analysis of photosynthetic oxygen evolution. J. Theor. Biol. 97:251–265. [Google Scholar]
- Bowes, J. M., and A. R. Crofts. 1980. Binary oscillations in the rate of reoxidation of the primary acceptor of Photosystem II. Biochim. Biophys. Acta. 590:373–384. [DOI] [PubMed] [Google Scholar]
- Burda, K., and G. H. Schmid. 1996. On the determination of the S-state distribution in the Kok model. Z. Naturforsch. 51:329–341. [Google Scholar]
- Delrieu, M. J. 1974. Simple explanation of the misses in the cooperation of charges in photosynthetic oxygen evolution. Photochem. Photobiol. 20:441–454. [Google Scholar]
- Feller, W. 1970. An Introduction to the Probability Theory and its Applications, Vol. 1. John Wiley and Sons, New York.
- Joliot, P., and B. Kok. 1975. Oxygen evolution in photosynthesis. In Bioenergetics of Photosynthesis. Govindjee, editor. Academic Press, New York. pp.388–413.
- Joliot, P., G. Barbieri, and R. Chabaud. 1969. Un nouveau modèle des centres photochimiques du système II. Photochem. Photobiol. 10:309–329. [Google Scholar]
- Joliot, P., A. Joliot, B. Bouges, and G. Barbieri. 1971. Studies of system II photocenters by comparative measurements of luminescence, fluorescence and oxygen emission. Photohem. Photobiol. 14:287–305. [Google Scholar]
- Jursinic, P. 1981. Investigation of double turnovers in Photosystem II charge separation and oxygen evolution with excitation flashes of different duration. Biochim. Biophys. Acta. 635:38–52. [DOI] [PubMed] [Google Scholar]
- Ke, B. 2001. Photosynthesis: Photobiochemistry and Photobiophysics. Kluwer, Dordrecht, The Netherlands.
- Kok, B., B. Forbush, and M. McGloin. 1970. Cooperation of charges in photosynthetic O2 evolution. I. A linear four step mechanism. Photochem. Photobiol. 11:467–475. [DOI] [PubMed] [Google Scholar]
- Lavergne, J. 1991. Improved UV-visible spectra of the S-transitions in the photosynthetic oxygen-evolving system. Biochim. Biophys. Acta. 1060:175–188. [Google Scholar]
- Lavorel, J. 1976. Matrix analysis of the oxygen evolving system of photosynthesis. J. Theor. Biol. 57:171–185. [DOI] [PubMed] [Google Scholar]
- Mar, T., and Govindjee. 1972. Kinetic models of oxygen evolution in photosynthesis. J. Theor. Biol. 36:427–446. [DOI] [PubMed] [Google Scholar]
- Messinger, J., and G. Renger. 1994. Analyses of pH-induced modifications of the period four oscillation of flash-induced oxygen evolution reveal distinct structural changes of the Photosystem II donor side at characteristic pH values. Biochemistry. 33:10896–10905. [DOI] [PubMed] [Google Scholar]
- Meunier, P. C., and R. Popovic. 1991. Improvement of 4-sigma analysis for the investigation of oxygen evolution by Photosystem II. Photosynth. Res. 29:113–115. [DOI] [PubMed] [Google Scholar]
- Meunier, P. C., R. L. Burnap, and L. A. Sherman. 1996. Improved 5-step modeling of the Photosystem II S-state mechanism in cyanobacteria. Photosynth. Res. 47:61–76. [DOI] [PubMed] [Google Scholar]
- Renger, G. 2001. Photosynthetic water oxidation to molecular oxygen: apparatus and mechanism. Biochim. Biophys. Acta. 1503:210–228. [DOI] [PubMed] [Google Scholar]
- Shinkarev, V. P., and C. A. Wraight. 1993a. Oxygen evolution in photosynthesis: from unicycle to bicycle. Proc. Natl. Acad. Sci. USA. 90:1834–1838. [DOI] [PMC free article] [PubMed] [Google Scholar]
- Shinkarev, V. P., and C. A. Wraight. 1993b. Electron and proton transfer in the acceptor quinone complex of reaction centers of phototrophic bacteria. In The Photosynthetic Reaction Center, Vol 1. J. Deisenhofer and J. Norris, editors. Academic Press, New York. pp.193–255.
- Srang, G. 1980. Linear Algebra and its Applications. Academic Press, Orlando, Florida.
- Thibault, P. 1978. A new attempt to study the oxygen evolving system of photosynthesis: determination of transition probabilities of a state i. J. Theor. Biol. 73:271–284. [DOI] [PubMed] [Google Scholar]
- Velthuys, B. R., and J. Amesz. 1974. Charge accumulation at the reducing side of Photosystem 2 of photosynthesis. Biochim. Biophys. Acta. 333:85–94. [DOI] [PubMed] [Google Scholar]


