Abstract
Concentration is a key parameter in controlling the aggregation of self-assembling oligopeptides. By investigating the concentration effects, an aggregation mechanism of EAK16-II is proposed. Depending on the critical aggregation concentration (CAC) of EAK16-II, the oligopeptide aggregates into protofibrils through seeding and/or a nucleation process. Protofibrils then associate with each other to form fibrils. The CAC was found to be ∼0.1 mg/ml by surface tension measurements. The nanostructures of aggregates were imaged and analyzed by atomic force microscopy. Globular and fibrillar aggregates were observed, and their dimensions were further quantified. To ensure that the aggregates were formed in bulk solution, light scattering (LS) measurements were conducted to monitor the fibril formation with time. The LS profile showed two different rates of aggregation depending on whether the peptide concentration was above or below the CAC. At high concentrations, the LS intensity increased strongly at early times. At low concentrations, the LS intensity increased only slightly. Our study provides information about the nature of the oligopeptide self-assembly, which is important to the understanding of the fibrillogenesis occurring in conformational diseases and to many biomedical engineering applications.
INTRODUCTION
Self-assembling oligopeptides are a new class of biomaterials, which have many potential applications in biomedical and pharmaceutical areas. Originally found in zoutin, a reported Z-DNA binding protein in yeast, the self-assembling oligopeptides are biocompatible and biodegradable (Zhang et al., 1993). These properties make them ideal as matrices in tissue engineering and carriers in drug delivery systems (Zhang et al., 1993, 1995; Holmes et al., 2000; Zhang and Altman, 1999). Playing an active role in cell adhesion, cell morphologies, and cell functions, matrices made of self-assembling oligopeptides have been reported to support mammalian cell attachment in different manners (Zhang et al., 1995). Self-assembling oligopeptides have been used as a scaffold for neurite outgrowth and synapse formation, and do not induce any measurable immune response or tissue inflammation when introduced into animals (Holmes et al., 2000).
The self-association of oligopeptides into insoluble macroscopic membranes could be considered as a model system for studying insoluble macrostructures, which have been found in many neurological disorders, such as Alzheimer's disease (Zhang et al., 1993, 1994; Altman et al., 2000; Zhang and Rich, 1997; Zhang and Altman, 1999). The macroscopic membranes or plaques can interfere with or even prevent cell-to-cell communications, which results in neurological disorders. One well-known self-assembling biomolecule is the amyloid β-protein (Aβ), which has been found to be an important factor in the cause of Alzheimer's disease (Ghanta et al., 1996). Much research has been done on amyloid aggregation by studying Aβ under different conditions (Halverson et al., 1990; Fraser et al., 1991; Fraser et al., 1994; Good and Murphy, 1995; Shen and Murphy, 1995; Yang et al., 1999; Kowalewski and Holtzman, 1999); however, the self-assembly process of Aβ is so complicated that it has not been fully understood. Rather than looking at the complete Aβ molecule (a peptide consisting of 40–42 amino acids), the study of the self-assembly of simpler oligopeptides may be an alternative. These oligopeptides could be used as model systems that would enable the finding of inhibitors that prevent fibrillogenesis and possibly, provide therapy to neurological disorders.
To understand the self-assembly mechanism of a given oligopeptide, it is necessary to study the conditions under which the oligopeptides aggregate and further develop into macrostructures. Among many conditions, the amino acid sequence and the pH are known to affect the aggregation of peptides (unpublished data) as well as the folding and function of proteins. In fact, the various biological environments in the human body are highly pH specific (i.e., pH 5 in the mouth; pH 1.5 and pH 7.4 in the stomach and blood, respectively) (Campbell, 1993). Concentration is another parameter which is important to the self-assembly of biomolecules. The concentration dependence of self-assembling oligopeptides is expected to be similar to that of biosurfactants, which have both hydrophobic and hydrophilic parts. By analogy with surfactants, a concentration study may allow one to determine the critical aggregation concentration (CAC). Similar to micellar systems, it is expected that the oligopeptides are in the monomer form below the CAC, while peptide aggregation starts to occur at and above the CAC. Time is also involved in the aggregation process. It provides information on the timescale over which the aggregation takes place. This is important to understand the kinetics of aggregation.
In our research, we chose EAK16, a typical member of the self-assembling oligopeptide family, as the first step to understand the self-assembly mechanism. EAK16 contains three amino acids (Ala, Glu, and Lys) connected into a well-defined sixteen amino acid long sequence. The hydrophobic Ala and hydrophilic Glu and Lys are assembled in a regularly organized sequence, which results in unique amphiphilic properties. EAK16-II is characterized by two negative and positive charges alternating in sequence (−−++−−++) (Zhang and Altman, 1999). Its molecular structure is shown in Fig. 1. EAK16-II molecules spontaneously assemble to form an insoluble macroscopic membrane upon addition of salt in aqueous solution (Zhang et al., 1993). Further investigation led to the proposal that the macroscopic membrane is formed by the stacking of β-sheets through ionic complements and hydrophobic interactions (Zhang et al., 1994; Altman et al., 2000). The β-sheet structure is stable at temperatures as high as 90°C and over a wide pH range, from pH 1.5 to pH 11 (Zhang and Altman, 1999).
FIGURE 1.
3D optimized molecular structure of EAK16-II. The amino acid sequence is AEAEAKAKAEAEAKAK. Two alternating positive (+) and negative (−) charges correspond to the glutamic acid (E) and lysine (K) residues, respectively. The upper side is hydrophobic because of the alanine (A) residues; the lower side is hydrophilic due to the glutamic acid and lysine residues. The length of the backbone is around 6.5 nm while the width ranges from 0.3 to 0.7 nm (3D optimized image from ACD/3D freeware, Toronto, ON, Canada).
In this paper, we characterize how concentration affects EAK16-II aggregation. Three techniques have been used. Surface tension measurements are commonly used to investigate the solution properties of molecules with an amphiphilic structure. One of the methods to determine surface tension is axisymmetric drop shape analysis-profile (ADSA-P) (Adamson and Gast, 1997; Lahati et al., 1996), which is a powerful and reliable technique to generate surface information. By ADSA-P, the surface tension obtained can be plotted against the bulk concentration, which reflects the aggregation status and possibly, the CAC of EAK16-II. Atomic force microscopy (AFM) is employed to visualize the nanostructures of EAK16-II aggregates. From AFM, high resolution images can be acquired. This images provide structural details about the aggregates. These images are further analyzed to construct the adsorption isotherm of EAK16-II on mica surface and also to quantify the dimensions of the nanostructures. However, both surface tension measurements and AFM observe surface properties only. To complement the AFM and surface tension data, light scattering (LS) measurements are employed to gain information about the aggregation in bulk solution. Based on the proportionality relationship existing between the LS intensity and the particle sizes, the LS intensity reflects the increase in the aggregate size once aggregates form in solution. Furthermore, information about the kinetics of the self-assembly could be obtained by monitoring the LS intensity as a function of time. Through these three approaches, a mechanism can be proposed to describe the aggregation process of EAK16-II.
MATERIALS AND METHODS
Peptide solution preparation
The peptide, EAK16-II with the sequence AcN-AEAEAKAKAEAEAKAK-CNH2 and a molecular weight of 1656.79, was purchased from Research Genetics (Huntsville, AL). For AFM and surface tension measurements, the peptide solutions were prepared by dissolving in pure water (Millipore, 18.2 Ω) at concentrations ranging from 0.005 mg/ml to 5.0 mg/ml. Very low EAK16-II concentrations (<0.05 mg/ml) were obtained by diluting the stock solution (0.05 mg/ml) using a 10–100 μl micropipette. The measurements were performed 1 day after the sample preparation. For the LS measurements, the EAK16-II solutions with concentrations varying from 0.1 mg/ml to 0.2 mg/ml were prepared by diluting from 0.3 mg/ml stock solution. The solutions with concentrations ranging from 0.013 mg/ml to 0.05 mg/ml were diluted from 0.08 mg/ml solution. The samples were divided into sets of four concentrations each for experimental convenience. Each set of samples (four concentrations) required 30 min to prepare. The solutions were stored in 20-ml vials after each test. The time-dependent LS experiments were performed less than 30 min after the solution was prepared. All experiments were conducted at room temperature.
Surface tension measurement
Axisymmetric drop shape analysis-profile was used to study the dynamic surface tension of EAK16-II solutions. For a dynamic process, the surface tension varies as a function of time. For a typical surfactant, the surface tension decreases with time before reaching an equilibrium value. The experimental setup has been described in an earlier publication (Chen et al., 1996). The EAK16-II solution was released at a speed of 0.04 ml/s for 5 s using a 1-ml motor-driven syringe to form a pendent drop at the tip of the syringe needle (inner diameter, 0.92 mm). The surface tension was measured for 1 h for every sample. The experimental sample chamber was saturated with pure water vapor to keep a consistent humid environment. For each run, images were acquired at 0.5-s intervals for the first 60 s, then at 20-s intervals for the remaining time. Images were magnified by an optical microscope, and then captured by a CCD camera before being transferred to the computer. All images were digitized and analyzed to extract the drop profile. The surface tension was obtained as a fitting parameter when the experimental drop profile was fitted to the theoretical curve governed by the Laplace equation of capillarity (Rotenberg et al., 1983). The standard deviation of all results is less than 0.2 mJ/m2.
Atomic force microscopy
The nanostructure of the aggregates was investigated by an atomic force microscope (PicoScan, Molecular Imaging, Phoenix, AZ). To prepare the AFM samples, 50 μl EAK16-II solution was put on a mica surface, which was affixed to a multiple use AFM sample plate. The sample was left for 30 min to let the peptide adhere to the mica surface. It was, then, washed twice with 50 μl water. The sample plate was covered by a petri dish to avoid any possible contamination and was left for 1–2 h to dry out completely. Silicon crystal tips (type NCL-16, Molecular Imaging) with a spring constant of 31–71 N/m and a radius of curvature of 10 nm were used for AFM tapping mode (acoustic mode) imaging. The AFM tip resonance frequency for imaging was between 160 and 180 kHz. Images were scanned and collected at 6 × 6 μm2, 3 × 3 μm2, and 1.2 × 1.2 μm2 scales for each sample. To show the details of the nanostructure, only the images at the 1.2 × 1.2 μm2 scale were given in the Results section. Images at the 3 × 3 μm2 scale were used for surface coverage analysis while the dimensions of the nanostructures were measured from those obtained at the 1.2 × 1.2 μm2 scale.
To obtain the surface coverage of the EAK16-II aggregates, an image analysis program (Scion Image, Scion corporation, Frederick, MD) was used. A relatively flat surface was obtained from the AFM images collected at the scale of 3 × 3 μm2. For each topographical image, a reasonable threshold was obtained by comparing the threshold image with the original image to preserve most aggregate features from the background. By analyzing these images, the surface area covered by the EAK16-II aggregates was obtained. Since the images only represent a fraction of the whole sample surface, and the fibrils may not be evenly distributed on the mica surface, the surface coverage can be considered as the fibril density within the fibril networks.
It has been found that the tip size of a cantilever will affect the determination of the real size of objects probed by AFM (Forbes et al., 2001; Vesenka et al., 1992; Markiewicz and Goh, 1994). The height measured by our AFM is relatively accurate as calibrated with a lipid bilayer (egg phosphatidylcholine), but the width is a convolution of the actual size of the objects and that of the tip; That is, the true width is related to the tip size and the shape of the object. To correct the distortion induced by the finite tip size, Vesenka et al. (1992) derived an equation to predict the diameter by assuming the particle under observation to be spherical. The observed width, W, is approximately equal to  where Rm and Rc are the radius of the particles measured by AFM and the radius of curvature of the tip, respectively.
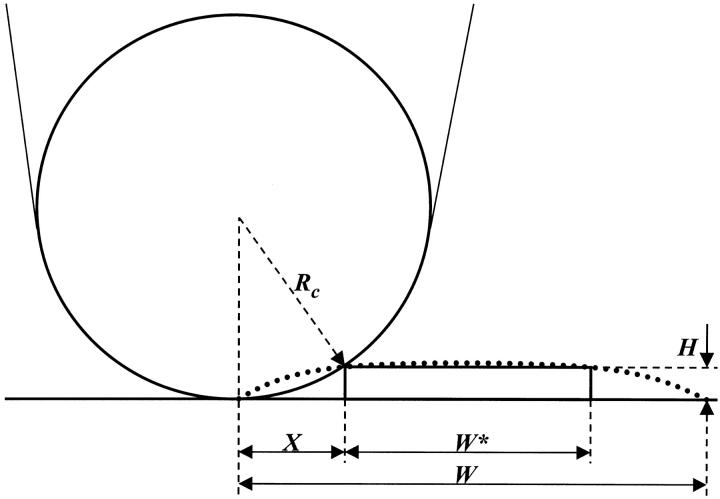
This equation does not apply to our system because the EAK16-II fibrils are not spherical. In fact, the height of EAK16-II fibrils is 20 times smaller than their width. To correct the fibril width measured by AFM, a new equation has been derived for a sheetlike structure with a height H and a width W* shown in Fig. 2. The actual fibril width W* can be calculated by the equation,  where W is the observed fibril width from AFM. For EAK16-II fibrils (H = 0.5–5 nm) and silicone crystal tips (Rc = 10 nm) used in the AFM work, the actual fibril width W* is ∼15–30% less than the observed fibril width W. All fibril widths discussed in this article have been corrected by this method.
FIGURE 2.
A schematic diagram for derivation of the equation to correct the fibril width. The wide dotted line represents the directly observed image profile from AFM with a width of W. W* is the actual width of the fibril. The actual fibril width can be derived as W* = W − 2X, where  H and Rc are the fibril height and the radius of curvature of the AFM probe tip, respectively. For EAK16-II fibrils and silicone crystal tips (Rc = 10 nm) used in the work, the actual width, W*, is 15%–30% less than the observed width, W.
Light scattering
The light scattering experiments were carried out on a steady state fluorescence system (type LS-100, Photon Technology International (PTI), London, ON, Canada) with a pulsed xenon flash lamp as the light source. The light scattering peak arose from the interaction of the EAK16-II aggregates and the incoming excitation light. The samples were irradiated at 314 nm, and the scattered light was monitored from 295 nm to 330 nm. The excitation and emission slit widths of the monochromators, which control the amount of light coming in and out of the sample chamber, were set at ½ and 2 turns to yield a spectral resolution of 1 nm and 4 nm, respectively. The EAK16-II solution was transferred from the vial into a square cell by a glass pipette for each test. The lamp intensity of the fluorometer was monitored for each sample. Each scattering intensity was divided by the lamp intensity to account for eventual lamp fluctuations. All samples were tested in 1-h intervals initially, and then once a day or once every two days over a period of 3 weeks. The experimental LS data profiles were fitted with two exponential functions. The parameters of these functions were obtained by optimizing the fits with the Marquardt-Levenberg algorithm (Press et al., 1992).
The LS intensity is expected to increase with the dimension of particles present in solutions. The sensitivity of LS to particle size was confirmed by monitoring the LS intensity of latex particles with varying diameters. Latex particles (polystyrene carboxylate-modified beads) with diameters of 0.4 μm and 0.9 μm were purchased from Aldrich (Oakville, ON, Canada). Solutions of 0.4 μm and 0.9 μm diameter latex particles were prepared in pure water (Milli-Q, 18.6Ω) with concentration ranging from 0.002 mg/ml to 0.5 mg/ml. The LS signal was monitored as a function of concentration for both latex particles. For a given concentration in mg/ml, the solution with larger particles always gives the larger LS intensity. Thus, the LS data obtained with the PTI spectrofluorometer yields qualitative information about the size of particles present in solution.
RESULTS
Surface tension measurements
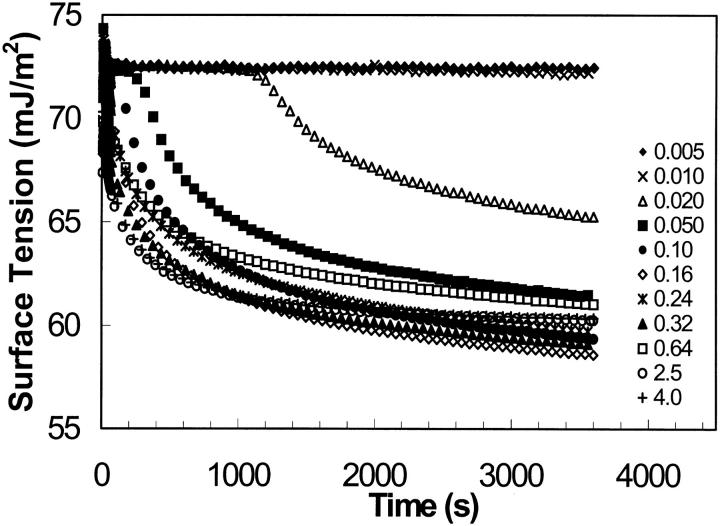
The dynamic surface tension is plotted as a function of time for each concentration in Fig. 3. At the extremely low concentrations of EAK16-II (0.005 and 0.01 mg/ml), the surface tension does not change with time; the surface tension value is 72.6 mJ/m2, which is similar to the surface tension of pure water at 21.5°C (72.75 mJ/m2) (Adamson and Gast, 1997). At high concentrations of EAK16-II (>0.1 mg/ml), the surface tension decreases exponentially with time; the surface tension drops fast at early times (0–200 s), then slowly approaches an equilibrium. For the concentrations between 0.01 mg/ml and 0.1 mg/ml, the dynamic surface tension profiles exhibit an induction period followed by an exponential drop.
FIGURE 3.
Dynamic surface tension of EAK16-II solutions. The concentrations are ranging from 0.005 to 4.0 mg/ml. The errors of all data points are within a standard deviation of ±0.3 mJ/m2.
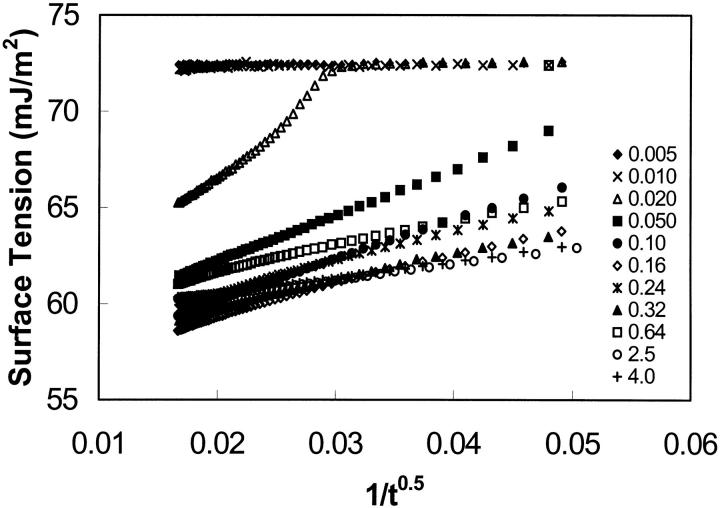
To obtain the equilibrium surface tension from the dynamic surface tension data, three methods have been employed. The first one is the “end points” or “last measurements” method (Chen et al., 1996). The equilibrium surface tension is calculated by averaging a certain number of data points collected at the end of each run (10 points were used in this study). The second method is referred to as the “slope method” (Chen et al., 1996; Cabrerizo-Vilchez et al., 1995). For each concentration, the dynamic surface tension data are simply fitted by a logarithmic function. The fits yielded R-square values which are above 0.987 for all surface tension profiles. The derivative of the fitted function gives the instantaneous slope for each experimental point on the curve. Among the minimum slopes obtained for each concentration, the largest value, Smax, is identified and chosen as the cutoff value for all concentrations. For each concentration, the surface tension is determined at the point having a slope equal to Smax. This surface tension is regarded as the equilibrium surface tension of the solution. Smax has been found to be 0.0012 mJ/m2s in this study. The third method to determine an equilibrium surface tension is the “extrapolation” method (Cabrerizo-Vilchez et al., 1995). For each concentration, the surface tension is plotted versus 1/t0.5. The equilibrium surface tension is estimated by a linear extrapolation of 1/t0.5 to the y axis. This plot is based on the assumption that the surface adsorption process occurs according to a diffusion-controlled mechanism (Cabrerizo-Vilchez et al., 1995; Makievski et al., 1997). Fig. 4 shows the surface tension versus 1/t0.5 for all EAK16-II concentrations. A portion of the data (1/t0.5 < 0.05) is fitted to a straight line using linear regression, and the intercept at the y axis (i.e., t = ∞) is an estimate of the equilibrium surface tension.
FIGURE 4.
Surface tension versus 1/t0.5 for different concentrations of EAK16-II (0.005–4.0 mg/ml); 1/t0.5 ≤ 0.05s−0.5. The errors of all data points are within a standard deviation of ±0.3 mJ/m2. The equilibrium surface tension was estimated by a linear extrapolation to the y axis.
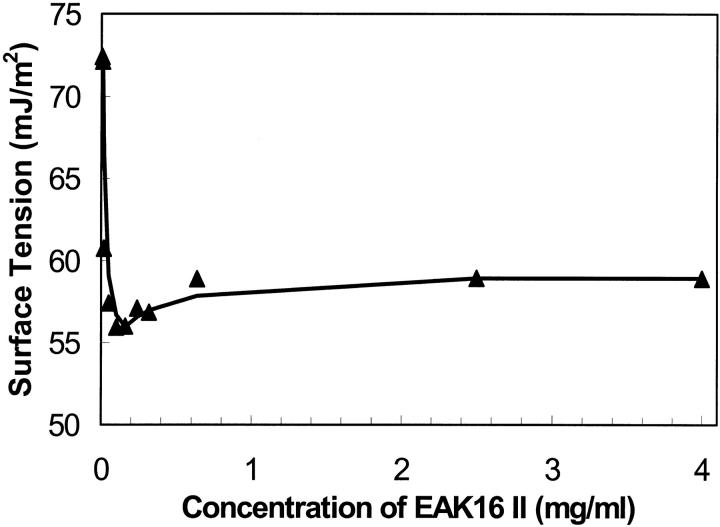
The equilibrium surface tensions obtained by the extrapolation method were plotted with the concentration of EAK16-II in Fig. 5. The profile yields an equilibrium surface tension around 72.4 ± 0.17 mJ/m2 at very low EAK16-II concentrations. This value is close to the pure water surface tension. When the concentration increases, the surface tension drops dramatically down to a minimum of 56.0 ± 0.14 mJ/m2 for an EAK16-II concentration of 0.16 mg/ml. Then the surface tension increases slightly back to 58.9 ± 0.12 mJ/m2 at high concentrations. The small dip of the curve is due to a minute amount of impurities present in the peptide. It has been reported that depending on their surface activity, impurities may cause either a minimum or a higher break point in the surface tension versus peptide concentration plot (Clint, 1992). The equilibrium surface tension generated from the slope and the end points methods give similar profiles (data not shown) to that of the extrapolation method. The concentration of 0.1 mg/ml (6.04 × 10⁻⁵ M) before the small dip may be regarded as the critical aggregation concentration of EAK16-II.
FIGURE 5.
Relationship between the equilibrium surface tension and concentration of EAK16-II in water solutions. When the concentration increases, the surface tension drops dramatically down to a minimum value, then it increases slightly back to a plateau. The critical aggregation concentration is found to be around 0.1 mg/ml. All data errors are within the range of ±0.18 mJ/m2.
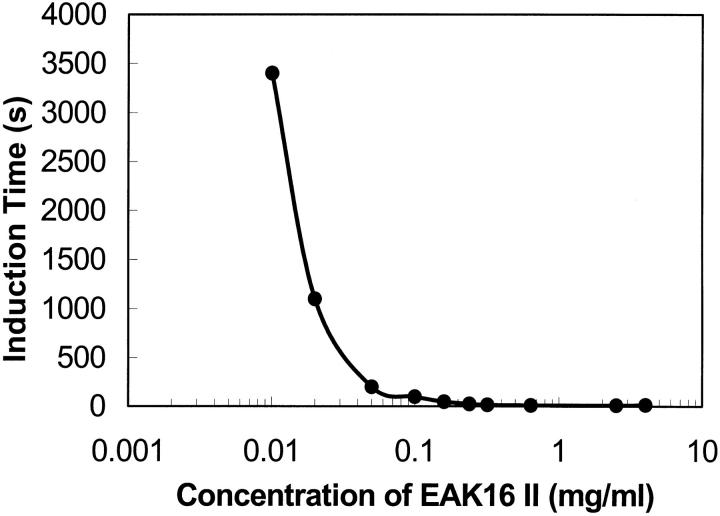
For surface active biomolecules, an induction time usually occurs in dynamic surface tension measurements. The surface tension changes significantly, say 5%, only after this induction period. This is because a certain number of molecules are needed to adsorb at the surface to affect the surface tension. The induction time is also related to the size and the amphiphilicity of the particles in solution (see the Discussion section). Fig. 3 shows that EAK16-II, a surface active oligopeptide, has an induction time when the concentration is low enough. The induction time, at which the surface tension decreased by 5%, was plotted as a function of concentration in Fig. 6. At the concentration of 0.005 mg/ml, the induction time was too large to be recorded during the experimental period. As the concentration increases, the induction time decreases. No induction time could be observed for EAK16-II concentrations larger than 0.1 mg/ml, which may imply that 0.1 mg/ml represents a critical concentration for the aggregation process.
FIGURE 6.
Induction time with selected concentrations of EAK16-II. The induction time is observed as a period before the surface tension starts to drop in dynamic surface tension measurements. It exists in most biomolecular systems. The induction time is close to zero after the concentration of 0.05 mg/ml. The data errors range from ±1.5 to ±100 s.
AFM images of aggregate nanostructures
The AFM images with a scale of 1.2 × 1.2 μm2 (Fig. 7) show the dried EAK16-II aggregates. Fibrils (Fig. 7, A–C) are found in solutions with 0.1, 0.2, and 0.5 mg/ml concentrations while isolated filaments (Fig. 7 D) are found in the solution with a 0.05 mg/ml concentration. The globular aggregates, observed at all concentrations, are randomly dispersed in the 0.05 mg/ml solution, while they seem to line up and form into elongated fibrils at the higher concentrations (0.1, 0.2, and 0.5 mg/ml). The number of observed nanostructures (i.e., fibrils, filaments, and globular aggregates) reduces when the concentration is below 0.1 mg/ml. In addition, the fibril width changes with the concentration as well. Table 1 lists the size of nanostructures of EAK16-II observed by AFM. The fibril width decreases from 73.5 ± 8.7 nm at a concentration of 0.5 mg/ml to 34.1 ± 6.8 nm at 0.05 mg/ml. Similarly, the fibril height also decreases with concentration from 3.72 ± 0.59 nm to 0.41 ± 0.09 nm. However, the diameter of the globular aggregates decreases as the concentration increases; the height of the globular aggregates is around 1 nm. The diameter and the height of the globular aggregates are not available at concentrations above 0.1 mg/ml since no individual globular aggregate could be observed.
FIGURE 7.
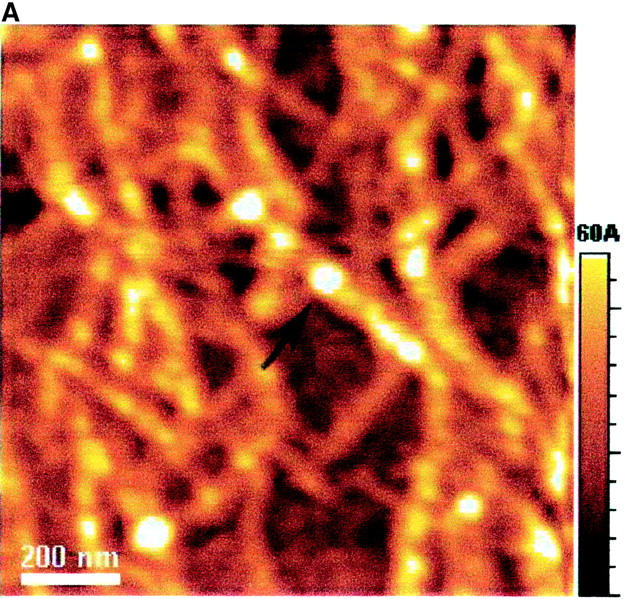
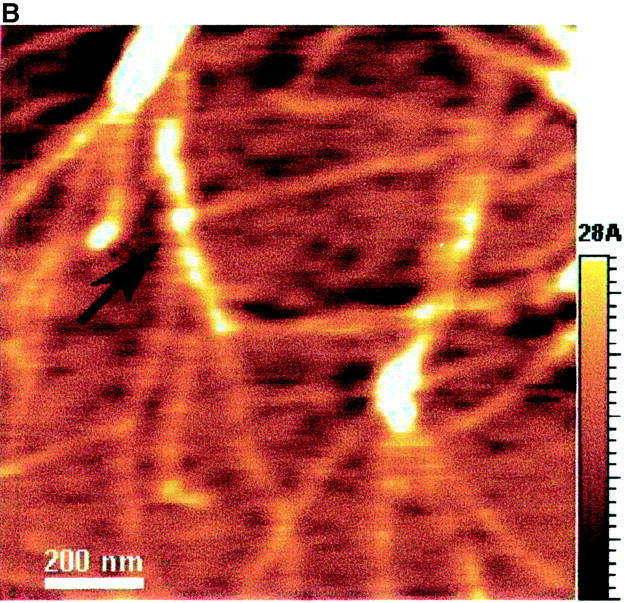
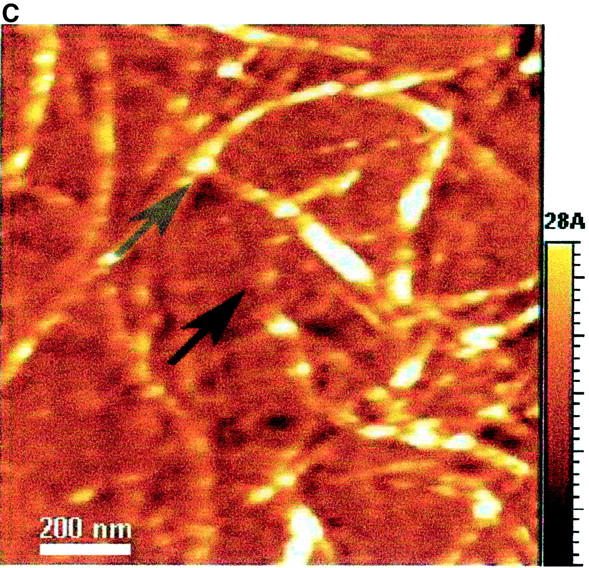
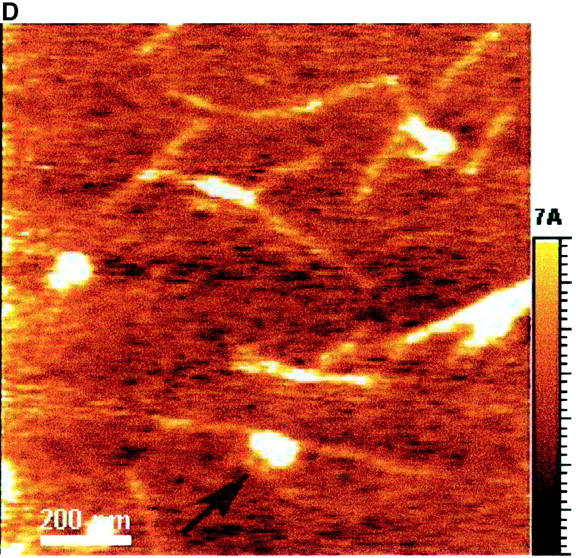
AFM images of EAK16-II on mica with different concentrations: (A) 0.5 mg/ml; (B) 0.2 mg/ml; (C) 0.1 mg/ml; (D) 0.05 mg/ml. The size and the density of fibrils reduce as the concentration decreases. The fibril width of each concentration is 73.5 ± 8.67, 53.9 ± 5.87, 46.8 ± 14.2, and 34.1 ± 6.81 nm in A, B, C, and D, respectively. Two types of nanostructures, globular aggregates and filaments, are found at the concentration of 0.05 mg/ml. They are considered as protofibrils which can further aggregate into fibrils. Arrows indicate the globular aggregates within the fibrils or isolated on the surface. The AFM images support our proposed aggregation model of EAK16-II.
TABLE 1.
The dimensions of EAK16-II nanostructures on mica
| Fibril structure | Globular structure | |||
|---|---|---|---|---|
| Concentration of EAK16-II (mg/ml) | Width (nm) | Height (nm) | Diameter (nm) | Height (nm) |
| 0.05 | 34.1 ± 6.81 | 0.41 ± 0.09 | 64.3 ± 11.7 | 0.97 ± 0.22 |
| 0.08 | 38.1 ± 5.31 | 0.88 ± 0.11 | 39.6 ± 7.90 | 1.10 ± 0.33 |
| 0.1 | 46.8 ± 14.2 | 1.63 ± 0.29 | 37.2 ± 7.92 | 0.98 ± 0.18 |
| 0.2 | 53.9 ± 5.87 | 1.61 ± 0.18 | — | — |
| 0.5 | 73.5 ± 8.67 | 3.72 ± 0.59 | — | — |
At low concentrations (<0.1 mg/ml), the fibril structures are thin filaments; at high concentrations (≥0.1 mg/ml), the fibrils are composed of globular aggregates and filaments based on the proposed model. All errors are within the 95% confidence level. Data were corrected for the tip and shape convolutions.
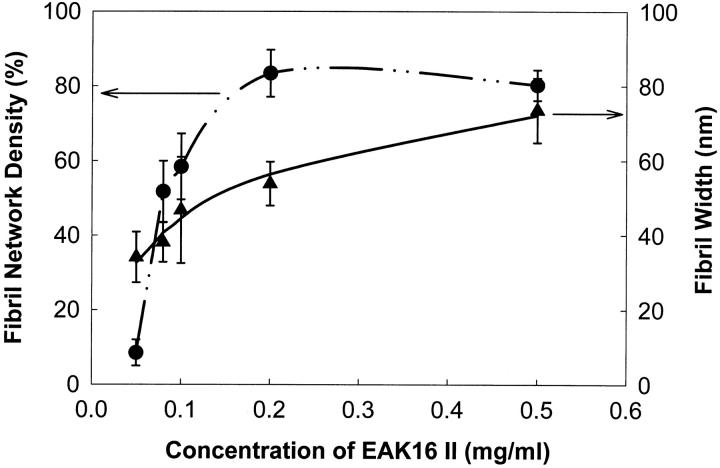
The density of fibril networks and fibril width are plotted as a function of EAK16-II concentration in Fig. 8. The fibril network density shows a sharp increase around the concentration of 0.1 mg/ml, but the fibril width does not. However, the larger error associated with the fibril width for the 0.1 mg/ml sample may imply a transition where individual aggregates associate into a fibril network. It is worth noting that all AFM images were taken in air-dried condition. During the dehydration process, the peptide concentration increases and more aggregates are expected to form.
FIGURE 8.
The density of fibril networks of EAK16-II on mica and the width of EAK16-II fibrils versus concentrations. The value of fibril density increases sharply around 0.1 mg/ml (CAC), but the fibril width increases moderately with concentrations. The large error range of fibril width at 0.1 mg/ml concentration may imply a nucleation process upon the CAC.
Light scattering
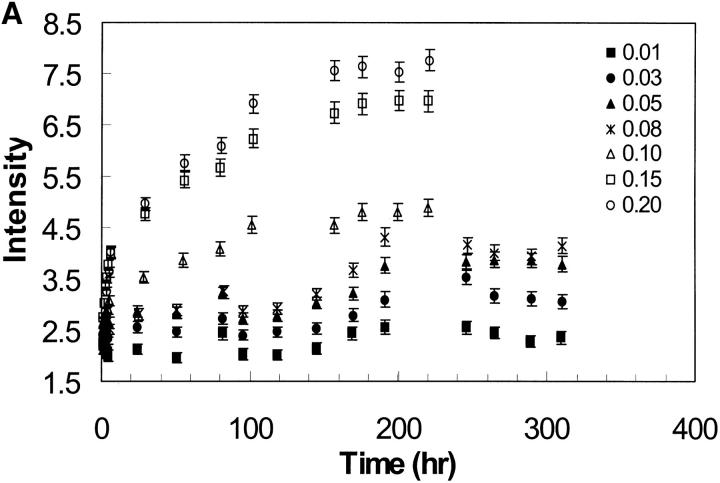
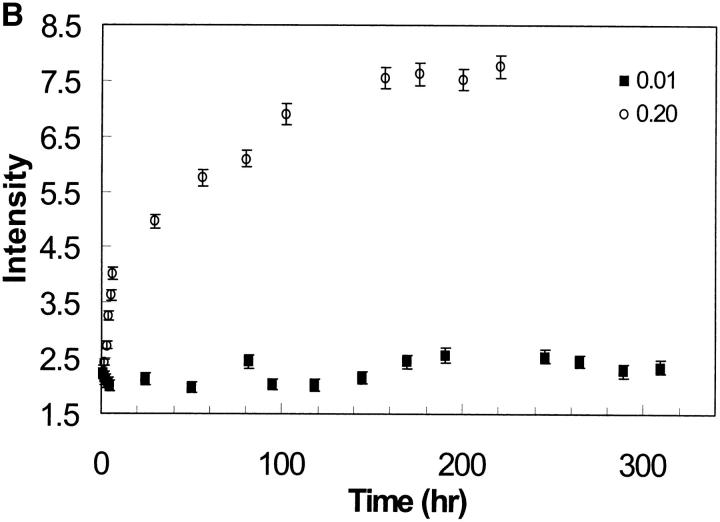
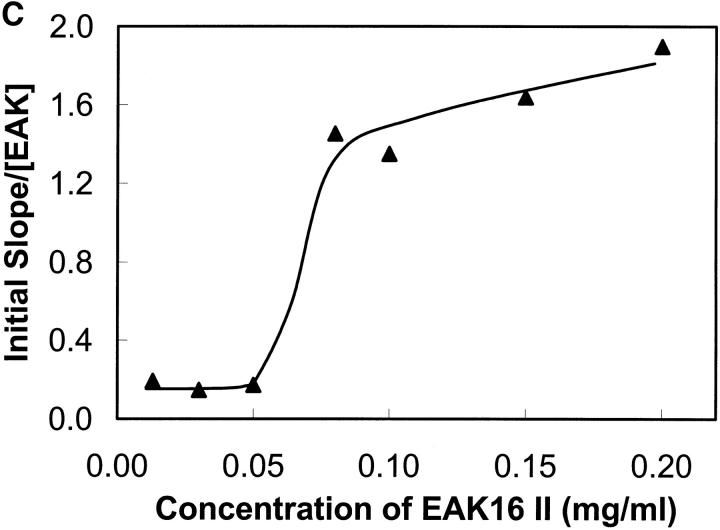
Light scattering intensity is proportional to the size of the particles present in solution. The scattering intensity of the EAK16-II solutions is plotted as a function of time in Fig. 9 A. From this plot, the profiles can be separated into two groups depending on the EAK16-II concentrations. In the high concentration group (0.08–0.2 mg/ml), the LS intensity increases sharply with time within the first 6 h, then slowly approaches a plateau after 160 h. In the low concentration group (0.013–0.05 mg/ml), the LS intensity does not change significantly over the initial time period, although it increases slightly after 200 h. The difference in behavior can be clearly seen in Fig. 9 B. When the concentration is below the CAC, the LS intensity seems to remain the same at the early times. On the other hand, a sharp increase occurs when the concentration reaches or is above the CAC.
FIGURE 9.
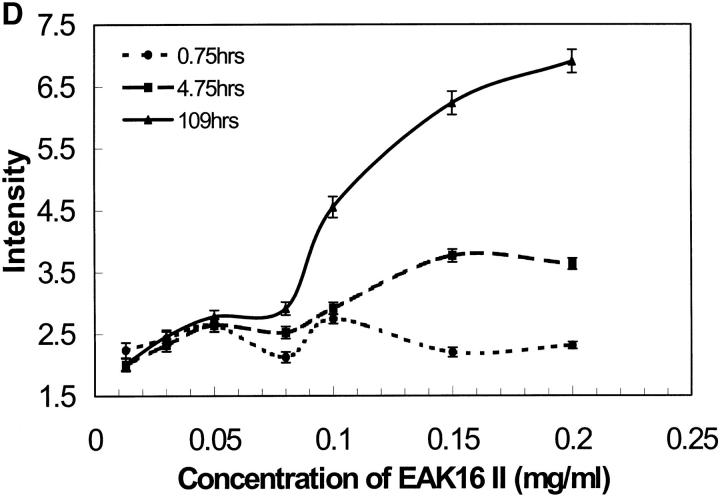
(A) Light scattering of EAK16-II solutions with time in different concentrations from 0.013 to 0.2 mg/ml. The data are separated into two groups according to EAK16-II concentration. In the high concentration group (0.08–0.2 mg/ml), the LS intensity increases dramatically with time within the first 10 h. In the low concentration group (0.013–0.05 mg/ml), the LS intensity does not change much with time. (B) The initial difference of LS intensity upon whether the concentration is above and below the CAC. Above the CAC (full circle), the LS intensity increases fast within the first 6 h. Below the CAC (star), the LS intensity does not change with time. (C) The rate of LS intensity change over the first 6 h (initial slope obtained from Fig. 9 A) as a function of concentration. [EAK] represents the concentration of EAK16-II. The value jumps dramatically from 0.17 to 1.45 around the CAC, which shows two distinguishable groups of data. (D) The intensity of light scattering plotted with concentrations at different timescales (• 0.75 h; ▪ 4.75 h; ▴ 109 h). The LS intensity increases after 5 h when the concentration is above 0.08 mg/ml, which is close to the CAC.
Further evidence is shown in Fig. 9 C by analyzing the rate of intensity change at the early times. LS data points, over the first 6 h, were fitted to a straight line and their slopes were plotted as a function of concentration. The value of the slope changes drastically from 0.17 to 1.45 around 0.08 mg/ml concentration, which indicates the difference of the aggregation behavior according to the CAC. Fig. 9 D shows that the LS intensity increases after 5 h when the concentration is above 0.08 mg/ml, which is close to the CAC determined earlier (0.1 mg/ml). This experiment demonstrates that EAK16-II aggregates in bulk solutions with time, and provides information about the timescale over which the aggregation process occurs.
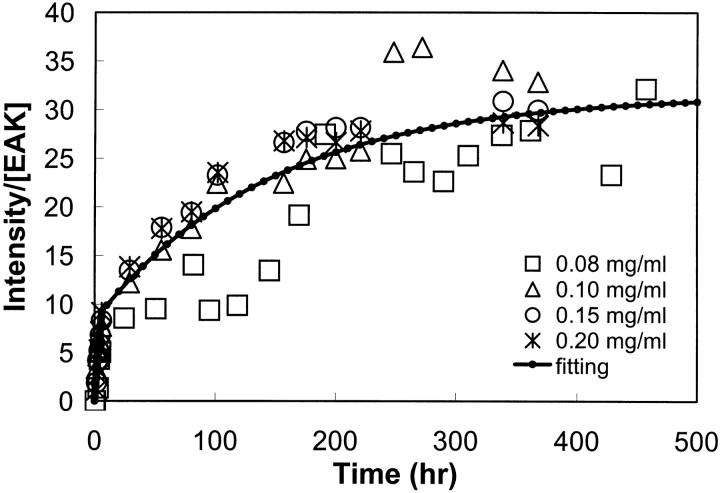
In Fig. 10, the LS data were normalized by dividing the scattering intensity by the EAK16-II concentration. Since little change in LS intensity was observed at low EAK16-II concentrations, only the data with an EAK16-II concentration at and larger than 0.08 mg/ml are presented in Fig. 10. All data were normalized by concentration. They illustrate that the increase in LS with time is bimodal, being rapid at early times and slower at later times. This effect appears to be induced by the shear which occurs as the peptide solution is forced through the Pasteur pipette into the cell. Pipetting the solutions once per hour or day results in different rates of aggregation leading to the bimodal behavior shown in Fig. 10. Consequently, the scattering profiles were fitted with two exponentials to generate a kinetic model of the aggregation process. The shear-induced association of EAK16-II is not an isolated case since a similar effect has been reported for other proteins (Lougheed et al., 1980).
FIGURE 10.
Light scattering corrected by bulk EAK16-II concentration versus time. EAK16-II concentrations range from 0.08 to 0.2 mg/ml. The data were fitted to a bimodal kinetic model of aggregation of EAK16-II (solid line). The data was normalized by EAK16-II concentration ([EAK]).
DISCUSSION
Concentration effect on aggregation of EAK16-II
Concentration is a key parameter for characterizing self-assembly systems. Micellization, a well-known self-association process, occurs only when the concentration of surfactants is larger than the critical micelle concentration (CMC). By analogy, biomaterials like proteins and self-assembling oligopeptides may have a critical aggregation concentration based on their amphiphilic structures. These amphiphilic biomolecules may aggregate once the concentration is above the CAC.
The EAK16-II molecule, shown in Fig. 1, contains one hydrophobic side with alanine residues and one hydrophilic side with glutamic acid and lysine residues. It forms stable β-sheets spontaneously in aqueous solution mainly through hydrogen bonding; both the electrostatic forces of the charged residues and the hydrophobic interactions of the alanines contribute to further aggregation (Zhang et al., 1993, 1994; Zhang and Altman, 1999; Altman et al., 2000). This unique amphiphilic structure of EAK16-II is quite different from that of a normal surfactant, which contains a hydrophobic tail and a hydrophilic head. This is certainly the reason why EAK16-II aggregates into fibrils rather than forming micelles in solution.
Surface tension measurements lead to the conclusion that EAK16-II has a CAC around 0.1 mg/ml (6.04 × 10⁻⁵ M). Although this value is much lower than the CMC of most commercial surfactants (∼10−3–10−2 M) (Reif et al., 2001; Myers, 1992), it compares well with the CMC value reported for other biosurfactants, which range from 0.001–2 mg/ml (Mulligan and Gibbs, 1993). For example, both bovine serum albumin (BSA) and human serum albumin (HSA) have been found to have a CAC value around 0.05 mg/ml (∼7 × 10⁻⁷ M) (Chen et al., 1996; Makievski et al., 1998; Fainerman et al., 1998). Interestingly, Alzheimer's Aβ, another self-assembling polypeptide, also has a CAC of ∼2.5 × 10⁻⁵ M (Soreghan et al., 1994), although a later report shows a CAC of Aβ around 1.0 × 10⁻⁵ M at low pH (Lomakin et al., 1996). Therefore, it is possible to have a CAC in the range of 10−5 M for oligopeptides.
The aggregation of EAK16-II is confirmed when aggregates are visualized by AFM on a mica surface. The AFM images show three types of nanostructures, which are the globular aggregates, the fibrils, and the filaments. Fibrils are found when the concentration is above 0.1 mg/ml (Fig. 7, A–C). At a concentration of 0.05 mg/ml, isolated globular aggregates and filaments are observed (Fig. 7 D). The existence of aggregates at this concentration appears to be contradictory to the micellization theory. However, two reasons can account for this: The first is the dehydration process. Since the AFM samples are prepared by drying the solutions on the mica surface, the bulk concentration will increase significantly and may exceed the CAC near the end of the drying process, which induces the association. Second, the impurities in the solution may function as seeds, which can initiate the nucleation process for further aggregation (see below).
The LS experiments also show that EAK16-II aggregates at low concentrations (Fig. 9 A). The LS intensity of low concentration samples (0.03 and 0.05 mg/ml) increases slightly with time. After 150 h (∼6 days), the LS signal becomes significantly higher than the initial value. This is evidence that aggregation occurs over time at concentrations below the estimated CAC of 0.1 mg/ml.
Although both AFM images and LS data show that aggregation of EAK16-II happens at all concentrations, the aggregation rate depends strongly on the CAC. Fig. 9 C shows that the rate of LS intensity change, which can be related to the aggregation rate, is very different for the concentration below and above the CAC. Fig. 9 D indicates that EAK16-II aggregates much faster at concentrations above the CAC. The two extreme aggregation rates may indicate that EAK16-II associates via two different pathways.
Concentration affects both the size and shape of the nanostructures of EAK16-II. By AFM, three types of nanostructures were observed. They are the globular aggregates, the filaments and the fibrils shown in Fig. 7. When the concentration is below the CAC, both globular aggregates and thin filaments exist (Fig. 7 D). The height and width of the filaments are ∼0.4 nm and 35 nm, respectively, whereas the height and diameter of the globular aggregates are twice as large (see Table 1). The size of the nanostructures can be related to that of one EAK16-II molecule. According to the structure presented in Fig. 1, the backbone stretches over 6.5 nm and the width ranges from 0.3 to 0.7 nm (estimated by ACD/3D freeware). Comparing the height of EAK16-II aggregates with that of one EAK16-II molecule, the filaments are monolayers of β-sheets, but the globular aggregates are made of at least 2 layers of β-sheets.
At the concentration above the CAC, EAK16-II forms fibrils. These fibrils are made of many globular aggregates (protofibrils) lining up and stacking together (Fig. 7 A). The dimensions of the fibrils are ∼70 nm in width and 3.7 nm in height, which are quite different from the filaments observed at low concentrations. However, it is very interesting that the diameter of the globular aggregates at a concentration of 0.05 mg/ml is comparable to the width of the fibrils at 0.5 mg/ml, although those fibrils are 3.5 × taller than the globular aggregates. From the images, no filaments are observed at high concentrations (≥0.1 mg/ml).
Both fibrils and individual small globular aggregates are found at concentrations around the CAC (Fig. 7 C). The globular aggregates at this concentration (∼0.1 mg/ml) are around 1 nm in height and 35 nm in diameter, which is half the diameter at 0.05 mg/ml. Table 1 also shows that the diameter of globular aggregates decreases to the smallest value at 0.1 mg/ml. Therefore, within the concentration range where isolated globular aggregates can be observed, a minimum diameter exists at the concentration close to the CAC.
The observation of the smallest diameter of the globular aggregates at 0.1 mg/ml concentration could be rationalized by a nucleation process, in which the size of the aggregates will depend on the number of nuclei formed. At the low concentration regime (0.05 mg/ml), few nuclei are formed for EAK16-II molecules to associate leading to the formation of fewer but larger globular aggregates. When the concentration reaches the CAC, many nuclei appear immediately, which generates more but smaller globular aggregates as seen in Fig. 7 C. The formation of fibrils by other self-assembling molecules (i.e., Aβ) has also been described in terms of a similar nucleation process (Lomakin et al., 1996).
The nuclei formation is expected to depend on concentration. At concentrations above the CAC, nuclei are generated by the self-association of EAK16-II molecules. Below the CAC, impurities in solution may function as seeds (or nuclei) for the nucleation process. The presence of impurities is confirmed by the small depression observed by the surface tension measurements and shown in Fig. 5. The minute amount of impurities in solution allow EAK16-II molecules to self-assemble at concentrations below the CAC, which agrees with the AFM and LS results.
The aggregation of EAK 16 II behaves differently from the normal surfactant aggregation at concentrations above the CAC because the typical micellization theory cannot explain the increase in aggregate size as a function of concentration. Above the CMC, an increase of the surfactant concentration leads to an increase of the micelle concentration, not its size and shape, which only depend on the packing parameter of the surfactants (Clint, 1992). Similar results have been reported for the formation of Aβ fibrils, where an independent relationship has been established between the fibril width and Aβ concentration above the CMC (Lomakin et al., 1996). Above the CAC, however, an increase of the EAK16-II concentration results in the formation of wider and higher fibrils (Fig. 7 A and Table 1). This shows the unique properties of EAK16-II molecules. Different from surfactants, EAK16-II forms an open structure of aggregates as opposed to an enclosed micelle. Once the nuclei of the aggregates are formed, they keep growing via addition of EAK16-II monomers leading to a continuous increase in the size of protofibrils and fibrils with concentration.
Proposed mechanism for self-assembly
To study the mechanism of self-assembly, Zhang and Altman (1999) hypothesized a simple model to describe the aggregation process of self-assembling oligopeptides. Initially, the individual peptides arrange themselves into β-sheets; then the β-sheets aggregate into filaments and further into membranes. However, no direct evidence supports this proposed model.
Based on our results, an aggregation model of EAK16-II can be proposed. EAK16-II molecules aggregate to form fibrils in two stages. First, EAK16-II monomers self-associate into protofibrils via a nucleation and/or seeding process depending on the solution concentration. Below the CAC, the nuclei are formed only from the seeds (impurities) present in minute amounts in the solution; above the CAC, EAK16-II self-assembles to form nuclei, which initiate further the aggregation of the protofibrils. The protofibrils can adopt two different nanostructures, i.e., the globular aggregates and the filaments. Both structures are composed of β-sheets, which are held together mainly by hydrogen bonding. The second step involves the interaction of the protofibrils with each other to form fibrils. One hypothetical pathway for fibril formation would have globular aggregates lining up along the filaments. At this stage of our study, it is still unclear why EAK16-II forms either globular aggregates or filaments. Certainly, pH and amino acid sequence will affect the ability of EAK16 to form either globular aggregates or filaments (unpublished data).
The height of the aggregates reported in Table 1 provides some information about the association of protofibrils into fibrils. In the 0.1-mg/ml solution, the fibril height was observed to be ∼1.6 nm. This value matches the sum of the heights of one globular aggregate and one filament (1 nm and 0.4 nm, respectively), which supports the assumption that the globular aggregates line up along the filaments. It also indicates that the fibril contains three layers of β-sheets since one β-sheet layer is ∼0.5 nm in height. However, at 0.5-mg/ml concentration, the fibril height increases to ∼3.7 nm, which is 7 times the height of a β-sheet monolayer. This implies that the globular aggregates can possibly stack one on top of another to form higher fibrils at high concentrations.
Lomakin et al. (1996, 1997) proposed a model to describe the aggregation mechanism of Aβ in a similar self-assembly system. In their model, the fibrillogenesis starts with the presence of nuclei in solution, which are generated by either seeding or micellization depending upon the concentrations of Aβ. The nuclei provide a core for Aβ molecules to rearrange themselves into fibrils. The fibril elongation occurs by irreversible binding of Aβ monomers to the fibril ends. The derivation of association kinetics is based on whether the bulk concentration of Aβ is above or below a critical concentration (CMC).
The Lomakin et al. model was supported by LS measurements. Their data show two different types of LS intensity versus time profiles depending on whether the Aβ concentration is above or below the CMC. Above the CMC, all LS intensity profiles can be normalized and fall on a master curve. Below the CMC, the LS intensity increases with time at a rate that decreases with concentration. This behavior observed for Aβ is very similar to that of EAK16-II reported in Fig. 10. The similarities exhibited by these two association processes bear the promise that simple oligopeptides like EAK16-II can be used as a model system to study how proteins be responsible for neurological disorders (e.g., Alzheimer's disease) self-assemble.
Kinetics of aggregation
Based on the time-dependent light scattering experiments, the LS data shown in Fig. 10 were fitted with a biexponential function given in Eqs. 1a and 1b, to describe the bimodal profile of LS intensity versus time for EAK16-II concentrations ranging from 0.08 mg/ml to 0.2 mg/ml:
 |
(1a) |
 |
(1b) |
The instant t0 (=6 h) represents the time when the time interval between two LS measurements was switched from 1 h to 24 h. At time t smaller than t0, the data were fitted with Eq. 1a, while Eq. 1b was used for the data at time t larger than t0. The parameters kf and ks represent the rate constants of aggregation at times smaller or larger than t0, respectively. In Eqs. 1a and 1b, the LS intensity is normalized by the peptide concentration to account for the trends shown in Fig. 10 where the ratio I(t)/[EAK]0 is found to be independent of peptide concentration. The parameters in Eq. 1, a and b, were optimized using the Marquardt-Levenberg algorithm (Press et al., 1992). The fit was good, indicating that Eqs. 1a and 1b, represents the data satisfyingly. The rate constants kf and ks were found to equal 0.058 ± 0.006 h−1 and 0.0068 ± 0.0004 h−1, respectively.
The occurrence of the two different rate constants for the aggregation of EAK16-II as shown in Fig. 9 A and Fig. 10 may be the result of the shear effect. The application of shear or agitation has been reported to induce aggregation in blood and latex solutions (Lougheed et al., 1980; Jen and Mclntire, 1984; Le Berre et al., 1998; Serra et al., 1997). It is because agitating the solutions provides energy, which increases the activity of molecules in a process of aggregation. Moreover, shearing can also align long chain molecules such as polymers, promoting their ability to interact with each other. In each LS measurement, the sample was subject to shear on two occasions, first when it was pipetted out of the stock solution into the cell and a second time during the reverse process. Besides, the solutions were sheared more at the beginning of the experiment (once per hour) than at the end (once per day), which resulted in a rate of increase in I(t)[EAK]0 10 times larger initially.
Our preliminary experiments about shear effect indicate that the amount of shearing applied to the solutions affects the LS intensity versus time profiles. This may explain why the cutoff concentration, above which the LS intensity increases significantly with time, was found to be 0.08 gm/ml in Fig. 9, C and D, and Fig. 10, not the CAC, which was determined to be 0.1 mg/ml by surface tension experiments. However, with the same amount of shear applied to all solutions in this study, the concentration effect on the aggregation process is still significant (Fig. 9, B and C).
Induction time
When the concentration of peptide is sufficiently low, the surface tension does not change within an initial time period, which is referred to as the induction time. This phenomenon exists in most biomolecular systems, and many mechanisms have been proposed to explain it. Miller et al. (2001) proposed a theory for the kinetics of globular protein adsorption based on a diffusion model. In this theory, the induction time represents the time required for the surface monolayer to attain a certain minimum coverage, above which the surface tension is reduced. Another group explained the existence of an induction time by the phase change theory (Erickson et al., 2000). The phase transition is a first-order phase change from a surface gaseous to a liquid-expanded state which occurs as the proteins gradually adsorb at the surface. The surface tension remains constant while the surface is in the gaseous state, but decreases when the surface is in the liquid-expanded state, yielding an induction period. Similarly, Ybert and di Meglio (1998) hypothesized that during the induction time, the protein is adsorbed in a surface gaseous state, so that the surface pressure changes only slightly as the surface coverage increases.
In earlier studies carried out with BSA solutions, MacRitchie and Alexander (1963) proposed that the induction period represents a diffusion-controlled adsorption time. This period ends when the interface is covered with a certain number of proteins. This adsorbed protein monolayer creates an energy barrier for further adsorption. The surface pressure increases only after this certain coverage is reached. On the other hand, Van der Vegt et al. (1996) proposed that the proteins do not change the surface pressure until they have changed their conformations, and a mechanism similar to that was suggested by Graham and Phillips (1979).
Our surface tension experiments show that the induction time decreases with the increase of EAK16-II concentration, and the induction time disappears only at concentrations above the CAC (Fig. 6). This could be explained by considering both the diffusion-controlled mechanism and the molecular self-rearrangement. For one molecule adsorbing onto the surface, the molecule has to first diffuse from the bulk to the surface then rearrange itself at the surface, which leads to the decrease of surface tension. Based on the diffusion-controlled theory, the bulk concentration is the main driving force for molecules to diffuse onto the surface. Therefore, more EAK16-II molecules adsorb onto the surface as the bulk concentration increases, resulting in an inverse change relationship between the induction time and the bulk concentration shown in Fig. 6. On the other hand, EAK16-II monomers may rearrange themselves at the surface via intermolecular interactions, which could lead to the formation of β-sheet monolayers. This formation provides a better surface coverage, and hence changes the surface tension significantly. When the concentration is above the CAC, EAK16-II monomers can first self-organize to form β-sheets in the bulk (nucleation process) then diffuse onto the surface. This mechanism is opposed to the adsorption of individual molecule onto the surface at concentrations below the CAC. The adsorption of β-sheet monolayers could reduce the time needed for further rearranging molecules to obtain a better coverage of the surface, leading to an immediate effect on the surface tension. This also implies that the molecular self-association occurring in the bulk facilitates the surface adsorption process.
CONCLUSIONS
An aggregation mechanism of a self-assembling oligopeptide, EAK16-II, has been proposed based on the results obtained with three different experimental techniques. EAK16-II molecules self-assemble into protofibrils through two pathways, namely seeding and nucleation, depending on whether the concentration is below or above the CAC. The CAC of EAK16-II has been found to be around 0.1 mg/ml. Two nanostructures of protofibrils, the globular aggregates and the filaments, have been observed. Over time, these protofibrils further aggregate into fibrils. The time-dependent association process of EAK16-II was demonstrated by monitoring the LS intensity of EAK16-II solutions as a function of time. For concentrations above 0.08 mg/ml, the LS intensity increases with time significantly. This increase is bimodal possibly due to a change in the amount of shear applied to the sample.
Acknowledgments
We are grateful to Tim Benmmann for conducting preliminary fluorescence experiments. We also acknowledge the help of Jeremy A. Bezaire, Sukhdeep Dhadwar, and Yooseong Hong during this study. Last, we thank Shuguang Zhang of MIT for providing information regarding these self-assembling oligopeptides.
This research was financially supported by the Natural Science and Engineering Research Council of Canada (NSERC), and the Canadian Foundation for Innovation (CFI).
References
- Adamson, A. W., and A. P. Gast. 1997. Physical Chemistry of Surfaces, 6th ed. John Wiley & Sons, New York.
- Altman, M., P. Lee, A. Rich, and S. Zhang. 2000. Conformational behavior of ionic self-complementary peptides. Protein Sci. 9:1095–1105. [DOI] [PMC free article] [PubMed] [Google Scholar]
- Cabrerizo-Vilchez, M. A., Z. Policova, D. Y. Kwok, P. Chen, and A. W. Neumann. 1995. The temperature dependence of the interfacial tension of aqueous human albumin solution/decane. Colloids Surf. B Biointerfaces. 5:1–9. [Google Scholar]
- Campbell, N. A. 1993. Biology, 3rd ed. Benjamin/Cummings Publishing Company, Inc., Redwood City.
- Chen, P., S. Lahooti, Z. Policova, M. A. Cabrerizo-Vilchez, and A. W. Neumann. 1996. Concentration dependence of the film pressure of human serum albumin at the water/decane interface. Colloids Surf. B Biointerfaces. 6:279–289. [Google Scholar]
- Clint, J. H. 1992. Surfactant Aggregation. Blackie & Son Ltd., New York.
- Erickson, J. S., S. Sundaram, and K. J. Stebe. 2000. Evidence that the induction time in the surface pressure evolution of lysozyme solutions is caused by a surface phase transition. Langmuir. 16:5072–5078. [Google Scholar]
- Fainerman, V. B., E. H. Lucassen-Reynders, and R. Miller. 1998. Adsorption of surfactants and proteins at fluid interfaces. Colloids Surfaces A: Physicochemical and Engineering Aspects. 143:141–165. [Google Scholar]
- Forbes, J. G., A. J. Jin, and K. Wang. 2001. Atomic force microscope study of the effect of the immobilization substrate on the structure and force-extension curves of a multimeric protein. Langmuir. 17:3067–3075. [Google Scholar]
- Fraser, P. E., D. R. Mclachlan, W. K. Surewicz, C. A. Mizzen, A. D. Snow, J. T. Nguyen, and D. A. Kirschner. 1994. Conformation and fibrillogenesis of Alzheimer A β peptides with selected substitution of charged residues. J. Mol. Biol. 244:64–73. [DOI] [PubMed] [Google Scholar]
- Fraser, P. E., J. T. Nguyen, W. K. Surewicz, and D. A. Kirschner. 1991. pH-dependent structural transitions of Alzheimer amyloid peptides. Biophys. J. 60:1190–1201. [DOI] [PMC free article] [PubMed] [Google Scholar]
- Ghanta, J., C. Shen, L. L. Kiessling, and R. M. Murphy. 1996. A strategy for designing inhibitors of β-amyloid toxicity. J. Biol. Chem. 271:29525–29528. [DOI] [PubMed] [Google Scholar]
- Good, T. A., and R. M. Murphy. 1995. Aggregation state-dependent binding of β-amyloid peptides to protein and lipid components of rat cortical homogenates. Biochem. Biophys. Res. Commun. 207:209–215. [DOI] [PubMed] [Google Scholar]
- Graham, D. E., and M. C. Phillips. 1979. Proteins at liquid interfaces. J. Colloid Interface Sci. 70:403–439. [Google Scholar]
- Halverson, K., P. E. Fraser, D. A. Kirschner, and P. T. Lansbury, Jr. 1990. Molecular determinants of amyloid deposition in Alzheimer's disease: conformational studies of synthetic β-protein fragments. Biochemistry. 29:2639–2644. [DOI] [PubMed] [Google Scholar]
- Holmes, T. C., S. de Lacalle, X. Su, G. Liu, A. Rich, and S. Zhang. 2000. Extensive neurite outgrowth and active synapse formation on self-assembling peptide scaffolds. Proc. Natl. Acad. Sci. USA. 97:6728–6773. [DOI] [PMC free article] [PubMed] [Google Scholar]
- Jen, C. J., and L. V. Mclntire. 1984. Characteristics of shear-induced aggregation in whole blood. J. Lab. Clin. Med. 103:115–124. [PubMed] [Google Scholar]
- Kowalewski, T., and D. M. Holtzman. 1999. In situ atomic force microscopy study of Alzheimer's β-amyloid peptide on different substrates: new insights into mechanism of b-sheet formation. Proc. Natl. Acad. Sci. USA. 96:3688–3693. [DOI] [PMC free article] [PubMed] [Google Scholar]
- Lahati, S., O. I. Del Rio, A. W. Neumann, and P. Cheng. 1996. Axisymmetric drop shape analysis (ADSA). In Applied Surface Thermodynamics, A. W. Neumann and J. K. Spelt, editors. Marcel Dekker, Inc., New York. 441–507.
- Le Berre, F., G. Chauveteau, and E. Pefferkorn. 1998. Shear induced aggregation/ fragmentation of hydrated colloids. J. Colloid Interface Sci. 199:13–21. [DOI] [PubMed] [Google Scholar]
- Lomakin, A., D. B. Teplow, D. A. Kirchner, and G. B. Benedek. 1997. Kinetic theory of fibrillogenesis of amyloid β-protein. Proc. Natl. Acad. Sci. USA. 94:7942–7947. [DOI] [PMC free article] [PubMed] [Google Scholar]
- Lomakin, A., D. S. Chung, G. B. Benedek, and D. A. Kirschner. 1996. On the nucleation and growth of amyloid β-protein fibrils: detection of nuclei and quantitation of rate constants. Proc. Natl. Acad. Sci. USA. 93:1125–1129. [DOI] [PMC free article] [PubMed] [Google Scholar]
- Lougheed, W. D., H. Woutfe-Flanagan, J. R. Clement, and A. M. Albisser. 1980. Insulin aggregation in artificial delivery systems. Diabetologia. 19:1–9. [DOI] [PubMed] [Google Scholar]
- MacRitchie, F., and A. E. Alexander. 1963. Kinetics of adsorption of proteins at interfces. Part I. the role of bulk diffusion in adsorption. J. Colloid Sci. 18:453–457. [Google Scholar]
- Makievski, A. V., V. B. Fainerman, R. Miller, M. Bree, L. Liggieri, and F. Ravera. 1997. Determination of equilibrium surface tension values by extrapolation via long time approximations. Colloids Surfaces A: Physicochemical and Engineering Aspects. 122:269–273. [Google Scholar]
- Makievski, A. V., V. B. Fainerman, M. Bree, R. Wustneck, J. Kragel, and R. Miller. 1998. Adsorption of proteins at the liquid/air interface. J. Phys. Chem. B. 102:417–425. [Google Scholar]
- Markiewicz, P., and M. C. Goh. 1994. Atomic force microscopy probe tip visualization and improvement of images using a simple deconvolution procedure. Langmuir. 10:5–7. [Google Scholar]
- Miller, R., E. V. Aksenenko, V. B. Fainerman, and U. Pison. 2001. Kinetics of adsorption of globular proteins at liquid/fluid interfaces. Colloids Surfaces A: Physicochemical and Engineering Aspects. 183–185:381–390. [Google Scholar]
- Mulligan, C. N., and B. F. Gibbs. 1993. Factors influencing the economics of biosurfactants. In Biosurfactants: Production, Properties, and Applications. N. Kosaric, editor. Marcel Dekker, Inc., New York.
- Myers, D. 1992. Surfactant Science and Technology. 2nd ed. VCH Publishers, Inc., New York.
- Press, W. H., B. P. Flannery, S. A. Teukolsky, and W. T. Vetterling. 1992. Numerical Recipes. The Art of Scientific Computing (Fortran Version). University Press. Cambridge
- Reif, I., M. Mulqueen, and D. Blankschtein. 2001. Molecular-thermodynamic prediction of critical micelle concentrations of commercial surfactants. Langmuir. 17:5801–5812. [Google Scholar]
- Rotenberg, Y., L. Boruvka, and A. W. Neumann. 1983. Determination of surface tension and contact angle from the shapes of axisymmetric fluid interfaces. J. Colloid Interface Sci. 93:169–183. [Google Scholar]
- Serra, T., J. Colomer, and X. Casamitjana. 1997. Aggregation and breakup of particles in a shear flow. J. Colloid Interface Sci. 187:466–473. [DOI] [PubMed] [Google Scholar]
- Shen, C., and R. M. Murphy. 1995. Solvent effects on self-assembly of β-amyloid peptide. Biophys. J. 69:640–651. [DOI] [PMC free article] [PubMed] [Google Scholar]
- Soreghan, B., J. Kosmoski, and C. Glabe. 1994. Surfactant properties of Alzheimer's A β peptides and the mechanism of amyloid aggregation. J. Biol. Chem. 269:28551–28554. [PubMed] [Google Scholar]
- Van der Vegt, W., W. Norde, H. C. Van der Mei, and H. J. Busscher. 1996. Kinetics of interfacial tension changes during protein adsorption from sessile droplets on FEP-Teflon. J. Colloid Interface Sci. 179:57–65. [Google Scholar]
- Vesenka, J., M. Guthold, C. L. Tang, D. Keller, and E. Delaine. 1992. Substrate preparation for reliable imaging of DAN molecules with the scanning force microscope. Ultramicroscopy. 42–44:1243–1249. [DOI] [PubMed] [Google Scholar]
- Yang, D., C. M. Yip, T. H. Jackson Huang, A. Chakrabartty, and P. E. Fraser. 1999. Manipulating the amyloid-β aggregation pathway with chemical chaperones. J. Biol. Chem. 274:32970–32974. [DOI] [PubMed] [Google Scholar]
- Ybert, C., and J. M. di Meglio. 1998. Study of protein adsorption by dynamic surface tension measurements: diffusive regime. Langmuir. 14:471–475. [Google Scholar]
- Zhang, S., and A. Rich. 1997. Direct conversion of an oligopeptide from a β-sheet to an α-helix: a model for amyloid formation. Proc. Natl. Acad. Sci. USA. 94:23–28. [DOI] [PMC free article] [PubMed] [Google Scholar]
- Zhang, S., and M. Altman. 1999. Peptide self-assembly in functional polymer science and engineering. Reactive and Functional Polymers. 41:91–102. [Google Scholar]
- Zhang, S., C. Lockshin, R. Cook, and A. Rich. 1994. Unusually stable β-sheet formation in an ionic self-complementary oligopeptide. Biopolymers. 34:663–672. [DOI] [PubMed] [Google Scholar]
- Zhang, S., T. C. Holmes, C. Lockshin, and A. Rich. 1993. Spontaneous assembly of a self-complementary oligopeptide to form a stable macroscopic membrane. Proc. Natl. Acad. Sci. USA. 90:3334–3338. [DOI] [PMC free article] [PubMed] [Google Scholar]
- Zhang, S., T. C. Holmes, C. M. Dipersio, R. O. Hynes, X. Su, and A. Rich. 1995. Self-complementary oligopeptide matrices support mammalian cell attachment. Biomaterials. 16:1385–1393. [DOI] [PubMed] [Google Scholar]


