Abstract
A power-like decay function, characterized by the mean excited-state lifetime and relative variance of lifetime fluctuation around the mean value, was applied in analysis of fluorescence decays measured with the aid of time-correlated single photon counting. We have examined the fluorescence decay, in neutral aqueous medium, of tyrosine (L-tyrosine and N-acetyl-L-tyrosinamide), and of the tyrosine residues in a tryptophan-free protein, the enzyme purine nucleoside phosphorylase from Escherichia coli in a complex with formycin A (an inhibitor), and orthophosphate (a co-substrate). Tryptophan fluorescence decay was examined in neutral aqueous medium for l-tryptophan, N-acetyl-l-tryptophanamide, and for two tryptophan residues in horse liver alcohol dehydrogenase. To detect solvent effect, fluorescence decay of Nz-acetyl-l-tryptophanamide in aqueous medium was compared with that in dioxan. Hitherto, complex fluorescence decays have usually been analyzed with the aid of a multiexponential model, but interpretation of the individual exponential terms (i.e., pre-exponential amplitudes and fluorescence lifetimes), has not been adequately characterized. In such cases the intensity decays were also analyzed in terms of the lifetime distribution as a consequence of an interaction of fluorophore with environment. We show that the power-like decay function, which can be directly obtained from the gamma distribution of fluorescence lifetimes, is simpler and provides good fits to highly complex fluorescence decays as well as to a purely single-exponential decay. Possible interpretation of the power-like model is discussed.
INTRODUCTION
The fluorescence intensity decay kinetics of tryptophan and tyrosine residues has been widely used to obtain information about structure and dynamics of proteins and peptides, and in their complexes with ligands. This is based on the photophysical properties of the indole and phenol fluorophores in the ground and excited states, and their sensitivity to the physical and chemical nature of their local environment (Lakowicz, 1999). For example, events such as association of proteins (enzymes) with ligands (substrates, inhibitors) are usually accompanied by shifts in the excitation and emission spectra, as well as by changes in fluorescence quantum yields and decay kinetics.
It is well-known that decays of fluorescence intensity in proteins often exhibit a complex behavior, the origin of which can result from multiple (ground state) conformations, protein dynamics, spectral relaxation, or other interactions between fluorophores and their environment (Lakowicz, 2000). The decay of protein fluorescence is usually described by a multiexponential model, i.e., the arithmetic sum of a number of exponents characterized by lifetimes and pre-exponential factors. This is based on the interpretation of each discrete component with the aid of a particular protein conformation, including dynamic equilibrium between rotational isomers of tryptophan (Ross et al., 1992a) and tyrosine residues (Ross et al., 1992b, 1986; Laws et al., 1986). However, there are many cases for which an individual decay component has no physical interpretation, e.g., in the case of a multitude of conformational substates in proteins with possible time-dependent interconversions between them (Alcala et al., 1987). Furthermore, fluorophores that undergo dipolar relaxation (Ladokhin, 1999), as well as chemically heterogeneous systems (Gryczynski et al., 1988), display a complex fluorescence decay and cannot be properly described using the rotamer hypothesis (Ladokhin and White, 2001). Even for the indole moiety in solution, it is difficult to find unique conformations corresponding to discrete decay components (Szabo et al., 1983; Gryczynski et al., 1988). In such cases application of the multiexponential decay model is often arbitrary, and introduction of additional exponential components (few extra parameters) may improve fitting, but often without physical significance. An alternative approach suggests that, for a complex heterogeneous system, continuous lifetime distributions would be more relevant than a sum of discrete terms. We have to consider a better model to describe complex fluorescence relaxation linking the character of the decay law to the distribution of lifetimes.
THEORY
The probability I(t), of emission of a photon by an excited state residue at a given time t, when excited at time zero, is determined by
 |
(1) |
where τ(t) is the decay time of the system.
Solution of Eq. 1 in the case of τ(t) = τ0 = const leads to the classical single-exponential decay function
 |
(2) |
where Ao = I(t = 0) is the amplitude (pre-exponential factor).
Traditional analyses of a system of emitting residues treat the interaction with the environment as a small perturbation, and allow description of the excited-state decay of the system by its eigenvalues, i.e., discrete quantities (amplitudes and fluorescence decay lifetimes). These analyses have also shown that, with the assumption of noninteracting resonance transitions (separated by large energy gaps compared to their typical width), each individual fluorophore exhibits an exponential decay behavior. Obviously for a mixture of isolated and noninteracting residues, the decay of I(t) is given by the multiexponential model
 |
(3) |
where Ai and τi are the amplitudes and decay times of the M exponential components of the fluorescence decay. The mean decay time is given by 〈τe〉 = ΣAiτi.
On the other hand, decay of excited states may be treated as a result of interaction of emitting residues with their environment. Following this, one should consider many intercoupled states with coupling between them described by the coupling matrix Wij, the elements of which were a collection of transition rates from the ith energy level to the jth one. Such a mixing of configurations is present in proteins, where the energy of the excited state is dissipated among many conformational substates. It means that the component representing a transition between the excited and ground states of the emitting residues, in reference to the whole protein, is decomposed into a large number of resonances corresponding to different conformational substates of the protein in the ground and excited states. Previous investigations (Alcala et al., 1987; Alcala, 1994) indicate that proteins can exhibit a distribution of conformations. It is also known that, at room temperature, the timescale of a transition (interconversion) between different energy levels corresponding to different conformations can be of the same order of magnitude as the excited state decay time (Alcala et al., 1987).
In such instances the conformational equilibria of amino acids in solution or in proteins, and overall protein conformations, as well as numerous quenching phenomena, point to a lifetime distribution, P(τ), which better describes the contribution of each component to the fluorescence decay than discrete values of amplitudes Ai for each decay component. Consequently, the fluorescence decay I(t) is determined by
 |
(4) |
and allows us to discuss decay function in terms of lifetime distributions.
The lifetime distribution approach in fluorescence decay analysis is usually used without a theoretical basis for the lifetime distribution, which is arbitrarily considered as Gaussian or Lorentzian. In this approach a part of the distribution P(τ) exists for τ < 0 (cutoff problem), and, therefore, needs additional normalization (Lakowicz, 1999). The cutoff problem is avoided with the geometric distribution function (e.g., top-hat distributed decay times). In this case, P(τ) goes to zero in a well-defined manner and is given by
 |
(5) |
where 2Δ is full width of the top-hat function.
In an alternative approach, P(τ) is not described by any particular function. Thus, one can ask about the most expected distribution under certain constraints. Such a distribution can be found using the maximum entropy method (Montroll and Schlesinger, 1983; Sobczyk and Trȩbicki, 1993). In the maximum entropy formalism, one seeks the distribution function P(γ = 1/τ) that maximizes the entropy
 |
(6) |
The distribution P(γ), which is subject to the constraints of normalization (with m0 = 1 for k = 0), and L data constraints, given by
 |
(7) |
leads to maximal entropy, and is determined using the Lagrange multipliers procedure, as follows:
 |
(8) |
The L + 1 (Lagrange) parameters (λk) are determined by L + 1 equations given by Eq. 7. Thus, we have the constraints on normalization ( ), the mean value of the decay rate specified as 〈γ〉, and the mean value of the logarithm 〈ln(γ)〉. The latter expresses the fact that the distribution is determined only for γ > 0. Then, taking into account that P(τ)dτ = P(γ)dγ, and 〈ln(γ)〉 ∼ −ln(Nτ0), i.e., the case of a complex system with N decay paths affecting the excited-state lifetime, the distribution of lifetimes P(τ), which maximizes the entropy function with the above constraints, is given in the form of the gamma distribution
 |
(9) |
Additionally, P(τ) can also be obtained in analogy to the case of one decay path, where P(τ) is known as a Porter-Thomas distribution, which is, in fact, a gamma distribution with 1 degree of freedom (N = 1; see Dittes, 2000; Zimmermann et al., 1988).
As shown above, the distribution P(τ) in gamma form is predicted mathematically, and is proven not only by a maximum-entropy method but also by a random-matrix-theory approach, describing mixing between allowed degrees of freedom (configurations). In the formulation of random matrix theory, the coupling matrix (Wij) elements, describing the system and its environment, follow some random probability distribution. Only recently has it been proven that, as a result of the composition of contributions from N decay paths, the distribution of eigenvalues of Wij is described by P(τ) in the form of Eq. 9 (Wilk and Włodarczyk, 2001), where τ-values are equal to reciprocal eigenvalues.
Furthermore, introduction of the distribution P(τ) in the gamma form of Eq. 9 into Eq. 4 leads directly to the decay function
 |
(10) |
described by mean value of lifetime distribution (τ0) and one new parameter of heterogeneity (q), which is defined as
 |
(11) |
describing the relative variance (ω) of fluctuations of γ = 1/τ around the 1/τ0 value (Wilk and Włodarczyk, 1999). It is worth noting that the factor (2 − q)/τo in Eq. 10 results from normalization, and can be substituted by a fitted parameter in the case of non-normalized decay data. The mean decay time 〈tp〉 is obtained directly from the integration of Eq. 10, and is given by
 |
(12) |
In the classical limit, when the number of decay channels goes to infinity, i.e., q → 1, the gamma distribution (Eq. 9) becomes a delta function δ(τ − τ0), and the decay function converges from a power-like form (Eq. 10) to a single-exponential form.
Note that the power-like decay function results directly from fluctuations of the parameter γ = 1/τ in the exponential formula. Inasmuch as protein structural fluctuations occur in the nanosecond-picosecond timescale (Careri et al., 1979; Karplus and McCammon, 1983), it follows that these rapid fluctuations would affect fluorescence lifetime values.
It is worth noting that the stretched exponential function,
 |
(13) |
proposed in fluorescence lifetime imaging analysis (Lee et al., 2001), is similar to the lifetime distribution, and can be obtained from Eq. 1 assuming a time dependence of fluorescence lifetimes in the form
 |
(14) |
while the analogous time dependence
 |
(15) |
leads to the power-like decay function given by Eq. 10. However, the decay function in the power-like form seems to be better justified than that in the multiexponential or stretched exponential forms. Note that for t = 0, Eq. 15 reduces to τ(t = 0) = τ0/q, which means that that system instantly (at the moment of excitation) recognizes that the decay will be characterized by a mean lifetime τ0. However, Eq. 14 for t = 0 leads to τ(t = 0) = 0, and decay rate 1/τ goes to infinity.
EXPERIMENTAL
Materials
N-acetyl-L-tyrosinamide (NATyrA), N-acetyl-l-tryptophanamide (NATrpA), L-tyrosine (L-Tyr) and l-tryptophan (L-Trp) were purchased from Aldrich Chemical (Milwaukee, WI), and used without further purification. Formycin A (FA) and N-2-hydroxyethylpiperazine-N′-2-ethanesulfonic acid (HEPES) were products of Sigma Chemical (St. Louis, MO). The latter was used as buffering medium, with pH adjusted by addition of concentrated sodium hydroxide (NaOH; Merck, Darmstadt, Germany). Purine nucleoside phosphorylase (PNP; purine nucleoside: orthophosphate ribosyltransferase, EC 2.4.2.1) from Escherichia coli was prepared as described earlier (Kierdaszuk et al., 2000). Horse liver alcohol dehydrogenase (LADH; EC 1.1.1.1) was obtained from Boehringer Mannheim (Mannheim, Germany), and was prepared as described earlier (Lakowicz et al., 1996).
Ultraviolet absorption was monitored with a Cary 50 recording instrument (Varian, Palo Alto, CA) fitted with a thermostatically controlled cell compartment, using 5-mm pathlength cuvettes.
Steady-state fluorescence emission and excitation spectra were measured with a FluoroMax spectrofluorimeter (Spex, Metuchen, NJ), with 2-nm spectral resolution for excitation and emission in 5 × 5-mm Suprasil cuvettes, as previously described (Kierdaszuk et al., 2000).
Measurements of pH (±0.05) were carried out with a CP315m (Elmetron, Zabrze, Poland) pH-meter equipped with a combination semimicro electrode (Orion, Whetstone, Leicester, UK) and temperature sensor.
Time-resolved fluorescence measurements
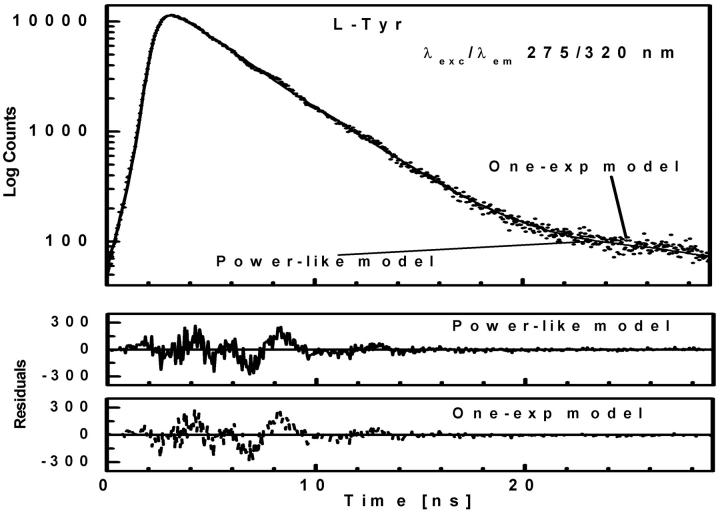
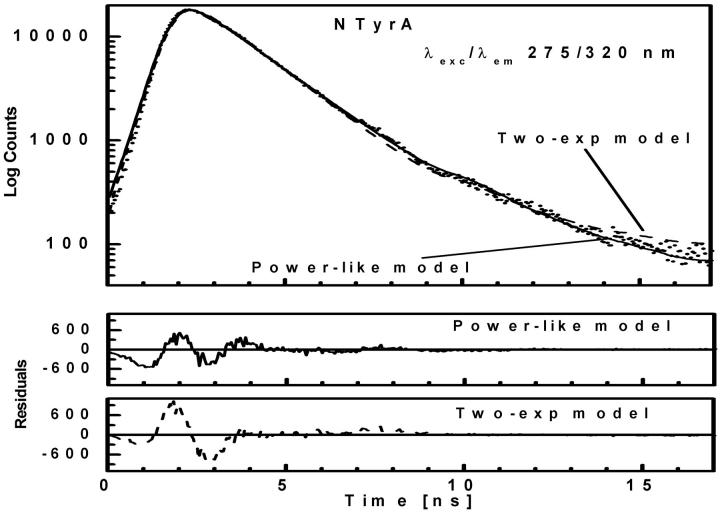
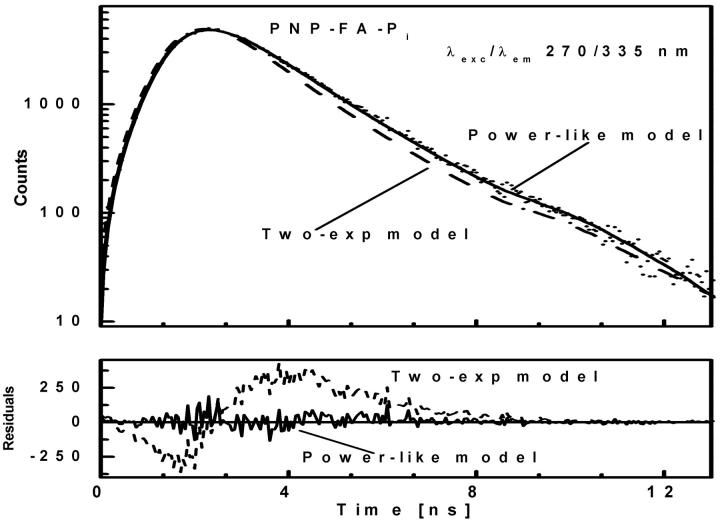
Fluorescence intensity decays were obtained by time-correlated single photon-counting (measurements of fluorescence, performed on an IBH time-resolved spectrofluorimeter (IBH Consultants, Glasgow, UK) equipped with a laser system consisting of a Ti-Sapphire laser (Mira-900) pumped by an Inova 310 argon ion laser (Coherent, Santa Clara, CA), and two excitation and emission monochromators operated at 4-nm spectral resolution (see Kierdaszuk et al., 2000, for further details). Typical fluorescence data were convoluted with the instrument response, and fitted to sums of one, two, or three exponentials (Eq. 3), and power-like decay function (Eq. 10) using IBH software and homemade procedures under Matlab, respectively. Two nonlinear fitting procedures, in the form of the Nelder-Meade simplex algorithm (Nelder and Meade, 1965) or the Marquardt-Levenberg method (Marquardt, 1963; Levenberg, 1944), were applied, and led to the same results. The quality of fits was evaluated by the structure observed in the plots of residuals (Figs. 1, 2, and 3, bottom panels) and by the reduced chi-square values (Table 1). All samples were prepared in 50 mM HEPES buffer (pH = 7) at 25°C, unless otherwise stated.
FIGURE 1.
Fluorescence intensity decay (λexc/λem 275/320 nm) of L-Tyr shown by dotted curve. The solid and dashed curves represent the theoretical values of the best fits of power-like function, and single-exponential function, respectively. The lower panels show residual differences between experimental and theoretical values.
FIGURE 2.
Fluorescence intensity decay (λexc/λem 275/320 nm) of NATyrA shown by dotted curve. The solid and dashed curves represent the theoretical values of the best fits of power-like function, and double-exponential function, respectively. The lower panels show residual differences between experimental and theoretical values.
FIGURE 3.
Fluorescence intensity decay (λexc/λem 270/335 nm) of ternary complex of E. coli PNP, FA, and Pi shown by dotted curve. See Fig. 2 legend for further details.
TABLE 1.
Comparison of multiexponential analysis with power-like analysis of the fluorescence decays of L-Tyr (λexc/λem 275/320 nm), NATyrA (λexc/λem 275/320 nm), ternary complex of E. coli PNP, FA, and phosphate (PNP-FA-Pi) (λexc/λem 270/335 nm), L-Trp (λexc/λem 275/350 nm), and NATrpA (λexc/λem 275/350 nm) at 25°C in 50 mM HEPES buffer pH 7.0; NATrpA (λexc/λem 275/335 nm) at 25°C in dioxan; and LADH (λexc/λem 295/338 nm) at 20°C in 20 mM phosphate buffer pH 7.5; the standard deviations (in brackets) refer to the last digit
| Multiexponential models
|
Power-like model
|
χR2
|
||||||
|---|---|---|---|---|---|---|---|---|
| Compounds | αi | τi (ns) | 〈τe〉* (ns) | q | τ0 (ns) | 〈tp〉† (ns) | Multiexp. models | Power-like model |
| L-Tyr | 1.00 | 3.21 2) | 3.21 (2) | 1.009 (9) | 3.18 (3) | 3.23 (6) | 1.88 | 1.84 |
| NATyrA | 1.00 | 1.63 (1) | 1.63 (1) | 1.07 (2) | 1.32 (3) | 1.53 (8) | 4.93 | 1.20 |
| 0.55 (1) | 1.29 (4) | 1.63 (5) | 1.85 | |||||
| 0.45 (1) | 2.06 (3) | |||||||
| PNP-FA-Pi | 1.00 | 1.46 (1) | 1.46 (1) | 1.105 (1) | 1.18 (3) | 1.49 (4) | 2.64 | 1.07 |
| 0.20 (1) | 0.49 (2) | 1.32 (3) | 1.32 | |||||
| 0.80 (1) | 1.52 (2) | |||||||
| L-Trp | 1.00 | 2.91 (2) | 2.91 (2) | 1.075 (8) | 2.56 (3) | 3.01 (7) | 3.36 | 1.89 |
| 0.08 (1) | 1.05 (8) | 2.88 (5) | 2.07 | |||||
| 0.92 (1) | 3.04 (2) | |||||||
| NATrpA | 1.00 | 2.72 (1) | 2.72 (1) | 1.010 (9) | 2.71 (4) | 2.76 (7) | 1.43 | 1.27 |
| NATrpA (in dioxan) | 1.00 | 4.38 (1) | 4.38 (1) | 1.093 (9) | 3.92 (4) | 4.4 (1) | 2.21 | 1.60 |
| 0.04 (1) | 1.36 (2) | 4.41 (6) | 1.61 | |||||
| 0.96 (1) | 4.54 (2) | |||||||
| LADH | 1.00 | 5.31 (3) | 5.31 (3) | 1.06 (1) | 4.90 (9) | 5.5 (2) | 1.15 | |
| 0.26 (1) | 3.37 (4) | 5.78 (9) | 1.02 | 1.02 | ||||
| 0.74 (1) | 6.64 (2) | |||||||
Fluorescence intensity decays were measured for L-Tyr, NATyrA, L-Trp, and NATrpA in 50 mM HEPES (phosphate-free), pH 7, NATrpA in dioxan, and LADH in phosphate buffer, using the time-correlated single photon-counting system and experimental conditions described in the Experimental section. The ternary (PNP-FA-Pi) complex was obtained for 35 μM PNP and 35 μM FA in 50 mM HEPES in the presence of 10 mM phosphate (Pi), pH 7..*
 |
 |
Maximal absorbency of the samples in the range where absorption and emission spectra overlap, did not exceed 0.1, thus minimizing inner-filter effects caused by self-absorption.
RESULTS
We have introduced an application of the decay function in a power-like form (Eq. 10) as an alternative model for interpretation of time-resolved fluorescence decays using, as examples, several compounds exhibiting complex tyrosine and tryptophan fluorescence. Fluorescence intensity decays were measured for L-Tyr (Fig. 1), NATyrA (Fig. 2), and a tertiary complex of E. coli purine nucleoside phosphorylase (PNP), a key enzyme of purine nucleoside catabolism, with its co-substrate (orthophosphate, Pi), and an inhibitor (formycin A, a structural analog of the substrate adenosine) (Fig. 3), at 25°C in 50 mM HEPES pH 7. PNP is a homohexameric protein, and exhibited absorption and emission spectra at 277 nm and 304 nm (Kierdaszuk et al., 2000), respectively, typical for proteins containing tyrosine, but no tryptophan (Ross et al., 1992a,b), and consistent with the fact that each of the subunits of the E. coli enzyme contains six tyrosine residues and no tryptophan (Hirshfield et al., 1991; Mao et al., 1997).
At neutral pH values, where L-Tyr exists in the zwitterionic form with the phenol residue in the neutral form, its fluorescence decay is well-characterized by a single-exponential function (Laws et al., 1986). Thus, the typical fluorescence decay of L-tyrosine was analyzed by single-exponential and power-like decay functions (Table 1), with corresponding residuals shown in Fig. 1 (bottom panel). It should be noted that the power-like model provides a good fit to the intensity decay data, with heterogeneity parameter q ≈ 1, and with the same mean decay time (〈tp〉 = 3.23 ± 0.06 ns) as that obtained by fit of the single-exponential function (〈τe〉 = 3.21 ± 0.02 ns). However, the decay function given by Eq. 10 provides a little better fit, as compared to that obtained for the single-exponential model (Table 1, Fig. 1). These results confirm that the decay function in form of Eq. 10 converge to exponent, when number of decay paths N → ∞ (thus q → 1), and may fit single-exponential decays.
The acetyl-amide form of L-Tyr (NATyrA), which exists exclusively in the neutral form in aqueous solution at neutral pH, is a better model compound for phenolic residues in a polypeptide chain than parent L-Tyr. Unexpectedly, NATyrA exhibited a more complex fluorescence decay than L-Tyr, usually described by a sum of two exponential terms (Ross et al., 1992a,b). It was suggested that this may reflect a conformational equilibrium between two main rotamers identified by 1H NMR spectroscopy (Laws et al., 1986), but the reason for absence of this effect in the case of L-Tyr fluorescence is so far unknown. Our results for NATyrA fluorescence decay at neutral pH at 25°C (Fig. 2, Table 1) are in line with these observations. A bad fit was obtained for the single-exponential model, as judged by residuals ( )—much better, but not fully satisfactory, with the double-exponential model (
 ). In contrast, an excellent fit was obtained with the power-like decay function (
 ) and q = 1.07, which led to the number of decay paths (N = 2/(q − 1)), N ≈ 29, and may reflect free fluorophore in solution. Although applicability of the multiexponential models is not physically justified, the resultant mean decay time (〈τe〉 = 1.63 ± 0.05 ns) for NATyrA fluorescence is in agreement with that obtained with the power-like model (〈tp〉 = 1.53 ± 0.08 ns).
The ternary complex of formycin A (inhibitor) and phosphate (natural co-substrate) with E. coli PNP was chosen as a good example of highly complex fluorescence intensity decay resulting from excitation of tyrosine residues in the enzyme, the N(1)-H and N(2)-H tautomeric forms of formycin A, free in solution, and the latter bound in the active site of the enzyme (Kierdaszuk et al., 2000). Fluorescence decay of such a complex system cannot be properly described using a single-exponential model (Kierdaszuk et al., 2000) due to many interacting fluorophore residues, which prevent consideration of the individual decay times (Lakowicz, 1999). In addition, fluorescence resonance energy transfer between protein tyrosine residues and the N(2)-H form bound by the enzyme (Kierdaszuk et al., 2000) affects the decay kinetics. Therefore, a continuous lifetime distribution seems to be better than a model that considers a sum of the individual decay components. Indeed, we observed that the power-like decay function given by Eq. 10 provides a good fit of the data (Fig. 3) with  , and high accuracy of the fitted parameters (Table 1). In contrast, a poor fit was obtained with the single-exponential model (
 ), somewhat improved with the double-exponential model (
 ), but the values of residuals (Fig. 3, bottom panel) confirm that the power-like decay function is still better than the double-exponential function. Furthermore, the increasing number of exponential terms in the multiexponential model is justified only by the resultant improvement of the goodness of fit, without physical interpretation of the decay components. The value of the mean decay time from the multiexponential model (Kierdaszuk et al., 2000) roughly agrees with that obtained from Eq. 12 (Table 1).
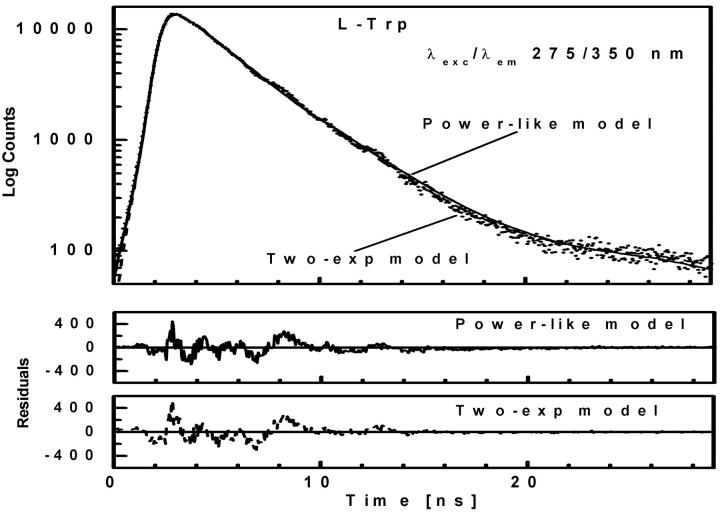
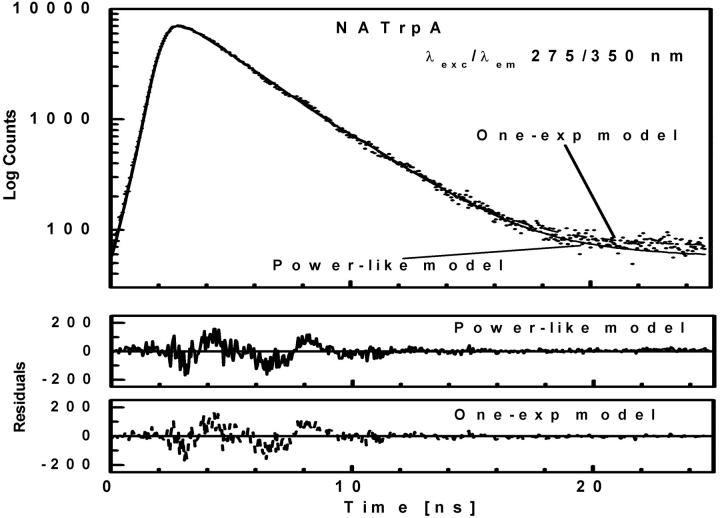
Tryptophan fluorescence decays were measured for L-Trp (Fig. 4), NATrpA (Fig. 5) and horse liver alcohol dehydrogenase (LADH) (Fig. 6). In contrast to L-Tyr and NATyrA (see above), fluorescence decay of the zwitterionic form of L-Trp in neutral aqueous solution (Fig. 4) was best fitted with the biexponential model (〈τe〉 = 2.88 ± 0.05 ns), while neutral NATrpA (Fig. 5) with the monoexponential model (〈τe〉 = 2.72 ± 0.01 ns) (Table 1), similar to the results reported previously (Lakowicz, 2000; and references cited therein). In both cases, the fits of the power-like model were better, as judged on  -values, and led to the q-value, much higher in the case of biexponential than monoexponential decay, as in the case of NATyrA and L-Tyr (Table 1), respectively. It means that the number of decay paths (N) is one range-of-value lower for biexponential decays (≈27) than for monoexponential decays, where it is ∼200, and reflects the fact the power-like function is transformed into monoexponential function, when q → 1 (N → ∞).
FIGURE 4.
Fluorescence intensity decay (λexc/λem 275/350 nm) of L-Trp shown by dotted curve. See legend to Fig. 2 for further details.
FIGURE 5.
Fluorescence intensity decay (λexc/λem 275/350 nm) of NATrpA shown by dotted curve. See legend to Fig. 1 for further details.
FIGURE 6.
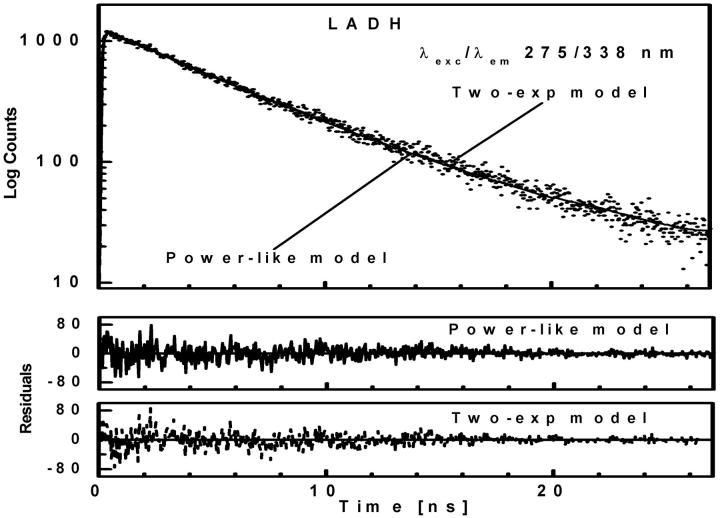
Fluorescence intensity decay (λexc/λem 295/338 nm) of LADH at 20°C in 20 mM phosphate buffer (pH 7.5) shown by dotted curve. See Fig. 2 legend for further details.
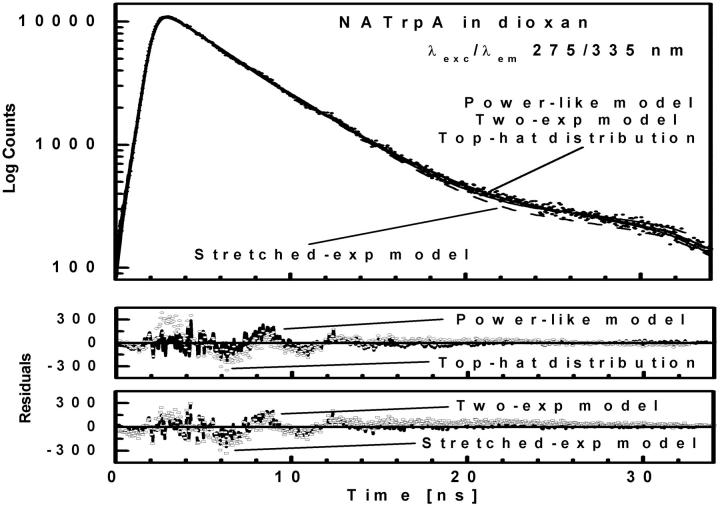
Remarkably, the decay model of the NATrpA fluorescence in less polar dioxan was changed to biexponential, and the mean decay time increased to 4.41 ns (Table 1). The same mean decay time (4.4 ± 0.1 ns) was also obtained with the power-like model, and the biexponential decay model is reflected in a high increase of the q-value (Table 1), i.e., in a decrease of the number of decay paths (N) from ∼200 to 20. Additionally, stretched the exponential model and the top-hat distribution function were also fitted to the fluorescence decay of NATrpA in dioxan (Fig. 7). Both models led to the similar fluorescence decay meantime values, i.e., 4.36 ± 0.04 ns (β = 0.05 ± 0.02), and 4.44 ± 0.01 ns (Δ = 0.003 ± 0.001), respectively. However, the best fit was obtained with the power-like model ( ), as judged on
  -values for the stretched exponential model (4.40) and the top-hat distribution function (2.32), as well as on the appropriate residuals (Fig. 7).
FIGURE 7.
Fluorescence intensity decay (λexc/λem 275/335 nm) of NATrpA in dioxan shown by dotted curve. Three solid curves represent the theoretical values of the best fits of power-like function, double-exponential function, and top-hat function (all overlapped); and dashed curve represent the theoretical values of the best fit of stretched-exponential function. Two lower panels show residual differences between experimental and theoretical values for (—) power-like function, (○) top-hat function, (- - -) double-exponential function, and (□) stretched-exponential function.
To further evaluate utility of the power-like model, it was applied for analysis of the fluorescence decay of LADH, which is an example of a homodimeric protein containing two tryptophan residues per subunit, trp-15 and trp-314. According to crystal structures of LADH and several of its derivatives and binary complexes (Petterson, 1987; and references cited therein), trp-314 (buried residue) is located in the nonpolar intersubunit region, and is inaccessible to solvent. Trp-15 is located on the protein surface and its side chain is accessible to solvent as well as to dynamic quenchers (iodide, acrylamide). Despite the close contact between the indole rings of trp-314 residues from two subunits (center-to-center distance ∼7 Å), the experimental data argue against significant energy homotransfer (Eftink, 1992). LADH fluorescence decays were generally analyzed with the biexponential decay model with a short-lived component (3.4–3.8 ns) from trp-314, and a long-lived component (6.6–7.4 ns) from trp-15 (Beechem et al., 1988; Eftink and Hagman, 1986), but highly-resolved fluorescence decay data suggested the presence of a third, very short component with a population of 0.3–0.9% (90–290 ps) and 1.3–1.8% (30–160 ps) for one- and two-photon excitation (Lakowicz et al., 1996), respectively. It is worth noticing that interpretation of the two former components are supported by fluorescence decay data obtained for selectively mutated LADH protein (Eftink, 1992), whereas the latter was not interpreted by site-directed mutagenesis, and its presence so far was accepted because of an improvement of the fits. Fluorescence decay of LADH measured here is described by the biexponential model justified by  -value and residuals, and show fluorescence lifetimes of components (3.37 ± 0.04 and 6.64 ± 0.02 ns) and decay meantime of 5.78 ± 0.09 ns (Table 1), typical for this protein (Lakowicz et al., 1996). The power-like model fits the decay data very well (Fig. 6) with the same decay meantime (5.5 ± 0.2 ns), and q = 1.06 (N ≈ 30), i.e., in the range of values observed for L-Trp in aqueous medium, and NATrpA in dioxan (Table 1). Additionally, the Anderson-Darling test (Stephens, 1976), which is more sensitive in the range of decay tails, seems to be better in this case, and confirms the significant difference between multiexponential and power-like models.
Finally, we should emphasize that the power-like decay model provides additional information about the heterogeneity of the studied fluorophore system, which affects its fluorescence decay. This is based on the relative variance of fluctuations (ω) around mean values of lifetime distributions, and the number of decay paths (N = 2/(q − 1)), which can be easily obtained from the fitted parameter q (Eq. 11). With the PNP-FA-Pi ternary complex, q = 1.105 (Table 1), leading to ω = 0.105 and to a limited number of decay paths (N ≈ 19), which may be related to the numerous phenomena. Some of them should be considered as more important, e.g., 1), conformational equilibrium of each emitting residue; 2), stoichiometry of ligand binding to the six active sites of the enzyme; 3), tautomeric equilibrium of FA, which is affected by enzyme-ligand binding; and 4), fluorescence resonance energy transfer from tyrosine residue(s) to the base moiety of FA in the enzyme-ligand complex (Kierdaszuk et al., 2000).
CONCLUSIONS
Recent considerations of complex fluorescent decays (Ladokhin and White, 2001; Lakowicz, 2000) show many cases where interpretation of the individual components, traditionally used in multiexponential analysis, is incorrect. The relation between the various components and the described decay is unclear, since parameters are defined arbitrarily. In such cases the use of a continuous lifetime distribution seems to be more adequate. Hence, the power-like decay function proposed in this article may be a good alternative to the traditional multiexponential approach. The function, obtained directly from the gamma-distributed fluctuations of the fluorescence lifetime, allows for statistical treatment of the fluorescence decays. It is worth noticing that, given the mean value and assuming positive lifetimes only, the introduced gamma lifetime distribution is the most probable one. The power-like decay function has only two parameters: the mean value of lifetime distribution and their relative variance, which define the heterogeneity parameter (Eq. 11). The function also provides additional information about decay phenomenon, i.e., the possible number of deactivation channels and excited state mean lifetime can be easily derived from it. Analyses of fluorescence decays have proven the power-like approach advantageous to the exponential method over a wide range of cases, providing better and more efficient fits to the experimental data.
Acknowledgments
We are indebted to Prof. David Shugar for reading the manuscript and useful comments.
This research was supported by the State Committee for Scientific Research (KBN, grant 6P04A03812, and partially from grants BW 1565/BF and BST 763/BF), and by the Foundation for Polish Science.
References
- Alcala, J. R., E. Gratton, and F. G. Prendergast. 1987. Interpretation of fluorescence decays in proteins using continuous lifetime distributions. Biophys. J. 51:925–936. [DOI] [PMC free article] [PubMed] [Google Scholar]
- Alcala, J. R. 1994. The effect of harmonic conformational trajectories on protein fluorescence and lifetime distributions. J. Chem. Phys. 101:4578–4584. [Google Scholar]
- Beechem, J. M., J. R. Knutson, J. B. A. Ross, B. V. Turner, and L. Brand. 1988. Global resolution of heterogeneous decay by phase/modulation fluorometry: mixtures and proteins. Biochemistry. 22:6054–6058. [Google Scholar]
- Careri, G., P. Fasella, and E. Gratton. 1979. Enzyme dynamics: the statistical physics approach. Annu. Rev. Biophys. Bioeng. 8:69–97. [DOI] [PubMed] [Google Scholar]
- Dittes, F. M. 2000. The decay of quantum systems with a small number of open channels. Phys. Rep. 339:215–216. [Google Scholar]
- Eftink, M. R., and K. A. Hagman. 1986. Fluorescence lifetime and anisotropy studies with liver alcohol dehydrogenase and its complexes. Biochemistry. 25:6631–6637. [DOI] [PubMed] [Google Scholar]
- Eftink, M. R. 1992. Luminescence studies with horse liver alcohol dehydrogenase: information on the structure, dynamics, transitions and interactions of this enzyme. Adv. Biophys. Chem. 2:81–114. [Google Scholar]
- Gryczynski, I., W. Wiczk, M. L. Johnson, and J. R. Lakowicz. 1988. Lifetime distributions and anisotropy decays of indole fluorescence in cyclohexane/ethanol mixtures by frequency-domain fluorometry. Biophys. Chem. 32:173–185. [DOI] [PubMed] [Google Scholar]
- Hirshfield, M. S., S. Chaffe, L. Koro-Johnson, A. Mary, A. A. Smith, and S. A. Short. 1991. Use of site-directed mutagenesis to enhance the epitope-shielding effect of covalent modification of proteins with polyethylene glycol. Proc. Natl. Acad. Sci. USA. 88:7185–7189. [DOI] [PMC free article] [PubMed] [Google Scholar]
- Karplus, M., and J. A. McCammon. 1983. Dynamics of proteins, elements and function. Annu. Rev. Biochem. 53:263–300. [DOI] [PubMed] [Google Scholar]
- Kierdaszuk, B., A. Modrak-Wójcik, J. Wierzchowski, and D. Shugar. 2000. Formycin A and its n-methyl analogues, specific inhibitor of E. coli purine nucleoside phosphorylase (PNP): induced tautomeric shifts on binding to enzyme, and enzyme → ligand fluorescence resonance energy transfer. Biochim. Biophys. Acta. 1476:109–128. [DOI] [PubMed] [Google Scholar]
- Ladokhin, A. S. 1999. Red-edge excitation study of nonexponential fluorescence decay of indole in solution and in a protein. J. Fluorescence. 9:1–9. [Google Scholar]
- Ladokhin, A. S., and S. H. White. 2001. Alphas and taus of tryptophan fluorescence in membranes. Biophys. J. 81:1825–1827. [DOI] [PMC free article] [PubMed] [Google Scholar]
- Lakowicz, J. R., B. Kierdaszuk, I. Gryczynski, and H. Malak. 1996. Fluorescence of horse liver alcohol dehydrogenase using one- and two-photon excitation. J. Fluorescence. 6:51–59. [DOI] [PubMed] [Google Scholar]
- Lakowicz, J. R. 1999. Principles of Fluorescence Spectroscopy, 2nd Ed. Kluwer Academic/Plenum Publishers, New York. 130–131.
- Lakowicz, J. R. 2000. On spectral relaxation in proteins. Photochem. Photobiol. 72:421–437. [DOI] [PMC free article] [PubMed] [Google Scholar]
- Laws, W. R., A. J. B. Ross, H. R. Wyssbrod, J. M. Beechem, L. Brand, and J. C. Sutherland. 1986. Time-resolved fluorescence and 1H NMR studies of tyrosine and tyrosine analogues: correlation of NMR-determined rotamer populations and fluorescence kinetics. Biochemistry. 25:599–607. [DOI] [PubMed] [Google Scholar]
- Lee, B. K. C., J. Siegel, S. E. D. Webb, S. Léveque-Fort, M. J. Cole, R. Jones, K. Dowling, M. J. Lever, and P. M. W. French. 2001. Application of the stretched exponential function to fluorescence lifetime imaging. Biophys. J. 81:1265–1274. [DOI] [PMC free article] [PubMed] [Google Scholar]
- Levenberg, K. A. 1944. A method for the solution of certain non-linear problems in least squares. Quart. Appl. Math. II:164–168. [Google Scholar]
- Mao, C., W. J. Cook, M. Zhou, G. Koszalka, T. A. Krenitsky, and S. E. Ealick. 1997. The crystal structure of E. coli purine nucleoside phosphorylase: a comparison with human enzyme reveals a conserved topology. Structure. 5:1373–1383. [DOI] [PubMed] [Google Scholar]
- Marquardt, D. W. 1963. An algorithm for least-squares estimation of nonlinear parameters. J. Soc. Ind. Appl. Math. 11:431–441. [Google Scholar]
- Montroll, E. W., and M. F. Schlesinger. 1983. Maximum entropy formalism, fractals, scaling phenomena, and 1/f noise: a tale of tails. J. Stat. Phys. 32:209–230. [Google Scholar]
- Nelder, J. A., and R. Meade. 1965. A simplex method for function minimization. Comput. J. 7:308–313. [Google Scholar]
- Petterson, G. 1987. Liver alcohol dehydrogenase. Crit. Rev. Biochem. 21:349–389. [PubMed] [Google Scholar]
- Ross, J. B. A., W. R. Laws, A. Buku, J. C. Sutherland, and H. R. Wyssbrod. 1986. Time-resolved fluorescence and 1H NMR studies of tyrosyl residues in oxytocin and small peptides: correlation of NMR-determined conformations of tyrosyl residues and fluorescence decay kinetics. Biochemistry. 25:599–607. [DOI] [PubMed] [Google Scholar]
- Ross, J. B. A., H. R. Wyssbrod, R. A. Porter, G. P. Schwartz, C. A. Michaels, and W. R. Laws. 1992a. Correlation of tryptophan intensity decay parameters with 1H NMR-determined rotamer conformations: [tryptophan2]oxytocin. Biochemistry. 31:1585–1594. [DOI] [PubMed] [Google Scholar]
- Ross, J. B. A., W. R. Laws, K. W. Rousslang, and H. R. Wyssbrod. 1992b. Tyrosine fluorescence and phosphorescence from proteins and polypeptides. In Topics in Fluorescence Spectroscopy. Vol. 3, Biochemical Applications. J. R. Lakowicz, editor. Plenum Press, New York. 1–63.
- Sobczyk, K., and J. Trȩbicki. 1993. Maximum entropy principle and stochastic nonlinear oscillators. Physica A. 193:448–468. [Google Scholar]
- Stephens, M. A. 1976. EDF Statistics for goodness of fit and some comparisons. J. Am. Stat. Assoc. 69:730–737. [Google Scholar]
- Szabo, A. G., T. M. Stepanik, D. M. Wayner, and N. M. Young. 1983. Conformational heterogeneity of the cooper binding site in azurin. Biophys. J. 41:233–244. [DOI] [PMC free article] [PubMed] [Google Scholar]
- Wilk, G., and Z. Włodarczyk. 2001. Nonexponential decays and nonextensivity. Phys. Lett. A. 290:55–58. [Google Scholar]
- Wilk, G., and Z. Włodarczyk. 1999. Interpretation of the nonextensivity parameter q in some applications of Tsallis statistics and Lévy distributions. Phys. Rev. Lett. 84:2770–2773. [DOI] [PubMed] [Google Scholar]
- Zimmermann, Th., H. Köppel, L. S. Cederbaum, G. Persch, and W. Demtröder. 1988. Confirmation of random-matrix fluctuations in molecular spectra. Phys. Rev. Lett. 61:3–6. [DOI] [PubMed] [Google Scholar]


