

Abstract
We explore and quantify the physical and biochemical mechanisms that may be relevant in the regulation of translation. After elongation and detachment from the 3′ termination site of mRNA, parts of the ribosome machinery can diffuse back to the initiation site, especially if it is held nearby, enhancing overall translation rates. The elongation steps of the mRNA-bound ribosomes are modeled using exact and asymptotic results of the totally asymmetric exclusion process. Since the ribosome injection rates of the totally asymmetric exclusion process depend on the local concentrations at the initiation site, a source of ribosomes emanating from the termination end can feed back to the initiation site, leading to a self-consistent set of equations for the steady-state ribosome throughput. Additional mRNA binding factors can also promote loop formation, or cyclization, bringing the initiation and termination sites into close proximity. The probability distribution of the distance between the initiation and termination sites is described using simple noninteracting polymer models. We find that the initiation, or initial ribosome adsorption binding required for maximal throughput, can vary dramatically depending on certain values of the bulk ribosome concentration and diffusion constant. If cooperative interactions among the loop-promoting proteins and the initiation/termination sites are considered, the throughput can be further regulated in a nonmonotonic manner. Experiments that can potentially test the hypothesized physical mechanisms are discussed.
INTRODUCTION
The rate of protein production needs to be constantly regulated for all life processes. Genetic expression, protein production, and post-translational modification, as well as transport and activation, are all processes that can regulate the amount of active protein/enzymes in a cell. Although much recent research has focused on the biochemical steps regulating the switching of genes and rates of transcription, translational control mechanisms, post-translational processing, and macromolecular transport are also important. For example, during embryogenesis, nuclear material is highly condensed, transcriptional regulation is inactive, and translational control is important (Browder et al., 1991; Wickens et al., 1996). In other instances, transcriptional regulation is accompanied by long lag times, particularly with long genes. Translational regulation is also the only means by which RNA viruses express themselves.
Protein production, as with other cellular processes, requires the assembly of numerous specific enzymes and co-factors for initiation. This assembly occurs in the cytoplasm and on the 5′ initiation site of mRNA. Translation involves unidirectional motion of the ribosome complex along the mRNA strand as amino-acid-carrying tRNA successively transfer amino acids to the growing polypeptide chain. Images of mRNA caught in the act of translation often show numerous ribosome complexes attached to the single-stranded nucleotide (Fig. 1 A). The multiple occupancy is presumably a consequence of very active translation, when many copies of protein are desired.
FIGURE 1.

(A) An electron micrograph of polysomes on mRNA. (B) An AFM micrograph of circularization of mRNA mediated by loop forming proteins. From Wells et al. (1998). These images are of double-stranded RNA of approximate length 2–4× the dsRNA persistence length. Single-stranded end segments with loop binding factors comprise the ends.
Under certain conditions, the local concentration of tRNA, ribosomes, initiation factors, etc., will control protein production. One possible physical feedback mechanism underlying all the other biochemical regulation processes utilizes local concentration variations of the components of translation machinery. Moreover, there is ample biochemical evidence that the 5′ and 3′ ends of eukaryotic mRNA interact with each other, aided by proteins that bind to the poly(A) tail and/or regions near the initiation site (Sachs, 1990), particularly if the 5′ initiation terminus is capped. The presence of both a poly(A) tail and a 5′ cap have been found to synergistically enhance translation rates in a number of eukaryotic systems (Gallie, 1991; Michel et al., 2000). Numerous proteins that initiate translation, such as eukaryotic initiation factor eIF4, have been identified to bind to the cap and initiate ribosomal binding (Mathews et al., 1996; Munroe and Jacobson, 1990; Preiss and Hentze, 1999; Sachs and Varani, 2000). A different set of proteins, poly(A) binding proteins (PAB) such as Pab1p, are found to bind to the poly(A) tail. The proteins on the 5′ cap and the poly(A) tail are also known to form a complex (cap-eIF4E-eIF4G-Pab1p-poly(A) tail) which can increase translation rates (Jackson, 1996; Munroe and Jacobson, 1990; Sachs et al., 1997; Sachs and Varani, 2000). In vitro solutions of capped, poly(A)-tailed mRNA, tRNA, and ribosomes fail to display synergy (Gallie, 1991), indicating that additional factors are required for cooperative interactions between the cap and the poly(A) tail. However, in vitro systems that include caps, poly(A) tails, eIFs, and PABs reveal circularized mRNA structures in electron micrograph and atomic force microscopy (AFM) images. In this way, it is thought that various components of the translation machinery can be recycled after termination without completely reentering the enzyme pool in the cytoplasm.
Even in uncapped mRNA, there is evidence that certain sequences in the terminal 3′ untranslated region (UTR) can enhance translation to levels comparable to those seen in capped mRNAs (Wang et al., 1997; Jackson, 1996). Additionally, there are indications that proteins near the termination end can, upon contact, directly activate (Gallie, 1991) or inactivate (Curtis et al., 1995; Dubnau and Struhl, 1996) ribosome entry at the 5′ initiation site. Loops also appear to be a common motif in DNA structures (Goddard et al., 2000; Zacharias and Hagerman, 1996) and take part in transcriptional regulation (Dunn et al., 1984; Wyman et al., 1997). Double-stranded DNA has a much longer persistence length than single-stranded nucleic acids (such as mRNA) and is much less likely to form loops without accompanying binding proteins or specific sequences. Direct evidence for RNA circularization is shown in Fig. 1 B, which shows loop formation of relatively short double-stranded mRNA in the presence of loop-binding factors at their ends (Hagerman, 1985). It is reasonable to expect that the more flexible single-stranded mRNA decorated with ribosomes can form similar loops. Besides the AFM-imaged loop of double-stranded RNA shown in Fig. 1 B, there is also substantial evidence, particularly in viral mRNAs, that basepairing between uncapped 5′ regions and nonpolyadenylated 3′ regions forms closed loops of many kilobases (Wang et al., 1997). This loop formation by direct basepairing, or “kissing,” is a very plausible mechanism by which the 3′ UTR recruits ribosomes and delivers them to the 5′ initiation site (Guo et al., 2001).
In this article, we model the proposed cyclization, i.e., “circularization” (Sachs et al., 1997), and ribosome recycling mechanisms. Cooperative interactions of the initiation and termination sites with eukaryotic initiation factors (eIFs) and PAB proteins will also be considered within a number of reasonable assumptions. Since translation employs an immense diversity of mechanisms and proteins that vary greatly across organisms (Mathews et al., 1996), we will only develop an initial, qualitative physical picture of cytoplasmic mRNA translation consistent with the ingredients mentioned above. Three different coupled effects are considered in turn: 1), a totally asymmetric exclusion process (TASEP) describing the unidirectional stochastic motion of the ribosome along the mRNA; 2), the diffusion and adsorption/desorption kinetics from the mRNA initiation/termination sites; and 3), the polymer physics associated with how the termination and initiation sites are spatially distributed relative to each other. The ribosome density along the mRNA, as well as the time-averaged throughput of ribosomes, i.e., the ribosome “current,” are described by solutions of the TASEP. The parameters in the TASEP are the internal hopping rates and the injection and extraction rates at the initiation and termination sites, respectively. Since ribosome components that diffuse in bulk must adsorb on the initiation site, the injection rate used in the TASEP will be proportional to the local concentration of the rate-limiting ribosome. Ribosomes that reach the termination site desorb and reenter the pool of diffusing ribosomes. The distance between the termination end and the initiation site, when ribosomes are released, can thus influence the absorption rate and hence the overall translation rate. The initiation-termination end-to-end distance distribution can be estimated with basic polymer physics. The end-to-end distance distribution can include effects such as specific binding of poly(A)-associated proteins with the 5′ cap, thereby forming a loop, bringing the initiation and termination sites into close proximity. Although our model applies only to cytoplasmic mRNA translation, many of its components can also be adapted to treat mRNA adsorption on endoplasmic reticulum (ER) and ER-assisted translation.
PHYSICAL MODELS
We now consider the physical processes necessary to describe the above-mentioned translation processes. At the relevant timescales, we will see that fluctuations in these physical mechanisms are uncorrelated with each other. This allows us to consider simple steady states where time or ensemble averages of the TASEP, ribosome diffusion in the cytoplasm, and the mRNA chain conformations are uncorrelated and can be taken independently of each other. A simplifying schematic of the basic ingredients of mRNA translation is given in Fig. 2 .
FIGURE 2.
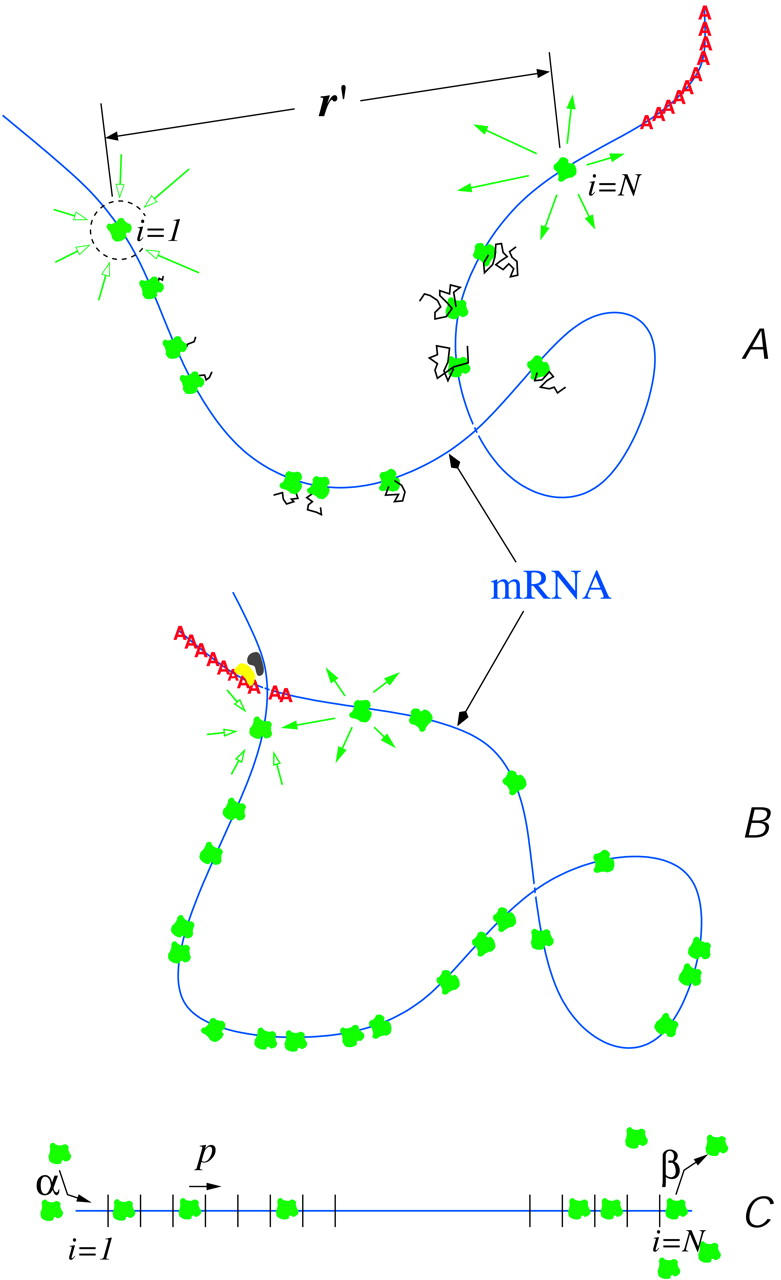
A cartoon of mRNA translation in eukaryotes. The intermediary proteins and co-factors are not depicted. (A) An mRNA chain loaded with ribosomes (green), in various stages of protein (black) production. Ribosomal components as well as other components such as tRNA exist at a uniform background concentration. The initiation and termination sites are additional sinks (i = 1) and sources (i = N), respectively, of ribosomes. (B) Binding factors (yellow and dark gray) can increase the probability of loop formation or circularization, which brings the poly(A) tail (red) in better proximity to the initiation site, enhancing ribosome recycling. (C) Schematic of the associated TASEP with injection (α), internal hop (p), and desorption (β) rates labeled.
The asymmetric exclusion process
The TASEP is one of a very small number of interacting nonequilibrium models with known exact solutions. Asymmetric exclusion models have been used to model qualitative features of diverse phenomena including ion transport (Hahn et al., 1996; Chou, 1999; Chou and Lohse, 1999), traffic flow (Schreckenberg et al., 1995), and the kinetics of biopolymerization (MacDonald et al., 1968; MacDonald and Gibbs, 1969). Briefly, the model consists of a one-dimensional lattice of N sites, each approximately the molecular size of a ribosome unit. Each variable  represents the ribosome occupation at site i of the coding region of mRNA. Each site can be occupied by at most one ribosome and the mean occupation
  at each site 1 ≥ σi ≥ 0. The probability in time dt that an individual ribosome moves forward to the next site (toward the 3′ end) is pdt, provided the adjacent site immediately in front is unoccupied. Backward moves are not allowed, since ribosomes are strongly driven motors that move unidirectionally from 5′ to 3′. The entrance and exit rates at the initiation (i = 1) and termination (i = N) sites are denoted α and β, respectively (compare to Fig. 2 C). The exact steady-state solutions to this kinetic model, including the average density σi, and the mean particle (ribosome) current have been found by Derrida and co-workers (Derrida et al., 1993), using a matrix product ansatz, and by Schütz and Domany (1993), using an iteration method. An exact representation for the steady-state current across an N-site chain is (Derrida et al., 1993),
 |
(1) |
where
 |
(2) |
In the N → ∞ limit, the one-dimensional TASEP (Eq. 1) admits three nonequilibrium steady-state phases, representing different regimes of the steady-state current J:
 |
(3) |
The phases I, II, and III defined by Eq. 3 are denoted as the maximal current, low density, and high density phases, respectively, and are delineated in Fig. 3 by the dotted phase boundaries. Qualitatively, when β is small, and injection rates are faster than extraction rates (α > β), the rate-limiting process is the exit step at i = N. Therefore, the high occupancy phase II has a low current which is a function of only the slow step β. In the opposite limit of fast desorption at i = N, and slow injection at i = 1 (small α), the chain is always nearly empty, and has a small current J that depends only upon the rate-limiting step α. For large α ∼ β, the system attains maximal current J = p/4 where the effective rate-limiting steps are internal hopping rates p. In this phase, the constant current J = p/4 is independent of further increases in α or β. The ribosomal currents given by Eq. 3 and the associated phase diagram in Fig. 3 are valid only in the N → ∞ limit. Nonetheless, the N = ∞ phase diagram is qualitatively accurate for the currents expected at large but finite N.
FIGURE 3.

The infinite chain (N → ∞) limit nonequilibrium phase diagram of the standard TASEP. The maximal current (III), low density (I), and high density (II) phases and their corresponding steady-state currents are indicated. In this and subsequent phase diagrams, solid curves correspond to phase boundaries across which the slope of the steady-state currents (with respect to the parameters) is discontinuous. Across the dashed phase boundaries, the currents and their first derivatives are continuous.
There may appear to be a microphysical inaccuracy: the TASEP defined above corresponds to individual movements with step length equal to the ribosome size. However, ribosomes typically occlude ∼10 codons, so that it takes ∼10 microscopic steps for the ribosome to move the distance of its own size (Lakatos and Chou, 2003; Shaw et al., 2003). An accurate approximation for the throughput J (Eq. 1) is to assume that each step between two sites defined in our model consists of ∼10 actual tRNA transfers. The effective rate p is thus the average tRNA transfer rate reduced by a factor of ∼10. With this consideration, the TASEP completely determines the steady-state ribosome throughput as long as the effective rate p is appropriately defined. Therefore, we will treat the mRNA translation problem using step sizes equal to the ribosome size, with the understanding that for appropriately rescaled transition rates, our results will be qualitatively correct. The exact currents of a TASEP, where the particle diameters are q × the step size, is given in (MacDonald et al., 1968). Explicit Monte Carlo simulations have also been performed on large-particle/small-step-size dynamics to confirm the accuracy of the results (Lakatos and Chou, 2003; Shaw et al., 2003).
What remains is to determine the self-consistent dependence of the model parameters, in particular α and β, on the local ribosome concentration (which in turn depends on the mean current J), diffusion rates, circularization, etc. For example, the injection rate α at the initiation site will be proportional to a microscopic binding rate k × the local ribosome concentration.
Steady-state release, diffusion, and capture
The complete mRNA translation machinery is extremely complicated, since it is comprised of many auxiliary RNA and protein co-factors, as well as a collection of active mRNA chains. Since there are many active mRNA chains in the cytoplasm, each mRNA chain feels the sinks (initiation sites) and sources (termination sites) of all the other mRNA chains. However, these other randomly distributed chains, each with their own initiation and termination sites, contribute an averaged background ribosome concentration. Thus, it is only the termination site (ribosome source) associated with the initiation site on the same mRNA chain that resupplies the initiation site in a correlated manner. We thus consider a single isolated mRNA chain and for the sake of simplicity, assume that a single component, say phosphorylated elongation initiation factor eIF4F or eIF2, say (Clemens, 1996; Sachs and Varani, 2000), is key to a rate-limiting step. We will generically call this component the ribosome. Consider a source of newly-detached ribosomes (emanating from the 3′ termination site) at position r away from the 5′ initiation site. The probability of finding this particle within the volume element dr about r obeys the linear diffusion equation with the termination site acting as a source,
 |
(4) |
where D is the bulk ribosome diffusion constant, J(t) is the instantaneous rate of ribosome release from the termination end, and Weff(r)dr is the probability that the termination site is within the positions r and r + dr from the initiation site. Although Eq. 4 can be solved exactly for all times, the TASEP result (Eq. 1) is appropriate only in the steady state, so we must consider that limit for all processes.
The typical mRNA passage time of a single ribosome is on the order of 1 min. The bulk diffusion constant of the 10- to 15-nm radius (a ∼ 15 nm) ribosome unit is D ∼ 10−8 − 10−7 cm2/s. A ribosome molecule will diffuse the length of a 1 kB pair mRNA strand in ∼0.1 s. Therefore, with each release of a ribosome from the termination site, the probability density appears as a pulse which passes through the initiation site over a timescale shorter than it takes for a ribosome to stochastically hop a few lengths of its size along the mRNA chain. Therefore, an upper bound on the amount of correlation between concentration fluctuations and  can be found by considering the equal time two-point correlation in the maximal current phase
  (Derrida and Evans, 1993). Two-point correlations in other current regimes are smaller, and decay exponentially with N (Essler and Rittenberg, 1996). Therefore, we can neglect the correlation of the current J(t) with the occupancy
  at the initiation site. Moreover, the end-to-end distribution Weff arises from the statistics of the mRNA polymer configurations and is also assumed independent of both J(t) and
  The steady-state ribosome distribution can thus be found by setting ∂tP(r,t) = 0 on the left-hand side of Eq. 4 and taking the time, or ensemble, average of the remaining Poisson equation to obtain
 |
(5) |
where J ≡ 〈J(t)〉 is the steady-state current of ribosomes emanating from the termination end of the mRNA reentering the bulk ribosome pool, and C(r) = 〈P(r,t)〉 is the ensemble average of P(r).
The boundary condition for C(r) at the initiation site will depend on the occupancy of that site. When it is empty, there is a flux due to the microscopic adsorption step onto the first site. When  the bulk ribosome probability distribution will obey perfectly reflecting boundary conditions. Since the probability at r = a, P(r = a, t) depends on the occupation
 The mean concentration at r = a must be found by averaging the currents in the two states,
  and
and  When the initiation site is empty,
 |
(6) |
Since the steady-state current  when the initiation site is full, the averaged steady-state current is (Berg and Ehrenberg, 1983)
 |
(7) |
where (1 − σ1) is the fraction of time that the initiation site is unoccupied, ready to absorb a ribosome from the bulk. This probability is not directly dependent on the distribution Weff(r), but will depend on the time-averaged local concentration C(r), which in turn depends on Weff only through the distance of the source site at i = N.
The solution to Eq. 5, obeying the boundary conditions Eq. 6 and  is
is
 |
(8) |
where r is distance measured from the initiation site, and
 |
(9) |
is the associated Green function. In Eq. 9, r<(r>) is the smaller(larger) of |r|, |r′| and Yℓm(Ω) are the spherical harmonic functions of the solid angle Ω defined by the vector r (Arfken, 1985). The first two terms in Eq. 8 arise from the uniform concentration C∞ at infinity and the effects of a sink of radius a at the initiation site. The sink decreases the effective concentration to a level below that of C∞. The last term proportional to J increases the local concentration and is the result of the source (termination site) some finite distance away from the initiation site. If k → ∞, and ribosomes do not bind even when the initiation site is empty, the current J must vanish, and  as expected. However, one cannot simply consider the limit k → ∞ in Eq. 8 because k and σ1 are related through J, the current determined by the TASEP in the rest of the chain. This can be seen by considering the limit k → ∞. If the rest of the TASEP contains the rate-limiting step to ribosome throughput, making J very small, it will effectively block clearance of the initiation site, since all sites of the chain will be nearly occupied. In this case, σ1 ≈ 1 and k(1 − σ1) is small (despite a large k), and C(r) ≈ C∞, as expected. However, if the rest of the chain is not rate-limiting, and if clearance of the initiation site can occur fast enough, σ1 < 1 and k(1 − σ1) can be large. In this case,
  The TASEP current J will eventually be balanced with J = (1 − σ1)J0. Note that J is determined by Eq. 1 which in turn depends on the entry rate α (in other words, kC(a)). Thus, steady-state currents need to be self-consistently determined, since C(a) and σ1 are not parameters, but dynamical variables that will in turn be determined by setting J = (1 − σ1)J0. The analysis which uses Eq. 1 to find self-consistent explicit expressions for J will be presented in the Results and Discussion section.
Since the averaged bulk concentration profile is spherically symmetric about the initiation site, only the ℓ = m = 0 terms in the expression for G(r − r′) survive and
 |
(10) |
where
 |
(11) |
The surface concentration at the sink surface a is reduced from the bulk value by a factor of 1 + 4πaD/k, due to adsorption and diffusional depletion (Berg and Ehrenberg, 1983). However, part of this initiation site concentration is also replenished at a rate proportional to the flux J, due to the presence of a nearby termination (source) site. The effects of this replenishment are measured by the mean inverse separation 1/R. The harmonic distance, R, defines the effective distance felt by diffusing ribosomes as they make their way from the termination end back to the initiation site. This particular r−1 scaling is a consequence of the solution to Poisson's equation (Eq. 5) in three dimensions, and is related to the capture probability of diffusing ligands, as analyzed by Berg and Purcell (1977). Equation 10 contains two unknowns, C(a) and σ1. We can use the explicit solution Eq. 1 if we identify the injection rate α of the TASEP with the unoccupied initiation site current J0 = kC(a) ≡ α. Equation 1 then relates kC(a) to σ1. A second equation can be used by noticing that the flux itself must be balanced. Upon using J = kC(a)(1 − σ1) in Eq. 10, a second relationship between kC(a) and σ1 can be found. Substitution of the solution for kC(a) (in terms of experimentally known or controlled parameters k, C∞, a, R, and D) into Eq. 1 determines the self-consistent, steady-state ribosome current. This analysis, using the three different explicit forms of Eq. 1 (in the long chain limit) is presented in the Results and Discussion section.
End-to-end distribution Weff
We now find Weff(r) to compute R and obtain C(a). In some cases, the mRNA chain may be anchored to cellular scaffolding or ER membranes such that the initiation-termination separation is fixed. If one is interested in steady-state protein production over a period which allows little change in initiation-termination distance, Weff(r) = δ(r − R), and R = |R|. In other cases, the mRNA may be free to explore numerous conformations on the protein production timescale. Although it is possible that long mRNA strands may contain secondary structure, we will assume that ribosomes, as they move along the mRNA, melt out these structures. Although there is evidence that mRNA can contain small, local loops (Hagerman, 1985; Wang et al., 1997), it is less likely that they have larger-scale tertiary structure. Thus, we will estimate Weff and R with simple polymer models.
As shown in Fig. 2, the mRNA is comprised of three segments divided between two qualitatively distinct regions. Typical coding regions are ∼103 basepairs, corresponding to N ∼ 300. At low ribosome densities, the uncovered mRNA basepairs will be rather flexible, and the effective persistence length ℓ will be a local average between a and the 2- to 4-nucleotide persistence length ɛ of uncovered mRNA. Large reductions in the persistence length of dsDNA containing segments of single-stranded regions have also been observed by Mills et al. (1994). More sophisticated theories for variable persistence lengths can be straightforwardly incorporated; however, for simplicity, we approximate the persistence length in the coding region to be a uniform constant on the order of ℓ = a, the individual ribosome exclusion size. The contour length of the coding region is thus LN = Na with N ∼ 50–500. The untranslated regions, or UTRs between the initiation site and the binding factor (dark gray), and between the termination site and the loop-binding factor (yellow), with persistence lengths ɛ, have contour lengths of Lm = mɛ and Ln = nɛ, respectively. Typical Lm, Ln are on the order of 100 bases so that n, m ∼ 20–50. However, extremely long noncoding segments of order 1 kbp can exist (Mathews et al., 1996) where m, n ∼ 300. In what follows we will also neglect all the excluded volume effects of the remaining short ends of the mRNA chain.
As demonstrated by Wells et al. (1998) in Fig. 1 B, mRNA can form loops in the presence of binding proteins. Therefore, we expect that Weff(r) (and hence 1/R) will be a linear combination of W(r|open) and W(r|loop), the initiation-termination probability distributions in open and looped mRNA configurations, respectively. These configurations are shown in Fig. 4, A and B. For simplicity, we will use probability distributions associated with noninteracting (phantom) chains and approximate the distributions W(r) with both a freely jointed chain (FJC) and wormlike chain (WLC) models with appropriate persistence lengths ℓ. The finite-sized, short distance behavior of the W(r|open, loop) will be important for accurately computing 〈1/r〉. As we will see, W(r|loop) can be constructed from the more fundamental quantity W(r|open) (Liverpool and Edwards, 1995; Sokolov, 2002). Since we are eventually interested in either ribosome transport from termination to initiation or in activation/deactivation of initiation or release sites due to direct contact with the end proteins, we compute in the distance distribution W(r|open) in the state where site i = N is occupied and site i = 1 is unoccupied.
FIGURE 4.
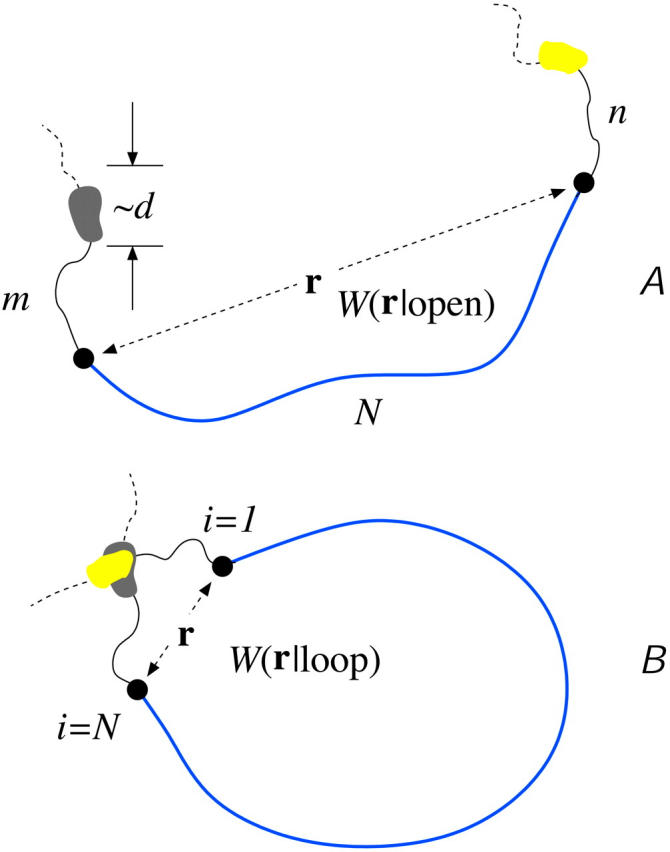
A schematic of the effects of loop forming factors. The coding region of the mRNA is blue (the ribosomes and the poly-A tail are not shown), the noncoding spacers of m and n persistence lengths ɛ are solid black, while the neglected short ends are dashed curves. The loop binding factors are of typical size d. (A) Nonlooped conformations in which the initiation-termination site distribution function is governed by W(r|open). (B) The initiation-termination distribution function in looped configurations is denoted W(r|loop). W(r|loop) is weighted more strongly at small |r| relative to W(r|open). For stronger attraction between loop binding factors the probability of loop formation increases, decreasing the effective distance R that ribosomes must diffuse to be recycled back to the initiation site.
Using the W(r|open) computed in , we can thus consider the contributions of looped configurations to the effective end-to-end distance distribution. The binding energy between the 5′-cap and poly(A) tail proteins, −U0 (in units of kBT), determines the probability that the chain is looped:
 |
(12) |
where the free energies of a closed and open mRNA chain are Gloop = −U0 − Sloop and Gopen = −Sopen, respectively. Since the ratio of the number of configurations under looped and open chain conditions is the ratio of probabilities of loop formation in the absence of head-tail interactions ( and
and
 |
(13) |
The probability, in the absence of loop-binding proteins, that the ends of a noninteracting chain would intersect itself within the interaction volume defined by a thin spherical shell of thickness δ (the binding interaction range), is approximately
 |
(14) |
where d is the typical size of the loop binding factors and  We have assumed the total radius of gyration LT ≫ a, and used a Gaussian chain as a qualitative approximation for the distributions used in the calculation of
  The conditional probability distribution W(r|loop) for a looped chain is
 |
(15) |
where Wℓ(r|open) denotes the single segment, open chain probability distributions in the two segments with persistence lengths ℓ = a,ɛ. For  the loop distribution given by Eq. 15 is qualitatively similar to the distribution function Wɛ(r|open) of the short segment of persistence length ɛ.
Using Eqs. 13–15 and C5, we construct the effective initiation-termination distance distribution
 |
(16) |
Weff(r) is plotted in (Fig. 11) for various U0. Qualitatively similar loop probability distributions have also been computed within the WLC model but without finite-sized molecules at the ends (Liverpool and Edwards, 1995). Here and in all subsequent analyses, we use the typical parameters ɛ/a = 0.2, d = a, and δ/a = 0.1. As U0 is increased, the distance distribution function switches over from W(r|open) to W(r|loop). The statistics of W(r|open) and W(r|loop) are governed by LN = Na and Lmn = (m + n)ɛ, respectively. The loop forming factors, since they are close to the initiation and termination sites (Lmn ≪ LN), enhance the probability that the ends are close to each other, particularly when the binding energy U0 is large.
FIGURE 11.
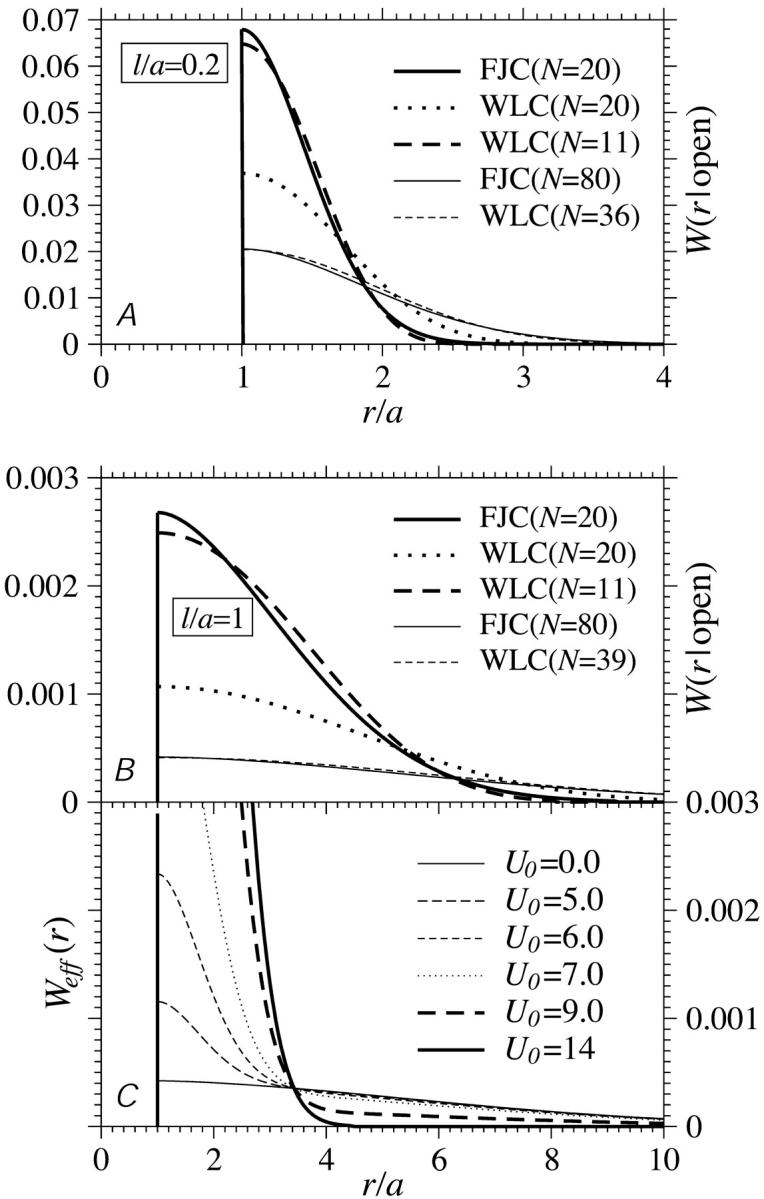
(A) FJC and WLC models for W(r|open) for ℓ/a = 0.2. The WLC distribution approximates that of the FJC if the effective number of persistence lengths N is reduced. This reduction compensates for the stiffness of the chain that tends to give more weight at larger distances. (B) FJC and WLC distributions for ℓ/a = 1. Note the heuristic cutoff applied to the WLC model at r = a. As expected, for equal N, the WLC model gives a typically larger separation and hence smaller a/R; however, a/R∝N−1/2 for N → ∞ in all cases. (C) The effective end-to-end distance distribution Weff constructed from W(r|open) via Eqs. 14 and 15.
The harmonic distance, R, determined using Weff is shown in Fig. 5, A and B, as functions of loop binding energy U0. The result given by the last line in Eq. 14, when used in Eqs. 13 and 16, qualitatively describes a crossover in Weff from W(r|open) to W(r|loop) behavior at
 |
(17) |
FIGURE 5.
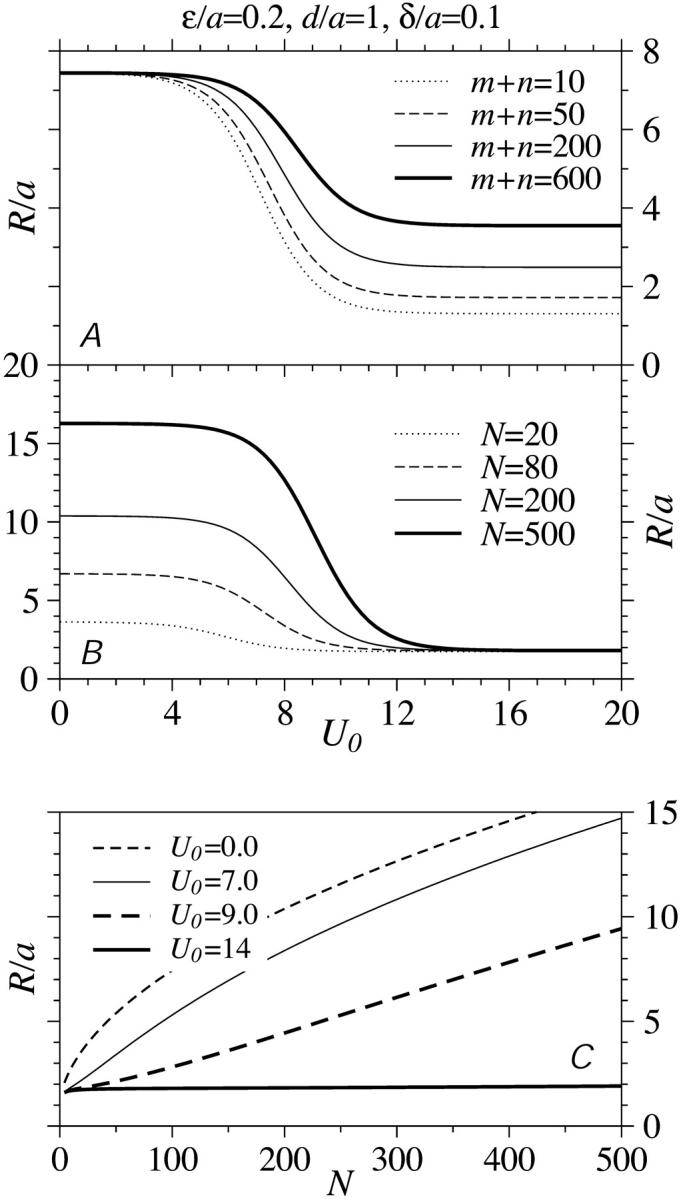
The effective diffusional distance or harmonic distance  over which recycled ribosomes must diffuse. (A) The dependence of R/a as a function of loop binding energy U0 is shown for N = 100 persistence lengths of coding mRNA. For large binding energies U0, the initiation and termination sites are brought closer together. The crossover between the end-to-end distribution function of a free chain to that of a loop occurs near
  Increasing the length of the short noncoding ends of the mRNA predominantly increases the typical distance R in the large U0, looped regime. (B) The N-dependence of R/a with the ratio of noncoding persistence lengths to coding persistence lengths (m + n)/N = 1/2. The N-dependence manifests itself primarily in the low U0, open chain regime. (C) The N dependence of R/a for various U0.
In Fig. 5 A, R/a is shown with N = 100, but at various noncoding lengths m + n. In the large binding strength limit, R/a depends only on the short distance (m + n)ɛ. When loops rarely form, the typical separation between initiation and termination sites can only depend on LN which is the only quantity varied in Fig. 5 B. Notice that the exact FJC solution (), or truncated WLC solution for W(r ≤ a|open) = 0 ensures that R/a > 1 for all values of m,n,N, and U0. The dependence of R/a on N is shown in Fig. 5 C for various U0. When U0 is small, the initiation-termination harmonic distance R is controlled by LN and increases as  For larger U0, the chain is partially bound into a loop where the distance is controlled by the much shorter Lm+n. The harmonic distance R remains small unless N becomes extremely large so that entropy can dominate and the loop ends can unbind.
We now couple our mathematical models by incorporating the Weff-weighted inverse harmonic distance a/R into the local, effective concentration C(a;R) given by Eq. 10. The effective injection rates α = kC(a) that control the translation rate within the steady-state TASEP are then self-consistently determined.
RESULTS AND DISCUSSION
Here, we compute the possible currents J and the parameter space in which each are valid. We will use the exact solution Eq. 1, or its three asymptotic forms (Eq. 3), as well as J = kC(a)(1 − σ1) in Eq. 10, to find all relevant quantities and parameter phase boundaries.
Substitution of J = kC(a)(1 − σ1) into Eq. 10 and solving for σ1, we find
 |
(18) |
Upon multiplying Eq. 18 by kC(a), we find
 |
(19) |
 |
 |
To find C(a) in terms of known parameters, we use the explicit solutions of the TASEP for the current J(kC(a), β, p) (Eq. 1 or 3) as indicated on the right-hand side of Eq. 19. The exact solution Eq. 1 yields an N + 2 order equation in kC(a) which we solve numerically. Only one of the N + 2 roots of Eq. 19 is real, yields occupations between zero and one, and is the physically relevant. The self-consistent solutions for kC(a) are used to evaluate J(kC(a), β, p), which are plotted in Fig. 6, A and B. As expected, shorter chains yield slightly higher current. Larger D also increases the current and makes the approximate maximal current phase obtainable at smaller kC∞/p. Asymptotic limits for the current near phase boundaries and at large N are given in .
FIGURE 6.

The numerically determined, steady-state currents at finite N. The self-consistent currents were found by numerically finding the roots to the polynomial in J obtained by substituting the last line of Eq. 19 into the exact Eq. 1. (A) Steady-state currents as a function of the injection rate kC∞/p for R/a = 3 and various  for
for  N = 10, and N = 50 are compared. (B) J as a function of length N for
  and kC∞/p = 0.3,1. The current is relatively insensitive to N for
The numerical solutions depicted in Fig. 1 show, that for even modest  the currents are accurately described by their asymptotic expressions in Eq. 3. Therefore, we can very accurately solve for kC(a) and steady-state ribosome currents by separately considering each phase and its associated asymptotic form of J.
First assume that the detachment rate β ≥ p/2 and consider the maximal current (phase III in the TASEP) where J = p/4. This occurs when both α, β > p/2. To determine the parameter regime in which J = p/4 holds, we solve for C(a) and determine for what range of parameters α = kC(a) > p/2. Using J = p/4 in Eq. 19, we find
 |
(20) |
The criterion for maximal current, k > p/(2C(a)), is thus
 |
(21) |
Upon solving Eq. 21 for k, we find the minimum k = k* required to achieve maximal current J = p/4:
 |
(22) |
Note that for large enough p/(4πaDC∞) the critical value k* can diverge. The divergence is more likely for larger R and occurs when there is simply not enough ribosome nearby to provide a large enough “on” rate α to achieve maximal current. Even when the source (termination end) is held at the initiation site (R = a), there is the possibility that k*, and maximal current, are never attained. This behavior arises because even for ribosomes released at an infinitely absorbing spherical initiation surface, there is a probability of escape (Berg and Purcell, 1977).
Next, let us consider small β and large α = kC(a). The mRNA has a high ribosome occupancy and a steady-state current J = β(1 − β/p). This regime (phase II) is termination rate-limited and occurs for β < p/2 and β < α = kC(a). Upon using J = β(1 − β/p) in Eq. 19,
 |
(23) |
The only physical range of β that satisfies Eq. 23 is
 |
(24) |
where  Equation 24 defines the phase boundary between the high-density, exit rate-limited phase II and the low-density, initiation rate-limited phase I. This phase boundary is plotted as a function of kC∞/p for fixed 4πaDC∞/p = 0.5 in Fig. 7 B. In the limit
  the phase boundary straightens as in the standard TASEP and is approximately
 |
(25) |
FIGURE 7.
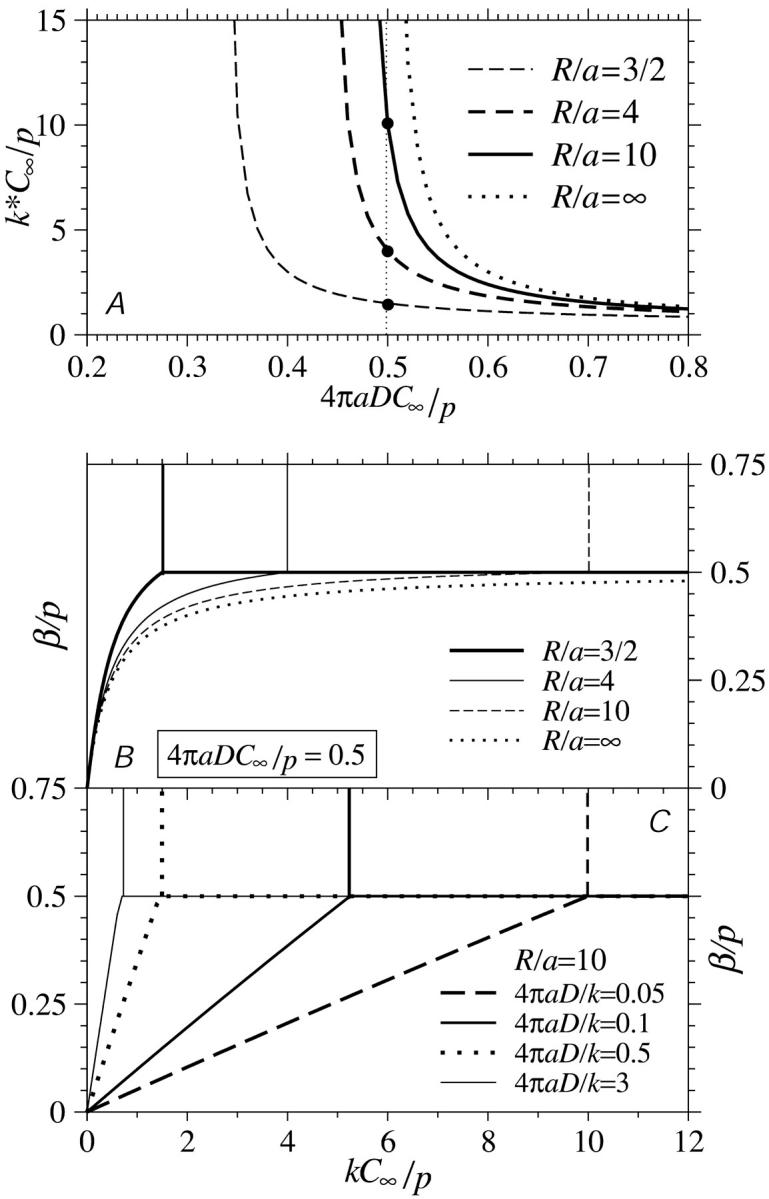
The modified phase diagram for translation rates along long (N → ∞) mRNAs. (A) The minimum binding rate (Eq. 22) required to support the maximal current phase assuming that β > 1/2. This value depends on the bulk ribosome concentration C∞ and the distance R between the initiation and termination sites. (B) The modified phase diagrams as functions of kC∞/p for 4πaDC∞/p = 0.5 and various R/a. (C) Modified phase diagrams as functions of kC∞/p for fixed  and R/a = 10.
Finally, when β > β*(k), but the entrance rate kC(a) is low (<p/2), a low density phase with J = α(1 − α/p) = kC(a)(1 − kC(a)/p) exists. The phase boundary delineating the low density phase I is defined by k < k* and β = β*(k). Upon using the current J = kC(a)(1 − kC(a)/p) in Eq. 19, we find kC(a) = β*, and the current in the initiation rate-limited phase I:
 |
(26) |
In the limit 
 |
(27) |
which reduces to the result one would expect from infinitely fast initiation site clearance.
Summarizing, the large N, steady-state ribosome currents (given by Eq. 1), in terms of ribosome concentrations and kinetic “on” rates, are
 |
(28) |
where kC(a) in phase I is expressed in terms of known parameters according to Eq. 19. The mean occupations of the initiation and termination sites, in each regime, can now be readily found. At the first site, σ1 = 1 − J/(kC(a)), where we use J = JL, JR, or Jmax (currents associated with each phase), and kC(a) found from Eqs. 19, 23, or 20. Similarly, the occupation at the last site is σN = J/β. All of our results can be expressed in terms of three of the four nondimensional parameters:  kC∞/p, 4πaDC∞/p, and R/a. We shall present our results in terms of the relevant nondimensional parameters appropriate for the discussion at hand. For example, if the binding rate k is controlled as an independent variable, we use kC∞/p, 4πaDC∞/p, and R/a as the governing parameters. If the bulk concentration and the diffusion constant are experimentally tuned, then our results should be expressed in terms of kC∞/p,
  and R/a.
Fig. 7 A shows the critical value k*, above which an N → ∞ TASEP is in the maximal current phase (provided β/p > 1/2). When C∞ is small and p is large, there is not enough ribosome in the cytoplasm to feed the initiation fast enough compared to the clearance rate p. Therefore the maximal current (J = p/4) arises only when the binding is efficient and k > k* is large. For smaller R (termination site close to the initiation site), smaller values of 4πaDC∞/p can still support maximal current. From Eq. 22, we see that when 4πaDC∞/p ≤ (1 − a/(2R))/2, the critical value k* diverges and the maximal current can never be reached. There is simply not enough ribosomes or the diffusion is too slow for there to be sufficient concentration at the initiation site to support the maximal current phase.
If the diffusion constants D and C∞ are chosen such that, for example, 4πaDC∞/p is small, the critical values k* vary considerably with R/a, as shown by the points (4πaDC∞/p = 1/2) in Fig. 7 A. The effects of depletion arise suddenly, with onset only at values of  For large R/a, values of 4πaDC∞/p ∼ 0.5 will render the critical k* values very sensitive to R. If the initiation site has an interaction size of a ∼ 10 nm, and p ∼ 2–3/s (20–30 codons/s; Kruger et al., 1998), a diffusion constant of D ∼ 10−8 cm2/s requires an effective concentration of C∞ ∼ 0.01 − 0.02 μM for the phase diagram to be sensitive to diffusional depletion and R. Although typical total cytoplasmic ribosome concentrations are C∞ ∼ 1 μM, many components must assemble to activate a translation-viable ribosome. For example, eIF4F exists at 0.01–0.2× the total ribosome concentration (Duncan et al., 1987). Furthermore, this already low abundance of eIF often needs to be further phosphorylated to be active. Thus, the effective concentrations C∞ (and even diffusion constants) appropriate for our model may very well be low enough to fall within the range for the phase boundaries to be extremely sensitive to diffusional effects.
Fig. 7, B and C, show the steady-state phase diagrams as functions of β/p and effective binding rate kC∞/p. In these phase diagrams, as in the unperturbed ones defined by Eq. 3, the upper-left region corresponds to a low density phase, the lower-right region corresponds to a high density phase, and the upper-right region describes a half-occupied (except near the ends i = 1,N), maximal current phase. The current J is constant throughout the maximal current phase and is not changed if kC∞/p or β is increased beyond k*C∞/p and 1/2, respectively. The phase diagram is modified by ribosome diffusion and depletion near the initiation site. The unmodified phase boundary between phases I and II of the TASEP (Eq. 3) would simply be defined by the straight line segment β/p = kC∞/p. The main effects of diffusional depletion (by the initiation sink) and replenishment (by the termination source) on the standard phase diagram Fig. 3 is to shift the low density-maximal current phase boundary to larger effective injection rates kC∞/p and bend the low density-high density phase boundaries accordingly. Fig. 7 B depicts the phase boundaries defined by Eqs. 22 and 24 for fixed R/a = 3/2,4,10, ∞, and fixed 4πaDC∞/p = 1/2 as indicated by the points in Fig. 7 A. In this example k*C∞/p = 3/2,4,10 for R/a = 3/2,4,10, respectively. Note that for R/a → ∞ that k* diverges and the maximal current phase is never attained. If 4πaDC∞/p < 1/2, then there will be a finite value of R/a such that k* diverges.
If, instead,  is held fixed, the phase boundaries are nearly straight, as shown in Fig. 7 C. Here, we fixed R/a = 10, and plotted the phase diagrams for
  The corresponding values of kC∞/p above which the maximal current phase is attained are
  and 79/120, respectively.
Our results up to this point are contingent on the fact that measurements are averaged over timescales such that the TASEP and the diffusion processes have reached steady state, and the mRNA chain distribution has thermally equilibrated. The possibility exists that the chain conformations are not in thermodynamic equilibrium while the TASEP and the bulk ribosome diffusion has reached steady state for a given chain conformation. Thus, although not relevant within each of the three well-defined physical processes, the issue of kinetic versus thermodynamic control of ribosome throughput arises when one considers measurements over timescales that are insufficient to allow equilibration of the mRNA chain. The consequences of this are discussed in the following section.
EXPERIMENTAL CONSEQUENCES AND PROPOSED MEASUREMENTS
The basic physical mechanisms described in our model for mRNA translation suggest a number of experimental tests. However, it must be emphasized that the model is meant to provide qualitative guidelines most useful for studying trends and how they depend on physical parameters. Translation occurring in vivo involve an enormous number of molecular species and biochemical processes to be quantitatively modeled, especially in the absence of significantly more detailed experimental findings. Nonetheless, our proposed mechanisms can be probed with carefully designed, simplified, in vitro experiments. Here, we discuss in detail the basic expected phenomena and their regimes of validity.
First note from Fig. 6, and from , that the exact currents for a finite number of codons N very rapidly approach the asymptotic values given by Eq. 3 as N increases. Even when N is only ∼10–50, the steady-state ribosome currents are only a few percent off the exact N = ∞ results. In other words, the exact solution Eq. 1 is a very good approximation to Eq. 3 for  Therefore, as a mental guide, it is typically sufficient to consider the currents J corresponding to an infinite chain (N = ∞) given by Eq. 3, but nonetheless consider a finite initiation-termination separation (measured by the harmonic distance R).
Polysomal density variations
Although we have focused on the steady-state current, the particle (ribosome) densities in each of the three current regimes are different and may be detected. In the TASEP model, the ribosome density profiles along the mRNA chain vary only near the initiation and termination ends. In the interior of the mRNA, the density is relatively uniform and are given by the last column in Eq. 3. In the exit-rate limited phase (small β/p), where J = β(1 − β/p), the midpoint density σN/2 ∼ 1 − β/p is high, whereas in the low injection rate case, J = α(1 − α/p), and σN/2 ∼ α/p is low. The typical density in the maximal current regime is σ ∼ 1/2. These densities are also approximately correct when one explicitly treats large ribosomes that occlude many codon “lattice sites.” Therefore, we might expect that one may be able to predict in which current regime translating mRNA exists if ribosome densities can be estimated from images taken with, e.g., AFM or electron micrograph techniques. For example, in Fig. 1 A, the high density of ribosomes suggests that the system is in phase II whereas the steady-state current J = β(1 − β/p) is a function only of the detachment rate β.
Kinetic binding rate and ribosome concentration dependences
Fig. 7 A shows the minimum effective attachment rate k*C∞/p necessary for a large system to be in the maximal current regime (where the ribosome current J ≈ p/4) as a function of the effective ribosome diffusion constant. An additional requirement is that the effective detachment rate β/p > 1/2. The value of k* can be tuned perhaps by substitution of the codons comprising the initiation sites, or by other physical means. Although ribosome diffusion constants are difficult to vary over a wide range (by modifying the solution viscosity), the critical k* is a very sensitive function of D, particularly for small D. It is thus possible that slightly increasing the ribosome diffusivity can dramatically decrease the k* necessary for the system to be in the maximal current regime.
As mentioned, changing the mRNA length N does not significantly affect the overall steady-state current along the chain (beyond about N ∼ 10–20) but it can change the statistics of the initiation-termination separation by changing R. Increasing the harmonic separation R has qualitatively the same effect as decreasing the ribosome diffusivity, since terminated ribosomes now have further to diffuse back to the initiation site. For
 |
(29) |
the maximal current regime is never reached. This can be easily seen from Eq. 22. Thus, rather than tuning the ribosome diffusivity, decreasing C∞ may preclude the system from entering the maximal current phase if Eq. 29 is satisfied. There is simply not enough ribosome available for sufficient initiation to be achieved so that the maximal current phase arises.
When Eq. 29 is not satisfied, the maximal current phase can exist. In Fig. 8 A, we replot the phase diagram corresponding to R/a = 10 shown in Fig. 7 C. Fixing the parameter 4πaDC∞/p = 0.6 allows k to be the only free parameter. This kinetic “on” rate k can be tuned by varying ribosome recruitment proteins such as eIF4E. If β/p > 1/2, C∞, D, and p are held constant, increasing k from a sufficiently small value allows one to traverse the trajectory S1. The steady-state ribosome current starts in the low density phase I with current given by Eq. 26. As k is increased, the steady-state current increases until it continuously crosses over into the maximal current regime (phase III), where the ribosome throughput is given by J = p/4. Further increasing k when inside the maximal current phase III will no longer affect the steady-state ribosome current. If, however, β/p < 1/2, the current behavior abruptly crosses over (along trajectory S2) from that given by Eq. 26 to J = β(1 − β/p) corresponding to the high ribosome density phase II. In this phase the detachment step is rate-limiting, and further increases in k will no longer affect the throughput.
FIGURE 8.

Large N phase diagrams for R/a = 10. (A) Phase diagram for fixed 4πaDC∞/p = 0.6 with trajectories S1,2 corresponding to increasing kinetic “on” rate k. (B) Phase diagram when  is fixed, and trajectories S3,4 correspond to increasing bulk ribosome concentration C∞. Trajectory S3 traverses the I–III phase boundaries for
  (thick curves) but not for
  (thin curves). Trajectory S4, on the other hand, traverses the I–II phase boundaries for both
If k is held fixed and the ribosome concentration is independently varied instead, it is more instructive to plot the phase diagram for fixed  and R/a, as shown in Fig. 8 B. Here, we choose the representative values R/a = 10 and
  and motivate parameter trajectories obtained by varying only C∞. For β/p > 1/2, increasing the bulk ribosome concentration traces out the trajectory S3 continuously from the low density phase I (Eq. 26) to the maximal current (J = p/4) phase. Further increasing the concentration well into the maximal current phase will no longer affect the throughput. Similarly, if β/p < 1/2, increasing C∞ can shift the behavior from that of the low density phase to that of the high density, exit-rate-limited phase. Alternatively, one may vary p, the mean elongation rate of individual ribosomes, by controlling the tRNA concentration in solution. For example, decreasing available tRNA will move the system from the lower left to upper right in Fig. 8 B, eventually reaching a steady-state current J = p/4.
Despite the apparent fundamental importance of the kinetic binding, or “on” rate in translation, there are no systematic and independent measurements of k in the literature. The required independent estimates of k may be achieved by perhaps combined kinetic and affinity measurements of the association of a minimal set of components, including only the ribosomes and a portion of the 5′ initiation codons and co-factors. For the “off” rate β, similar ideas can be employed. The tRNA or ribosome release factor concentrations for the last codon can also be adjusted to tune the “off” rate β.
Codon and UTR length dependences
In experiments where it is possible to vary the number of codons N, the typical harmonic distance R can also be tuned. The phase diagrams in Fig. 3, Fig. 7, B and C, and Fig. 8 all correspond to different regimes of Eq. 1 in the large N limit. In practice, Eq. 1 is no longer sensitive to N for  however, the harmonic distance R between initiation and termination sites continues to increase as
  affecting the local concentration C(a), and thus the effective parameter α = kC(a) in Eq. 1. As shown in Fig. 7 B, increasing R/a shifts the phase boundaries to the right, making the maximal current phase III harder to attain unless k or C∞ is concomitantly increased. However, due to the
  dependence, this effect would be relatively weak for all but enormous values of N. Hence we have chosen the qualitatively reasonable value R/a = 10 in Fig. 8, A and B.
Although there may be a weak increase in R/a as one increases the mRNA length, the effects of increasing the coded sections (N) or the noncoded sections (the untranslated regions m, n), can be different depending on U0. For large U0, looped configurations dominate and the distance between initiation and termination sites will be more sensitive to m + n, the shortest distance between them (compare to Fig. 4 B). The effect of lengthening m + n on R/a in the high U0 regime is clearly shown in Fig. 5 A. For small U0, open configurations dominate and the short segments m and n at the two ends do very little to affect R/a relative to N. Thus, although length dependences are expected to be weak, increasing the codon length N would more likely increase R/a (and hence decrease throughput J) in the small U0, or repulsive limit. Conversely, increasing m, n would more likely increase R/a when U0 is large and loops dominate the mRNA conformations.
Initiation-termination cooperative effects
We have so far considered only the effects of the binding energy U0 on loop formation, 1/R, and the resulting local ribosome concentration at the initiation site. However, evidence suggests that contact between elongation factor proteins and/or poly(A) tail proteins can enhance or suppress the kinetic binding rates k through direct molecular contact and cooperativity (Jackson, 1996; Munroe and Jacobson, 1990; Sachs et al., 1997; Sachs and Varani, 2000). There is the possibility that in looped states, PABs can interact with initiation machinery and modify k, and/or elongation factors can assist or hinder detachment of ribosomes at termination. Modification of k and/or β through direct contact between proteins associated near the initiation and termination sites may be an additional mechanism by which translation rates can span the regimes shown in Fig. 7, B and C, and Fig. 8. Qualitatively, the experimental finding that contact between the mRNA ends affects the initiation or possibly termination processes can be modeled by assuming effective “on” or “off” rates
 |
(30) |
where k0, β0, and k1, β1 are the binding and “off” rates when the mRNA is open and looped, respectively. As U0 is varied, both the intrinsic rates as well as the sink-source separation R are modified. Using Eq. 30 for k and β in Eqs. 22 and 24, the dependence of J on the binding energy U0 can be mapped. A number of qualitatively different scenarios are possible. If β0 = β1 but k1 > k0, the current is a monotonically increasing function of U0 because the binding rate increases and the ribosome source (3′ terminus) is brought closer. Both of these effects monotonically increase the steady-state current. However, if for fixed β, k1 < k0, then these two effects can partially balance each other and there is the possibility of a maximum in J(U0). A maximum occurs when initially, as U0 is increased, the decrement in keff cannot keep up with the enhancement in local ribosome concentration due to the increasing likelihood of loop formation (i.e., the shifting of the high current phase boundary to lower keff). However, if k1 is sufficiently small, keff eventually diminishes, such that one arrives at the low density, low current regime. These effects are illustrated in the sequence of Fig. 9, A–C. Since keff(U0) is considered the independent parameter, the current regimes are plotted for various 4πaDC∞/p. The steady-state current, self-consistently calculated from Eqs. 1, 19, and 30, has a possible maximum and is shown as a function of U0 in Fig. 9 D. Here, we have chosen k0C∞/p = 50, k1C∞/p = 0.3, β = 0.75, N = 100, m = 30, ɛ = 0.2, a = 1, and δ = 0.1. Only certain sets of parameters permit a maximum. Small values of 4πaDC∞/p and large N result in the largest maxima. For large values of 4πaDC∞/p, diffusion is fast, local ribosome concentrations are not significantly depleted by the initiation site, and the high current regime is already pushed to low values of kC∞/p. Therefore, increasing U0 and decreasing R does not further drive the high current regime toward significantly lower kC∞/p. For essentially the same reason, smaller N enhance ribosome recycling, increasing the current at low U0, thereby rendering the maximum in J to lower values of U0. As illustrated in the examples given in Fig. 9 D, increases of ∼50–60% above the background current are possible as U0 is varied. Thus, we see that the two processes, direct molecular catalysis of initiation and termination, and ribosome diffusional depletion, balance each other and may provide delicate control mechanisms during later stages of gene regulation.
FIGURE 9.
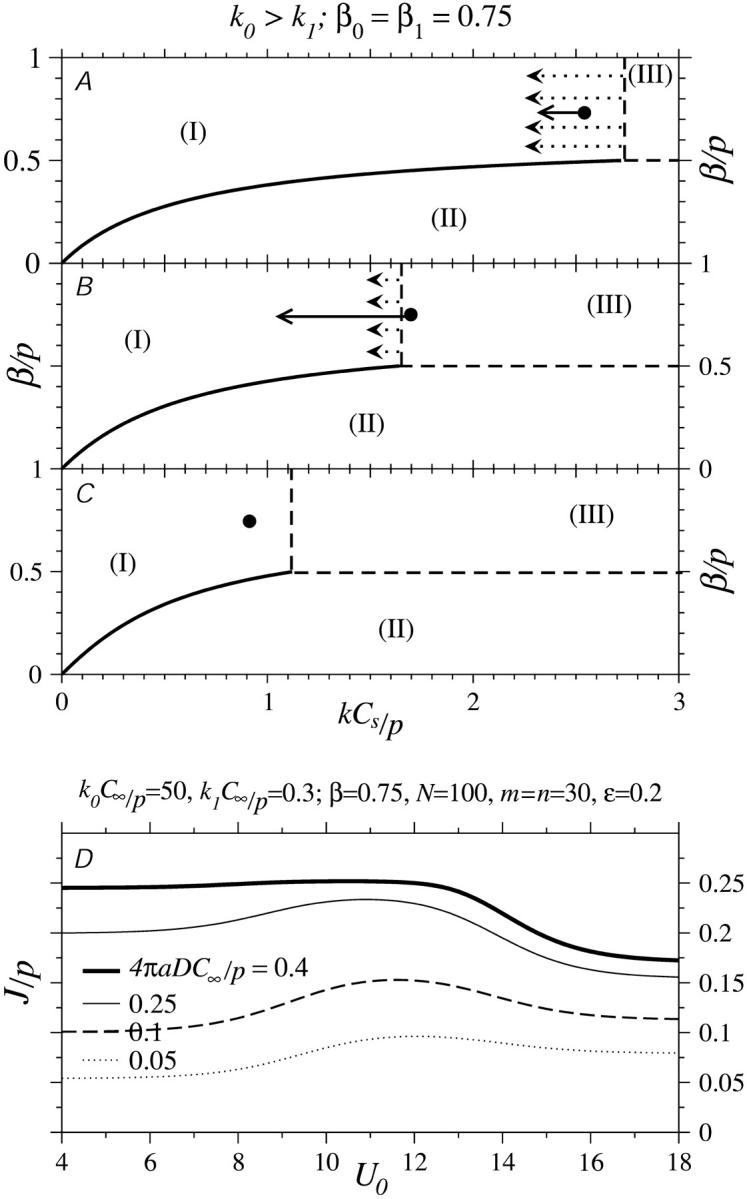
The current (Eq. 1) as a function of U0 when the ribosome “on” rate k can be modified by direct interactions with elongation factor and PAB proteins. The Gaussian chain approximation is used with persistence length ℓ = a. A–C show hypothetical, qualitative trajectories in the presence of a changing phase diagram. As U0 is increased, R decreases. With 4πaDC∞/p = 0.6 fixed, the phase boundaries shown in A–C correspond to R/a = 25,3,3/2, respectively. In addition, if k0 > k1, the effective binding rate keffC∞/p also decreases with increasing U0, resulting in the trajectories indicated by the dot. (D) Currents for k0C∞/p = 50, k1C∞/p = 0.3, and N = 100. The weak maximum appears only for small 4πaDC∞/p.
Kinetic versus thermodynamic control
Finally, we point out that our analysis has been confined to the steady state (for the bulk ribosome diffusion and individual ribosome movement along the mRNA) and thermodynamic equilibrium (for the statistics of the polymer statistics). Since it is possible for diffusion and ribosome elongation along the mRNA to reach steady state before the mRNA chain reaches conformational equilibrium (in the presence of loop-forming proteins), a possibility exists for kinetic versus thermodynamic control for the measured ribosome throughput. Although the loop-binding energy U0 determines the equilibrium distribution of open and closed mRNA conformations via Ploop, the kinetics of loop opening and closing are determined by energy activation barriers of the loop binding proteins. For example, if the activation energy for creating a looped state is high, the mRNA may sample only unlooped conformations on timescales of the steady state (with respect to the TASEP and diffusion). In this scenario, the effect of the loop binding protein does not arise and the harmonic distance 〈R〉 would appear to be that associated with an open chain (U0 → −∞ in Fig. 5, A and B). Conversely, if the mRNA chain happens to be in a looped conformation and the free energy barrier for dissociation of the loop is large, the measured current may be that corresponding to only a closed mRNA loop (mimicking the case U0 → ∞). This is likely to occur if the measurement time τ ≪ τdiss ∼ De−U*, where τdiss is the spontaneous dissociation time (or the Kramers escape time) and U* is the activation barrier energy/(kBT). The activation energy U* depends on the specific molecular details of the loop-forming proteins; however, measurements using fluorescence quenching can be used to independently determine the distribution of times the mRNA chain is looped or unlooped (Goddard et al., 2000). Only when U0 or U* are large does ribosome recycling get significantly enhanced by loop formation. Transient measurements, as well as fluctuations of the measured throughput, is beyond the scope of the article.
SUMMARY
We have constructed a simple model and road map for the possible physical effects at play during translation. The model incorporates driven diffusive motion which obeys exclusion statistics for ribosomes along mRNA. The initiation and termination sites are considered as sinks and sources of ribosome concentration, described by the steady-state diffusion equation (Laplace's equation). The average conformations of the mRNA chain define the typical initiation-termination distance which determines how the terminated ribosomes directly diffuse back to the initiation site and affect the local concentration there. This local concentration is a parameter (the injection rate) in the exclusion process, but also depends on the overall ribosome throughput (the strength of the sink and source). Thus, the current J needs to be solved self-consistently. Direct cooperative enhancement of kinetic binding and “off” rates were also incorporated. Although it is thought that the rate-limiting step is binding and initiation of ribosomes at the initiation site (Clemens, 1996; Mathews et al., 1996), the fact that polysomes have been found to exist in both high and low ribosome occupancy states suggests that under physiological conditions, steady-state ribosome fluxes can span the regimes defined by the phase diagrams depicted in Fig. 3 and Fig. 7, B and C. At high occupancy, the rate-limiting step is the off rate β which controls the steady-state flux (compare to phase II in Fig. 3). Ribosome depletion by the sink and replenishment by the source can drastically affect the constant k, β phase diagram, as shown in Fig. 7. The critical values of k*C∞/p that define the left boundary of the maximal current phase (in the N → ∞ limit) is most sensitive to the dimensionless parameter 4πaDC∞/p when 4πaDC∞/p ≃ 0.15 − 0.03. For sufficiently small 4πaDC∞/p, the effective injection rate cannot reach 1/2 and the maximal current phase cannot be attained. When N ≠ ∞, the explicit currents were computed from Eq. 1 and plotted in Fig. 6. Given the possibility of cooperative interactions in looped mRNA configurations, we have also found a maximum in ribosome throughput as a function of loop-binding energy U0.
Many molecular and chemical details have been neglected. As mentioned, we have ignored the fact that numerous components must assemble before initiation and have modeled only an effective rate-limiting component. The surface concentration parameter C(a) in our model would be an effective concentration reflecting the local density of ribosomes capable of initiation. Proposed mechanisms of ribosome scanning (Jackson, 1996), whereby ribosomes attach to segments of mRNA and undergo one-dimensional diffusion before encountering the initiation site, can be adequately modeled with the present approach if one assumes that the rate-limiting step is initial adsorption onto an mRNA segment. Furthermore, we have assumed that the ribosomes do not detach from the mRNA until they reach the termination site and that their forward hopping rates are uniform across the whole coding region. Finally, in our simple polymer model, we have neglected both self-avoidance (of both chain-chain and chain-ribosome exclusion) and the fact that the effective persistence length may vary along the mRNA, depending on the local ribosome density.
Despite these simplifying assumptions, we find that qualitatively, subtle control mechanisms can come into play, depending on biologically reasonable physical parameters. Although there are numerous experiments probing translation, both in vivo and in vitro, many different systems and physical conditions are employed, rendering quantitative comparison with measurements difficult. Nonetheless, our model suggests new measurements that can be used to qualitatively probe the various physical hypotheses and exhibit our predicted physical trends. For example, the effective C∞ can be varied in a number of ways to test with the predicted current regimes. Occupancy along the mRNA can also be correlated with the high, low, and intermediate density phases. Additionally, the noncoded regions between the elongation factors and the initiation site, and the termination site and the poly(A) tail-bound PAB, can be varied to test possible cooperative interactions defined by Eq. 30. Since the loop formation probability Ploop depends on the total statistical length LT, which is dominated by the length of the coding region (LNa2 ≫ (m + n)ɛ2), varying m and n would affect, through the likelihood of molecular contact in the looped states, only keff and βeff, respectively. The actual probability of loop formation Ploop, and hence R, would not be significantly affected. Chemical modification of the elongation factors or the PABs would affect U0, and hence keff, βeff, and R through Ploop. Using micromanipulation techniques (Bustamante et al., 2000), it might also be possible to fix the initiation-termination distance in vitro.
Numerous extensions to the presented models can be straightforwardly incorporated to more precisely model the chemical and microphysical processes. Codon and tRNA concentration-dependent variations in the internal transition rates p (Kruger et al., 1998), as well as random detachment processes, can be implemented using simple lattice simulations. Sites along the mRNA chain at which ribosomes pause can be treated as defects in a TASEP and the whole process can be treated with mean-field theory (Kolomeisky, 1998). Multiple coding regions in prokaryotic translation (Shine-Dalgarno sequences) can be modeled as a sequence of initiation (sinks) and termination (sources) sites. Similarly, cap-independent initiation at internal ribosome entry sites (Jackson, 1996, Martínez-Salas et al., 2001) can also be treated as sinks within our basic model. Translation of ER-associated mRNA further involve ribosomes that attach the mRNA at certain points on the ER membrane. In this case, one expects the density of cytoplasmic and ER-bound ribosomes to have a strong effect on localization of mRNA to ER and overall translation rates. One can also consider cases where the protein product itself is a ribosome component necessary for its self-translation; this process would result in initially autocatalytic protein production. Although these more complicated and interesting extensions have not been considered here, the simple models we have presented represent a first step toward the rich problem of identifying and quantifying the physical and biological mechanisms that control late stages of expression.
Acknowledgments
The author thanks S. Bump, T. Chang, D. Herschlag, G. Lakatos, E. Landaw, J. Rudnick, and M. Suchard for vital discussions and helpful suggestions. The author especially wishes to thank an anonymous reviewer for correcting an error in the original formulation of the adsorption boundary conditions.
This work was supported by the National Science Foundation through grant DMS-0206733.
APPENDIX A: PHYSICAL ASSUMPTIONS AND MATHEMATICAL APROXIMATIONS
Although our model arrives at a number of conclusions that are developed by combining three different physical theories, the assumptions and approximations used in each are well-developed in the condensed matter physics and biophysics literature. Here, we summarize the main physical assumptions and review the mathematical approximations used.
Steady-state and equilibrium assumptions
Ribosome diffusion and motion along the mRNA are treated within steady state, while the configurational distribution of the mRNA polymer is not directly coupled to ribosome diffusion or motion, and is considered in thermodynamic equilibrium. The inverse harmonic distance 1/R is determined from equilibrium mRNA configurational distributions, but parametrically influence the nonequilibrium steady-state processes of diffusion and the TASEP. Equilibration times of unentangled polymers and diffusion times over the length of the mRNA are on the order of milliseconds to seconds, whereas the relaxation to steady states in the TASEP occur over seconds to on the order of a couple minutes. Thus, on experimental timescales longer than these, transients in the ribosome throughput have dissipated, and the steady-state and equilibrium assumptions are appropriate. One might be tempted to formulate the specific mechanisms in terms of the common notions of reactions being kinetically or thermodynamically controlled. In this biochemical terminology, the TASEP is kinetically controlled, since the ribosomes take irreversible steps as each amino acid is added during elongation. The mRNA configurations, computed under equilibrium conditions, are by definition thermodynamically controlled. However, since each of the proposed mechanisms is a simple, single, independent process, the notion of kinetic control versus thermodynamic control is irrelevant. Within each mechanism, there are no alternate reaction paths or outcomes for kinetic or thermodynamic control to apply. However, it is possible that the mRNA conformations and the binding protein-mediated loop formation does not reach equilibrium on the timescale of measurements of ribosome throughput. This possibility is also discussed in the Experimental Consequences and Proposed Measurements section.
Gaussian chain polymer model for mRNA
Unlike tRNA, the coding regions of mRNA are relatively devoid of secondary structure. The single-stranded mRNA is treated using standard statistical physics of polymers that assumes nonintersecting random walks of step size defined by the polymer persistence length. For single-stranded mRNA without adsorbed proteins, the persistence length ≈2–3 bases. When loaded with large ribosomes, we assume that the persistence length is on the order of the ribosome size and that it is approximately uniform along the chain. Although the ribosome loading might vary slightly along the chain, this variation occurs only near the ends and does not appreciably affect the equilibrium end-to-end distributions. Although we treat only phantom (nonintersecting) polymers, effects due to the binding of finite-sized PABs and cap proteins are explicitly treated when computing the end-to-end distribution functions in the small distance regime where steric exclusion of the end proteins are important.
Single component ribosomes
The assembly of ribosomes before or during adsorption onto the initiation site can be modeled as an effectively single, rate-limiting component that undergoes standard diffusion in the bulk solution. Including more chemical details will not qualitatively alter our results, since in diffusive steady state, all species' concentrations would be spatially distributed as 1/R and parametrically affect the TASEP in the same qualitative manner.
Equal particle and step sizes
Ribosomes moving along mRNA are treated with a discrete TASEP where the step size is exactly equal to the particle diameter. However, ribosomes are large and occlude ∼10 codons so that they move one particle diameter only after q ≈ 10 steps (amino acid transfers). Nonetheless, the qualitative behavior of the currents for different q remain unchanged. For the sake of simplicity and clear analytic expressions (Eqs. 22, 24, and 26), we have restricted our analysis to q = 1. Exact large N asymptotic expressions for the steady-state current for general q are given in .
Uniform elongation step rates in the TASEP
The analytic solutions represented by Eqs. 1, 2, and 3 are based on uniform elongation rates p along the mRNA. It is known that p can vary by factors of 2–10 (Kruger et al., 1998), depending on the codon in question and the availability of the associated tRNA. As a first step, we have simply assumed a scenario in which the elongation rates do not vary appreciably over the coding region. More elaborate models that include specified elongation rates pi across the mRNA chain would require extensive simulations for each realization of {pi}.
Bulk diffusion limited adsorption
A ribosome, or the relevant rate-limiting component of a ribosome, diffuses in bulk and directly attaches to the initiation site. Capture of the ribosome by the initiation end of the mRNA may occur in a two-step process of nonspecific adsorption from bulk, followed by linear diffusion along a segment of the mRNA, before ultimately interacting specifically with the initiation site (von Hippel and Berg, 1989; Stanford et al., 2000). Although studied in the context of linear diffusion and search along DNA (Berg and Purcell, 1977), direct evidence for such scanning mechanisms in the initiation of mRNA translation has been hard to obtain (Jackson, 1996). For example, secondary structure in the form of small mRNA knots near the 5′ region must be melted before efficient ribosome scanning can occur (Kozak, 1989). Nevertheless, one-dimensional diffusion of ribosomes along the mRNA near the initiation sight is implicitly included in our model. The conjectured scanning mechanisms suggest that ribosomes scan locally near the start codon (Jackson, 1996; Wang et al., 1997). Thus, if ribosome recycling via diffusion through the bulk is rate-limiting, the scanning region near the initiation where the linear diffusion occurs can be considered as the binding region of larger effective capture radius a.
APPENDIX B: MEAN FIELD ANALYSIS FOR LARGE PARTICLES
Consider identical particles that are driven through a long one-dimensional lattice of L sites. The lattice is discretized into steps of unit length (a step size corresponding to a codon step), whereas the particles are of integer size q ≥ 1. For each particle to move a distance roughly equal to its diameter, q consecutive steps must be taken. Thus, we expect that effectively, the mean current would be approximately described by Eqs. 1 or 3 but with p replaced by p/q. A mean field model for the asymmetric exclusion process containing particles that occupy q substrate lattice sites (mRNA codons) has been solved. The analysis is beyond the scope of this article, but the resulting steady-state currents follow the same qualitative phase diagram (Fig. 3) as the TASEP with particles of size q = 1. That is, for large entrance and exit rates, there is a maximal current phase (III), bounded by low (I) and high (II) density phases. The effects of increasing the particle size to q > 1 only quantitatively changes the values of the currents in each of these phases, and can be straightforwardly integrated into the present study.
The general (for all particle sizes q) result for the steady-state currents in the infinite chain length limit are (Lakatos and Chou, 2003)
 |
(B1) |
These results have been verified to be exact (to within numerical precision) by extensive Monte Carlo simulations. Note that for large q, the maximal current Jmax is that given by Eq. 3 but with p → p/q. These results only serve to quantitatively shift the phase boundaries between the different current regimes and decrease the magnitude of the currents. For example, if q = 2, 3, the phase boundary between the low density and the maximal current regime occurs at α/p = 0.41, 0.37, respectively, rather than at 0.5. For the sake of simplicity and manageable algebraic expressions, we have in this study only considered the q = 1 case. Our analysis should be applied to the mRNA translation problem with the understanding that p in Eq. 3 and subsequent equations is roughly the rate for a ribosome to move its molecular size, not the rate for an individual tRNA transfer. If, however, the above expressions were used, then p in Eq. 31 would be identified with the typical single amino acid transfer rate.
APPENDIX C: OPEN CHAIN PROBABILITY DISTRIBUTIONS
Consider the probability distribution W(r|open) of the initiation-termination separation in the absence of loop formation. Since the ribosome can be much larger than the typical persistence length in the noncoding region of single-stranded mRNA, a ≫ ɛ. For a ∼ 10ɛ, a ≮< Lmn, unless the noncoding regions are very long, with m + n ≫ 100. For shorter noncoding regions, the expression for W(r;Lmn|open) must be evaluated more carefully, particularly for small r, to compute  correctly. Assume the termination site starts a random walk from any position on the sphere. Details of the different segments of mRNA are shown in Fig. 10. The problem maps to that of heat diffusion from a sphere of size a with reflecting boundary conditions and an instantaneous uniform temperature source on the surface. The probability that the initiation site (that is linked to the termination site via m + n persistence lengths) is within r of the sphere can also be described by the temperature near a sphere with an exterior instantaneous source of temperature. The diffusion equation for the probability distribution W(r;Lmn|open) ≡ W obeys
 |
(C1) |
where the thermal conductivity is associated with the squared persistence length, κ ↔ ɛ2/6, and time corresponds to the length t ↔ m + n. The initial and boundary conditions corresponding to a chain that originates from the surface of the otherwise impenetrable ribosome particle are
 |
(C2) |
where we have assumed spherical symmetry. Following Carslaw and Jaeger (1959), we define W(r,t) = f(r,t)/r to reduce (C1) to  with boundary conditions
 |
(C3) |
The solution for f(r, t) is found using Laplace transforms, and is
 |
(C4) |
The probability distribution is thus
 |
(C5) |
Note that if a/L ≪ 1, as it is for L = LN, Eq. C5 would be approximately
 |
(C6) |
which reduces to end-to-end probability distribution for a Gaussian random chain. However, since a/Lmn ≮< 1, we need to use the full expression Eq. 36 for the loop contribution (0 15) in the calculation of Weff(r) and 1/R.
FIGURE 10.

Schematic of the geometry near the initiation-termination end of a looped mRNA. The mRNA loop binding factors are shown in yellow and black, whereas a ribosome of radius a is situated at the initiation site (not drawn to scale). The values m and n correspond to the number of bases of the UTRs which are assumed to be relatively protein-free and have short persistence length ɛ. Here, the persistence lengths in the coding regions (thick curve, described by the TASEP) is ℓ ∼ a.
For the WLC, an approximate probability distribution function can be reconstructed from commonly used phenomenological force-extension relationships. If the force-extension interpolation given by Marko and Siggia (1995) is shifted to take into account the finite-sized origin,
 |
(C7) |
The initiation-termination distance distributions can be estimated using
 |
(C8) |
This end-to-end probability distribution from both FJC and WLC models are plotted in Fig. 11, A and B. The WLC model gives qualitatively similar distributions to those of the FJC model, provided the contour length is appropriately reduced. Furthermore, the WLC and FJC models provide qualitatively similar averages 〈a/r〉 if the N used in the WLC is sufficiently reduced. Upon using Eqs. 15 and 16, one can compute the effective end-to-end distribution of a chain with segments of different persistence length and with attached loop binding proteins, as shown in Fig. 11 C.
APPENDIX D: ASYMPTOTICS FOR JN
Asymptotic expressions for the steady-state current (Derrida et al., 1993) are valid only far from the phase boundaries. However, in our present model, we are interested in how a change in the mRNA length N allows the system to cross over from one behavior to another. For the sake of completeness, we derive limiting forms for the current JN near phase boundaries. An asymptotic expansion in the rates ∼α = 1/2 is taken first, with N fixed. From the exact expression Eq. 2 given by Derrida et al. (1993), we find the following asymptotic expansion
 |
(D1) |
For β > 1/2, and α = 1/2 + ɛ, we take the large N limit, but with  The resulting current across the maximal current-low density phase boundary is
 |
(D2) |
References
- Arfken, G. 1985. Mathematical Methods for Physicists. Academic Press, San Diego, CA.
- Berg, H. C., and E. M. Purcell. 1977. Physics of chemoreception. Biophys. J. 20:193–219. [DOI] [PMC free article] [PubMed] [Google Scholar]
- Berg, O. G., and M. Ehrenberg. 1983. Microscopic diffusion-reaction coupling in steady-state enzyme kinetics. Biophys. Chem. 17:13–28. [DOI] [PubMed] [Google Scholar]
- Bustamante, C., J. C. Macosko, and G. J. L. Wuite. 2000. Grabbing the cat by the tail: manipulating molecules one by one. Nat. Rev. Mol. Cell. Bio. 1:130–136. [DOI] [PubMed] [Google Scholar]
- Browder, L. W., C. A. Erickson, and W. R. Jeffery. 1991. Developmental Biology, 3rd ed. Saunders College Publishers, Philadelphia, PA.
- Carslaw, H. S., and J. C. Jaeger. 1959. Conduction of Heat in Solids. Clarendon Press, Oxford, UK.
- Chou, T. 1999. Kinetics and thermodynamics across single-file pores: solute permeability and rectified osmosis. J. Chem. Phys. 110:606–615. [Google Scholar]
- Chou, T., and D. Lohse. 1999. Entropy-driven pumping in zeolites and ion channels. Phys. Rev. Lett. 82:3552–3555. [Google Scholar]
- Clemens, M. J. 1996. Protein kinases that phosphorylate eIF2 and eIF2B, and their role in eukaryotic cell translation control. In Translational Control. J. W. B. Hershey, N. Sonenberg, and M. B. Mathews, editors. Cold Spring Harbor Press, Cold Spring Harbor, NY.
- Curtis, D., R. Lehmann, and P. D. Zamore. 1995. Translational regulation in development. Cell. 81:171–178. [DOI] [PubMed] [Google Scholar]
- Derrida, B., M. R. Evans, V. Hakim, and V. Pasquier. 1993. Exact solution of a 1D asymmetric exclusion model using a matrix formulation. J. Phys. A. 26:1493–1517. [Google Scholar]
- Derrida, B., and M. R. Evans. 1993. Exact correlation functions in an asymmetric exclusion model with open boundaries. J. Physique I. 3:311–322. [Google Scholar]
- Derrida, B., and M. R. Evans. 1997. The asymmetric exclusion model: exact results through a matrix approach. In Nonequilibrium Statistical Mechanics in One Dimension. Cambridge University Press, Cambridge, UK.
- Dubnau, J., and G. Struhl. 1996. RNA recognition and translational regulation by a homeodomain protein. Nature. 379:694–699. [DOI] [PubMed] [Google Scholar]
- Duncan, R., S. C. Milburn, and J. W. B. Hershey. 1987. Regulated phosphorylation and low abundance of HeLa cell initiation factor eIF4F suggest a role in translational control. J. Biol. Chem. 262:380–388. [PubMed] [Google Scholar]
- Dunn, T. M., S. Hahn, S. Ogden, and R. F. Schleif. 1984. An operator at −280 base pairs that is required for repression of araBAD operon promoter: addition of DNA helical turns between the operator and promoter cyclically hinders repression. Proc. Natl. Acad. Sci. USA. 81:5017–5020. [DOI] [PMC free article] [PubMed] [Google Scholar]
- Essler, F. H. L., and V. Rittenberg. 1996. Representations of the quadratic algebra and partially asymmetric diffusion with open boundaries. J. Phys. A. 29:3375–3407. [Google Scholar]
- Gallie, D. R. 1991. The cap and the poly(A) tail function synergistically to regulate mRNA translational efficiency. Genes Dev. 5:2108–2116. [DOI] [PubMed] [Google Scholar]
- Goddard, N. L., G. Bonnet, O. Krichevsky, and A. Libchaber. 2000. Sequence-dependent rigidity of single-stranded DNA. Phys. Rev. Lett. 85:2400–2403. [DOI] [PubMed] [Google Scholar]
- Guo, L., E. M. Allen, and W. A. Miller. 2001. Base-pairing between untranslated regions facilitates translation of uncapped, nonpolyadenylated viral RNA. Mol. Cell. 7:1103–1109. [DOI] [PubMed] [Google Scholar]
- Hagerman, P. J. 1985. Analysis of the ring-closure probabilities of isotropic wormlike chains: application to duplex DNA. Biopolymers. 24:1881–1897. [DOI] [PubMed] [Google Scholar]
- Hahn, K., J. Karger, and V. Kukla. 1996. Single-file diffusion observation. Phys. Rev. Lett. 76:2762–2765. [DOI] [PubMed] [Google Scholar]
- von Hippel, P. H., and O. G. Berg. 1989. Facilitated target location in biological systems. J. Biol. Chem. 264:675–678. [PubMed] [Google Scholar]
- Jackson, R. J. 1996. A comparative view of initiation site selection mechanisms. In Translational Control. J. W. B. Hershey, N. Sonenberg, and M. B. Mathews, editors. Cold Spring Harbor Press, Cold Spring Harbor, NY.
- Kolomeisky, A. B. 1998. Asymmetric simple exclusion model with local inhomogeneity. J. Phys. A. 31:1153–1164. [Google Scholar]
- Kruger, M. K., S. Pedersen, T. G. Hagervall, and M. A. Sorensen. 1998. The modification of the wobble base of tRNA(Glu) modulates the translation rate of glutamic acid codons in vivo. J. Mol. Biol. 284:621–631. [DOI] [PubMed] [Google Scholar]
- Kozak, M. 1989. Circumstances and mechanisms of inhibition of translation by secondary structure in eukaryotic mRNAs. Mol. Cell. Biol. 9:5134–5142. [DOI] [PMC free article] [PubMed] [Google Scholar]
- Lakatos, G., and T. Chou. 2003. Totally asymmetric exclusion processes with particles of arbitrary size. J. Phys. A. 36:2027–2041. [Google Scholar]
- Liverpool, T. B., and S. F. Edwards. 1995. Probability distribution of wormlike polymer loops. J. Chem. Phys. 103:6716–6719. [Google Scholar]
- MacDonald, C. T., J. H. Gibbs, and A. C. Pipkin. 1968. Kinetics of biopolymerization on nucleic acid templates. Biopolymers. 6:1–25. [DOI] [PubMed] [Google Scholar]
- MacDonald, C. T., and J. H. Gibbs. 1969. Concerning the kinetics of polypeptide synthesis on polyribosomes. Biopolymers. 7:707–725. [Google Scholar]
- Marko, J. F., and E. D. Siggia. 1995. Stretching DNA. Macromolecules. 28:8759–8770. [Google Scholar]
- Martínez-Salas, E., R. Ramos, E. Lafuente, and S. López de Quinto. 2001. Functional interactions in internal translation initiation directed by viral and cellular IRES elements. J. Gen. Virol. 82:973–984. [DOI] [PubMed] [Google Scholar]
- Mathews, M. B., N. Sonenberg, and J. W. B. Hershey. 1996. Origins and targets of translational control. In Translational Control. J. W. B. Hershey, N. Sonenberg, and M. B. Mathews, editors. Cold Spring Harbor Press, Cold Spring Harbor, NY.
- Michel, Y. M., D. Poncet, M. Piron, K. M. Kean, and A. M. Borman. 2000. Cap-poly(A) synergy in mammalian cell-free extracts: investigation of the requirements for poly(A)-mediated stimulation of translation initiation. J. Biol. Chem. 275:32268–32276. [DOI] [PubMed] [Google Scholar]
- Mills, J. B., J. P. Cooper, and P. J. Hagerman. 1994. Electrophoretic evidence that single-stranded regions of one or more nucleotides dramatically increase the flexibility of DNA. Biochemistry. 33:1797–1803. [DOI] [PubMed] [Google Scholar]
- Munroe, D., and A. Jacobson. 1990. mRNA poly(A) tail: A 3′ enhancer of translational initiation. Mol. Cell. Biol. 10:3441–3455. [DOI] [PMC free article] [PubMed] [Google Scholar]
- Preiss, T., and M. W. Hentze. 1999. From factors to mechanisms: translation and translational control in eukaryotes. Curr. Opin. Gen. Develop. 9:515–521. [DOI] [PubMed] [Google Scholar]
- Sachs, A. B. 1990. The role of poly(A) in the translation and stability of mRNA. Curr. Opin. Cell Biol. 2:1092–1098. [DOI] [PubMed] [Google Scholar]
- Sachs, A. B., P. Sarnow, and M. W. Hentze. 1997. Starting at the beginning, middle, and end: translation initiation in eukaryotes. Cell. 89:831–838. [DOI] [PubMed] [Google Scholar]
- Sachs, A. B., and G. Varani. 2000. Eukaryotic translation initiation: there are (at least) two sides to every story. Nat. Struct. Biol. 7:356–361. [DOI] [PubMed] [Google Scholar]
- Schreckenberg, M., A. Schadschneider, K. Nagel, and N. Ito. 1995. Discrete stochastic models for traffic flow. Phys. Rev. E. 51:2939–2949. [DOI] [PubMed] [Google Scholar]
- Schütz, G., and E. Domany. 1993. Phase transitions in an exactly soluble one-dimensional exclusion process. J. Stat. Phys. 72:277–296. [Google Scholar]
- Shaw, L. B., R. K. P. Zia, and K. H. Lee. 2003. Modeling, simulations, and analyses of protein synthesis: driven lattice gas with extended objects. Phys. Rev. E. In press.
- Sokolov, I. M. 2002. Cyclization of a polymer: a first passage problem for a non-Markovian process. Phys. Rev. Lett. 90:080601. [DOI] [PubMed] [Google Scholar]
- Stanford, N. P., M. D. Szczelkun, J. F. Marko, and S. E. Halford. 2000. One- and three-dimensional pathways for proteins to reach specific DNA sites. EMBO J. 19:6546–6557. [DOI] [PMC free article] [PubMed] [Google Scholar]
- Wang, S., K. S. Browning, and W. A. Miller. 1997. A viral sequence in the 3′-untranslated region mimics a 5′ cap in facilitating translation of uncapped mRNA. EMBO J. 16:4107–4116. [DOI] [PMC free article] [PubMed] [Google Scholar]
- Wells, S. E., P. E. Hillner, R. D. Vale, and A. B. Sachs. 1998. Circularization of mRNA by eukaryotic translation initiation factors. Mol. Cell. 2:135–140. [DOI] [PubMed] [Google Scholar]
- Wickens, M., J. Kimble, and S. Strickland. 1996. Translational control of developmental decisions. In Translational Control. J. W. B. Hershey, N. Sonenberg, and M. B. Mathews, editors. Cold Spring Harbor Press, Cold Spring Harbor, NY.
- Wyman, C., I. Rombel, A. K. North, C. Bustamante, and S. Kustu. 1997. Unusual oligomerization required for activity of NtrC, a bacterial enhancer-binding protein. Science. 275:1658–1661. [DOI] [PubMed] [Google Scholar]
- Zacharias, M., and P. J. Hagerman. 1996. The influence of symmetric internal loops on the flexibility of RNA. J. Mol. Biol. 96:276–289. [DOI] [PubMed] [Google Scholar]