Abstract
We investigate the isometric transient response of muscle using a quantitative stochastic model of the actomyosin cycle based on the swinging lever-arm hypothesis. We first consider a single pair of filaments, and show that when values of parameters such as the lever-arm displacement and the cross-bridge elasticity are chosen to provide effective energy transduction, the T2 curve (the tension recovered immediately after a step displacement) displays a region of negative slope. If filament compliance and the discrete nature of the binding sites are taken into account, the negative slope is diminished, but not eliminated. This implies that there is an instability in the dynamics of individual half sarcomeres. However, when the symmetric nature of whole sarcomeres is taken into account, filament rearrangement becomes important during the transient: as tension is recovered, some half sarcomeres lengthen whereas others shorten. This leads to a flat T2 curve, as observed experimentally. In addition, we investigate the isotonic transient response and show that for a range of parameter values the model displays damped oscillations, as recently observed in experiments on single muscle fibers. We conclude that it is essential to consider the collective dynamics of many sarcomeres, rather than the dynamics of a single pair of filaments, when interpreting the transient response of muscle.
INTRODUCTION
The transient response of muscle to a sudden adjustment of its extension, or to an abrupt change in load, has been one of the most important sources of information about the mechanism of contraction for over three decades. Ever since the pioneering work of Huxley and Simmons (1971), experimental data on transients has informed theoretical models of the interaction between myosin and actin (Huxley and Simmons, 1971; Hill, 1974; Eisenberg et al., 1980; Chen and Brenner, 1993; Huxley, 2000), providing a more detailed picture than could be obtained from the force-velocity relation (Hill, 1939; Huxley, 1957) alone. The reason is that the actomyosin interaction involves several processes which occur on different timescales, and these individual components can be resolved during the transient response (Huxley and Simmons, 1971; Ford et al., 1977, 1985, 1986; Brenner, 1991; Brenner et al., 1995). The quickest process is the elastic deformation of the myosin cross-bridges that link the thick and thin filaments. Rapid transitions between two or more different bound states of the myosin molecule are thought to be the next fastest events, whereas detachment and reattachment of myosin heads occur on a slower timescale.
In an experiment to determine the isometric transient response, a muscle fiber is held at both ends to prevent it from contracting. The muscle is then suddenly shortened (or stretched) by a fixed amount, and the tension T that it generates is measured. Immediately after the imposed change of length, the tension shifts from the isometric value T0 to a new value, which is termed T1. But shortly afterwards (typically within 2 ms), the tension adjusts to a new value, termed T2. Subsequently, it gradually reverts to the original isometric value T0, and the entire transient response is usually completed in a fraction of a second. It is generally accepted that the initial response T1 corresponds to the mechanical deformation of cross-bridges and provides a direct measure of their elasticity (Huxley and Simmons, 1971). The interpretation of T2 is rather more controversial. It is often attributed to force generation by the working stroke of bound myosin molecules (Huxley and Simmons, 1971; Hill, 1974; Eisenberg et al., 1980; Huxley and Tideswell, 1996; Brenner et al., 1995; Duke, 1999, 2000) and this interpretation has recently gained support from x-ray interference techniques applied to shortening fibers (Irving et al., 2000; Piazzesi et al., 2002b). But alternative models suggest that the force regeneration might be due, in part, to the rapid binding of new myosin heads to the thin filament (Brenner, 1991; Howard, 2001), or that it might involve the activation of the second myosin head (Huxley and Tideswell, 1997).
In this article, we wish to address a fundamental problem connected with the interpretation of force transients. The present theories are all based on the consideration of a single pair of filaments, i.e., one filament containing myosin molecules, interacting with one actin filament. The dynamics of this filament pair is generalized to that of a whole muscle fiber by assuming that all filament pairs in a fiber behave in exactly the same way. This assumption is certainly justified as long as there are no static or dynamic instabilities in the system. However, the possibility of such instabilities has been known for a long time (Hill, 1974). Moreover, a stochastic model of the actomyosin cycle, based on the swinging lever-arm hypothesis, has shown that instabilities do arise when values of parameters such as the lever-arm displacement and the cross-bridge elasticity are chosen to provide effective energy transduction (Duke, 1999, 2000). Such instabilities would give rise to a region of negative slope in the T2 curve of a single filament pair. Several reasons have been advanced for the absence of any negative slope in the experimentally determined T2 curve. Huxley and Simmons (1971) argued that the power stroke is subdivided into several small steps, and fixed the step size so that the T2 curve had zero slope for limitingly small changes of length. In the model proposed by Eisenberg et al. (1980), the flatness of the T2 curve was explained by a broad distribution of cross-bridge strain after attachment, combined with a specific strain dependence of the transition rates to ensure the proper occupancies of the two bound states. A further explanation involved the compliance of the filaments and the distribution of binding sites on the thin filament in addition to a subdivided power stroke (Huxley and Tideswell, 1996). Duke (1999) has suggested that the flat T2 curve of a muscle fiber can arise despite an instability in the dynamics of a single pair of filaments, owing to the symmetry of a sarcomere. We investigate this possibility further in this article.
METHODS
Simulation of the stochastic evolution of the system was performed using the Gillespie kinetic Monte Carlo algorithm, which works as follows. In each simulation step the rates of all possible transitions are calculated. The time until the next event is chosen as a random number with an exponential distribution and the expectation value given by the inverse of the sum of all rates. The event itself is chosen randomly with a statistical weight proportional to its rate. In the situations with stiff (noncompliant) filaments and continuous binding sites the transition rates can be factorized into factors that depend only on the backbone position (which are the same for all motors in a group) and factors that only depend on the binding position of a motor (which does not change with time unless that motor undergoes a transition). This allowed us to use a very efficient (n log n) algorithm based on binary trees.
We assumed complete mechanical relaxation of the system in each step, i.e., the strain of all elastic elements is equilibrated before the next transition takes place. The structure involving sarcomeres, filaments, and myosin heads was described as a circuit of elements with given resting lengths and compliances. The strain of every cross-bridge was calculated, given the constraint of fixed total length of the system (isometric conditions), or of fixed force acting on the ends of the system (isotonic conditions).
The T2 transients were always determined 2 ms after the stretch/release. All other parameter values are summarized in Table 1.
TABLE 1.
Model parameters
| Cross-bridge spring constant | K | 2.5 (1.5*) pN/nm |
| Power stroke | D | 8 nm |
| δ | 0.328 nm | |
| Free energy gain | ΔGstroke | 60 pN nm |
| Transition rates | kbind | 40 s−1 |
| kunbind | 2 s−1 | |
| k1→2 | 1000 s−1 | |
| k−ADP | 80 s−1 | |
| Thermal energy | kBT | 4.14 pN nm |
| Dimensionless parameters | ɛ0 = Kd2/2kBT | 19.3 (11.6*) |
| ɛ1 = Kd2/2ΔGstroke | 1.33 (0.8*) | |
| ɛ2 = Kdδ/kBT | 1.6 (0.95*) | |
| γ1 = k−ADP/kbind | 2 | |
| γ2 = kunbind/kbind | 0.05 | |
| Spacing between binding sites | c | 5.5 nm |
| Effective lateral cross-bridge bending stiffness | KA | 15 pN nm |
| Actin elasticity | γ | 44,000 pN |
The numbers in parentheses show an alternative parameter set, corresponding to the oscillating case.
MOTORS ACTING BETWEEN A SINGLE PAIR OF FILAMENTS
Isometric transient in a swinging lever-arm model
We model the chemical cycle of a myosin head as described in Duke (1999, 2000) and shown in Fig. 1. A molecule can exist in either a detached state (D) or in one of the attached states, A1 (with ADP·Pi) or A2 (with ADP). The state A1 is also referred to as the weak-binding state (Brenner, 1991). The chemical transition between states A1 and A2 is concomittant with a conformational change of the molecule, in which the lever arm moves through displacement d. From state A2 the head undergoes another conformational change with a lever-arm shift δ, associated with ADP release. In the ATP-rich physiological environment, this step is quickly followed by detachment of the head and we therefore skip the transitional state (A3) in our model. The attachment and detachment rates, which are summarized in Table 1, determine the shape of the force-velocity relation, but have little influence on the transient response to length steps, which mainly depend on the power-stroke displacement d and the elastic constant K of the myosin cross-bridge. We assume that the transitions A1 ↔ A2 take place on a faster timescale than the detachment and reattachment of heads. Therefore, once a head has bound with strain ξ in the state A1, its state can be described as a statistical ensemble of the states A1 and A2 with probabilities given by the Boltzmann factors
 |
(1) |
and P1(ξ) = Δ−P2(ξ), where ΔGstroke is the free energy change associated with phosphate release.
FIGURE 1.
Reaction scheme for a myosin head. The dashed lines represent transitions which are considered sufficiently slow to be neglected in the calculation.
Now consider a filament containing N myosin motors interacting with an actin filament which is held to prevent it from sliding. If NA heads are bound to the actin with a distribution of strains Φ(ξ) (normalized to 1), then the isometric force that they generate is
 |
(2) |
If a stretch Δx is suddenly applied to the pair of filaments, the force will first change to
 |
(3) |
as the cross-bridges are deformed. In the next instance, transitions between states A1 and A2 occur and the probability distribution reequilibrates to P2(ξ + Δx). As a result the force adjusts to
 |
(4) |
As a first approximation, we can neglect the distribution of strains and assume ξ = 0 for all myosin heads, which allows us to calculate the T2 curves analytically. Their shape depends on two dimensionless parameters,
 |
(5) |
 |
(6) |
which provide a measure of the energy stored in the elastic element when the head performs a power stroke (A1 → A2). The parmeter ɛ0 measures this energy relative to the thermal energy, while ɛ1 compares it to the magnitude of the chemical free-energy change ΔGstroke that accompanies the power-stroke transition. Note that if ɛ1 < 1, the power stroke can occur immediately after the myosin head binds to the thin filament; but if ɛ1 > 1, the conformational change is energetically inhibited initially, and it is only likely to occur once the thin filament has been moved forward by the action of other motors. On grounds of efficiency of energy transduction, we expect the value of ɛ1 to be as high as possible, while ensuring that there is sufficient chemical energy to drive the power stroke, i.e., ɛ1 ≈ 1 (Duke, 1999). The power-stroke displacement d has been measured directly in a number of single-molecule experiments, and the values obtained range between 5 and 10 nm (reviewed by Tyska and Warshaw, 2002). Data on the cross-bridge elasticity K are less reliable, because there are inevitably other sources of compliance in the system (Veigel et al., 1998). But indirect evidence is provided by the energetic efficiency of muscle, which peaks at ∼50% (Kushmerick and Davies, 1969; Barclay, 1998; Piazzesi et al., 2002a). Thus a lower estimate for the energy stored in the elastic element after the power stroke is one-half the free-energy change accompanying the hydrolysis of an ATP molecule ΔGATP ≈ 20 kBT, which leads to ɛ0 ≳ 10. Taking into account that not all energy stored in the spring can be converted to mechanical work one obtains a better estimate ɛ0 ≈ 20 (Duke, 1999) (which is consistent with ɛ1 ≈ 1 if most of the energy of hydrolysis is used to power the stroke ΔGstroke ≈ ΔGATP). This corresponds to an elastic constant K = 2.5 pN/nm if a power-stroke distance of d = 8 nm is assumed.
The form of the T2 curve depends critically on the values of these dimensionless parameters. If ɛ0 > 2, an interval with a negative slope (a hysteresis) exists (Hill, 1974). This means that under isotonic (constant load) conditions the system can be bistable. The location of the interval of negative slope depends on the value of ɛ1. If the hysteresis spans the origin, then the state with Δx = 0 will be unstable under isotonic conditions. Putting  we see that this occurs if
 |
(7) |
With a value of ɛ1 ≈ 1 the T2 curve always has a negative slope around the stationary point. For example, with ɛ0 = 20, Eq. 7 yields 0.85 < ɛ1 < 1.22. However, it should be borne in mind that this calculation does not take into account the distribution of strains on cross-bridges within the ensemble, and so the actual range might deviate slightly from this estimate.
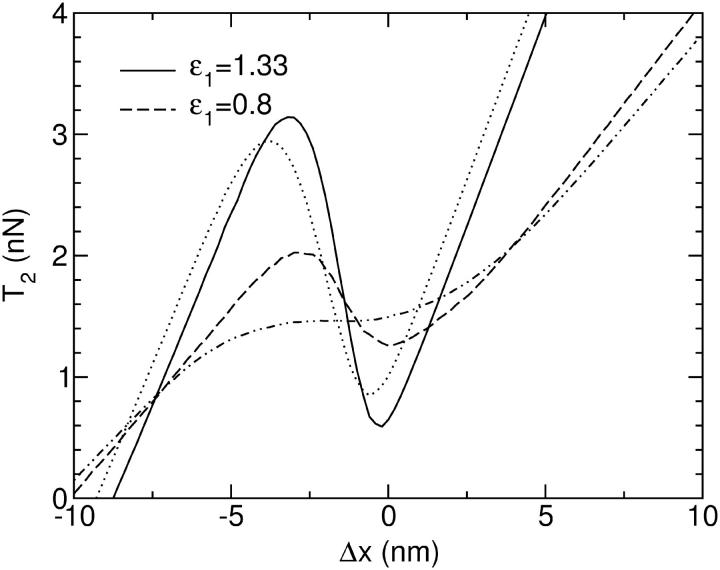
An example of the T2 transient for a group of myosin heads between two firmly clamped filaments is shown in Fig. 2.
FIGURE 2.
The T2 transient response to a sudden extension Δx for a group of 300 motors in the isometric state for two different values of the parameter ɛ1. The dotted and the dashed-dotted lines shows the response of a group of motors which are pulling against an elastic element instead of being completely isometric before the length step (although the length step is then imposed on the motors alone, without the elastic element). For each value of ɛ1, values of the other parameters are listed in Table 1.
Group of stiffly coupled motors under near-isometric conditions
For a single pair of filaments, true isometric conditions imply that both filaments are held fixed. However, experimental conditions are usually near isometric, in that the average velocity is zero, but the filaments still have the freedom to move. This situation occurs, for example, if both filaments are held at their ends by a flexible spring (in which case the motors cause the filaments to slide until the stall force is reached), or if the filaments suffer a constant load which is precisely adjusted to prevent net sliding. In this case the conditions are actually isotonic (or nearly so) and the instability discussed in the previous section implies that there is no steady state of the system with zero velocity when Eq. 7 is satisfied. Instead, as shown in Fig. 3, the pair of filaments oscillates in near-isometric conditions. The mechanism that generates the oscillations is the following. An ensemble of bound motors pulling against a constant load has two stable configurations: one with a majority of motors in state A2, the other with the majority in state A1. Because the detachment of motors is faster from state A2 than from state A1, the total number of bound motors decreases when the system is in the first configuration. As a result, the load per motor increases until the remaining motors cannot support the load any more, whereupon the system flips into the second configuration. Subsequently, the number of bound motors starts to grow again, and when the load per motor falls below a critical level the system flips back to the first configuration. Repetition of the cycle gives rise to an oscillation whose asymmetry reflects the differences in attachment and detachment rates.
FIGURE 3.
(A) A group of motors pulling against a spring. The curve shows the spring extension y as a function of time t. When the motors reach stall the average velocity is zero, but fast oscillations occur on the length scale of the power stroke. The observed oscillations are characteristic of the case where the criterion in Eq. 7 is fulfilled. The simulation involved 300 motors pulling on an elastic element with spring constant Kext = 10 pN/nm, using the alternative parameter set listed in Table 1. (B and C) The mechanism of oscillations: (1) When the majority of bound motors are in state A2, the average detachment rate is higher than the attachment rate, which leads to a fall in the number of attached motors (2). The force per bound motor, shown in B, therefore increases. When the upper limit of the hysteresis is reached, the system abruptly jumps to the other fixed point in which most bound motors are in the state A1 (3). Because the detachment rate is low in the state A1, the number of bound motors increases again (4) whereby the average force per bound motor drops. This eventually leads to a transition back to the fixed point in which most motors are in state A2 (1), at which point the oscillation cycle repeats.
Could the isometric transient be modified if it is measured in near-isometric conditions, instead of exactly isometric conditions? Fig. 2 shows the average T2 response in the situation where the filaments are held at the ends by an external spring. In the nonoscillating case (ɛ1 = 1.33, dashed line) the difference between this T2 curve and the one in the strictly isometric state is only quantitative. The most important result is that the range of negative slope in T2 remains. On the other hand, in the oscillating case (ɛ1 = 0.8, dot-dashed line) the negative slope is flattened out because of the broader distribution of strains on cross-bridges.
Effect of filament elasticity
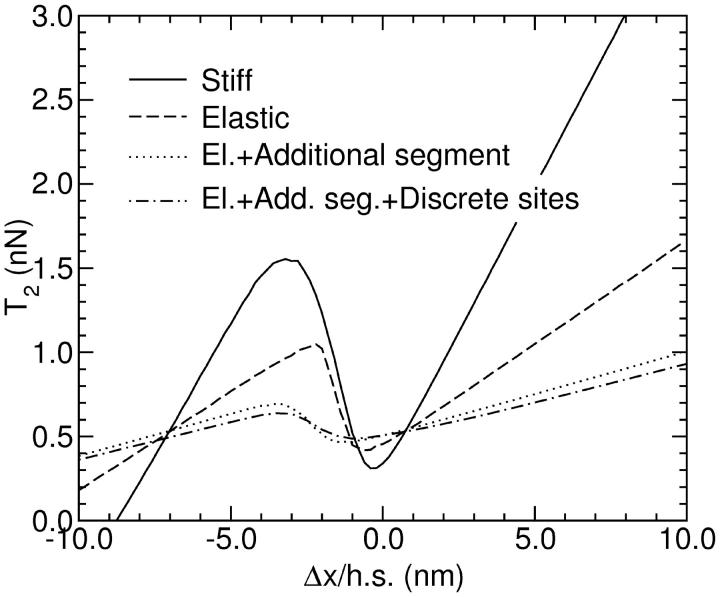
The compliance of the thick and thin filaments is also expected to affect the T2 curves. We model it by introducing a linear elasticity in the backbone connecting the heads (which is, to first order, equivalent to an elasticity in the track the motors are running on) (Vilfan et al., 1998). With γ being the linear modulus of the filaments, which has the measured value γ = 44,000 pN (Kojima et al., 1994), the spring constant of a filament segment of length L is Kf = L−1γ. In (Vilfan et al., 1998) a linear two-state model was used to study the effect of filament elasticity on force-velocity relations, showing that they reduce the isometric force if the compliance of a filament segment between two bound motors becomes comparable to the motor spring constant K. Thin filaments are just stiff enough to prevent significant losses due to this effect. However, the filament compliance can have a significantly bigger effect on the transient response. The result of a simulation is shown in Fig. 4. Although the filament compliance almost halves the total stiffness of the system, it leaves the major part of the interval of negative slope unaffected.
FIGURE 4.
T2 curves for a stiff (solid line) and an elastic (dashed line) filament. The simulations were performed with a group of N = 150 myosin heads, attached to a filament of a total length 1000 nm and elasticity γ = 44,000 pN. The dotted line was obtained when an additional segment of length 500 nm of free actin between the clamp and the active part was taken into account. The dot-dashed line shows the same situation, but additionally taking into account discrete binding sites on actin. In the latter case the binding rate kbind = 100 s−1 was adjusted to give a realistic fraction of attached heads in the isometric state, therefore γ1 = 0.8 and γ2 = 0.125. All these effects together are still not able to completely cancel the negative slope.
Effect of discrete binding sites
So far we have assumed that a myosin head can bind anywhere on the actin filament with equal probability. However, in reality the binding sites on actin are c = 5.5 nm apart. In addition, the actin filament has a helical structure with a half pitch of ∼38 nm (7 monomers). We therefore propose that the binding rate to a particular site is proportional to the Boltzmann factor determined by the spring distortion energy, composed of a longitudinal and a lateral component
 |
(8) |
with ξ = x − (i + 7j)c and  where j denotes the repeat on the helix and i the consecutive number of the actin monomer. The total binding rate at a given position x then reads
 |
(9) |
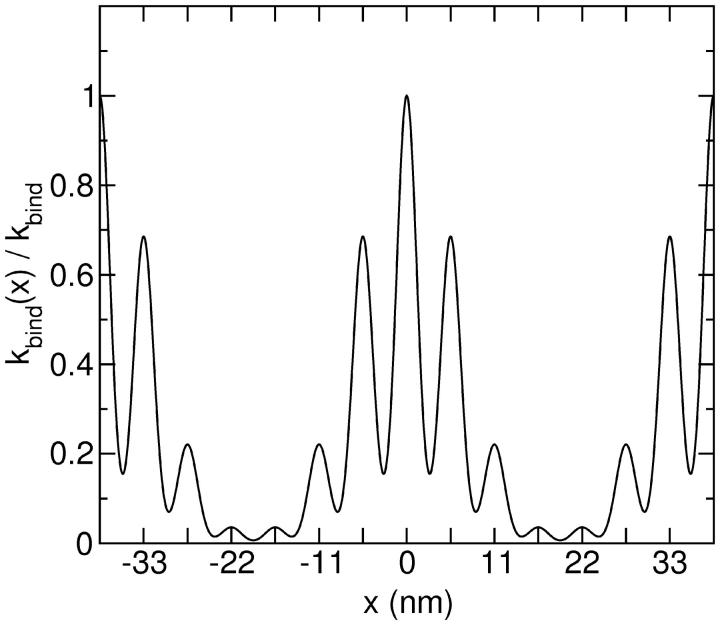
These curves have been measured experimentally using S1 myosin heads by Steffen et al. (2001) and the data were fitted with KA = 15 pN/nm, the value which we use here. The position dependence of the binding rate for these parameters is shown in Fig. 5. A similar distribution has also been measured for myosin V (Veigel et al., 2002).
FIGURE 5.
The binding rate kbind(x)/kbind of a myosin head as a function of its position along the actin filament. The longitudinal spring constant was K = 2.5 pN/nm and the lateral spring constant was KA = 15 pN nm.
The dot-dashed line in Fig. 4 shows the T2 response when taking into account discrete binding sites and the elasticity of actin filaments. As noted by Huxley and Tideswell (1996), both the filament compliance and the discrete binding sites contribute to the flattening of the T2 curve. However, our simulation indicates that their combined effect is not sufficient to cancel the negative slope with the parameters used here. We therefore conclude that the absence of negative slope in the measured T2 curves cannot be explained in terms of a single-filament model, but requires taking into account the action of serially connected sarcomeres.
MOTORS IN MUSCLE SARCOMERES
Redistribution of filaments
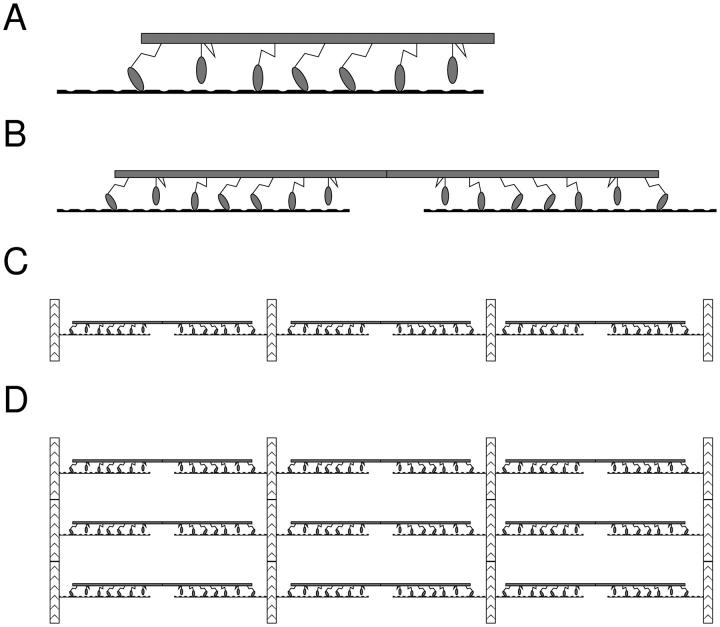
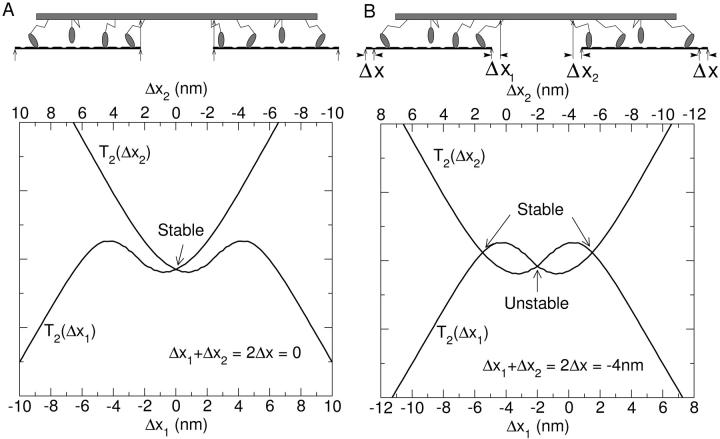
The situation changes essentially if we take into account that the experiments are performed on whole muscle fibers, where several hundreds of sarcomeres are connected in series, as shown in Fig. 6 D. The tension in each half sarcomere must be the same, but the extension of each half sarcomere can differ, provided that their sum equals the total stretch of the muscle fiber. To see what happens in this situation, it is instructive first to look at a minimum unit consisting of two filament pairs, joined back to back as shown in Fig. 6 B. This unit represents two thin filaments and a thick filament, the basic building block of a sarcomere. A sudden stretch of the unit will first displace both halves equally, according to the elasticity of cross-bridges. But in the next phase, when the distribution of states A1 and A2 equilibrates, the position of the thick filament can become unstable. This means that a slight fluctuation in one direction will cause the motors pulling the thick filament in that direction to increase their force and those on the other side to decrease it, and the thick filament will jump sideways to one of the stable points. A schematic example is shown in Fig. 7.
FIGURE 6.
(A) A single actin filament interacting with a single myosin filament. (B) A pair of actin filaments, interacting with a myosin filament. (C) n = 3 pairs of actin filaments, connected in series. (D) A musclelike structure with n = 3 sarcomeres connected in series and each sarcomere containing p = 3 thick filaments, connected in parallel via the Z-discs.
FIGURE 7.
The force-displacement relations of the left and the right half of a myosin filament before (A) and after (B) a length step. The sum of their displacements must equal the total sarcomere stretch, Δx1 + Δx2 = 2Δx. This condition is imposed by plotting the force-displacement relation of one set of motors as a function of Δx1 (x axis) and that of the other set as a function of Δx2 = 2Δx − Δx1 (upper x axis). The forces on the myosin filament are in equilibrium if the forces produced on both sides (T2(Δx1) and T2(Δx2)) are equal, which is given by the intersection of both curves. The equilibrium is stable if the first curve crosses the second from below and unstable if it crosses it from above. If there are three stationary points (B), the central one is always unstable and those to either side stable. The force-displacement relation of the two-filament unit is given by the force at the stable intersection as a function of the mean displacement Δx.
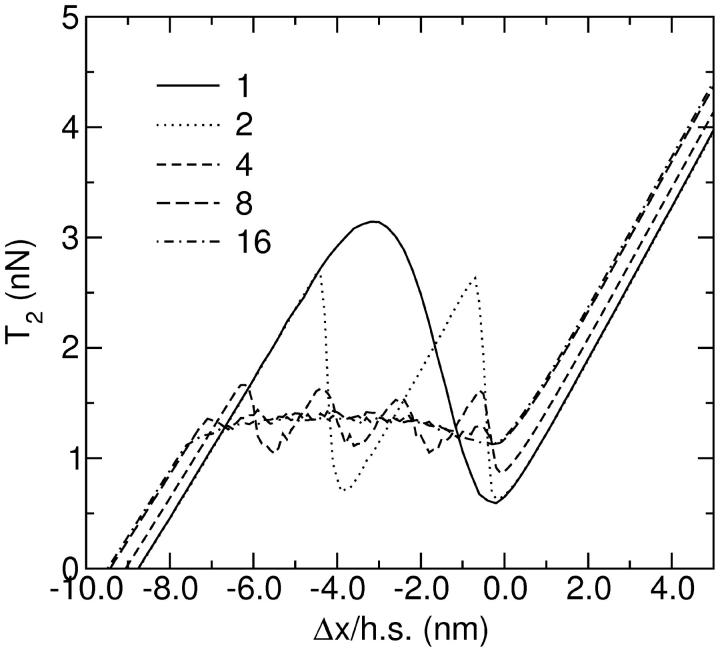
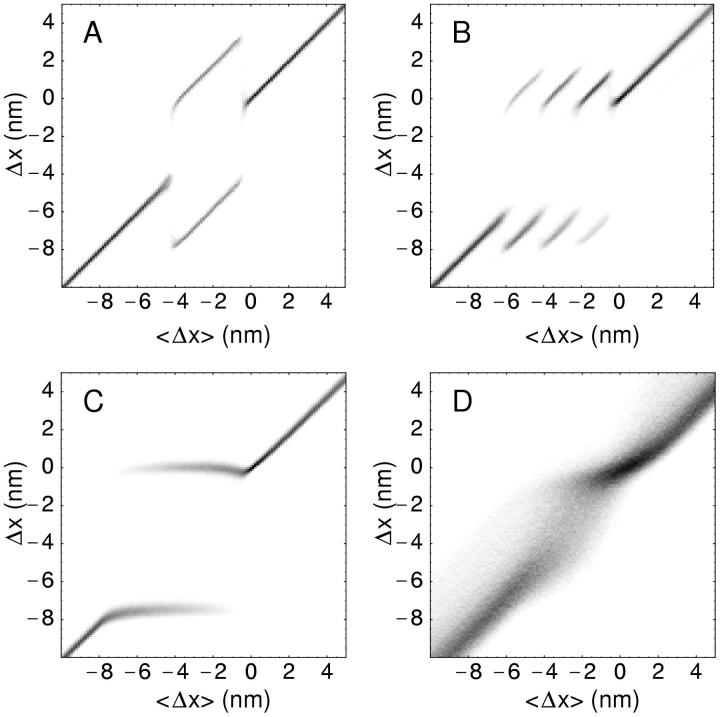
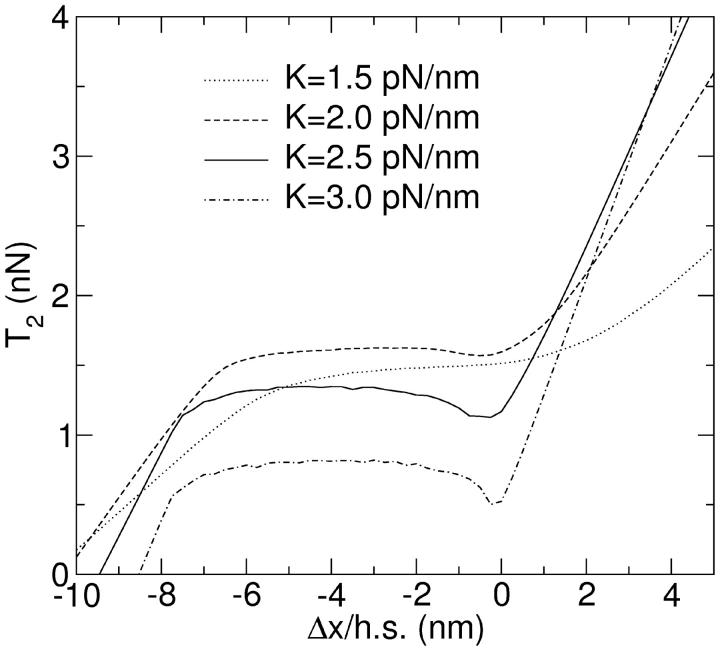
The result of a simulation using different numbers of filament pairs, connected in series (the situation illustrated in Fig. 6 C), is shown in Fig. 8. The interval of negative slope is increasingly flattened out as the number of pairs increases. Apart from the cancellation of the hysteresis, a shift in the curves is also observable, corresponding to the transition between the strictly isometric conditions and those where a filament is held under isotonic conditions before the stretch, cf. Fig. 2. The effect of redistribution can best be seen if one plots the distribution of stretches of individual half sarcomeres against the total stretch per half sarcomere (Fig. 9). For large stretch amplitudes the distribution is concentrated on the diagonal, in agreement with the expectation that all filaments experience the same stretch. For two filament pairs in series, the distribution splits in the intermediate range. The two peaks represent two stretches for which the single-filament T2 curves produce the same force. Their position is determined by the condition that the average stretch must equal the value on the x axis. With four filament pairs in series, a similar situation occurs, but with three different regimes. First three out of four pairs get displaced in one direction whereas the fourth is displaced in the other direction. Then this ratio changes to two against two and finally to one against three, before the regime with all filaments being subject to the same displacement settles in. With higher numbers of filaments in series (Fig. 9 C shows the situation for 32) this pattern becomes increasingly continuous. In the regime where the negative slope stretches over the isometric point, the individual filaments perform small oscillations (Fig. 3) while the whole muscle is held at a constant length. These oscillations blur the distribution further (Fig. 9 D). T2 curves for four different values of K are shown in Fig. 10.
FIGURE 8.
The T2 response of a single actin-myosin filament pair, compared with 2, 4, 8, and 16 filament pairs in series. Each myosin filament contains 300 heads.
FIGURE 9.
Plot showing the probability density of transient stretches of individual half sarcomeres (y axis) against the total stretch per half sarcomere. The three plots were obtained for (A) 2, (B) 4 and (C) 32 filament pairs in series, each containing N = 300 motors. (D) shows a simulation with 32 filament pairs and ɛ1 = 0.8, in which spontaneous oscillations of individual filaments take place, thereby blurring the individual shifts.
FIGURE 10.
T2 curves with filament redistribution. The simulations were performed with n = 16 filament pairs in series, each containing N = 300 myosin motors. Different curves show data for different values of the cross-bridge elasticity K, corresponding to values of ɛ1 between 0.8 and 1.6, and ɛ0 between 11.6 and 23.2.
Isometric state
It is instructive to take a closer look at the parameters of the globally isometric state (by globally we mean that the total length of a fiber composed of many sarcomeres is constant, rather than the positions of individual filaments) in the two cases: one where the individual filaments oscillate and one where their positions just fluctuate. All data were determined in a situation where a large number (32 in the simulation) of filament pairs were connected in series and the total length held constant (situation C in Fig. 6). One expects the oscillating filaments to consume more ATP than the nonoscillating filaments. The results are summarized in Table 2. An exact comparison with experimental data is difficult, because the fraction of attached heads in the isometric state is not known reliably, and also because the experiments were carried out at different temperatures and with different types of myosin. For example, the value measured by Barsotti and Ferenczi (1988), 0.4 ATP molecules per second per head (with 25% of the heads attached this gives 1.6 s−1 per attached head), is compatible with the first scenario. However, other measurements give higher values (Ebus and Stienen, 1996), more consistent with the second case. We therefore conclude that from the experimental values of the ATPase rate in the isometric state neither scenario can be excluded.
TABLE 2.
The parameters of the globally isometric state in the nonoscillating and the oscillating case
| Nonoscillating | Oscillating | |
|---|---|---|
| Elastic constant | K = 2.5 pN/nm | K = 1.5 pN/nm |
| ɛ0 | 19.3 | 11.6 |
| ɛ1 | 1.33 | 0.8 |
| ɛ2 | 1.6 | 0.95 |
| Fraction heads attached | 92% | 68% |
| Heads in state A2/attached heads | 3.5% | 32% |
| Force/attached heads | 4.8 pN | 7.4 pN |
| ATPase/attached heads | 1.7 s−1 | 17.4 s−1 |
At high values of ɛ1, the model shows an interesting feature. In the isometric state the number of cross-bridges in the state A2 can be very low, although the generated force per attached cross-bridge is as high as 5 pN, in agreement with single-filament measurements (Kawai et al., 2000). This allows the muscle to support a load under isometric conditions with little ATP consumption (Duke, 2000). It might at first sound paradoxical that most of the isometric force is generated by the prepower-stroke state A1. This is possible because the myosin heads bind with a stochastic distribution of strains. Because those with a negative strain are more likely to undergo the power stroke and then detach, the remaining ensemble produces a positive force. In this aspect, the power-stroke actually serves to eliminate negatively strained cross-bridges rather than direct generation of positive force. This notion is in agreement with recent experiments, which have shown that high phosphate concentration does reduce the isometric force significantly (Cooke and Pate, 1985), but it does not have a visible effect on the conformation of the myosin heads or even their catalytic domains (Baker et al., 1999). But let us stress again that this holds only for the isometric state. The force in a contracting muscle originates mainly from the state A2.
Isotonic response
Another important class of experiments which provides information on the actomyosin interation involves the isotonic transient. Here the applied force is initially set at the value of the stalling load T0, so that the fiber is prevented from contracting. The force is then suddenly changed and held constant at a different value, while the length of the fiber is recorded. Some early experiments showed that after a small step change of load, damped oscillations were imposed on the steady contraction or extension of the fiber (Podolsky, 1960; Granzier et al., 1990). Such oscillations are particularly clear in recent experiments on single muscle fibers (Edman and Curtin, 2001).
One possible cause of this oscillatory response has previously been suggested on the basis of the stochastic model of the actomyosin interaction used in this article. When ɛ1 > 1, the chemical cycles of myosin motors on the same filament can become synchronized at loads close to the stalling force (Duke, 1999, 2000). A pair of filaments then slides in a step-wise fashion under isotonic conditions. But during steady shortening, the motors on different filaments within the same muscle fiber operate out of phase, so that there is no macroscopic manifestation of the steps. However, an abrupt change in the load can cause the synchronization of a large fraction of the bound motors, whereupon the steps do become observable (Duke, 1999). Because the correlation of the motors soon decays, the macroscopic steps fade and a damped oscillation is seen.
A much stronger oscillatory response is seen in the regime where individual pairs of filaments perform oscillations in the near-isometric state (Fig. 3). The synchronized oscillations can then be very pronounced after a small decrease in the load, as shown in Fig. 11 A. On the other hand, no damped oscillations are observed after a larger drop in the load, e.g. to T0/3 (Fig. 11 B), because the individual filament pairs immediately move out of the hysteretic regime. These properties are in agreement with recent experiments on the isotonic response of single muscle fibers carried out by Edman and Curtin (2001).
FIGURE 11.
The isotonic transient response of a sarcomeric structure to: (A) a small drop, (B) a large drop, and (C) a rise in the load, when the initial value of the load is chosen precisely to stall the contraction. The upper graph shows the force per myosin filament as a function of time. The lower graph displays the length change per half sarcomere and the number of attached myosin heads per myosin filament, which is a measure of the fiber stiffness. The data were computed with N = 300, ɛ1 = 0.8 and with 50 myosin filaments acting in parallel. The results were averaged over 125 events (which has the same effect as simulating that number of sarcomeres in series). A small drop in the load synchronizes the cross-bridges and therefore causes observable macroscopic oscillations (A). The oscillations are less pronounced, but still visible after a small increase in the load (C).
In steady isotonic conditions, another kind of instability can arise due to a hysteresis in the force-velocity relationship. The possibility of such an instability was first discussed in the context of a two-state ratchet model (Jülicher and Prost, 1995) and subsequently in a kinetic cross-bridge model with a strain-dependent detachment rate (Vilfan et al., 1999). With the parameters we use, this hysteresis covers a rather small range of velocities and only results in a small inflexion in the force-velocity curve (Duke, 1999, 2000).
DISCUSSION
In the past, the isometric transient model of muscle has been modeled by considering the dynamics of a single pair of filaments. A significant problem with this approach is that, with a general choice of parameters in a cross-bridge model, the T2 curve is not flat (Hill, 1974); it typically has either a positive or a negative slope for limitingly small step displacements. Thus, in order to reproduce the experimental T2 curve of muscle, some of the parameters have needed to be finely adjusted (Huxley and Simmons, 1971; Eisenberg et al., 1980), and limitations have been imposed on the size d of the power stroke and the rigidity K of the cross-bridges (Huxley and Tideswell, 1996). In this article we have investigated the isometric transient response using a stochastic model of the actomyosin cycle. When values of the parameters d and K are chosen to explain other characteristics of muscle, like the force-velocity relation and the efficiency of energy transduction, the T2 curve of a single pair of filaments displays a region of negative slope, which cannot be eliminated by factors including filament compliance and the discrete nature of the binding sites on the actin filament. However, we argue that the symmetric structure of sarcomeres must be taken into consideration when computing the isometric transient response of muscle. After a step change of length of a muscle fiber, a redistribution of sarcomere lengths occurs within the fiber. Some half sarcomeres contract, whereas others extend. This redistribution always eliminates the negative slope, leading to a flat T2 curve. It is a generic feature of unstable elements connected in series, and does not require any special values of model parameters.
Our model shows that there are two different regimes of the microscopic dynamics in near-isometric conditions. For a range of values of the parameter ɛ1 close to unity, the isometric point falls in the interval where the slope of the T2 curve is negative. In this case individual filament pairs oscillate with small amplitude. In the other regime, where the T2 curve has positive slope at the isometric point, the individual filaments are stationary, apart from stochastic fluctuations. The macroscopic manifestations of these two regimes differ in few respects. Because the oscillations of different filament pairs have different phases, oscillatory motion is not normally observable on the scale of a whole muscle fiber in steady conditions. However, a sudden change of load can synchronize the oscillations and thereby make them visible. The existence of damped oscillations in the isotonic transient response of single muscle fibers (Edman and Curtin, 2001) therefore argues in favor of the oscillating regime. We note, however, that damped oscillations can also be a manifestation of step-wise shortening (Duke, 1999), which can exist in both regimes. Because the efficient transduction of energy demands ɛ1 ≈ 1, which is close to value of this parameter at the boundary of the two regimes, it is possible that both regimes exist depending on conditions such as the myosin isoform, phosphate concentration, pH, ionic strength and temperature. Indeed, measurements by Edman and Curtin (2001) show a dependence of the oscillation decay on the solution pH and on muscle fatigue. Further experiments, in which conditions are systematically varied, could shed more light on the mechanism of oscillation.
As a final remark, we emphasize that according to our model, the T2 curve of an individual pair of filaments differs from that of a muscle fiber. Recently, assays have been developed to measure the force-velocity relation of a single filament within a half sarcomere (Kawai et al., 2000). In order to test our predictions, it would worthwhile to develop such high-precision techniques to measure the transient response of a single filament.
Acknowledgments
A.V. acknowledges support from the European Union through a Marie Curie Fellowship (No. HPMFCT-2000-00522) and from the Slovenian Office of Science (Grant No. Z1-4509-0106-02). T.D. acknowledges support from the Royal Society.
Andrej Vilfan's present address is J. Stefan Institute, Jamova 39, 1000 Ljubljana, Slovenia.
References
- Baker, J. E., L. E. LaConte, I. Brust-Mascher, and D. D. Thomas. 1999. Mechanochemical coupling in spin-labeled, active, isometric muscle. Biophys. J. 77:2657–2664. [DOI] [PMC free article] [PubMed] [Google Scholar]
- Barclay, C. J. 1998. Estimation of cross-bridge stiffness from maximum thermodynamic efficiency. J. Muscle Res. Cell Motil. 19:855–864. [DOI] [PubMed] [Google Scholar]
- Barsotti, R. J., and M. A. Ferenczi. 1988. Kinetics of ATP hydrolysis and tension production in skinned cardiac muscle of the guinea pig. J. Biol. Chem. 263:16750–16756. [PubMed] [Google Scholar]
- Brenner, B. 1991. Rapid dissociation and reassociation of actomyosin cross-bridges during force generation:a newly observed facet of cross-bridge action in muscle. Proc. Natl. Acad. Sci. USA. 88:10490–10494. [DOI] [PMC free article] [PubMed] [Google Scholar]
- Brenner, B., J. M. Chalovich, and L. C. Yu. 1995. Distinct molecular processes associated with isometric force generation and rapid tension recovery after quick release. Biophys. J. 68:106s–111s. [PMC free article] [PubMed] [Google Scholar]
- Chen, Y., and B. Brenner. 1993. On the regeneration of the actin-myosin power stroke in contracting muscle. Proc. Natl. Acad. Sci. USA. 90:5148–5152. [DOI] [PMC free article] [PubMed] [Google Scholar]
- Cooke, R., and E. Pate. 1985. The effects of ADP and phosphate on the contraction of muscle fibers. Biophys. J. 48:789–798. [DOI] [PMC free article] [PubMed] [Google Scholar]
- Duke, T. 2000. Cooperativity of myosin molecules through strain-dependent chemistry. Philos. Trans. R. Soc. Lond. B Biol. Sci. 355:529–538. [DOI] [PMC free article] [PubMed] [Google Scholar]
- Duke, T. A. J. 1999. Molecular model of muscle contraction. Proc. Natl. Acad. Sci. USA. 96:2770–2775. [DOI] [PMC free article] [PubMed] [Google Scholar]
- Ebus, J. P., and G. J. Stienen. 1996. ATPase activity and force production in skinned rat cardiac muscle under isometric and dynamic conditions. J. Mol. Cell. Cardiol. 28:1747–1757. [DOI] [PubMed] [Google Scholar]
- Edman, K. A. P., and N. A. Curtin. 2001. Synchronous oscillations of length and stiffness during loaded shortening of frog muscle fibres. J. Physiol. 534:553–563. [DOI] [PMC free article] [PubMed] [Google Scholar]
- Eisenberg, E., T. L. Hill, and Y. Chen. 1980. Cross-bridge model for muscle contraction. Biophys. J. 29:195–227. [DOI] [PMC free article] [PubMed] [Google Scholar]
- Ford, L. E., A. F. Huxley, and R. M. Simmons. 1977. Tension responses to sudden length change in stimulated frog muscle fibres near slack length. J. Physiol. 269:441–515. [DOI] [PMC free article] [PubMed] [Google Scholar]
- Ford, L. E., A. F. Huxley, and R. M. Simmons. 1985. Tension transients during steady shortening of frog muscle fibres. J. Physiol. 361:131–150. [DOI] [PMC free article] [PubMed] [Google Scholar]
- Ford, L. E., A. F. Huxley, and R. M. Simmons. 1986. Tension transients during the rise of tetanic tension in frog muscle fibres. J. Physiol. 372:595–609. [DOI] [PMC free article] [PubMed] [Google Scholar]
- Granzier, H. L., A. Mattiazzi, and G. H. Pollack. 1990. Sarcomere dynamics during isotonic velocity transients in single frog muscle fibers. Am. J. Physiol. 259:C266–C278. [DOI] [PubMed] [Google Scholar]
- Hill, A. V. 1939. The heat of shortening and dynamic constants of muscle. Proc. R. Soc. London Ser. B. 126:136–195. [Google Scholar]
- Hill, T. L. 1974. Theoretical formalism for the sliding filament model of contraction of striated muscle. Part I. Prog. Biophys. Mol. Biol. 28:267–340. [DOI] [PubMed] [Google Scholar]
- Howard, J. 2001. Mechanics of Motor Proteins and the Cytoskeleton. Sinauer, Sunderland, MA.
- Huxley, A. F. 1957. Muscle structure and theories of contraction. Prog. Biophys. Biophys. Chem. 7:255–318. [PubMed] [Google Scholar]
- Huxley, A. F. 2000. Cross-bridge action:present views, prospects, and unknowns. J. Biomech. 33:1189–1195. [DOI] [PubMed] [Google Scholar]
- Huxley, A. F., and R. M. Simmons. 1971. Proposed mechanism of force generation in striated muscle. Nature. 233:533–538. [DOI] [PubMed] [Google Scholar]
- Huxley, A. F., and S. Tideswell. 1996. Filament compliance and tension transients in muscle. J. Muscle Res. Cell Motil. 17:507–511. [DOI] [PubMed] [Google Scholar]
- Huxley, A. F., and S. Tideswell. 1997. Rapid regeneration of power stroke in contracting muscle by attachment of second myosin head. J. Muscle Res. Cell Motil. 18:111–114. [DOI] [PubMed] [Google Scholar]
- Irving, M., G. Piazzesi, L. Lucii, Y. B. Sun, J. J. Harford, I. M. Dobbie, M. A. Ferenczi, M. Reconditi, and V. Lombardi. 2000. Conformation of the myosin motor during force generation in skeletal muscle. Nat. Struct. Biol. 7:482–485. [DOI] [PMC free article] [PubMed] [Google Scholar]
- Jülicher, F., and J. Prost. 1995. Cooperative molecular motors. Phys. Rev. Lett. 75:2618–2621. [DOI] [PubMed] [Google Scholar]
- Kawai, M., K. Kawaguchi, M. Saito, and S. Ishiwata. 2000. Temperature change does not affect force between single actin filaments and HMM from rabbit muscles. Biophys. J. 78:3112–3119. [DOI] [PMC free article] [PubMed] [Google Scholar]
- Kojima, H., A. Ishijima, and T. Yanagida. 1994. Direct measurement of stiffness of single actin filaments with and without tropomyosin by in vitro nanomanipulation. Proc. Natl. Acad. Sci. USA. 91:12962–12966. [DOI] [PMC free article] [PubMed] [Google Scholar]
- Kushmerick, M. J., and R. E. Davies. 1969. The chemical energetics of muscle contraction. II. The chemistry, efficiency and power of maximally working sartorius muscles. Proc. R. Soc. Lond. B Biol. Sci. 174:315–347. [DOI] [PubMed] [Google Scholar]
- Piazzesi, G., L. Lucii, and V. Lombardi. 2002b. The size and the speed of the working stroke of muscle myosin and its dependence on the force. J. Physiol. 545:145–151. [DOI] [PMC free article] [PubMed] [Google Scholar]
- Piazzesi, G., M. Reconditi, M. Linari, L. Lucii, Y. B. Sun, T. Narayanan, P. Boesecke, V. Lombardi, and M. Irving. 2002a. Mechanism of force generation by myosin heads in skeletal muscle. Nature. 415:659–662. [DOI] [PubMed] [Google Scholar]
- Podolsky, R. J. 1960. Kinetics of muscular contraction:the approach to the steady state. Nature. 188:666–668. [DOI] [PubMed] [Google Scholar]
- Steffen, W., D. Smith, R. Simmons, and J. Sleep. 2001. Mapping the actin filament with myosin. Proc. Natl. Acad. Sci. USA. 98:14949–14954. [DOI] [PMC free article] [PubMed] [Google Scholar]
- Tyska, M. J., and D. M. Warshaw. 2002. The myosin power stroke. Cell Motil. Cytoskeleton. 51:1–15. [DOI] [PubMed] [Google Scholar]
- Veigel, C., M. L. Bartoo, C. S. White, J. S. Sparrow, and J. E. Molloy. 1998. The stiffness of rabit skeletal acotmyosin cross-bridges determined with an optical tweezers transducer. Biophys. J. 75:1424–1438. [DOI] [PMC free article] [PubMed] [Google Scholar]
- Veigel, C., F. Wang, M. L. Bartoo, J. R. Sellers, and J. E. Molloy. 2002. The gated gait of the processive molecular motor, myosin V. Nat. Cell Biol. 4:59–65. [DOI] [PubMed] [Google Scholar]
- Vilfan, A., E. Frey, and F. Schwabl. 1998. Elastically coupled molecular motors. Eur. Phys. J. B. 3:535–546. [Google Scholar]
- Vilfan, A., E. Frey, and F. Schwabl. 1999. Force-velocity relations of a two-state cross-bridge model for molecular motors. Europhys. Lett. 45:283–289. [Google Scholar]


