Abstract
Permeation of oxygen into membranes is relevant not only to physiological function, but also to depth determinations in membranes by site-directed spin labeling. Spin-lattice (T1) relaxation enhancements by air or molecular oxygen were determined for phosphatidylcholines spin labeled at positions (n = 4–14, 16) of the sn-2 chain in fluid membranes of dimyristoyl phosphatidylcholine, by using nonlinear continuous-wave electron paramagnetic resonance (EPR). Both progressive saturation and out-of-phase continuous-wave EPR measurements yield similar oxygen permeation profiles. With pure oxygen, the T2-relaxation enhancements determined from homogeneous linewidths of the linear EPR spectra are equal to the T1-relaxation enhancements determined by nonlinear EPR. This confirms that both relaxation enhancements occur by Heisenberg exchange, which requires direct contact between oxygen and spin label. Oxygen concentrates in the hydrophobic interior of phospholipid bilayer membranes with a sigmoidal permeation profile that is the inverse of the polarity profile established earlier for these spin-labeled lipids. The shape of the oxygen permeation profile in fluid lipid membranes is controlled partly by the penetration of water, via the transmembrane polarity profile. At the protein interface of the KcsA ion channel, the oxygen profile is more diffuse than that in fluid lipid bilayers.
INTRODUCTION
Oxygen transport across biological membranes is fundamental to respiration in all, except anaerobic, organisms. From a biophysical standpoint, the permeation of oxygen into membranes is crucial to determinations of the structure of transmembrane proteins by site-directed spin labeling (Hubbell and Altenbach, 1994; Perozo et al., 1998). It is also relevant to the pathology of lipid peroxidation and radiation damage in membranes.
Oxygen concentrations in membranes can be estimated, via the diffusion-solubility product, from the paramagnetic enhancements in relaxation of lipid-soluble spin labels that are induced by interaction with the electron spin of molecular oxygen (Hyde and Subczynski, 1989). Oxygen concentrates within the hydrophobic interior of fluid lipid membranes, as a result of the favorable partition between water and oil (Windrem and Plachy, 1980). Subczynski et al. (1989, 1991) have used enhancements in T1-relaxation to determine the profile of the diffusion-solubility product, DT(O2)[O2], of oxygen across the membrane. These profiles, and that of Windrem and Plachy (1980), are the inverse of those expected for the membrane polarity, although to date the oxygen profiles have been determined only for a few transmembrane positions. Recently, the transmembrane polarity of fluid lipid membranes was determined with high positional resolution from measurements of the isotropic hyperfine couplings of spin-labeled lipid chains (Marsh, 2001). It was shown that the troughlike polarity profile can be depicted by a sigmoidal Boltzmann function that is governed by the distance dependence of the free energy of transfer of water between the peripheral and central regions of the membrane interior (Marsh, 2001, 2002).
Here we determine the high-resolution profile of the oxygen diffusion-solubility product in bilayer membranes by using phospholipids (n-PCSL) that are spin labeled systematically throughout the sn-2 acyl chain from C-position n = 4 to n = 14 (and additionally n = 16). Enhancements in T1-relaxation are compared with those in T2-relaxation for samples in 100% oxygen, so as to check directly that the dominant relaxation mechanism in the membrane interior is Heisenberg spin exchange. T1-relaxation enhancements deduced from conventional progressive saturation studies are also compared with nonlinear electron paramagnetic resonance (EPR) measurements from out-of-phase spectra (Livshits et al., 1998). Precise evaluation of the relaxation enhancements in fluid membranes requires allowance for the anisotropic rotational diffusion of the lipid chains by spectral simulation (Livshits et al., 2003). Then it is possible critically to compare the transmembrane profiles for the penetration of oxygen with those for the permeation of water, which determine the polarity of the membrane interior. This is the primary aim of this article. Measurements are confined to the fluid phase of the lipid membranes, i.e., to temperatures above the chain-melting transition at which oxygen solubility in the membrane is appreciable.
MATERIALS AND METHODS
Spin-labeled phosphatidylcholines, n-PCSL (1-acyl-2-[n-(4,4-dimethyloxazolidine-N-oxyl)stearoyl]-sn-glycero-3-phosphocholine) with n = 4–14 and 16, were synthesized according to Marsh and Watts (1982). Synthetic phosphatidylcholine, DMPC (1,2-dimyristoyl-sn-glycero-3-phosphocholine), was from Avanti Polar Lipids (Alabaster, AL).
Spin-labeled phosphatidylcholines were incorporated in bilayer membranes of DMPC at a relative concentration of 1 mol% by drying down the lipid solutions in chloroform and then suspending the dry lipid in water. Membrane dispersions were saturated with either oxygen, air, or argon, as noted. Aliquots of the samples were loaded into 50 μl, 0.7-mm inner diameter, glass capillaries (Brand, Germany), flushed with oxygen, air or argon, as appropriate, and then sealed immediately with epoxy resin. Sample sizes were trimmed to 5-mm length to avoid inhomogeneities in the microwave (H1) and modulation (Hm) fields (Fajer and Marsh, 1982).
EPR spectra were recorded at a microwave frequency of 9 GHz on a Varian Century Line or Bruker EMX spectrometer equipped with nitrogen gas flow temperature regulation. Sample capillaries were positioned along the symmetry axis of the standard 4-mm quartz EPR sample tube that contained light silicone oil for thermal stability. Temperature was measured with a fine-wire thermocouple located close to the sample capillary. Samples were centered in the TE102 rectangular microwave cavity and all spectra were recorded under critical coupling conditions. The root-mean-square microwave magnetic field  at the sample was measured as described in Fajer and Marsh (1982), and corrections were made for the cavity Q as described in the same reference.
Oxygen-induced line broadening, ΔΔHL, was determined by convoluting the EPR spectrum of the argon-saturated sample with a Lorentzian function, and fitting the convoluted spectrum to the experimental EPR spectrum for the corresponding oxygen-saturated sample. The procedure is essentially similar to that used by Smirnov and Belford (1995).
Progressive saturation measurements were made on in-phase EPR spectra recorded in the first-harmonic absorption mode (V1-display) at a modulation frequency of 100 kHz. Saturation curves for the spectral lineheight were fitted with the following dependence on microwave field strength, H1 (Livshits et al., 2003):
 |
(1) |
where the exponent ɛ is a fitting parameter that depends on the degree of homogeneous broadening, k is a scaling factor and  is the saturation parameter. This equation was used previously with saturation curves simulated for isotropic rotational diffusion (Haas et al., 1993), and also to quantitate experimental saturation curves in site-directed spin labeling (Altenbach et al., 1990). The effective value of the T1-relaxation time is determined by fitting the parameters P and ɛ obtained from saturation curves for simulated spectra to those from the experimental saturation curve. The simulation model used is that of rapid anisotropic spin label reorientation within a cone, coupled with the Bloch equations that explicitly contain the microwave magnetic field, H1, and the Zeeman modulation field, Hm (Livshits et al., 2003). Motional parameters (rotational correlation time and cone angle) and intrinsic linewidths (homogeneous and inhomogeneous) that are needed to simulate the saturation curves are obtained by simulation of the linear EPR spectra obtained at low microwave power. A fast motional model is used for computational simplicity because similar relaxation enhancements are obtained to those simulated using a lengthier slow-motional model (Livshits et al., 2003).
First-harmonic, out-of-phase absorption EPR spectra ( -display) were recorded as described in Livshits et al. (1998). The modulation phase was set either by the self-null method, or with a nonsaturating reference sample as described in the same reference. Out-of-phase
  to in-phase (V1) ratios of the spectral amplitudes
 |
(2) |
of the low-field (MI = +1) and central (MI = 0) hyperfine components were measured as T1-sensitive parameters. Effective T1-relaxation times were obtained by simulating the out-of-phase spectra, as described above for saturation of the in-phase spectra (Livshits et al., 2003).
RESULTS
Paramagnetic relaxation enhancements induced by 100% oxygen or by air have been determined for spin labels stepped systematically down the sn-2 acyl chain in fluid bilayer membranes of dimyristoyl phosphatidylcholine. Results obtained with pure oxygen are described first. In this case, it is possible not only to determine T1-relaxation enhancements, but also the enhancement in T2-relaxation from line broadening. Paramagnetic enhancements induced by oxygen in air are determined both by progressive saturation experiments and from intensities of the first-harmonic out-of-phase nonlinear continuous wave (CW)-EPR spectra (Livshits et al., 1998).
Linewidths and progressive saturation in oxygen
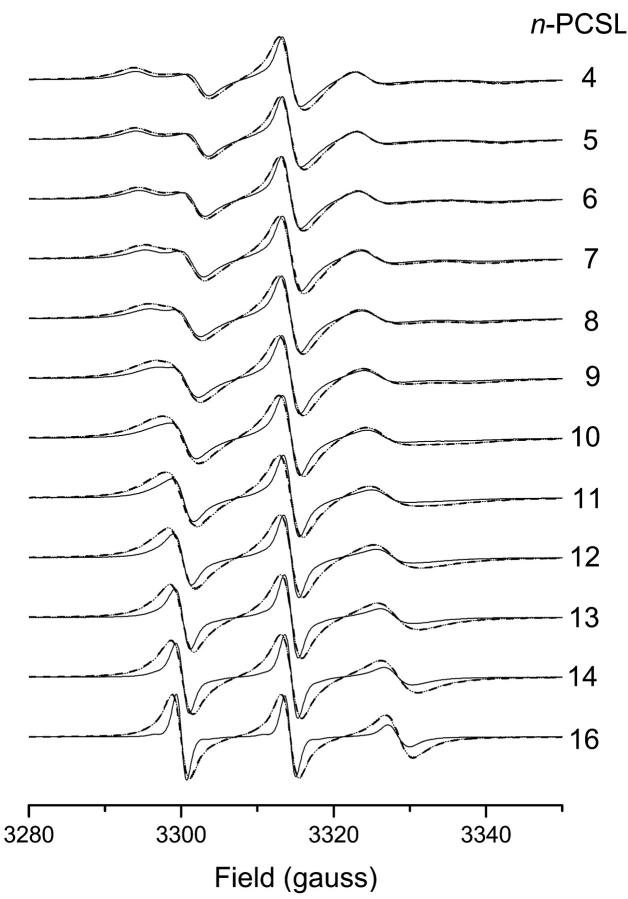
Fig. 1 gives the linear EPR spectra of different n-PCSL spin probes in fluid DMPC bilayer membranes at 39°C. The spectra are recorded at low power, i.e., in the absence of saturation. The spectral lineshapes reveal the flexibility gradient with increasing n that is characteristic of spin-labeled chains in fluid membranes. An increased linebroadening is evident for the samples saturated with paramagnetic oxygen. Simulations were performed of the low-power spectra given in Fig. 1. These are required to determine the dynamic parameters (motional amplitude and correlation time) that are used to simulate the saturation curves for the T1-determinations to be described later. The simulation algorithm is based on motional narrowing theory, which is appropriate to a first approximation for DMPC bilayers at 39°C, and allows for anisotropic motion and orientational ordering of the lipid chain segments (Livshits et al., 2001, 2003). This model allows adequate representation of the anisotropic EPR spectra. Table 1 gives the motional parameters used in the simulations. These are angular amplitude of motion, β, asymmetry (Sxx-Syy) in orientational ordering, and rotational correlation time. Systematic progressions with increasing spin-label position, n, are found for all except the asymmetry parameter.
FIGURE 1.
Linear V1-EPR spectra of n-PCSL phosphatidylcholine spin labels in DMPC bilayer membranes at 39°C, for oxygen-saturated (dashed lines) and argon-saturated samples (solid lines). Dotted lines are spectra from argon-saturated samples convoluted with a Lorentzian linebroadening. Spectral width: 7 mT.
TABLE 1.
Angular amplitude (β), asymmetry in ordering (Sxx-Syy), and rotational correlation time (τR) for spin-labeled phosphatidylcholines, n-PCSL, in dimyristoyl phosphatidylcholine bilayer membranes at 39°C, obtained from simulation of linear V1-EPR spectra assuming rapid angular rotation
| Spin label | β (°) | Sxx-Syy* | τR (ns) |
|---|---|---|---|
| 4-PCSL | 53 | −0.08 | 1.8 |
| 5-PCSL | 54 | −0.17 | 1.8 |
| 6-PCSL | 57 | −0.14 | 1.7 |
| 7-PCSL | 59.5 | −0.02 | 1.6 |
| 8-PCSL | 61 | 0.00 | 1.4 |
| 9-PCSL | 69 | +0.25 | 1.5 |
| 10-PCSL | 76 | +0.03 | 1.4 |
| 11-PCSL | 77 | −0.14 | 1.3 |
| 12-PCSL | 80 | −0.38 | 1.2 |
| 13-PCSL | 82.5 | −0.35 | 0.83 |
| 14-PCSL | 84 | −0.35 | 0.77 |
| 16-PCSL | 90 | −0.2 | 0.62 |
Diagonal elements of the ordering tensor are related by Sxx + Syy = −Szz, where Szz = (1/2)cosβ(1 + cosβ).
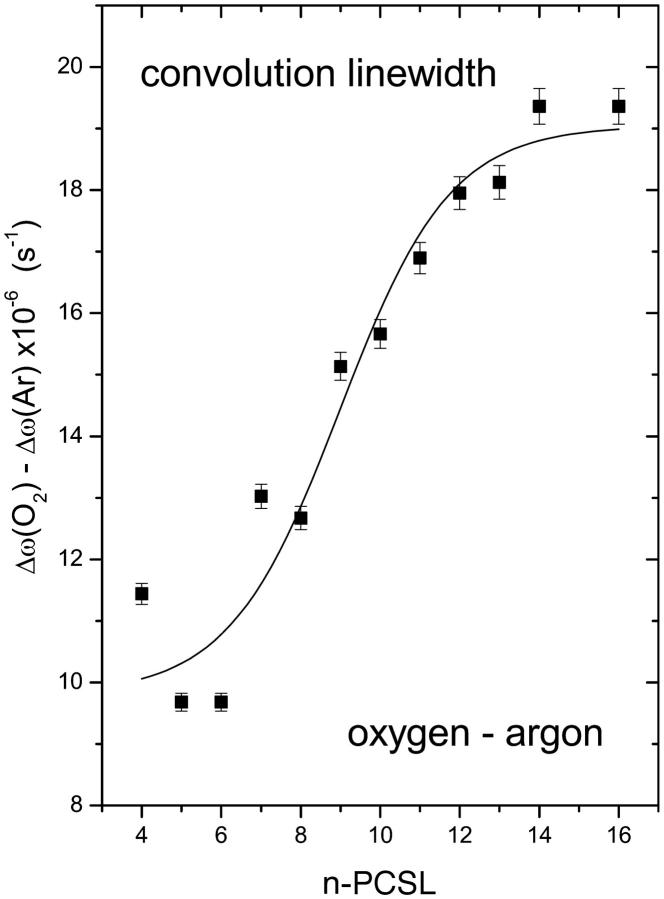
Fig. 2 gives the T2-relaxation enhancements, ΔΔω = Δω(O2) − Δω(Ar), of the n-PCSL spin labels in fluid DMPC bilayers saturated with 100% oxygen. The enhancement in T2-relaxation time (ΔΔω = γeΔΔHL) is deduced from the increase in Lorentzian linewidth by oxygen. This is obtained by convolution of the spectrum obtained from a sample in argon, with an additional Lorentzian linebroadening (ΔΔHL). The convolution method increases the precision, relative to estimation of the individual linewidths by simulation. The close agreement between the experimental (dashed) and convoluted (dotted) spectra in Fig. 1 shows that the Lorentzian linebroadening induced by oxygen is the same throughout the anisotropic spectral lineshape. This is expected for Heisenberg spin exchange but not for line broadening from magnetic dipole-dipole interactions. A sigmoidal increase in T2-relaxation enhancement induced by molecular oxygen, centered at around the n = 9 C-atom of the spin-label acyl chain, is obtained from the linewidth measurements (see Fig. 2). T2-relaxation enhancement by oxygen is considerably greater at spin-label positions n > 10 than at positions n < 8, further up the chain. Consequently, scatter is greater in the latter region and the sigmoidal nature of the profile is less well defined.
FIGURE 2.
Relaxation enhancement, ΔΔω, deduced from Lorentzian linewidths obtained by convolution (ΔΔω = γeΔΔHL) for n-PCSL spin labels in oxygen-saturated dimyristoyl phosphatidylcholine bilayer membranes at 39°C. Solid line is a nonlinear least-squares fit of Eq. 4 to the dependence on spin-label position, n.
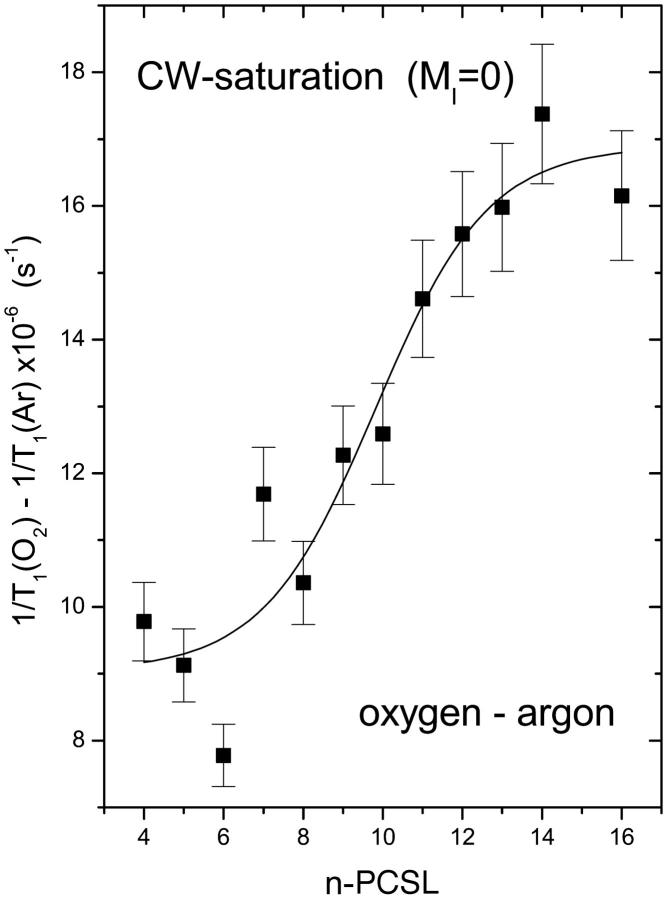
Fig. 3 shows comparable data for the enhancement, Δ(1/T1), in spin-lattice relaxation that is induced by oxygen in fluid DMPC bilayers. This T1-relaxation enhancement profile was obtained by progressive saturation measurements on the central amplitude (MI = 0) of the conventional in-phase first harmonic absorption EPR spectra. Effective values of T1 were obtained from simulation of the saturation curves by using motional and linewidth parameters that were established in simulations of the low-power EPR spectra, as described above (see Table 1). As for the T2-relaxation enhancement (cf. Fig. 2), the T1-relaxation enhancements are considerably greater at spin-label positions n > 10 than at positions n < 8. The relaxation rates are all very similar to those obtained from the linewidth measurements.
FIGURE 3.
T1-relaxation rate enhancement, Δ(1/T1), from progressive saturation experiments on n-PCSL spin labels in oxygen-saturated dimyristoyl phosphatidylcholine bilayer membranes at 39°C. Solid line is a nonlinear least-squares fit of Eq. 4 to the dependence on spin-label position, n.
The correspondence between T1- and T2-relaxation rates is reasonably close for spin labels positioned deep in the membrane interior, where relaxation enhancement by oxygen is greatest and can be determined most reliably (compare Figs. 2 and 3). This establishes the mechanism of relaxation enhancement by molecular oxygen as being Heisenberg spin exchange. Unlike dynamic magnetic dipole-dipole interactions (Livshits et al., 2001), Heisenberg exchange increases T1- and T2-relaxation rates to equal extents (Molin et al., 1980). Under these circumstances, the relaxation enhancements are determined by the product of the local translational diffusion coefficient and local concentration of oxygen in the vicinity of the spin label (Hyde and Subczynski, 1989).
Progressive saturation and out-of-phase spectra in air
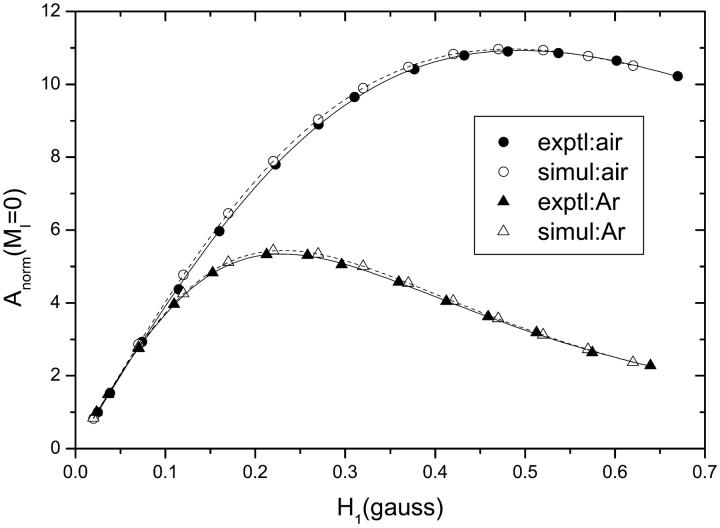
Fig. 4 gives typical curves fitted by Eq. 1 for progressive saturation of an n-PCSL spin label in fluid DMPC bilayers that are saturated either with air or with argon (solid lines and symbols). The effect of air in alleviating saturation by interaction with the paramagnetic oxygen component is clearly seen. Dashed lines represent fits of Eq. 1 to V1-EPR spectra simulated for increasing microwave magnetic field intensity, H1. Simulations were made using the model of rapid anisotropic reorientation, with motional and linewidth parameters established by simulation of the linear spectra at low H1 (see Fig. 1 and Table 1). The spin-lattice relaxation time, T1, was used as a fixed input parameter that was varied to obtain best agreement between experimental and simulated saturation curves.
FIGURE 4.
Dependence on microwave field intensity, H1, of the central (MI = 0) amplitude in the first-harmonic in-phase V1-EPR spectra of 8-PCSL in fluid DMPC membranes (T = 39°C) that are saturated either with air (circles) or with argon (triangles). Solid symbols are experimental data points. Open symbols are saturation curves obtained from the central amplitudes of V1-EPR spectra simulated with fixed T1 for increasing H1. Solid and dashed lines are fits of Eq. 1 to the experimental and simulated curves, respectively.
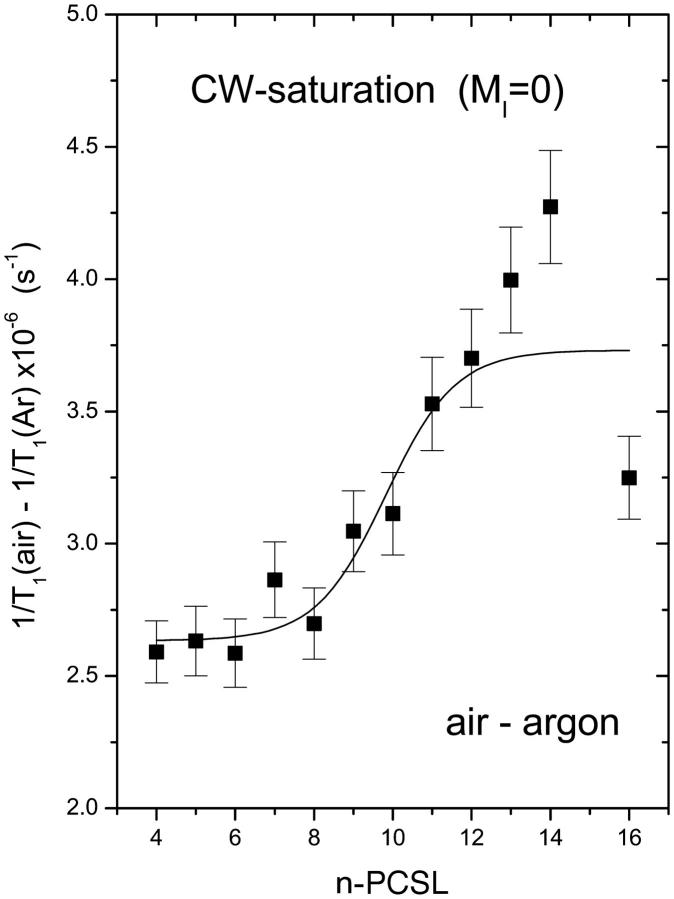
Fig. 5 gives the profile for the T1-relaxation enhancement obtained in this way for membranes saturated with air. The slope of the profile is similar to that deduced, also from progressive saturation experiments, in membranes saturated with 100% oxygen (cf. Fig. 3). The size of the enhancement is, however, considerably smaller, corresponding to the relative oxygen content of air.
FIGURE 5.
T1-relaxation rate enhancement, Δ(1/T1), from progressive saturation experiments on n-PCSL spin labels in air-saturated dimyristoyl phosphatidylcholine bilayer membranes at 39°C. Solid line is a nonlinear least-squares fit of Eq. 4 to the dependence on spin-label position, n.
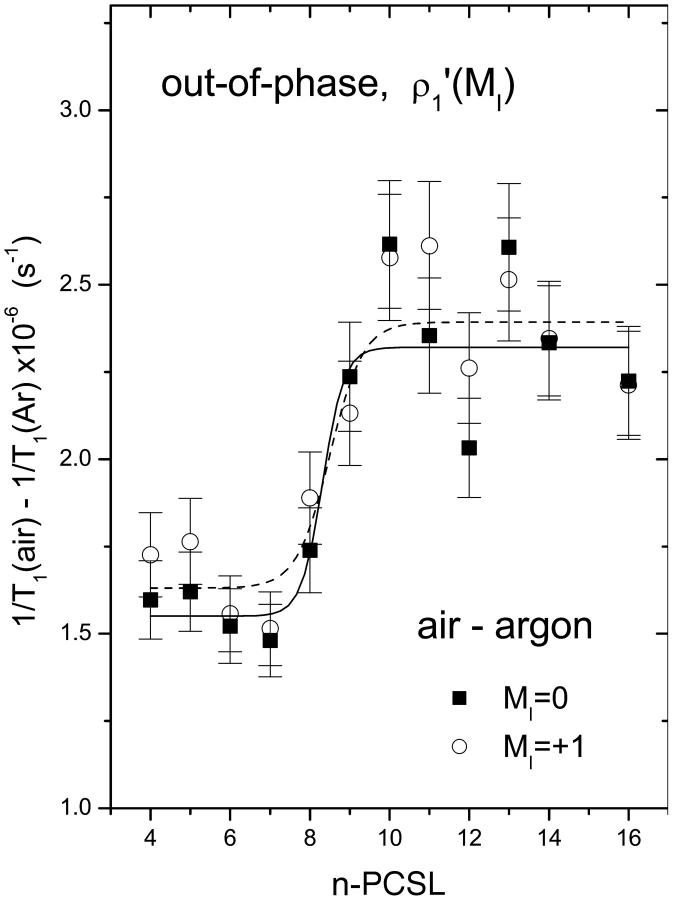
Fig. 6 gives the T1-relaxation enhancement profiles induced by air that are determined from the out-of-phase, first-harmonic absorption  -EPR spectra. Very similar profiles are obtained from measurements of the amplitudes of the central (MI = 0) and low-field (MI = +1) components in the nonlinear spectrum. The form of the enhancement profile is similar to that deduced from progressive saturation experiments (cf. Fig. 5). The transition region from low to high enhancements is somewhat narrower, however. Absolute values of the relaxation enhancements are smaller than those deduced from progressive saturation, in line with the known differences in estimation of effective T1-relaxation times (Livshits et al., 2003). These quantitive discrepancies probably lie in the approximate or simplified nature of the spectral simulation models.
FIGURE 6.
T1-relaxation rate enhancement, Δ(1/T1), deduced from out-of-phase amplitudes of the low-field and central components [ρ′1(MI = 0) and ρ′1(MI = +1)] in first-harmonic absorption EPR spectra of n-PCSL spin labels in air-saturated dimyristoyl phosphatidylcholine bilayer membranes at 39°C. Solid and dashed lines are nonlinear least-squares fits of Eq. 4, to the MI = 0 and MI = +1 data for the dependence on spin label position, n, respectively.
DISCUSSION
Previously, the equality of the T1- and T2-relaxation enhancements, deduced from the nonlinear and linear EPR spectra, respectively, has shown that Ni(ClO4)2 increases relaxation rates of lipid spin labels by the Heisenberg spin exchange interaction (Livshits et al., 2001). Here we show that this is also the case for molecular oxygen dissolved in fluid lipid bilayers, in line with expectation (Hyde and Subczynski, 1989) and as concluded from previous linewidth measurements (Smirnov et al., 1996). A pertinent consideration is the relation of the T1-relaxation enhancements derived here from CW spectroscopy to time-domain EPR measurements using saturation recovery methodology. For the stearic acid analogs of 5-PCSL and 16-PCSL in DMPC, Subczynski et al. (1989) measure relaxation enhancements by air of Δ(1/T1) ≈ 2.6 × 10⁶ s−1 and 4 × 10⁶ s−1, respectively, at 38°C from saturation recovery. The corresponding values from Fig. 5 are Δ(1/T1) = 2.6 × 10⁶ s−1 and 3.3 × 10⁶ s−1 at 39°C, for 5-PCSL and 16-PCSL, respectively, in DMPC. Satisfactory agreement is also obtained with the values of Δ(1/T2) from linewidth measurements in pure oxygen (Fig. 2), after correcting by a factor of 0.2×.
For Heisenberg spin exchange, the enhancement in relaxation rate, ωx (=Δ(1/T1) or Δ(1/T2)), is given by the Smoluchowski solution of the diffusion equation:
 |
(3) |
where rNO is the oxygen-spin label encounter distance, pex is the probability of exchange on collision (Hyde and Subczynski, 1984), DT(O2) is the translational diffusion coefficient of oxygen, and [O2] is the local oxygen concentration. The fundamental quantity measured by the enhancement profiles is the local diffusion-concentration product, DT(O2)[O2], of oxygen. For regions with similar rates of oxygen diffusion, the enhancement profile directly reflects the permeation profile of oxygen into the membrane.
Oxygen permeation into lipid bilayers has been simulated using molecular dynamics by Marrink and Berendsen (1996). These theoretical results suggest that, in general, both the local oxygen concentration and the local diffusion rate contribute quantitatively to the oxygen permeation profile. In particular, it is predicted that the oxygen diffusion rate decreases in the interfacial region of the membrane, reaching a minimum at a short distance into the acyl chain region, before increasing toward the center of the membrane. It is therefore possible that the decrease in relaxation enhancement from position n = 4 to n = 5,6 that is seen in Figs. 2 and 3 for pure oxygen may reflect a decrease in local translational diffusion rate.
Oxygen permeation profile
As already well established (Kusumi et al., 1982), and used for location studies in site-directed spin labeling (Hubbell and Altenbach, 1994), oxygen concentration in the hydrophobic interior of membranes is considerably higher than at positions closer to the membrane periphery. The positionally resolved DT(O2)[O2] profiles given in Figs. 2, 3, 5, and 6 characterize this spatial distribution in considerable detail. The oxygen profiles have a shape similar to the troughlike profiles of membrane polarity established in fluid lipid membranes from measurements of spin-label 14N isotropic hyperfine coupling constants (Marsh, 2001), except that they are inverted. The measurements with oxygen that are presented here for all spin-label positions in the sn-2 phospholipid chain from n = 4 to n = 14, now allow a direct comparison with the corresponding high-resolution membrane polarity profiles obtained previously.
To make the connection quantitatively, we fit the oxygen data with a sigmoidal relaxation-enhancement profile identical to that used in the membrane polarity studies (Marsh, 2001):
 |
(4) |
where Δ(1/T1)1 and Δ(1/T1)2 are the limiting values of the relaxation enhancement, Δ(1/T1), at the polar headgroup and terminal methyl end of the chains, respectively, and λ is an exponential decay constant. In Eq. 4, no is the value of n at the point of maximum gradient, where Δ(1/T1) = (1/2)[Δ(1/T1)1 + Δ(1/T1)2]. Equation 4 represents a two-phase distribution between membrane regions with n > no and n < no, where the free energy of transfer for oxygen depends on the distance from the dividing plane at n = no. Nonlinear, least-squares fits of Eq. 4 to the profiles are given by the solid lines in Figs. 2, 3, and 5, and by the solid and dashed lines in Fig. 6. Values of the best-fitting parameters are given in Table 2. The ratios of the mean enhancements in spin-lattice relaxation rate, Δ(1/T1)1 and Δ(1/T1)2, in air to those in pure oxygen are both 0.2. This is the value that is expected for the oxygen content of air. The position of the midpoint of the transmembrane oxygen profile is reasonably consistent between the two sets of measurements: no = 9.4 ± 0.4 and 8.9 ± 0.8 in oxygen and air, respectively. The decay length of the transition region in the profile is greater in oxygen (λ = 1.4 ± 0.1, in units of CH2 groups) than in air (λ = 0.5 ± 0.3). Presumably the former is more reliable because the relaxation enhancements are greater in 100% oxygen than in air.
TABLE 2.
Parameters in Eq. 4 characterizing the T1-relaxation enhancement, Δ(1/T1)(×10−6s−1), profile of oxygen in dimyristoyl phosphatidylcholine bilayers at 39°C
| Air | O2 | ||||
|---|---|---|---|---|---|
| P | ρ′1(MI = 0) | ρ′1(MI = +1) | P | ΔΔω | |
| Δ(1/T1)1 | 2.63 ± 0.07 | 1.55 ± 0.06 | 1.63 ± 0.06 | 9.0 ± 0.9 | 9.8 ± 0.2 |
| Δ(1/T1)2 | 3.73 ± 0.11 | 2.32 ± 0.07 | 2.39 ± 0.07 | 16.9 ± 0.9 | 19.0 ± 0.2 |
| no | 9.8 ± 0.4 | 8.3 ± 0.3 | 8.5 ± 0.3 | 9.8 ± 0.7 | 9.0 ± 0.1 |
| λ | 0.89 ± 0.39 | 0.27 ± 0.24 | 0.41 ± 0.25 | 1.4 ± 0.6 | 1.4 ± 0.1 |
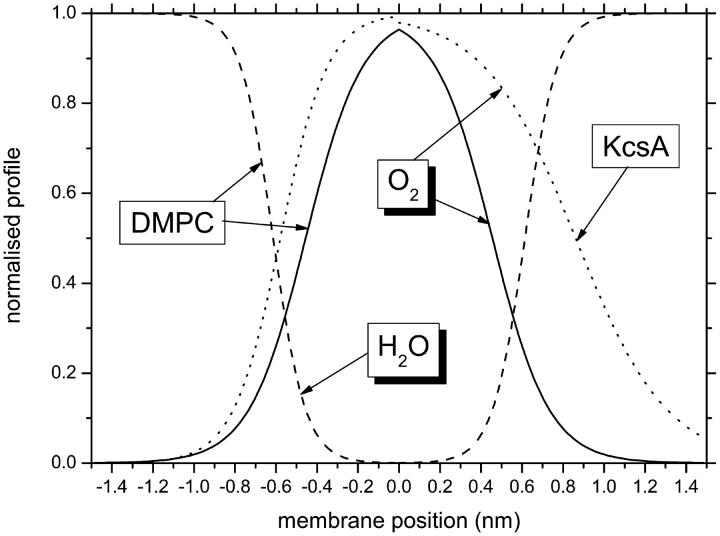
For comparison (see Fig. 7), the midpoint and width of the transition region in the polarity profile of DMPC bilayers are found to be: no = 8.00 ± 0.04 and λ = 0.44 ± 0.06 (Marsh, 2001). Recently, more direct values have been obtained for the water permeation profile by correcting for variations in local dielectric constant across the membrane (Marsh, 2002). This yields values of: no = 7.77 ± 0.06 and λ = 0.37 ± 0.05, for water penetration of DMPC bilayers. For the longer chain saturated lipid, dipalmitoyl phosphatidylcholine, the values for water are: no = 7.52 ± 0.08 and λ = 0.70 ± 0.07. From this, we conclude that the shape of the oxygen permeation profile is governed, at least in part, by the transbilayer polarity profile that is established by penetration of water into the membrane (Griffith et al., 1974; Marsh, 2002). The actual energetics of the two distributions can differ slightly, of course, with no and λ being somewhat larger for oxygen than for water. Other factors, such as local free volume, might also be expected to affect the shape of both the permeation and penetration profiles. Free volume, however, cannot account for an anticorrelation between the polarity profile and that for permeation of oxygen (cf. Fig. 7). This must be thermodynamic in origin, which implies that the distribution of water in the membrane can affect the energetics of oxygen penetration. However, such a close negative correlation between polarity profile and oxygen permeation profile as is found here experimentally, is not found in the excess free energy profiles for water and oxygen that are obtained from the molecular dynamics simulations of Marrink and Berendsen (1996).
FIGURE 7.
Normalized transmembrane profiles of the diffusion-concentration product, DT(O2)[O2], of oxygen in fluid DMPC bilayers (solid line: mean values from Figs. 2 and 3) and at the protein-lipid interface of the KcsA channel in asolectin liposomes (dotted line: Perozo et al., 1998; Marsh, 2001). Dashed lines give the polarity profile of fluid DMPC bilayers determined from the spin-label isotropic hyperfine splitting constants (Marsh, 2001). The x-axis is the distance from the membrane center along the membrane normal, increasing from N- to C-terminal in KcsA. Note that the mean lipid chainlength for the latter is greater than that of DMPC.
It is now possible to compare the DT(O2)[O2] profile for the lipid regions of the membrane, which is determined here with high positional resolution, with profiles at the lipid-protein interface of integral proteins that are established by site-directed spin labeling (see Fig. 7). Oxygen relaxation enhancements for the first transmembrane helix in the KcsA potassium channel of Streptomyces lividans were determined by Perozo et al. (1998). Values for the oxygen decay length deduced from these data are: λ = 0.12 ± 0.11 and 0.23 ± 0.17 nm for the N- and C-terminal sides of the membrane, respectively, assuming a rise of 0.15 nm per residue for an α-helix (Marsh, 2001). These values are to be compared with λ = 0.14 nm (or 0.05 ± 0.03 nm in air) for oxygen in the lipid bilayer. An average fluid lipid chain increment of 0.1 nm per methylene (Marsh, 1990) is used to convert λ from units of CH2 groups, for this comparison between measurements with spin-labeled lipid chains and spin-labeled protein residues. For the N-terminal side of KcsA, the value of λ is comparable to that in lipid membranes, after allowance for the helix tilt. On the C-terminal side, the oxygen distribution at the lipid-protein interface is more diffuse than in the lipid bilayer (see Fig. 7). This is in line with an increase in intramembrane polarity on introduction of the protein residues. The distance between midpoints of the oxygen profiles for KcsA is 9.6 ± 2.4 residues or 1.44 ± 0.36 nm (Marsh, 2001). For a lipid bilayer corrected (conservatively) to C-16 chains from the data in Table 2, the separation between midpoints is 1.8 ± 0.1 nm, after allowing for terminal methyl groups and sn-1/sn-2 chain overlap. The effective reduction in hydrophobic thickness at the protein-lipid interface, relative to the lipid bilayer, again results from the nonvanishing polarity of the protein residues. (Note that the lipid profile in Fig. 7 is for DMPC, which has C-14 chains.) The lipid-facing residues in the center of the first transmembrane helix of KcsA are all hydrophobic: L35, I38, and L41. However, these residues are flanked by A31 (and R27) on the N-terminal side, and by Y45 on the C-terminal side, which similarly face the lipid. Such less hydrophobic residues will modify the oxygen profile at the protein-lipid interface, relative to that in pure lipid bilayers. The dependence of transmembrane polarity profiles (Marsh, 2001), and oxygen profiles (Subczynski et al., 1991), on lipid chain composition is considerably smaller than the difference in oxygen profile at the intramembranous surface of KcsA from that in lipid bilayers.
Membrane permeability to oxygen
Previously, Subczynski et al. (1989) have used values of DT(O2)[O2] obtained from lipid spin labels to estimate membrane permeabilities to oxygen. They used a triangular or trapezoidal transmembrane profile for the diffusion-concentration product. Now it is possible to obtain more precise estimates by using the detailed profile of Δ(1/T1) vs. n that is established here. The permeability coefficient, P, of a membrane to oxygen is given by (Diamond and Katz, 1974):
 |
(5) |
where k′, k″ are the rate constants for entry of oxygen at the two faces of the membrane and 2d is the membrane thickness of the hydrophobic region. The permeability barrier of the latter is given by the integral in Eq. 5, where K(x) and D(x) are the local partition coefficient and diffusion coefficient, respectively, of oxygen at distance x into the membrane. The product K(x)D(x) is directly proportional to the relaxation enhancements, Δ(1/T1), of the spin label at position, x (see Eq. 3). Using the transmembrane profile given by Eq. 4, the contribution to the permeability barrier becomes (Marsh, 2001):
 |
(6) |
 |
where do is the distance corresponding to chain position no, and λ is also expressed as a distance. The K1D1 and K2D2 products correspond to the beginning of the apolar region and the center of the membrane, respectively. Their ratio is given directly by the relaxation enhancements in Eq. 4: K1D1/K2D2 = Δ(1/T1)1/Δ(1/T1)2 (cf. Eq. 3).
The first term in square brackets on the right side of Eq. 6 represents the normal diffusive resistance of a uniform membrane of thickness 2d, with oxygen partition and diffusion coefficients K1 and D1. The remaining term represents the additional resistance (or facilitation) presented by the central barrier (or trough). Using the mean values from measurements in oxygen that are given in Table 2, the second term on the right in Eq. 6 predicts a facilitation of oxygen diffusion that is equivalent to a reduction in total membrane thickness by six CH2 units. This is relative to a uniform membrane with partition and diffusion coefficients K1 and D1.
Absolute values for the partition-diffusion product, K1D1, can be obtained by using a value of Δ(1/T1)w = 1.05 MHz for the spin-label relaxation enhancement by air in water, corrected for the nonvanishing diffusion coefficient of the spin label (Subczynski et al., 1992), and Dw = 3.0 × 10⁻⁵ cm2 s−1 for the diffusion coefficient of oxygen in water at 37°C (St. Denis and Fell, 1971). From Table 2, this yields consistent values of K1D1 = Dw × Δ(1/T1)1/Δ(1/T1)w = 5.1 ± 0.1 and 5.6 ± 1.7 × 10⁻⁵ cm2 s−1, for measurements in oxygen and air, respectively. Similar values are obtained from Eq. 3: K1D1 = Δ(1/T1)1 / (4πrNOpex)/[O2]w = 4.9 ± 0.1 and 5.4 ± 1.7 × 10⁻⁵ cm2 s−1, respectively, with a value of pex = 1/2, the oxygen concentration in air-equilibrated water [O2]w = 2.1 × 10⁻⁴ M at 37°C, and rNO = 0.45 nm (Windrem and Plachy, 1980). For fluid DMPC bilayers, the value of the bilayer thickness is 2d ≈ 3.0 nm, with an increment of 0.1 nm/CH2, and allowing for the terminal methyl groups and overlap of the sn-1 and sn-2 chains. The resulting permeability coefficient for oxygen is then: P = 210 cm s−1, calculated from Eq. 6 with data from measurements either in oxygen or in air. A permeability coefficient in this range is consistent with the Meyer-Overton rule correlating partition coefficient with lipid membrane permeability of small solutes (Walter and Gutknecht, 1986; Subczynski et al., 1992).
Acknowledgments
We thank Frau B. Angerstein for synthesis of spin-labeled lipids.
This work was supported in part by a collaborative grant from the Deutsche Forschungsgemeinschaft and the Russian Academy of Sciences, and by the Russian Foundation for Basic Research (grant 01-03-32232).
References
- Altenbach, C., T. Marti, H. G. Khorana, and W. L. Hubbell. 1990. Transmembrane protein structure: spin-labelling of bacteriorhodopsin mutants. Science. 248:1088–1092. [DOI] [PubMed] [Google Scholar]
- Diamond, J. M., and Y. Katz. 1974. Interpretation of nonelectrolyte partition coefficients between dimyristoyl lecithin and water. J. Membr. Biol. 17:121–154. [DOI] [PubMed] [Google Scholar]
- Fajer, P., and D. Marsh. 1982. Microwave and modulation field inhomogeneities and the effect of cavity Q in saturation transfer ESR spectra. Dependence on sample size. J. Magn. Reson. 49:212–224. [Google Scholar]
- Griffith, O. H., P. J. Dehlinger, and S. P. Van. 1974. Shape of the hydrophobic barrier of phospholipid bilayers. Evidence for water penetration in biological membranes. J. Membrane Biol. 15:159–192. [DOI] [PubMed] [Google Scholar]
- Haas, D. A., C. Mailer, and B. H. Robinson. 1993. Using nitroxide spin labels. How to obtain T1e from continuous wave electron paramagnetic resonance spectra at all rotational rates. Biophys. J. 64:594–604. [DOI] [PMC free article] [PubMed] [Google Scholar]
- Hubbell, W. L., and C. Altenbach. 1994. Investigation of structure and dynamics in membrane proteins using site-directed spin labeling. Curr. Opin. Struct. Biol. 4:566–573. [Google Scholar]
- Hyde, J. S., and W. K. Subczynski. 1984. Simulation of electron spin resonance spectra of the oxygen-sensitive spin label probe CTPO. J. Magn. Reson. 56:125–130. [Google Scholar]
- Hyde, J. S., and W. K. Subczynski. 1989. Spin-label oximetry. In Spin Labeling. Theory and Applications. L. J. Berliner and J. Reuben, editors. Plenum Press, New York and London. 399–425.
- Kusumi, A., W. K. Subczynski, and J. S. Hyde. 1982. Oxygen transport parameter in membranes as deduced by saturation recovery measurements of spin-lattice relaxation times of spin labels. Proc. Natl. Acad. Sci. USA. 79:1854–1858. [DOI] [PMC free article] [PubMed] [Google Scholar]
- Livshits, V. A., B. G. Dzikovski, and D. Marsh. 2001. Mechanism of relaxation enhancement of spin labels in membranes by paramagnetic ion salts: dependence on 3d and 4f ions and on the anions. J. Magn. Reson. 148:221–237. [DOI] [PubMed] [Google Scholar]
- Livshits, V. A., B. G. Dzikovski, and D. Marsh. 2003. Anisotropic motion effects in CW non-linear EPR spectra. Spin relaxation enhancement of lipid spin labels. J. Magn. Reson. 162:429–422. [DOI] [PubMed] [Google Scholar]
- Livshits, V. A., T. Páli, and D. Marsh. 1998. Spin relaxation measurements using first-harmonic out-of-phase absorption EPR signals. J. Magn. Reson. 134:113–123. [DOI] [PubMed] [Google Scholar]
- Marrink, S. J., and H. J. C. Berendsen. 1996. Permeation process of small molecules across lipid membranes studied by molecular dynamics simulations. J. Phys. Chem. 100:16729–16738. [Google Scholar]
- Marsh, D. 1990. Handbook of Lipid Bilayers. CRC Press, Boca Raton, FL.
- Marsh, D. 2001. Polarity and permeation profiles in lipid membranes. Proc. Natl. Acad. Sci. USA. 98:7777–7782. [DOI] [PMC free article] [PubMed] [Google Scholar]
- Marsh, D. 2002. Membrane water-penetration profiles from spin labels. Eur. Biophys. J. 31:559–562. [DOI] [PubMed] [Google Scholar]
- Marsh, D., and A. Watts. 1982. Spin-labeling and lipid-protein interactions in membranes. In Lipid-Protein Interactions, Vol. 2. P. C. Jost and O. H. Griffith, editors. Wiley-Interscience, New York. 53–126.
- Molin, Y. N., K. M. Salikov, and K. I. Zamaraev. 1980. Spin Exchange. Principles and Applications in Chemistry and Biology. Springer Verlag, Berlin.
- Perozo, E., D. Marien Cortes, and L. G. Cuello. 1998. Three-dimensional architecture and gating mechanism of a K+ channel studied by EPR spectroscopy. Nat. Struct. Biol. 5:459–469. [DOI] [PubMed] [Google Scholar]
- Smirnov, A. I., and R. L. Belford. 1995. Rapid quantitation from inhomogeneously broadened EPR spectra by a fast convolution algorithm. J. Magn. Reson. 113:65–73. [Google Scholar]
- Smirnov, A. I., R. B. Clarkson, and R. L. Belford. 1996. EPR linewidth (T2) method to measure oxygen permeability of phospholipid bilayers and its use to study the effect of low ethanol concentrations. J. Magn. Reson. B. 111:149–157. [DOI] [PubMed] [Google Scholar]
- St. Denis, C. E., and C. J. D. Fell. 1971. Diffusivity of oxygen in water. Can. J. Chem. Engineer. 49:885. [Google Scholar]
- Subczynski, W. K., L. E. Hopwood, and J. S. Hyde. 1992. Is the mammalian cell plasma membrane a barrier to oxygen transport? J. Gen. Physiol. 100:69–87. [DOI] [PMC free article] [PubMed] [Google Scholar]
- Subczynski, W. K., J. S. Hyde, and A. Kusumi. 1989. Oxygen permeability of phosphatidylcholine-cholesterol membranes. Proc. Natl. Acad. Sci. USA. 86:4474–4478. [DOI] [PMC free article] [PubMed] [Google Scholar]
- Subczynski, W. K., J. S. Hyde, and A. Kusumi. 1991. Effect of alkyl chain unsaturation and cholesterol intercalation on oxygen transport in membranes – a pulse ESR spin labeling study. Biochemistry. 30:8578–8590. [DOI] [PubMed] [Google Scholar]
- Walter, A., and J. Gutknecht. 1986. Permeability of small nonelectrolytes through lipid bilayer membranes. J. Membr. Biol. 90:207–217. [DOI] [PubMed] [Google Scholar]
- Windrem, D. A., and W. Z. Plachy. 1980. The diffusion-solubility of oxygen in lipid bilayers. Biochim. Biophys. Acta. 600:655–665. [DOI] [PubMed] [Google Scholar]


