

Abstract
Low-angle x-ray diffraction patterns from relaxed insect flight muscle recorded on the BioCAT beamline at the Argonne APS have been modeled to 6.5 nm resolution (R-factor 9.7%, 65 reflections) using the known myosin head atomic coordinates, a hinge between the motor (catalytic) domain and the light chain-binding (neck) region (lever arm), together with a simulated annealing procedure. The best head conformation angles around the hinge gave a head shape that was close to that typical of relaxed M•ADP•Pi heads, a head shape never before demonstrated in intact muscle. The best packing constrained the eight heads per crown within a compact crown shelf projecting at ∼90° to the filament axis. The two heads of each myosin molecule assume nonequivalent positions, one head projecting outward while the other curves round the thick filament surface to nose against the proximal neck of the projecting head of the neighboring molecule. The projecting heads immediately suggest a possible cross-bridge cycle. The relaxed projecting head, oriented almost as needed for actin attachment, will attach, then release Pi followed by ADP, as the lever arm with a purely axial change in tilt drives ∼10 nm of actin filament sliding on the way to the nucleotide-free limit of its working stroke. The overall arrangement appears well designed to support precision cycling for the myogenic oscillatory mode of contraction with its enhanced stretch-activation response used in flight by insects equipped with asynchronous fibrillar flight muscles.
INTRODUCTION
Myofilaments and myosin cross-bridges of asynchronous fibrillar insect flight muscle (IFM), especially IFM from giant waterbugs (Lethocerus sp.), form the most highly ordered lattice arrays known in any invertebrate muscle, providing unusually favorable material for biophysical studies of the disposition and action of cross-bridges (e.g., Tregear et al., 1998a,b; Taylor et al., 1999). Cross-bridges are the heads of myosin molecules, reaching from thick toward thin myofilaments, and known to be the molecular motors that produce force and shortening in muscle by ATP-driven cycles of mechanochemical partnership with the actin of thin filaments (Huxley, 1969; Lymn and Taylor, 1971). Much past work on IFM has emphasized the rigor state, in which exhaustion of MgATP maximizes attachment of strongly bound cross-bridges to actin, trapping these in a configuration of special interest because it approximates the end of the power stroke (Reedy et al., 1965; Chen et al., 2002). The relaxed state (Fig. 1), in which myosin head ordering and structure may well approximate those of isolated thick filaments, uninfluenced by interactions with actin, has been less fully described (Reedy et al., 1983; Reedy et al., 1992) but is clearly important as it is the state from which cross-bridges must depart to commence an active power stroke, and from which the action of the power stroke may be partly deduced by the degree and direction of such departure.
FIGURE 1.
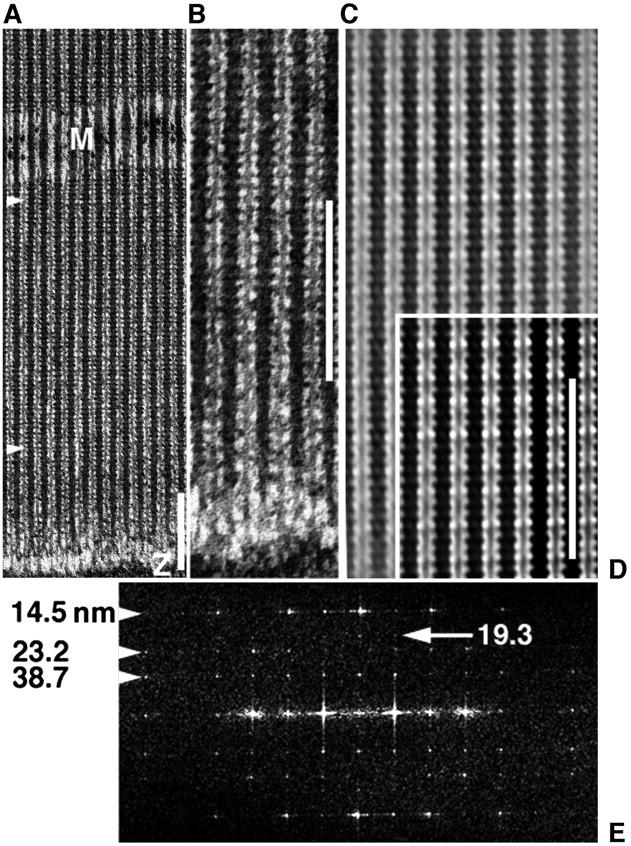
EM images and analysis of a myac layer (myosin and actin alternate where a 25 nm section includes single filament layer) from glycerinated, unstretched, Lethocerus IFM, plunge-frozen to −190°C in the relaxed state (5 mM Mg-ATP), then freeze-substituted in acetone at −80°C via TAURAC fixation. Scale bars = 232 nm. (a) EM shows ∼70% of length of a typical 2.67 μm sarcomere. Thick filaments keep a tight lateral register across the A-band of axial 14.5-nm cross-bridge repeat, despite a loose whole-filament register (meander of Z- and M-bands). (b) The same preparation as a but a different region showing clear C-filament connections to the Z-band. (c and d) The filtered image brings out a long 116-nm repeat as “beating” of a 14.5-nm myosin repeat against two 38.7-nm pseudorepeats of actin, one intrinsic to thick filaments, the other to thin filaments. In d, 38.7 nm appears as denser cross-bridge contacts with dense segments (troponin) along thin filaments, in contrast to rigor and active contraction where cross-bridges between troponins are predominant (Taylor et al., 1999). (e) The computed image transform from the A-band region between arrowheads in a shows that cryofixation has preserved native ordering of layer-line relative intensities (14.5 > 38.7 > 23.2 > 19.3 nm; see native x-ray pattern of Fig. 2 a). By contrast, direct chemical fixation suppresses 23.2 nm and enhances 19.3 nm (giving 14.5 > 38.7 > 19.3 ≫ 23.2 nm) (Reedy et al., 1983, 1987). Scale bars in a, b, and d all show ∼16 repeats of the 14.5-nm repeat of myosin head crowns.
Modeling of myosin layer-line intensities from low-angle x-ray diffraction patterns of relaxed fibers provides one way of acquiring such data, especially valuable because rapid time-resolved x-ray diffraction of muscle fibers is currently the most powerful method for monitoring in global detail the structural transitions that accompany activation and force generation (e.g., Harford and Squire, 1992, 1997; Squire, 1998, 2000; Linari et al., 2000; Irving et al., 2000).
Such modeling is more promising, because more constrained, when applied to diffraction data from muscles that have the most nearly crystalline lattices. Among striated muscles, IFM from Lethocerus (Schmitz et al., 1994) shares with skeletal muscles of bony fish (Luther and Squire, 1980; Harford and Squire, 1986; Luther et al., 1996) the distinction of having a “simple lattice” hexagonal unit cell in the A-band (Fig. 2 c, left and right, respectively). This means that all myosin filaments in a single A-band, or at least a substantial subdomain of the A-band, are arranged in rotational register. This provides a distinct modeling advantage over A-band arrays of frog, rabbit, and other higher vertebrate striated muscles (Fig. 2 c, center), which exhibit a statistical superlattice arrangement for the myosin filaments that has no systematic unit cell (Luther and Squire, 1980; Luther et al., 1996).
FIGURE 2.
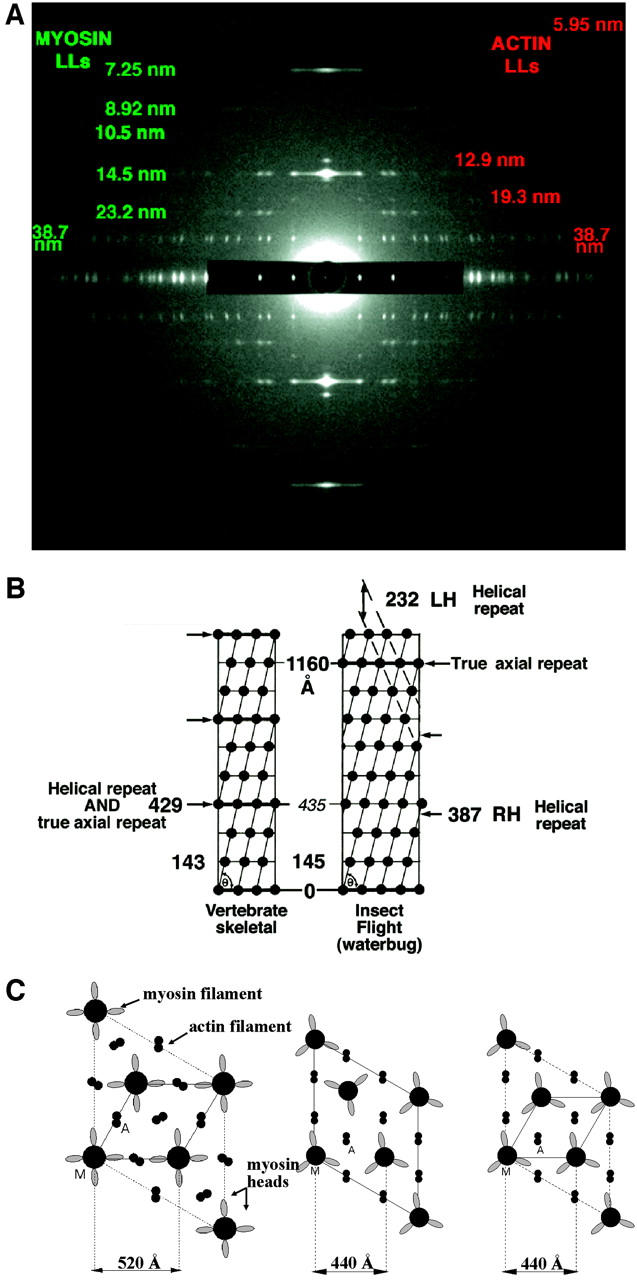
(a) The full relaxed insect low-angle x-ray diffraction pattern, showing 20 layer-lines, based on a 116-nm repeat, and ∼468 Bragg reflections. This pattern is obtained from relaxed bundles of glycerinated flight muscle from the waterbug Lethocerus indicus in the Mg-ATP relaxed state. (b) Surface helical net for vertebrate skeletal and IFM thick filaments comparing the helical repeat and the true axial repeat of the two structures. Rotation from crown to crown is 40° in vertebrate skeletal muscle and 33.75° in IFM. Vertebrate skeletal muscle has threefold rotational symmetry and IFM has fourfold. (c) Unit cell in transverse view for IFM, frog, and fish (from left to right, respectively) and their lattice spacings (A is actin filament, M is myosin filament). IFM and fish have a simple lattice, whereas frog has a superlattice with the myosin filaments not in rotational register.
Hudson et al. (1997) and Squire et al. (1998) have recently modeled thick filament structure in bony fish muscle to conform with low-angle x-ray diffraction data (Harford and Squire, 1986), basing myosin head shape on the S1 atomic model from Rayment et al. (1993a) and Rayment and Holden (1993). In that case, intensity data obtained at the CLRC Daresbury synchrotron source were processed using CCP13 software for stripping reflections from background in fiber diffraction patterns (www.ccp13.ac.uk and www.ccp13.org). The data were modeled with appropriately adapted conventional Fourier transform computations (Hudson et al., 1997). Modeling 56 reflections extending to a resolution of 1/6.5 nm−1, and refining on 23–25 different parameters that affect myosin head disposition, all model searches, regardless of starting configuration, converged via simulated annealing to essentially the same final head configuration with a global minimum R-factor of ∼3%.
That the final preferred structure in resting fish muscle (Hudson et al., 1997) would exhibit the two heads of each myosin molecule as nonequivalent in position, obviously distinct from one another in tilt, slew, and rotation, is unsurprising, given one's expectation that they diverge from their common junction of origin with the myosin rod without superimposing or clashing. More interesting is that the preferred model exhibits three nonequivalent forms of myosin head pairs with close but nonclashing heads, forming three nonequivalent cross-bridge crowns and requiring six nonequivalent head positions, though all heads are of the Rayment et al. shape. This observation, consistent with previous results on the “forbidden” meridional reflections seen in vertebrate muscle diffraction patterns (Huxley and Brown, 1967; Harford and Squire, 1986; Squire et al., 1982), is strengthened by a 3% R-factor that has proved exquisitely sensitive to small perturbations from the preferred head configurations (Hudson et al., 1997; Squire et al., 1998).
With such effective data-stripping and model-searching procedures available, together with the availability of very high quality x-ray diffraction patterns due to improved synchrotron-based technologies, we decided to model the low-angle x-ray diffraction pattern from relaxed glycerinated Lethocerus IFM (Fig. 2 a), which shows over 468 Bragg reflections (over 65 of which are strong and exclusively from the myosin filaments) extending out to a resolution of 1/6.5 nm−1. This would add welcome detail to what is already known of relaxed IFM thick filament structure (Fig. 2, b and c) from x-ray diffraction (Tregear and Clarke, 1984; Miller and Tregear, 1972; Reedy et al., 1987), scanning transmission electron microscopy (STEM) mass/length measurements (Reedy et al., 1981), and electron microscopy that decisively showed fourfold symmetry and the hand of the helix (Morris et al., 1991; Reedy et al., 1993; Schmitz et al., 1994). In contrast to the surface array of vertebrate skeletal myosin filaments, with three myosins per crown and crowns every 14.3 nm, Lethocerus IFM presents four myosins per crown, axially repeating every 14.5 nm (Fig. 2 b). The 14.5-nm spacing is the eighth order of the 116-nm thick filament repeat (rather than the third order of ∼43 nm in vertebrate muscles; IFM has no 43-nm repeat). The IFM fourfold crown repeat rotates by 33.75° (rather than 40° as in vertebrate filaments) with every 14.5-nm axial translation, developing a four-strand right-hand structure of helical pitch 154.7 nm, true axial repeat 116 nm, and with a pseudohelical repeat at 38.67 nm that matches the 38.67-nm pseudohelical repeat of IFM actin (the exact repeat of the actin is 2 × 38.67 nm). Vertebrate thick filaments have a three-strand structure of pitch 128.7 nm and true helical and axial repeat of 42.9 nm.
A proper model for resting IFM thick filaments should help to resolve whether activated cross-bridges reaching to bind actin must pivot out from origins within or between crown levels, a key point for interpreting the declines in meridional 14.5-nm and 7.2-nm intensity that accompany force generation in IFM (Tregear et al., 1998a,b; Taylor et al., 1999). In fact, this x-ray diffraction modeling, using the original and modifications of the Rayment et al. (1993a) head shape, shows that relaxed heads in IFM are essentially confined to the shelves and adopt a molecular shape similar to that described by Houdusse et al. (2000) and Houdusse and Sweeney (2001) for S1 with Mg•ADP•Vanadate bound. The paired heads of a single myosin molecule are assumed identical in shape, but they adopt nonequivalent positions. One head projects out from the thick filament surface, presumably emphasizing the projecting shelves of density seen in electron micrographs (Fig. 1), while the second head reaches circumferentially around the backbone to bring its ATP-binding region into contact with the essential light chain region of the neck behind the projecting head of an adjacent myosin molecule. This is not the same as the intramolecular contact described between coheads within unphosphorylated smooth muscle myosin (Wendt et al., 2000) where the converter domain of one head is contacted by the actin-binding face of the co-head, not by its ATP-binding site. Nevertheless, the contact found here could likewise greatly inhibit the ATPase of the inner head in the resting state. There could also be an indirect effect of the inner head on the ATPase of the outer head through contact with the essential light chain. Thus any mechanical perturbation of this inter-head contact that might result from stretching the muscle could make it a key trigger-point for the release of ATPase inhibition that enables the stretch-activation response for which IFM is famous (Pringle, 1967). A possible contractile cycle is immediately evident from the close similarity in position with respect to actin between the catalytic domain of the outward head in our relaxed structure and the catalytic domain configuration on actin in rigor muscle.
MATERIALS AND METHODS
Muscle preparation
As previously described (Reedy et al., 1992), dorsal longitudinal muscles (DLM) of Lethocerus indicus, imported live after being collected in Thailand near Chiang Mai by Torben and Alison Poulsen, were permeabilized, glycerinated, and stored for 2–40 months at −100°C in GLY 75 RLX (relaxing buffer (below) made up in 75% glycerol with 5 mM DTT). X-ray diffraction was carried out as described (Tregear et al., 1998a,b) on horizontal bundles of 15–25 fibers, 0.3 × 16 mm, glued with cellulose nitrate cement to longitudinally aligned stainless steel rods in the Kapton-windowed x-ray diffraction chamber of a muscle mechanical set-up (Güth Muscle Research System; Scientific Instruments for Muscle Research, Heidelberg; cf. Güth and Wojciechowski, 1986). Fibers were washed free of glycerol storage buffer by a 3-min perfusion with relaxing solution containing (in mM) MgCl2 (5), ATP (5), EGTA (5), NaN3 (5), and MOPS buffer (20) at pH 6.8, then pulled just taut for orientation, and subject to diffraction at 23°C in the same buffer. For thin-section electron microscopy, single fibers mounted across stainless U-pins (Reedy et al., 1994) were soaked in relaxing buffer with 15% glucose as cryoprotectant, then quick-frozen by manual plunging into liquified ethane cooled to −180°C and freeze-substituted as described (Taylor et al., 1999) for Araldite embedding and thin sectioning. Fourier transforms and filtered images were produced using CRISP software (www.calidris_.com) on TIFF images captured by an AGFA DuoScan T2500 flatbed scanner at 600–1250 dpi from EM negatives.
X-ray data acquisition
Patterns were recorded using x rays of λ = 0.1033 nm on the BioCAT beamline 18-ID at the APS using the small angle camera described by Irving et al. (2000) at a 1960-mm specimen-detector distance and a CCD detector (Reedy et al., 2000). The fiber bundle was centered on the x-ray beam using a theodolite to superimpose it over a beam-burn on burn paper. The beam was focused to give a cross section of V × H = 200 × 600 μm at the specimen and 75 × 180 μm at the detector. Thus 6–8 fresh 600 μm segments along the 5-mm open length of fiber bundle could be translated into the beam one after another as needed to start fresh on an unirradiated specimen region. A strip of Al sheet metal ∼0.4 mm thick was positioned over the CCD along the equator, attenuating the strongest equatorial spots to ∼0.01 and thereby avoiding a readout artifact in the CCD images. Exposures of 100 ms using 90% beam attenuation routinely gave good patterns (Fig. 2 a) from fiber bundles 250–350 μm in diameter. About ten patterns approaching this quality were obtained, but none quite matched its orientation and spot-sharpness, so this pattern was used for definitive final analysis.
Data stripping and modeling
In this work, low-angle x-ray diffraction patterns (Fig. 2 a) were stripped by the application of CCP13 software (CCP13 is the BBSRC/EPSRC/CCLRC-funded “collaborative computational project in fiber diffraction” (http://www.ccp13.ac.uk and http://www.ccp13.org). The shape of the myosin head (Fig. 3 a) was defined on the basis of the structure deposited at the Brookhaven database (Rayment et al., 1993a); we started with a lower resolution structure kindly given to us by Ivan Rayment. The S1 head shape was modeled using 59 spheres each of radius 8.61 Å (Fig. 3 b) such that the computed Fourier transform of the model head and the Rayment data agreed out to a resolution of 65 Å with a correlation coefficient of 0.995. The positions of the myosin heads, relative to the axes indicated in Fig. 3, f–h, were described using the smallest number of structural parameters necessary to define the structure adequately (Fig. 4; Table 2). Fourfold rotational symmetry and perfect helical symmetry for the whole filament were assumed throughout. Thus only the positions of one myosin head pair on one 14.5-nm-spaced “crown” of cross-bridges needed to be defined. Chosen parameters (Fig. 4) included the radius and azimuth of the midpoint between the two myosin head origins in one molecule, the surface separation and angle of the origins of these two myosin heads, and the tilt, slew, and rotation about its own axis of each of the two nonequivalent myosin heads, thus making 10 parameters. In addition to this, there are another three parameters which describe the pivot tilt, pivot slew, and pivot rotation of the catalytic domain relative to the neck domain. This brings the total number of parameters to 13.
FIGURE 3.
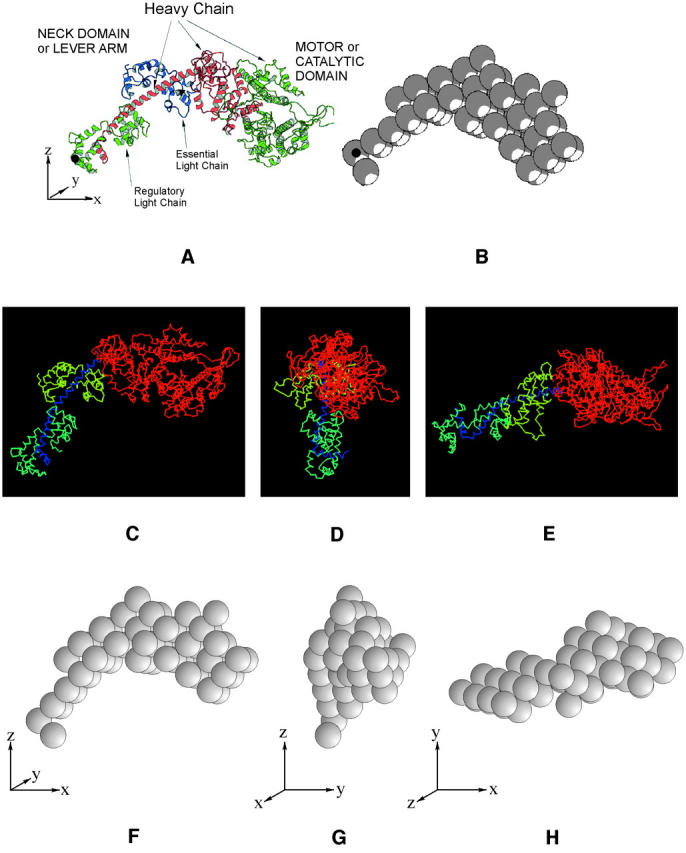
(a) The myosin head structure (Rayment et al., 1993a) as downloaded from the pdb database showing the definitions of the head orientation in terms of the x, y, and z axes and illustrating the myosin heavy chain and the two light chains (the regulatory light chain (green) and essential light chain (blue)). The long α–helical part of the heavy chain in red in the core of the regulatory light chain region provides the link between the heads and the rest of the myosin filament. The actin-binding face of the myosin head is top right and slightly facing up and out of the page. The motor or catalytic domain and the neck or lever arm are indicated. (b) Representation of a in terms of a 59-sphere model. The volume of these spheres, each of radius 8.61 Å, was chosen to express the overall mass of the myosin head, assuming constant protein density within all spheres. The black dots in a and b represent the position of the origin (0, 0, 0). (c–h) Three different views of the head in a and of its simulation in b illustrating the definition of the three head reference axes x, y, and z. These are initially set parallel to muscle reference axes X, Y, and Z. The parameters discussed in the text and in Fig. 4 refer to movements around these axes. The z axis is parallel to the muscle long axis which we call Z. If the x axis starts pointing out radially from the filament surface, this defines the filament axis X. The Y axis is orthogonal to X and Z. The head tilt (β) refers to the tilt of the head x axis around the Y-reference axis in the X-Z plane. The slew (α) refers to the rotation of the head x axis around the muscle Z axis in the X-Y plane. The rotation (θ) refers to movements around the head x axis. a shows the zero tilt position of the head, but clearly the head mass is already tilted up. The axial range of tilts was therefore set at 45° upward and 135° downward since beyond these values the heads would sterically clash with the backbone. (f–h) These show the head orientations as in c–e but for the representation of the head as a set of 59 spheres. The initial searches were carried out with the 59-sphere model (f–h). Final searches and refinements were carried out with the full pdb structure (c–e).
FIGURE 4.

Illustration of the 13 model parameters that were used in the searches and which are detailed in the caption to Fig. 3 and in Table 2.
TABLE 2.
Parameters needed to define the myosin cross-bridge lattice in IFM and parameter values for the best model
| Best model values | |||
|---|---|---|---|
| Parameter | Typical range | Head 1 | Head 2 |
| *Slew, α | −90° ≤ α ≤ 90° | −101.71° | 84.77° |
| *Tilt, β | −135° ≤ ι ≤ 45° | −10.92° | −32.23° |
| *Rotation, θ | 0° ≤ θ ≤ 360° | −5.23° | −6.39° |
| Radius, R | 5.5 nm ≤ Rmy ≤ 15.0 nm | 12.89 nm | |
| Lattice rotation, φ | 0° ≤ φ ≤ 360° | 226.52° | |
| Head separation, Hs | 0 nm ≤ Hs ≤ 5.0 nm | 3.85 nm | |
| Head angle, Ha | −45° ≤ Ha ≤ 45° | −26.28° | |
| Pivot slew, αp | −90° ≤ αp ≤ 90° | −70.30° | |
| Pivot tilt, βp | −90° ≤ ιp ≤ 90° | −27.26° | |
| Pivot rotation, θp | 0° ≤ θp ≤ 360° | 60.23° | |
Note that the parameters marked * have individual values for each of the nonequivalent myosin heads. Other parameters are the same for both heads. The total number of parameters used was 13.
The zero tilt, zero slew, and zero rotation configuration was obtained by taking the Rayment et al. (1993a) pdb file and placing it on the filament surface as shown as a shaded head in Fig. 4.
The geometry of the insect flight muscle myosin filaments in the simple hexagonal A-band unit cell (Fig. 2 c), as described above, is qualitatively similar to that of fish muscle (Hudson, 1997; Hudson et al., 1997) and can be fully described using the parameters provided by the software developed for fish muscle. As mentioned above, the eight myosin heads per crown in insect flight muscle are arranged in pairs to form a four-stranded helix with a repeat of 116.0 nm (Fig. 2 b). Each level of myosin heads is separated axially by 14.5 nm giving a total of eight levels within the repeating unit, each level being rotated azimuthally by 33.75° from the next. In the modeling, the starting diameter of the thick filament backbone was assumed to be slightly larger (because of the extra cross-bridge strand) than in fish muscle and therefore the starting radius (Fig. 4) for each myosin head was set at ∼7 nm (cf. Morris et al., 1991). All such parameters are user-definable in the modeling software of Hudson et al. (1997), and the search can cover both smaller and larger values. Therefore, many different starting IFM structures could be and were easily generated; the final result proved independent of the starting model.
As discussed earlier, analysis both of the low-angle x-ray diffraction pattern and of electron micrographs of insect flight muscle indicates that the myosin heads probably form an exact helix with none of the perturbations observed in fish or frog muscle. This exact helicity means that, for the entire filament, every pair of myosin heads within one myosin molecule can be assumed to have the same conformation. This, in turn, means that only 13 parameters need to be determined (Table 2), rather than the 22–25 needed for fish muscle (Hudson et al., 1997; Squire et al., 1998). The geometry of the filament, coupled with the geometry of the unit cell in which it is situated, gives the Fourier transform 180° rotational symmetry, meaning that only half of the transform is unique and needs to be calculated.
Initial modeling with the simulated annealing were done using the 59-sphere representation for the myosin head and moving the catalytic domain relative to the neck domain by pivoting about sphere number 21 to change the head shape from the Rayment head. Then local minimizations and final refinements were done using the atomic coordinates using the pdb file of the Rayment head and pivoting the catalytic domain about the Cα position of residue 780. This allowed us to get a final head shape that we could directly compare with the other known crystal structures, as in Fig. 7.
FIGURE 7.
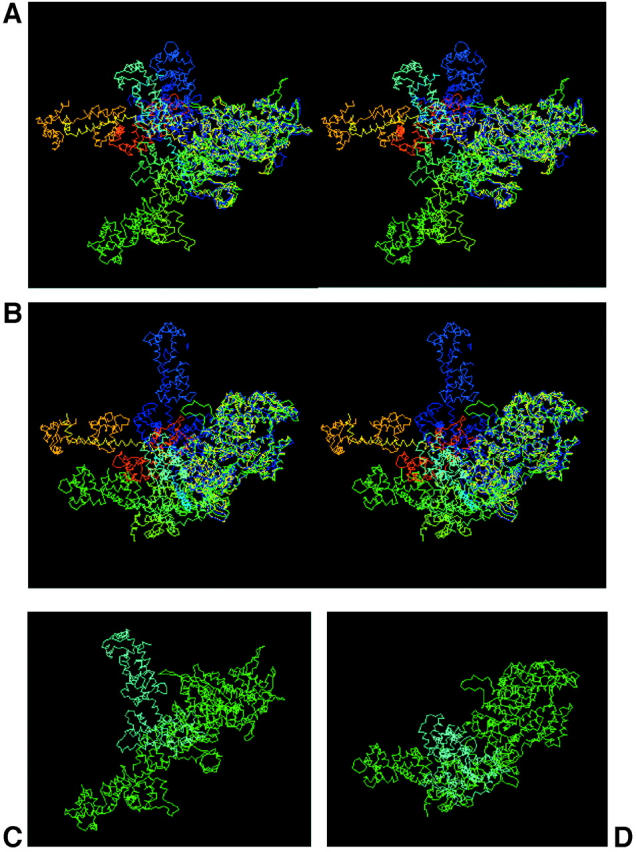
Comparing S1 from our model with published crystal structures. All are superimposed at the catalytic domain, so that the differences between models are expressed by the different positions of the neck region or lever-arm. (a and b) Stereo views. Green and pointing slightly toward the viewer is the Rayment et al. (1993a,b) chicken skeletal myosin with no nucleotide (i.e., rigor-like); dark blue is the Dominguez et al. (1998) chicken smooth muscle myosin in ADP•AlF4 form; pale blue is our Lethocerus model; orange is the Houdusse et al. (2000) scallop myosin in Mg•ADP•VO4 form. The view in a has the actin filament axis vertical and to the right, with the M-band at the top and Z-band at the bottom, whereas b is the view down the actin filament axis toward the Z-band (behind the page). (c and d) Direct comparison of the relaxed Lethocerus head shape with the Rayment et al. (1993a) structure. Green is the Rayment rigor structure and pale blue shows our Lethocerus model superimposed on the Rayment structure (Z-band is at the bottom in c and behind the page in d).
Helix geometry and Bessel orders for IFM thick filaments
As the helix of myosin heads in insect flight muscle is thought not to contain perturbations, it is possible to make extensive use of Bessel function Fourier transforms. This speeds up the Fourier transform computation because the Bessel function transform requires only the coordinates of one pair of myosin heads. The general transform for insect muscle (as used for fish muscle) would otherwise require determination of the positions of all 64 myosin heads in the 116-nm myosin filament repeat. Also, as detailed below, if the insect flight muscle diffraction pattern is considered only out to a resolution of 6.5 nm, appropriate modeling requires only the inclusion of one Bessel function order per layer-line. This saves on both calculation time and computer memory.
The strict description of the cross-bridge helix on IFM thick filaments is that it is a four-stranded 32/3 helix (i.e., each helix repeats after a true repeat distance c in which there are 32 cross-bridge pairs in three turns of the helix) of true repeat 464 nm. In this case the helix pitch is 154.7 nm (= 4/3 × 116 nm) but there is a noninteger number of heads per turn. Using the conventional layer-line equation for diffraction from helical structures (see Harford and Squire, 1997) with u (number of turns) = 3 and v (number of subunits) = 32 (which come from the insect thick filament geometry) gives:
 |
(1) |
Here m can be any integer (it corresponds to orders of the first meridional reflection), lc is the layer-line number on the full 464-nm repeat, and n is the Bessel function order. Varying m as an integer for a given lc gives the appropriate Bessel function contributions (n) on that particular layer-line. However, because the structure is four-stranded and the number of subunits in a full helix repeat of each strand is also divisible by four, the myosin filament repeat is reduced from being c to being c/4. This means that only layer-line numbers lc which are multiples of four will be observed. Relative to fish muscle thick filaments, if they were considered as perfect helices, far fewer Bessel function contributions on each layer-line are required to model the IFM pattern at 6.5 nm. This is illustrated in Table 1 .
TABLE 1.
Layer-lines expected from myosin and actin filaments and troponin in IFM
| Orders of 464 nm lc | Orders of 232 nm l (=lc/2) | Spacing nm | Myosin filaments (116-nm repeat) | Actin filaments (77.33-nm repeat) | Used in modeling |
|---|---|---|---|---|---|
| 2 | 1 | 232.00 | |||
| 4 | 2 | 116.00 | J12 | ||
| 6 | 3 | 77.33 | J13 & J−15 | ||
| 8 | 4 | 58.00 | J−8 | ||
| 10 | 5 | 46.40 | |||
| 12 | 6 | 38.67 | VS J4 | VS J−2 + troponin | |
| 14 | 7 | 33.14 | |||
| 16 | 8 | 29.00 | J16/J−16 | ||
| 18 | 9 | 25.78 | J11 | ||
| 20 | 10 | 23.20 | S J−4 | Yes | |
| 22 | 11 | 21.09 | |||
| 24 | 12 | 19.33 | J8 | S J−4 + troponin | |
| 26 | 13 | 17.85 | |||
| 28 | 14 | 16.57 | J−12 | ||
| 30 | 15 | 15.47 | J9 | ||
| 32 | 16 | 14.50 | VS J0 | Yes | |
| 34 | 17 | 13.65 | |||
| 36 | 18 | 12.89 | J12 | J−6 + troponin | |
| 38 | 19 | 12.21 | |||
| 40 | 20 | 11.60 | J−8 | ||
| 42 | 21 | 11.05 | J7 | ||
| 44 | 22 | 10.54 | S J4 | Yes | |
| 46 | 23 | 10.09 | |||
| 48 | 24 | 9.67 | J16/J−16 | J−8 + troponin? | |
| 50 | 25 | 9.28 | |||
| 52 | 26 | 8.92 | SJ−4 | Yes | |
| 54 | 27 | 8.59 | J5 | ||
| 56 | 28 | 8.29 | J8 | ||
| 58 | 29 | 8.00 | |||
| 60 | 30 | 7.73 | J−12 | J−10 + troponin? | |
| 62 | 31 | 7.48 | |||
| 64 | 32 | 7.25 | VS J0 | Yes | |
| 68 | 33 | 7.03 | J3 |
In each case Bessel function orders are given for the strongest predicted myosin and actin peaks. S, strong; VS, very strong.
Thick and thin filaments and definitions
We have seen in the last section that the Bessel orders on particular myosin filament layer-lines can be determined using Eq. 1 and the proper cross-bridge helix repeat c of 4 × 116 nm. A certain set of layer-line numbers lc was defined on this basis. However, it so happens that in insect flight muscle the geometry of the actin filaments is different from the nearly 13/6 helix found in vertebrate muscles, but is more like a 28/13 helix with a true repeat of 77.33 nm (2/3 × 116 nm). This structure has a pseudorepeat (crossover repeat) of ∼38.67 nm, which is exactly one-third of the true 116-nm repeat of the myosin filaments. Because the actin and myosin repeats are related, it is convenient to refer all layer-lines to the common axial repeat of 232 nm. This is 2 × 116 nm for the myosin filaments and 3 × 77.33 nm for the actin filaments, but as it happens it is only one-half of the c repeat used in Eq. 1 to calculate the Bessel order contributions on different layer-lines. This means that the layer-line numbers l that are used from now on to index the IFM low-angle layer-lines are all multiples of two (rather than lc being a multiple of four based on a repeat c = 2 × 232 nm) and that the layer-lines from the actin and myosin filaments can all be included as orders of the common repeat of 232 nm. Table 1 summarizes the predicted Bessel orders from the myosin and actin filaments and shows which are expected to be strong.
Searching and optimization procedures
Details of the optimization procedures are given in Hudson (1997) and Hudson et al. (1997). They are only briefly summarized here. The “best” structures, as defined by the objective R-factor described below, were identified by searches and refinements involving simulated annealing, downhill simplex, and other optimization routines (Brent, 1973; Nelder and Mead, 1965; Press et al., 1992). Simulated annealing algorithms (Press et al., 1992) are ideal for searching for global minima in a parameter space that consists of many local minima. It is possible, using simulated annealing, to start at an arbitrary point in parameter space (restricting the parameter ranges to within physically reasonable bounds makes things quicker) and then to locate the global minimum. Once the annealing algorithm had found a reasonably good model and was at a very low temperature, we used local minimization routines to find the absolute minimum in the region. Two local minimization routines were used; the downhill simplex method and Powell's method (Press et al., 1992). These routines work in markedly different ways; reaching the same local minimum by both methods was a good test of the reliability of the result. The refinement protocol was: 1), find a good model using simulated annealing; 2), refine it using the downhill simplex method; 3), refine it using Powell's method; 4), repeat the last two steps. Goodness of fit was assessed by a weighted R-factor given by:
 |
(2) |
where Io is the observed intensity, Ic is the calculated intensity, N is the number of intensities, and σi denotes the standard deviation associated with  .
.
In summary, in this modeling, 65 independent reflection intensities were used in searches to optimize ∼13 parameters. Finding an optimal model from the insect data was a relatively straightforward task once the searching techniques had been successfully implemented with fish muscle (Hudson et al., 1997). As described earlier, the searches identified a single preferred arrangement for the myosin heads in resting insect muscle.
RESULTS AND DISCUSSION
Electron microscopy of relaxed IFM
Fig. 1 shows the thin-section electron microscope appearance of the relaxed-state A-band lattice in quick-frozen freeze-substituted Lethocerus IFM. Part of a major electron microscopy study of IFM that will be further detailed elsewhere (in preparation), Fig. 1 is offered here to orient readers to the source structure from which our x-ray diffraction data were acquired. As described fully in the figure legend, cryofixation preserves some native lattice features more faithfully than our best previous efforts with chemical fixation. The Fourier transform (Fig. 1 e) and averaged images (Fig. 1, c and d) are the first from Lethocerus IFM to clearly demonstrate the advantages of using cryomethodology.
In IFM electron micrographs (Fig. 1, a–d) the 14.5-nm period is marked by shelves ∼6 nm thick that project out 5–7 nm at 90° from thick filament backbones ∼6 nm in radius. These crown shelves appear as dense stripes or ridges in longitudinal sections, and as square profiles 17–22 nm on a side in ultrathin transverse sections (Schmitz et al., 1994; Reedy et al., 1993). Consistent with this is the prominence of the 14.5-nm layer-line in the Fourier transform in Fig. 1 e. On some calculations the projecting shelf volume is sufficient to contain 76–100% of the eight heads per crown (Reedy et al., 1992), where 100% implies that every relaxed head and its origin both remain fully within a crown shelf until cross-bridge action tilts heads axially away from crown level. Other calculations (Morris et al., 1991) indicate that the shelves might contain only the catalytic domains of myosin heads, with regulatory domains and origins lying between crown levels, so the mass of each cross-bridge might leave the crown shelf entirely as it pivots out from intercrown origins to bind actin. This issue is illuminated but not settled by electron micrographs from both cycling (Taylor, et al., 1999) and noncycling (Schmitz, et al., 1997) nucleotide states, which commonly show apparent cross-bridge contacts with actin that extend directly from the density of the crown shelf, implying intracrown cross-bridge origins.
Preliminary modeling of insect diffraction data
The currently accepted atomic model for actin filaments was arrived at not by direct crystallography, but was “constructed from the atomic structure of the actin monomer to fit the observed x-ray fiber diagram…[finding]…a unique [‘best’] orientation of the monomer with respect to the actin helix [of 8000+ structures computationally tested]” (Holmes et al., 1990). Here, we report the use of a related (not identical) approach to model the form and arrangement of myosin heads on a highly regular myosin filament, computer-generating and testing some 5000+ randomly generated models repeatedly to find and confirm a unique best fit to the muscle fiber pattern.
The unprecedented detail and sharpness provided by low-angle synchrotron x-ray diffraction patterns from relaxed Lethocerus IFM fibers, as recorded at the Argonne/APS/BioCAT beamline, is seen in Fig. 2 a. The pattern is extremely rich and well sampled. Layer-line numbering on a 232-nm axial repeat is shown. It turns out that modeling the insect pattern presents a complication. Unlike fish muscle, in insect flight muscle diffraction patterns there are certain layer-lines, such as the sixth at 1/38.7 nm−1, which contain contributions both from the actin filaments and from the myosin filaments because of their related helical periodicities. A priori the contribution from each filament is unknown. There is an added difficulty that the troponin on each actin filament also has an axial repeat of 38.7 nm, and this will contribute strongly on and near to the meridian of the diffraction pattern at orders of that repeat. However, from the known geometry of the myosin head and actin arrangements it is possible (Table 1) to identify which layer-lines will contain contributions from only a single filament type and which will have contributions from both filaments.
The major example of a compound layer-line containing contributions from myosin, the actin filament, and troponin is the 38.7-nm layer-line (l = 6 on a 232-nm repeat). The second order of this at 1/19.3 nm−1 also has a contribution from actin and troponin as well as a weaker contribution from myosin. For the initial modeling of just the resting myosin head pattern it was decided to omit the sixth and twelfth layer-lines (and all multiples of six) and to include only those myosin layer-lines with Bessel orders of 0 and ± 4, namely, those at d-spacings of 23.20, 14.50, 10.54, 8.92, and 7.25 nm. As expected, these are, in fact, the strongest layer-lines in Fig. 2 a apart from l = 6 at 38.67 nm. The 38.67-nm layer-line, though labeled in green in Fig. 2 a, was not used in the modeling process, only predicted from the model after the model had been produced. As it happens, the original insect muscle pattern contains many more reflections than can realistically be modeled in a short period of computational time (one week). It was a considerable help to be able to ignore in the computations the layer-lines observed to be weak. A resolution filter was also applied to the data so that information originating from a higher resolution than 6.5 nm was omitted. The layer-lines used finally in the modeling process are listed in Table 1, labeled in green in Fig. 2 a, and shown in Fig. 5 a. Once a model has been found, it is possible to re-create the myosin part of the mixed sixth and twelfth layer-lines using standard Fourier transform methods and thereby identify the parts of the layer-lines with contributions from actin filaments and troponin. If required, other “weak”' layer-line profiles not included in the refinement can also be computed from the final model to check that large intensities are not predicted on those layer-lines.
FIGURE 5.
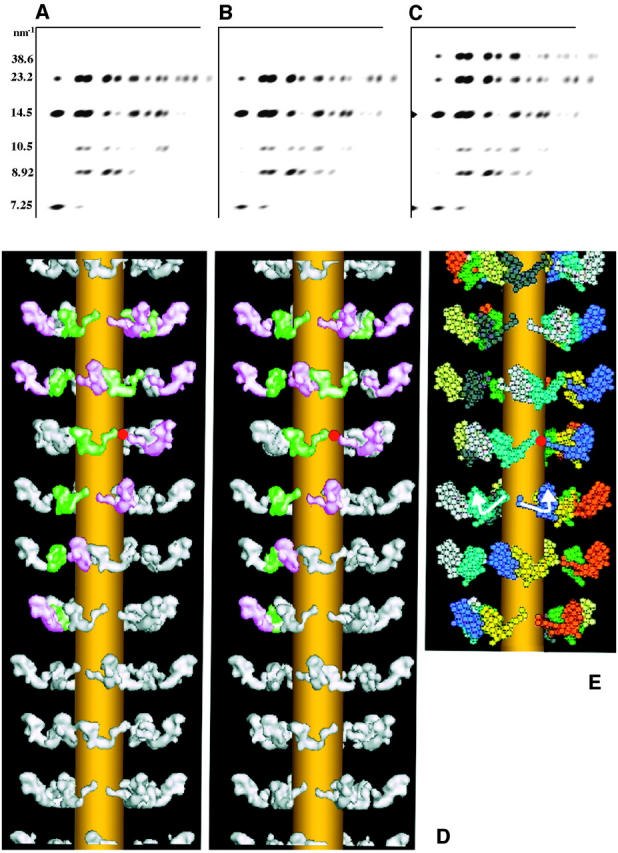
(a) Lower right quadrant of the observed relaxed IFM x-ray diffraction pattern stripped using CCP13 analysis and used for modeling 65 reflections with a resolution cut-off of 6.5 nm. The myosin layer-line spacings are shown at the left. (b) The diffraction produced from the best model (illustrated in d). (c) The calculated diffraction pattern including the meridional reflections and the 38.6-nm layer-line, none of which were used in the modeling. Only the myosin contribution on the 38.6-nm layer-line is shown. The remainder of that layer-line is presumed to come from the actin filaments (outer end) and troponin (inner end). (d) Stereo image of the best model for the relaxed IFM myosin filament using the observed data in a. The heads were modeled at 20 Å resolution using the pdb atomic coordinates. Also, on the right (e), the best model is shown with the heads displayed as a 59-sphere model, with the white arrows showing the direction of the two heads in one myosin molecule and the red spot marking the shared origin of a corresponding pair of heads (also shown in d). The backbone is shown in d and e as a simple cylinder. It has been included only for visual clarity and has not been fitted to the data. The image in d toward the top shows the inner heads colored green and the outer heads colored pink. In e, heads in equivalent positions along helical tracks through different 14.5-nm-spaced crowns are the same color.
In the simulated annealing modeling, the myosin head shape was represented as in Fig. 3, and the head positional parameters were as shown in Fig. 4. Note that these included changes in the shape of the myosin head at a hinge between the catalytic domain and the neck region (the so-called “pivot” angles—see Materials and Methods for details). The model of the insect thick filament structure could be assumed to be perfectly helical (i.e., there is no known perturbation of the cross-bridge array), and the benefits in searching times were noticeable. A single function evaluation took ∼0.1 s using Bessel function look-up tables; up to 3–4 times quicker than the fish muscle calculations (Hudson et al., 1997). The speed of the complete search was also increased by having to search over only 13 parameters (see Fig. 4 and Table 2).
The preferred model
The best model parameters coming from the search are shown in Table 2. The preferred structure produced the simulated diffraction pattern shown in Fig. 5 b with an R-factor over 65 independent reflections of 9.7%. This same lowest R-factor model was consistently identified after evaluating ≥5000 models generated in every search, beginning these searches from many widely disparate starting myosin head arrangements. A 3D reconstruction of the data at 2-nm resolution (i.e., combining model phases with observed amplitudes) is shown in Fig. 5 d. Note that similar refinements using the original Rayment head shape (Rayment et al., 1993a) gave a lowest R-factor of 22.2%, but this represented a physically impossible structure illustrated in Fig. 6, a and b, left) where adjacent heads are sterically clashing. Models using the Rayment head shape and giving a physically plausible structure (with nonoverlapping heads) gave R-factors which were all much >22.2%. Making use of the Dominguez head shape (Dominguez et al., 1998), which is in fact much closer to our preferred shape than is Rayment, gave an R-factor of ∼17.8%, in this case with nonclashing heads. However, since our best model gave an R-factor of only 9.7% it is clear that changing the pivot tilt, pivot slew, and pivot rotation of the catalytic domain relative to the neck enabled a profound improvement in the goodness of fit. Note that the simulated annealing protocol allowed searches over all conceivable positions of the catalytic domain on the lever arm, thus including shapes similar to all the myosin head structures that have been seen by protein crystallography. However, every model that gave an R-factor anything like the preferred structure, when further subjected to local refinement (downhill simplex, etc.), always ended up at the same structure as in Fig. 5, d and e. There was no alternative structure, stable to further downhill simplex treatment, that gave a comparable R-factor to our preferred model. That our best model not only gives a relatively low R-factor but also shows heads physically nestling together (Fig. 6, a and b, right) without any nonclashing constraint being imposed upon them is strong evidence in favor of the validity of the model and the power of the method.
FIGURE 6.
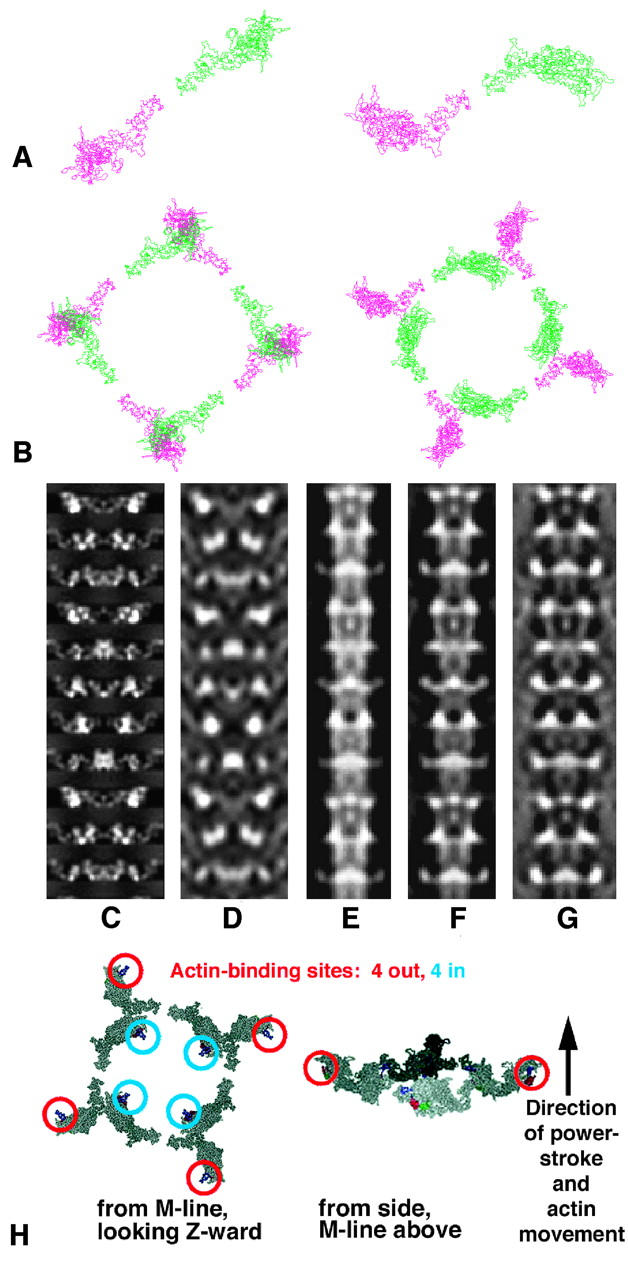
(a and b) The lowest R-factor structures using a Rayment head (left; R-factor 22.2%) and the new modeled head (right; R-factor 9.7%), both viewed looking down the filament axis toward the Z-band. In each case, a shows the relationship between the two heads of one myosin molecule and b shows one full crown of eight heads. Note that the Rayment structure (left) has sterically clashing heads. (c–g) Comparison of x-ray and electron microscopy models (Morris et al., 1991). c, d are projections of the best model of this study at 20 Å and 60 Å resolution, respectively, and e–g are projections of the IFM thick filament 3D reconstruction of Morris et al. (1991) based on analysis of electron micrograph images of negatively-stained insect thick filaments with the 3D map recalculated with 100%, 50%, and 0% weighting for the equator. Among other things, reduced weighting of the equator reduces the contribution from the backbone, perhaps making the EM model more comparable to the x-ray model. Comparison of c, d, and e–g suggests that the polarity of the x-ray model is such that the M-band is at the top, as it is known to be in the electron micrograph reconstructions. (h) Two views of a single myosin head crown in the best model showing the actin-binding sites on the myosin heads. As in a and b, the left image is a view looking Z-ward from the M-band and the right shows a side view with the actin filament axis nearly vertical, with the M-band at the top, Z-band at bottom.
As can be seen in Fig. 5, d and e, and Fig. 6 h, the two heads in one myosin molecule are in quite different dispositions, although they were modeled as having the same shapes. One head projects out from the filament surface and tucked in behind it, at a much lower radius, is one of the heads from a neighboring myosin molecule. It is as though this inner head might act as a support holding the projecting head in position. Note that the contact face on the inner head is on the opposite side of its catalytic domain from the actin-binding site, therefore at or near its ATP-binding site, whereas the contact face on the outer head appears to lie on or near the essential light chain region of the neck. In summary, the four head pairs in one crown form a fourfold ring of interacting heads (Fig. 6 b, right), exhibiting contacts that appear likely to physically stabilize the crown assembly, with contact interfaces strategically placed in resting muscle to enhance direct ATPase inhibition of the inner heads and possibly inhibition of the ATPase of the outer head through the essential light chain.
Comparison with previous IFM observations
The final model shown in Fig. 5, d and e has myosin head mass filling crown shelves of density every 14.5 nm along the thick filament. This structure is therefore quite consistent with earlier ideas about IFM thick filaments (e.g., Fig. 1). The tilts of the two heads of about −11° and −32°, respectively (Table 2), are both close to putting the long axis of the head roughly perpendicular to the myosin filament long axis, as originally suggested in Reedy et al. (1965). Compared with the 3D reconstruction analysis from electron microscopy of negatively-stained, isolated, IFM thick filaments by Morris et al. (1991), the new model in Fig. 5, d and e has the heads less tilted away from the perpendicular. Heads in the negatively-stained filaments may have been slightly distorted by the stain. However, in both cases, slightly splayed head pairs are consistent with the observations.
The filament 3D reconstruction of Morris et al. (1991) does not define the myosin head positions as explicitly as our x-ray model, but it comes from half-filaments whose M-line/Z-line polarity is known, and so offers our best available guide for assigning this polarity in our x-ray model. Projected density models of both structures in Fig. 6, c–g show the two aligned for a best global match. The two models differ in radius, so it is not surprising that the match with the x-ray model is nonideal at some crown levels. The x-ray model places the head mass at a higher radius than expected from EMs, with origins at 12.9 nm, outer tip at 20 nm, and averaged crown mass centered at radius 15.8 nm. The relatively narrower model from EM negative staining as well as measurements of thin-sectioned IFM (Appendix 2 in Reedy et al., 1992) suggest that radial shrinkage of a wider native structure is likely, brought about as the drying of negative stain or the action of chemical fixatives and solvent dehydration flattened the heads against the filament backbone. Even with this reservation, it remains clear that the head curvature of the outer ends of the heads is in the upward direction both in the electron microscopy projections (Fig. 6, e–g) and in this orientation of the x-ray projection (Fig. 6, c and d). We found all other alignments less satisfactory, especially so for trials with the EM model reversed top for bottom. For the EM model orientation shown (Fig. 6, e–g), the filament M-band location is known to be at the top, so our conclusion is the same for the x-ray model orientation in Fig. 6, c and d and its surface-model stereo view in Fig. 5 d. The resulting head orientation, with the concave part of the curved myosin head facing toward the M-band, is similar to the conclusion from resting fish muscle myosin filaments (Hudson et al., 1997; Cantino et al., 2000) and is the head orientation required for the known head interaction with actin in the rigor state (Rayment et al., 1993b; Holmes, 1996, 1998). Details of the head configuration in each fourfold crown, including the positions of the actin binding sites on the heads and the direction of the M-band, are given in Fig. 6 h.
Besides the presence of most of the head mass within axially limited shelves of density around the thick filament, other observations consistent with the model presented here include the observations that:
It is unlikely that any significant part of the relaxed IFM 1/14.5-nm−1 meridional intensity comes from the backbone or noncross-bridge structures, because the cross-bridge rearrangement that occurs on going into rigor abolishes all but 2–10% of this intensity. Since the resting head conformation in the model in Figs. 5 and 6 has the head mass more-or-less perpendicular to the filament axis, this will make the intensity of the 14.5-nm reflection relatively high. However, in rigor the heads will move off their 14.5-nm-spaced origins on myosin and in addition will become tilted into the rigor conformation thus radically reducing the intensity of the 14.5-nm reflection.
On a per-head basis, the intensity of the relaxed IFM 1/14.5-nm−1 meridional reflection is apparently substantially greater than that of the resting frog or fish 1/14.3-nm−1 (M3) meridional peak relative to the rest of the myosin layer-line pattern. This would be consistent with the less protrusive ridges of mass marking the ∼14-nm repeat in thick filament electron micrographs from frog and fish muscles (Stewart and Kensler, 1986; Kensler and Stewart, 1989; Eakins et al., 2002). It is also consistent with the more axially extended mass distribution in the head arrangements in the resting fish muscle x-ray model of Hudson et al. (1997) and Squire et al. (1998).
Cross-linking of intermyosin head contacts by trapping of the bifunctional ATP analog bis22ATP (Levine, 1993, 1997) indicates primarily circumferential associations in IFM thick filaments, as in our x-ray model (Fig. 6 h), in contrast to the axially distributed intermyosin head contacts detected by this method in thick filaments from other striated muscles.
Comparisons with other muscles
Our model will be valuable as it stands for direct analysis of cross-bridge action in Lethocerus IFM and comparative analysis of other muscles. However, it will probably not transfer directly to some other IFMs of its general type (myogenically rhythmic asynchronous fibrillar IFM). For example, in Drosophila IFM, the principal 14.5-nm reflection is split across the meridian rather than centered on it, and loses only 3% of intensity rather than 50% upon activation (Irving and Maughan, 2000). Nevertheless, analysis of normal and mutant IFM structural mechanics in Drosophila can surely progress faster with support from the modeling approach demonstrated here. Meanwhile, the compact perpendicular crown shelves modeled in resting Lethocerus IFM may help explain some contrasts with vertebrate skeletal muscle. In vertebrate muscles, the well-documented replacement of the resting 14.3-nm meridional reflection by an active 14.6-nm reflection (Huxley and Brown, 1967; Haselgrove, 1975; Piazzesi et al., 1999) suggests replacement of the resting population by an active population that retains none of the resting crown structure. Lethocerus, on the other hand, shows little spacing change, but only a simple intensity loss of 50% (Tregear et al., 1998a,b; Taylor et al., 1999). This can be modeled as simple axial dispersion of relaxed crown mass as some heads form angled bridges; the unchanged spacing and EM appearance do not suggest any new crown structure. Quite likely the crown shelves of relaxed Lethocerus already diffract the strongest possible meridional at 14.5 nm, so that the 50% intensity loss with activation largely expresses the small angular variations and axial dispersion required for actin attachment by 20–30% of the heads. In addition, the relaxed IFM structure shows a lack of temperature sensitivity. As found by Schlichting and Wray (1986), relaxed mammalian striated muscle loses most of its thick filament helical order when cooled below ∼20°C, in apparent coordination with a shift from the M•ADP•Pi state to the M•ATP state (Xu et al., 1999). IFM in Lethocerus and most large insects also works best at ∼40°C, and indeed must undergo a shivering preflight warm-up to reach flying temperature (Heinrich, 1993), but relaxed Lethocerus IFM shows no appreciable change in diffraction when cooled from 33° to 2°C (our data, not shown). This suggests a crown structure more structurally and enzymatically stable at low temperatures than mammalian muscle, a property IFM appears to share with skeletal muscles from cold-blooded vertebrates such as frogs and fish (e.g., Harford and Squire, 1986).
The myosin head shape
Fig. 7 compares the myosin head shape from our modeling with shapes determined from x-ray crystallography of a variety of myosin heads either nucleotide-free or with different ligands bound. The catalytic domains from all crystal structures are superimposed, to make obvious the different directions in which the neck region “lever arms” project. Although in our searching routines we defined the myosin head axis in terms of tilt, slew, and rotation relative to the head origin on the myosin backbone and then changed the angle of the catalytic domain relative to the neck position by changing the pivot tilt, pivot slew, and pivot rotation angles illustrated in Fig. 4, when it comes to looking at myosin head shapes as they would be on actin it is more convenient to use different definitions of the angles which the neck makes with the catalytic domain. For this reason the discussions which follow describe the neck orientation relative to the catalytic domain in a different way from that in Fig. 4. This time all parameters refer to the neck position on a “vertical” actin filament. The neck configuration on the catalytic domain has been defined using similar axes to those used in Hopkins et al. (2002), where the two ends of the long heavy chain α-helix through the neck define the neck long axis (we used residues 780 to 843; Hopkins et al. started at 707) and the two ends of the heavy chain α-helical “hook” that leads into myosin S2 (residues 830 and 843) define the hook axis. All angles refer to movements around the pivot point on residue 780. Parameters relative to a “vertical” actin filament are (Fig. 8 a) a neck tilt about a horizontal axis through the pivot point, a neck slew around an axis parallel to the actin filament axis and through the pivot point, and a neck rotation around the neck long axis direction. The neck position in the Rayment head structure on actin was used as the reference point at which neck tilt = neck slew = neck rotation = 0. In our definitions, positive neck tilt is toward the M-band, positive neck slew is clockwise looking from the M-band, and positive neck rotation is clockwise looking down the neck toward the catalytic domain.
FIGURE 8.
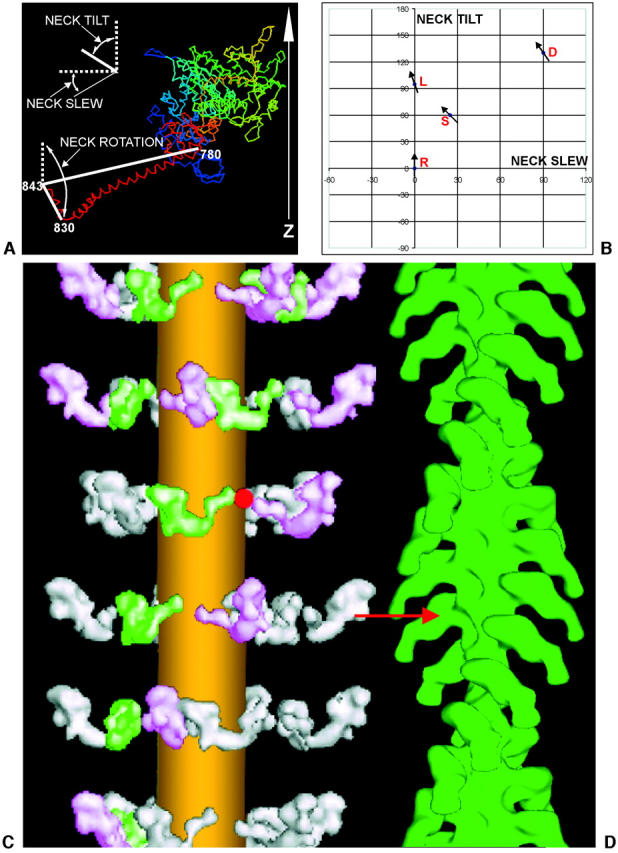
(a) Defining the different motions of the lever arm and hook axis denoted by neck tilt, neck slew, and neck rotation in different myosin head structures, assuming that the catalytic domain is oriented as it would be if attached to actin in the rigor conformation, with the actin axis vertical and the Z-band end at the bottom. The neck long axis is taken as the line joining residues 780 and 843, and the hook axis is taken as the line joining residues 830 to 843. (b) A plot showing the neck tilt and neck slew angles required by the lever arm in order to convert between the four structures when the catalytic domain is superimposed on a vertical actin filament in the rigor attachment position (see Fig. 7, a and b). The arrows on different points show the relative neck rotations of the hook region of the myosin head in the different structures. The vertical reference axis is the actin filament axis with M-band up, Z-band down. R refers to the Rayment rigor structure (Rayment et al., 1993a,b), D refers to the Dominguez ‘prepowerstroke’ structure (Dominguez et al., 1998), L is Lethocerus (this work), and S is the scallop myosin Mg•ADP•VO4 structure (Houdusse et al., 2000). (c and d) The relaxed to rigor transition involves a swing of the myosin neck domain. Our best, relaxed myosin thick filament model is shown on the left (c), and an actin filament reconstruction labeled with S1 in the rigor state is shown on the right (d) (Harford and Squire, unpublished data from S1-labeled fish muscle). For an actin target monomer ideally opposite a relaxed myosin head, the relaxed to actin-bound (prepowerstroke) transition requires only a radial movement of ∼2 nm and a small rotation of the catalytic domain to achieve rigor-like docking of the catalytic domain on the actin site (red arrow). After docking, only a purely axial swing (no slew), with a small pivot rotation (of +20°), of the myosin head neck domain (lever-arm) is needed to complete a powerstroke and to reach the final rigor conformation (as in Fig. 7, c and d). The lateral separation of the myosin and actin filaments has been exaggerated in this diagram.
Previous work has largely defined three different classes of myosin head structure. The original nucleotide-free structure (of chicken skeletal myosin) determined by Rayment et al. (1993a), green in Fig. 7, a and b, had the head catalytic domain and the neck region of the myosin head in a relatively straight configuration as seen here when bound to a vertical actin. If the catalytic domain is oriented as in the rigor attachment on actin (Milligan and Flicker, 1987; Rayment et al., 1993b; Holmes, 1996, 1998) with the actin filament axis vertical as in Fig. 7 a and the Z-band toward the bottom, then the Rayment head has the neck region angled down at ∼45°. The head shape determined by Dominguez et al. (1998), which was of chicken smooth myosin with ADP•AlF4 bound, was proposed by them to mimic the prepowerstroke shape of the head on actin (i.e., the “A”•M•ADP•Pi state, although in the absence of actin). This had the neck region (dark blue in Fig. 7, a and b) tilting upward relative to the Rayment head (Fig. 7 a). The difference in neck tilt (Fig. 8 a) between the two structures using our definitions is 130°. Note that, in their article, Dominguez et al. (1998) used a different definition of the neck axis and quoted a different angular difference (70°) from that given here. Note also that the structures in their article were also shown viewed in a different direction from those shown here in Fig. 7. Another head structure (orange in Fig. 7, a and b), determined by Houdusse et al. (2000), that can be loosely classed with the Dominguez structure was of scallop myosin with Mg•ADP•VO4 bound, proposed as an ATPase transition state structure closely related to both relaxed and prepowerstroke conformations. This had the neck region tilted up by a neck tilt of almost 60° relative to the Rayment head. Looking down the filament axis (Fig. 7 b) toward the Z-band these structures were also very different. Relative to the Rayment (rigor) head, the lever arm of the Dominguez head is markedly slewed clockwise by a neck slew of ∼90° and that of the Houdusse head has a clockwise neck slew of ∼25°. A third class of structure, not illustrated here, was a scallop myosin•Mg•ADP state which Houdusse et al. (1999) referred to as a detached, stable, M•ATP-like state.
Putting our new relaxed insect flight muscle myosin head into the context of these crystal structures (pale blue structure in Fig. 7, a and b), the position of its lever arm is closest to that of Houdusse's ADP•VO4 scallop S1 structure. Proposed as a transition state analog that would trap myosin near to completion of hydrolysis, this state must be closely similar to that of the M•ADP•Pi state that predominates in relaxed striated muscles (Hibberd and Trentham, 1986; Xu et al., 1999), so the structural kinship with relaxed myosin heads in IFM may not be surprising. Note, however, that this is the first time that any head shape other than rigor has been systematically observed in intact muscle. In summary, the resting myosin head shape in Lethocerus flight muscle is markedly different from the rigor Rayment head shape. The direct comparison of the two structures is given in Fig. 7 c, where it can be seen that the only substantial difference between the two structures is a pure change (by 95°) in neck tilt in the axial direction (i.e., parallel to the actin filament long axis) that moves the outer end of the neck axially by ∼10 nm as illustrated in Fig. 8 b.
Conclusions about the contractile cycle in IFM
As described above, the axis definitions and plot in Fig. 8, a and b provide a direct way of comparing the neck configurations in the different crystal structures and in resting insect flight muscle in terms of neck tilt, neck slew, and neck rotation, assuming that the catalytic domain is docked on actin as in the Rayment-Milligan reconstruction of the acto-S1 rigor complex structure (Rayment et al., 1993b). It therefore throws light on a possible contractile cycle in insect flight muscle. To go from any one of the observed structures to any other in a putative cross-bridge cycle on actin requires a change in neck tilt and neck slew of the neck long axis, together with a change in neck rotation of the hook axis around the neck long axis. Fig. 8 b plots the results on a diagram of neck tilt against neck slew relative to the Rayment structure at 0°, 0°, assuming that the rigor position of the lever is the same as in Rayment et al. (1993a,b). The neck rotation of the hook is also shown at each point as the angle of the short line at each place, once again with the Rayment structure assigned a neck rotation of 0°. This is a useful way of displaying all three parameters. Clearly the transition of the hook from the rigor Rayment head to the hook of any of the other head structures shows the same trend; it is counterclockwise and is smallest from Rayment (R) to Lethocerus (L) (−20°), is −35° from Rayment to Dominguez, and largest for Rayment to Houdusse (−45°). The diagram confirms that in insect flight muscle the relaxed-to-rigor transition involves an almost pure 95° change in neck tilt. There is no change in neck slew and the neck rotation changes by only about −20°.
Can further deductions be made about the full cross-bridge cycle in active insect flight muscle? IFM is unique in having a very highly developed stretch-activation mechanism as needed for its oscillatory driving of the wing/thorax assembly at high frequencies (Pringle, 1967; Josephson et al., 2000). Does the resting myosin head arrangement lend itself to this kind of behavior? The images in Fig. 8, c and d indicate what is needed for a resting, projecting myosin head in IFM to attach to actin in the rigor conformation. The significant point is that, assuming that an appropriately oriented actin monomer is close by, the catalytic domain of the resting head is almost already in the correct configuration to attach directly to the binding site on actin that is used by the rigor heads, without it needing to tilt or rotate very much . The main need is a small radial movement (∼1–2 nm) and possibly a small amount of radial and axial searching to reach an actin monomer that is sterically (helically) optimum for attachment (possibly much less than the ±7.5 nm found in vitro by Steffen et al. (2001), because in the muscle the interaction must be highly constrained by the filament and lattice geometry). Perhaps not surprisingly, it is as if the relaxed IFM structure is primed and ready for optimally positioned heads to go through their cycle on actin; the heads are just waiting for a trigger. It is known that a fairly small increase above the resting level of Ca2+, to 3 μM, will prime IFM for contraction, but that full activation at that Ca2+ level can be achieved only by applying a stretch (Pringle, 1967). It could be that Ca2+-binding loosens the resting heads enough to move the 1–2 nm for actin attachment, but that little happens until the muscle is stretched, and that some trigger, perhaps acting through those heads that can weakly attach, or possibly through noncross-bridge contacts between thick and thin filaments (Reedy et al., 1994), switches the structure on fully to activate the transition from the relaxed to rigor head shapes described in Fig. 7, c and d. It is known that the same full-activation effect in IFM can also be achieved by much higher levels of calcium (Taylor et al., 1999). The calcium-primed state that sets the stage for stretch activation is known from x-ray diffraction to be very similar in structure to that of relaxed Lethocerus (Tregear et al., 1998a,b). So it is conceivable that high calcium and stretch both trigger activation by disrupting ATPase-inhibiting interhead linkages that appear to be physically embodied in our model for the relaxed IFM crown. Padron et al. (1998) also discussed the idea of relaxed head-head interactions being inhibitory and subject to disruption by activating events, e.g., when activated by calcium binding or by phosphorylation, or in the absence of ATP.
Our data add new and precise support for the action cycle first inferred from thin-section EM of relaxed and rigor IFM (Reedy et al., 1965), finally showing resting cross-bridges truly at ∼90°, with their actin-binding sites suitably oriented toward actin. The catalytic domain positions with respect to actin appear to be almost the same in both the relaxed and rigor states, as though the projecting relaxed heads are poised to enable very rapid attachment to correctly oriented target sites on an adjacent actin filament. Once the catalytic domain has attached, the head can sequentially release hydrolysis products Pi and ADP as it moves toward the nucleotide-free (rigor) state. This requires only an axial swing of the neck region (lever arm) through ∼90° around the pivot point (making the whole head including the catalytic domain appear to rotate to the conventionally quoted 45° rigor angle), giving an axial step of ∼10 nm. An ATP-induced detachment and resetting of the head to the M•ADP•Pi state, followed by repositioning the head near the original relaxed configuration, will automatically set up another potential contractile cycle in the oscillating muscle. The “inward” heads imply an inactive half-population of potential motors that might remain near their rest position during contraction. This would be structurally consistent with the persistent but less prominent crown shelves by EM and the ≥50% loss of 1/14.5-nm−1 x-ray diffraction intensity observed in actively contracting Lethocerus IFM (Tregear et al., 1998a,b; Taylor et al., 1999).
Note that the “inward” heads may be inactive as force-generators yet crucial for the inhibition of ATPase that must be released during activation by stretch or high calcium. The notion proposed earlier, that the linkages seen in the relaxed crown structure may embody inhibitory interhead contacts, implies that stretch-induced perturbation of these contacts might release the inhibition. This would make our crown structure a key to the mechanism of stretch activation. A model for such crown-structure perturbation might be computed by our approach if we can time-resolve x-ray diffraction changes in the calcium-primed state during the 2–6 ms between an activating stretch and the active tension response.
Contributions from actin—the potential for further modeling
Although the layer-lines with l = 6N (orders of 38.7 nm−1) were omitted from the modeling, the best myosin filament model predicts substantial intensity on these layer-lines. Using the modeled contribution from the myosin filaments as a guide on the l = 6N layer-lines, comparison with the observed intensity data reveals intensity differences which should originate from actin and troponin. On layer-line 6, the predicted contribution from the resting myosin filament (e.g., in Fig. 5 c) is in the middle of the observed off-meridional intensity profile. It is likely that the near-meridional end of this intensity that is not explained by myosin comes from troponin on the thin filaments, whereas the higher radius end comes from the remainder of the actin filament.
The arrangement of the actin filaments in insect flight muscle is quite different from that in fish muscle (see Fig. 2 c, left and right, respectively). The insect muscle unit cell is modeled as containing three actin filaments with an element of randomness in their rotational positions. The actin filaments are arranged in the unit cell with azimuthal rotations of 60° around the thick filament, each actin filament also containing a random rotation of 180°. This accounts for the presence of sampled actin layer-lines in the inner part of the pattern turning into continuous layer-lines further out. In our case, where we are modeling data only out to 6.5 nm, we are looking only at the inner Bragg-sampled actin layer-lines. The next stage of the modeling, requiring a substantial period of computing time, will therefore include the actin filaments, tropomyosin, and troponin (Wendt and Leonard, 1999), as well as the thick filament, in the full IFM unit cell and the whole structure will be refined together using all of the 468 independent observed reflections. The potential exists using this approach to fully “solve” the whole of the resting Lethocerus flight muscle unit cell to 6.5-nm resolution or better.
An even lower R-factor than 9.7% might be expected in light of the 3% achieved in modeling bony fish muscle thick filaments. One possibility is that the two heads do not have exactly the same shape that we constrained them to here; modeling them independently will require more parameters than the 13 used here, and will be part of future efforts. Another is that other minor components of the thick filament might affect the intensities. Candidates include projectin (Bullard and Leonard, 1996), zeelins 1 and 2 (Ferguson et al., 1994), linkages between heavy troponin (TnH) and myosin light chains (Reedy et al., 1994; Moore et al., 2000), and some Drosophila IFM proteins like flightin (Reedy et al., 2000) and glutathione S-transferase-2 (Clayton et al., 1998). Structurally, in Lethocerus itself, weak contributions from the disordered 14.5-nm repeat at the thick filament ends (Fig. 1) and the seven or eight ∼14.6-nm repeats of M-line bridges in mid-sarcomere can doubtless be separated after further EM analysis of thin-sectioned sarcomeres.
Finally, it is worth noting that the sharp lattice sampling in relaxed Lethocerus x-ray patterns fully supports the EM finding by Schmitz et al. (1994) that the thick filaments are in exact lateral and helical register across substantial domains in the A-band. This can be maintained only if the imperfect whole-filament register shown by meandering of Z- and M-bands (Fig. 1) and the variable orientations of thick filament profiles in the M-band (Freundlich and Squire, 1983) involve quantized and coupled axial and rotational (i.e., screwing) displacements of thick filaments within the A-band lattice. The regular thick filament structure modeled here does not by itself imply any mechanism for imposing such lattice register among relaxed cross-bridges while permitting imperfect filament register. Whatever are the filament interactions or forces that impose cross-bridge lattice order, they might also tend to radially expand the crown shelves, holding or drawing relaxed myosin heads out to higher radius in the lattice than can persist in isolated or fixed filaments and explaining the discrepancy between Fig. 6, c and d and Fig. 6, e–g.
CONCLUSION
In summary, by rigorously solving the myosin filament part of the low-angle x-ray diffraction pattern from relaxed insect flight muscle, we have been able to identify for the first time in intact muscle a myosin head shape clearly different from the nucleotide-free, rigor, state. The resulting transition in head shape implied for active muscle is consistent with a purely axial swing of the myosin head lever arm on the actin-attached catalytic domain of ∼10 nm. The resting myosin head configuration provides a possible explanation for the uniquely developed stretch-activation response in insect flight muscle.
Acknowledgments
We are indebted to Dr. E. P. Morris for many helpful discussions and for making available his electron micrograph information on isolated insect flight muscle myosin filaments. We thank Carmen Lucaveche for freeze-substitution and electron micrography of cryofixed Lethocerus IFM, and Bruce Baumann for assistance in collecting fiber x-ray diffraction patterns from IFM at the Argonne/APS/BioCAT beamline.
We acknowledge specific support for this work to J.M.S. from a UK Biotechnology and Biological Sciences Research Council (BBSRC) project grant (28/S10891). M.K.R. was supported by National Institutes of Health AR-14317. CCP13 software was developed as part of UK BBSRC/Engineering and Physical Sciences Research Council (EPSRC) funded projects (e.g. 28/B10368 and 28/B15281). Use of the Advanced Photon Source was supported by the U.S. Department of Energy, Basic Energy Sciences, Office of Energy Research, under Contract No. W-31-109-ENG-38. BioCAT is a U.S. National Institutes of Health-supported Research Center RR08630.
References
- Brent, R. P. 1973. Algorithms for Minimisation without Derivatives. Prentice-Hall, Englewood Cliffs, NJ. Chapter 5.
- Bullard, B., and K. Leonard. 1996. Modular proteins of insect muscle. Adv. Biophys. 33:211–221. [PubMed] [Google Scholar]
- Cantino, M. E., L. D. Brown, M. Chew, P. K. Luther, and J. M. Squire. 2000. A-band architecture in vertebrate skeletal muscle: polarity of the myosin head array. J. Muscle Res. Cell Motil. 21:681–690. [DOI] [PubMed] [Google Scholar]
- Chen, L. F., H. Winkler, M. K. Reedy, M. C. Reedy, and K. A. Taylor. 2002. Molecular modeling of averaged rigor crossbridges from tomograms of insect flight muscle. J. Struct. Biol. 138:92–104. [DOI] [PubMed] [Google Scholar]
- Clayton, J. D., R. M. Cripps, J. C. Sparrow, and B. Bullard. 1998. Interaction of troponin-H and glutathione S-transferase-2 in the indirect flight muscles of Drosophila melanogaster. J. Muscle Res. Cell Motil. 19:117–127. [DOI] [PubMed] [Google Scholar]
- Dominguez, R., Y. Freyzon, K. M. Trybus, and C. Cohen. 1998. Crystal structure of a vertebrate smooth muscle myosin motor domain and its complex with the essential light chain: visualization of the pre-power stroke state. Cell. 94:559–571. [DOI] [PubMed] [Google Scholar]
- Eakins, F., H. A. AL-Khayat, R. W. Kensler, E. P. Morris, and J. M. Squire. 2002. 3D Structure of fish muscle myosin filaments. J. Struct. Biol. 137:154–163. [DOI] [PubMed] [Google Scholar]
- Ferguson, C., A. Lakey, A. Hutchings, G. W. Butcher, K. R. Leonard, and B. Bullard. 1994. Cytoskeletal proteins of insect muscle: location of zeelins in Lethocerus flight and leg muscle. J. Cell Sci. 107:1115–1129. [DOI] [PubMed] [Google Scholar]
- Freundlich, A., and J. M. Squire. 1983. Three–dimensional structure of the insect (Lethocerus) flight muscle M–band. J. Mol. Biol. 169:439–453. [DOI] [PubMed] [Google Scholar]
- Güth, K., and R. Wojciechowski. 1986. Perfusion cuvette for the simultaneous measurement of mechanical, optical and energetic parameters of skinned muscle fibres. Pflugers Arch. 407:552–557. [DOI] [PubMed] [Google Scholar]
- Harford, J., and J. M. Squire. 1997. Time-resolved diffraction studies of muscle using synchrotron radiation. Rep. Prog. Phys. 60:1723–1787. [Google Scholar]
- Harford, J., and J. M. Squire. 1986. “Crystalline” myosin cross-bridge array in relaxed bony fish muscle. Low-angle x-ray diffraction from plaice fin muscle and its interpretation. Biophys. J. 50:145–155. [DOI] [PMC free article] [PubMed] [Google Scholar]
- Harford, J. J., and J. M. Squire. 1992. Evidence for structurally different attached states of myosin cross-bridges on actin during contraction of fish muscle. Biophys. J. 63:387–396. [DOI] [PMC free article] [PubMed] [Google Scholar]
- Haselgrove, J. C. 1975. X-ray evidence for conformational changes in the myosin filaments of vertebrate striated muscle. J. Mol. Biol. 92:113–143. [DOI] [PubMed] [Google Scholar]
- Heinrich, B. 1993. The Hot-Blooded Insects: Strategies and Mechanisms of Thermoregulation. Harvard University Press, Cambridge, MA.
- Hibberd, M. G., and D. R. Trentham. 1986. Relationships between chemical and mechanical events during muscular contraction. Ann. Rev. Biophys. & Biophys. Chem. 15:119–161. [DOI] [PubMed] [Google Scholar]
- Holmes, K. C. 1996. Muscle proteins—their actions and interactions. Curr. Opin. Struct. Biol. 6:781–789. [DOI] [PubMed] [Google Scholar]
- Holmes, K. C. 1998. Picture story. A powerful stroke. Nat. Struct. Biol. 5:940–942. [DOI] [PubMed] [Google Scholar]
- Holmes, K. C., D. Popp, W. Gebhard, and W. Kabsch. 1990. Atomic model of the actin filament. Nature. 347:44–49. [DOI] [PubMed] [Google Scholar]
- Hopkins, S. C., C. Sabido-David, U. A. van der Heide, R. E. Ferguson, B. D. Brandmeier, R. E. Dale, J. Kendrick-Jones, J. E. Corrie, D. R. Trentham, M. Irving, and Y. E. Goldman. 2002. Orientation changes of the myosin light chain domain during filament sliding in active and rigor muscle. J. Mol. Biol. 318:1275–1291. [DOI] [PubMed] [Google Scholar]
- Houdusse, A., V. N. Kalabokis, D. Himmel, A. G. Szent-Gyorgyi, and C. Cohen. 1999. Atomic structure of scallop myosin subfragment S1 complexed with MgADP: A novel conformation of the myosin head. Cell. 97:459–470. [DOI] [PubMed] [Google Scholar]
- Houdusse, A., and H. L. Sweeney. 2001. Myosin motors: missing structures and hidden springs. Curr. Opin. Struct. Biol. 11:182–194. [DOI] [PubMed] [Google Scholar]
- Houdusse, A., A. G. Szent-Gyorgyi, and C. Cohen. 2000. Three conformational states of scallop myosin S1. Proc. Natl. Acad. Sci. USA. 97:11238–11243. [DOI] [PMC free article] [PubMed] [Google Scholar]
- Hudson, L. 1997. Ultrastructure of the A band unit cell in relaxed muscle. Ph.D. thesis. London University, London.
- Hudson, L., J. J. Harford, R. C. Denny, and J. M. Squire. 1997. Myosin head configuration in relaxed fish muscle: resting state myosin heads must swing axially by up to 150 Å or turn upside down to reach rigor. J. Mol. Biol. 273:440–455. [DOI] [PubMed] [Google Scholar]
- Huxley, H. E. 1969. The mechanism of muscular contraction. Science. 164:1356–1366. [PubMed] [Google Scholar]
- Huxley, H. E., and W. Brown. 1967. The low-angle x-ray diagram of vertebrate striated muscle and its behaviour during contraction and rigor. J. Mol. Biol. 30:383–434. [DOI] [PubMed] [Google Scholar]
- Irving, M., G. Piazzesi, L. Lucii, Y. B. Sun, J. J. Harford, I. M. Dobbie, M. A. Ferenczi, M. Reconditi, and V. Lombardi. 2000. Conformation of the myosin motor during force generation in skeletal muscle. Nat. Struct. Biol. 7:482–485. [DOI] [PMC free article] [PubMed] [Google Scholar]
- Irving, T. C., R. Fischetti, G. Rosenbaum, and G. B. Bunker. 2000. Fibre diffraction using the BioCAT undulator beamline at the Advanced Photon Source. Nuclear Instruments and Methods. 448:250–254. [Google Scholar]
- Irving, T. C., and D. W. Maughan. 2000. In vivo x-ray diffraction of indirect flight muscle from Drosophila melanogaster. Biophys. J. 78:2511–2515. [DOI] [PMC free article] [PubMed] [Google Scholar]
- Josephson, R. K., J. G. Malamud, and D. R. Stokes. 2000. Asynchronous muscle: a primer. J. Exp. Biol. 203:2713–2722. [DOI] [PubMed] [Google Scholar]
- Kensler, R. W., and M. Stewart. 1989. An ultrastructural study of cross-bridge arrangement in the fish skeletal muscle thick filament. J. Cell Sci. 94:391–401. [DOI] [PubMed] [Google Scholar]
- Levine, R. J. C. 1993. Evidence for overlapping myosin heads on relaxed thick filaments of fish, frog, and scallop striated muscles. J. Struct. Biol. 110:99–110. [DOI] [PubMed] [Google Scholar]
- Levine, R. J. C. 1997. Differences in myosin head arrangement on relaxed thick filaments from Lethocerus and rabbit muscles. J. Muscle Res. Cell Motil. 18:529–543. [DOI] [PubMed] [Google Scholar]
- Linari, M., G. Piazzesi, I. Dobbie, N. Koubassova, M. Reconditi, T. Narayanan, O. Diat, M. Irving, and V. Lombardi. 2000. Interference fine structure and sarcomere length dependence of the axial x-ray pattern from active single muscle fibers. Proc. Natl. Acad. Sci. USA. 97:7226–7231. [DOI] [PMC free article] [PubMed] [Google Scholar]
- Luther, P. K., and J. M. Squire. 1980. Three-dimensional structure of the vertebrate muscle A-band. II. The myosin filament superlattice. J. Mol. Biol. 141:409–439. [DOI] [PubMed] [Google Scholar]
- Luther, P. K., J. M. Squire, and P. L. Forey. 1996. Evolution of myosin filament arrangements in vertebrate skeletal muscle. J. Morphol. 229:325–335. [DOI] [PubMed] [Google Scholar]
- Lymn, R. W., and E. W. Taylor. 1971. Mechanism of adenosine triphosphate hydrolysis of actomyosin. Biochemistry. 10:4617–4624. [DOI] [PubMed] [Google Scholar]
- Miller, A., and R. T. Tregear. 1972. The structure of insect fibrillar flight muscle in the presence and absence of ATP. J. Mol. Biol. 70:85–104. [DOI] [PubMed] [Google Scholar]
- Milligan, R. A., and P. F. Flicker. 1987. Structural relationships of actin, myosin, and tropomyosin revealed by cryo-electron microscopy. J. Cell Biol. 105:29–39 [DOI] [PMC free article] [PubMed] [Google Scholar]
- Moore, J. R., M. H. Dickinson, J. O. Vigoreaux, and D. W. Maughan. 2000. The effect of removing the N-terminal extension of the Drosophila myosin regulatory light chain upon flight ability and the contractile dynamics of the indirect flight muscle. Biophys. J. 78:1431–1440. [DOI] [PMC free article] [PubMed] [Google Scholar]
- Morris, E. P., J. M. Squire, and G. W. Fuller. 1991. The 4-stranded helical arrangement of myosin heads on insect (Lethocerus) flight muscle thick filaments. J. Struct. Biol. 107:237–249. [Google Scholar]
- Nelder, J. A., and R. Mead. 1965. The simplex method for function minimisation. Comput. J. 7:308–313. [Google Scholar]
- Padron, R., L. Alamo, J. Murgich, and R. Craig. 1998. Towards an atomic model of the thick filaments of muscle. J. Mol. Biol. 275:35–41. [DOI] [PubMed] [Google Scholar]
- Piazzesi, G., M. Reconditi, I. Dobbie, M. Linari, P. Boesecke, O. Diat, M. Irving, and V. Lombardi. 1999. Changes in conformation of myosin heads during the development of isometric contraction and rapid shortening in single frog muscle fibres. J. Physiol. 514:305–312. [DOI] [PMC free article] [PubMed] [Google Scholar]
- Press, W. H., S. Teukolsky, T. Vettering, and B. Flannery. 1992. Numerical Recipes in C, 2nd ed. Cambridge Univ. Press, Cambridge, UK.
- Pringle, J. W. S. 1967. The contractile mechanism of insect fibrillar muscle. Prog. Biophys. Mol. Biol. 17:1–60. [DOI] [PubMed] [Google Scholar]
- Rayment, I., and H. M. Holden. 1993. Myosin subfragment-1: structure and function of a molecular motor. Curr. Opin. Struct. Biol. 3:944–952. [Google Scholar]
- Rayment, I., H. M. Holden, M. Whittaker, C. B. Yohn, M. Lorenz, K. C. Holmes, and R. A. Milligan. 1993b. Structure of the actin-myosin complex and its implications for muscle contraction. Science. 261:58–65. [DOI] [PubMed] [Google Scholar]
- Rayment, I., W. R. Rypniewsky, K. Schmidt-Bäse, R. Smith, D. R. Tomchick, M. M. Benning, D. A. Winkelmann, G. Wesenbergand, and H. M. Holden. 1993a. Three-dimensional structure of myosin subfragment-1: a molecular motor. Science. 261:50–58. [DOI] [PubMed] [Google Scholar]
- Reedy, M. C., B. Bullard, and J. O. Vigoreaux. 2000. Flightin is essential for thick filament assembly and sarcomere stability in Drosophila flight muscles. J. Cell Biol. 151:1483–1500. [DOI] [PMC free article] [PubMed] [Google Scholar]
- Reedy, M. C., M. K. Reedy, and R. S. Goody. 1983. Co-ordinated electron microscopy and X-ray studies of glycerinated insect flight muscle. II. Electron microscopy and image reconstruction of muscle fibres fixed in rigor, in ATP and in AMPPNP. J. Muscle Res. Cell Motil. 4:55–81. [DOI] [PubMed] [Google Scholar]
- Reedy, M. C., M. K. Reedy, and R. S. Goody. 1987. The structure of insect flight muscle in the presence of AMPPNP. J. Muscle Res. Cell Motil. 8:473–503. [DOI] [PubMed] [Google Scholar]
- Reedy, M. C., M. K. Reedy, K. R. Leonard, and B. Bullard. 1994. Gold/Fab immuno electron microscopy localization of troponin H and troponin T in Lethocerus flight muscle. J. Mol. Biol. 239:52–67. [DOI] [PubMed] [Google Scholar]
- Reedy, M. K., K. C. Holmes, and R. T. Tregear. 1965. Induced changes in orientation of the cross-bridges of glycerinated insect flight muscle. Nature. 207:1276–1280. [DOI] [PubMed] [Google Scholar]
- Reedy, M. K., K. R. Leonard, R. Freeman, and T. Arad. 1981. Thick myofilament mass determination by electron scattering measurements with the scanning transmission electron microscope. J. Muscle Res. Cell Motil. 2:45–64. [DOI] [PubMed] [Google Scholar]
- Reedy, M. K., C. Lucaveche, N. Naber, and R. Cooke. 1992. Insect crossbridges, relaxed by spin-labeled nucleotide, show well-ordered 90 degrees state by X-ray diffraction and electron microscopy, but spectra of electron paramagnetic resonance probes report disorder. J. Mol. Biol. 227:678–697. [DOI] [PubMed] [Google Scholar]
- Reedy, M. K., C. Lucaveche, M. C. Reedy, and B. Somasundaram. 1993. Experiments on rigor crossbridge action and filament sliding in insect flight muscle. Adv. Exp. Med. Biol. 332:33–44; Discussion 44–46. [DOI] [PubMed] [Google Scholar]
- Reedy, M. K., J. M. Squire, B. A. J. Baumann, A. Stewart, and T. C. Irving. 2000. X-ray fibre diffraction of the indirect flight muscle of Lethocerus indicus. In Advanced Photon Source User Activity: Report 2000. Argonne National Laboratory, Argonne, IL.
- Schlichting, I., and J. S. Wray. 1986. Behaviour of cross-bridges in non-overlap frog muscle in the presence and absence of ATP. J. Muscle Res. Cell Motil. 7:79–80. [Google Scholar]
- Schmitz, H., C. Lucaveche, M. K. Reedy, and K. A. Taylor. 1994. Oblique section 3-D reconstruction of relaxed insect flight muscle reveals the cross-bridge lattice in helical registration. Biophys. J. 67:1620–1633. [DOI] [PMC free article] [PubMed] [Google Scholar]
- Schmitz, H., M. C. Reedy, M. K. Reedy, R. T. Tregear, and K. A. Taylor. 1997. Tomographic three-dimensional reconstruction of insect flight muscle partially relaxed by AMPPNP and ethylene glycol. J. Cell Biol. 139:695–707. [DOI] [PMC free article] [PubMed] [Google Scholar]
- Squire, J. M. 1998. Time-resolved X-ray diffraction. In Current Methods In Muscle Physiology. H. Sugi, editor. Oxford University Press, Oxford, UK. 241–285.
- Squire, J. M. 2000. Fibre and muscle diffraction. In Structure and Dynamics of Biomolecules. E. Fanchon, E. Geissler, L.-L. Hodeau, J.-R. Regnard, and P. Timmins, editors. Oxford University Press, Oxford, UK. 272–301.
- Squire, J. M., M. Cantino, M. Chew, R. Denny, J. Harford, L. Hudson, and P. Luther. 1998. Myosin rod-packing schemes in vertebrate muscle thick filaments. J. Struct. Biol. 122:128–138. [DOI] [PubMed] [Google Scholar]
- Squire, J. M., J. J. Harford, A. C. Edman, and M. Sjostrom. 1982. Fine structure of the A-band in cryo-sections. III. Cross-bridge distribution and the axial structure of the human C-zone. J. Mol. Biol. 155:467–494. [DOI] [PubMed] [Google Scholar]
- Steffen, W., D. Smith, R. Simmons, and J. Sleep. 2001. Mapping the actin filament with myosin. Proc. Natl. Acad. Sci. USA. 98:14949–14954. [DOI] [PMC free article] [PubMed] [Google Scholar]
- Stewart, M., and R. W. Kensler. 1986. Arrangement of myosin heads in relaxed thick filaments from frog skeletal muscle. J. Mol. Biol. 192:831–851. [DOI] [PubMed] [Google Scholar]
- Taylor, K. A., H. Schmitz, M. C. Reedy, Y. E. Goldman, C. Franzini-Armstrong, H. Sasaki, R. T. Tregear, K. J. V. Poole, C. Lucaveche, and R. J. Edwards. 1999. Tomographic 3-D reconstruction of quick frozen, Ca2+ -activated contracting insect flight muscle. Cell. 99:421–431. [DOI] [PubMed] [Google Scholar]
- Tregear, R. T., and M. L. Clarke. 1984. On the possibility of interaction between neighbouring crossbridges. Adv. Exp. Med. Biol. 170:177–184. [DOI] [PubMed] [Google Scholar]
- Tregear, R. T., R. J. Edwards, T. C. Irving, K. J. V. Poole, M. C. Reedy, H. Schmitz, E. Towns-Andrews, and M. K. Reedy. 1998a. Cross-bridges attach to helically restricted actin target zones in stretch-activated insect flight muscle. Biophys. J. 74:A22. [DOI] [PMC free article] [PubMed] [Google Scholar]
- Tregear, R. T., R. J. Edwards, T. C. Irving, K. J. V. Poole, M. C. Reedy, H. Schmitz, E. Towns-Andrews, and M. K. Reedy. 1998b. X-ray diffraction indicates that active cross-bridges bind to actin target zones in insect flight muscle. Biophys. J. 74:1439–1451. [DOI] [PMC free article] [PubMed] [Google Scholar]
- Wendt, T., and K. Leonard. 1999. Structure of the insect troponin complex. J. Mol. Biol. 285:1845–1856. [DOI] [PubMed] [Google Scholar]
- Wendt, T. G., D. Taylor, K. M. Trybus, T. Messier, and K. A. Taylor. 2000. Electron crystallography reveals the “off” state of smooth muscle myosin. Biophys. J. 78:792A. [Google Scholar]
- Xu, S., J. Gu, T. Rhodes, B. Belknap, G. Rosenbaum, G. Offer, H. White, and L. C. Yu. 1999. The M.ADP.P(i) state is required for helical order in the thick filaments of skeletal muscle. Biophys. J. 77:2665–2676. [DOI] [PMC free article] [PubMed] [Google Scholar]