

Abstract
The aggregate morphology of meso-tetrakis(4-sulfonatophenyl) porphyrin (TPPS4) in aqueous solution is investigated by using small angle x-ray scattering (SAXS) technique. Measurements were performed at pH 4.0 and 9.0 to monitor the pH influence on the structural parameters of the aggregates. Radii of gyration were obtained from distance distribution functions p(r) analysis. The experimental data of TPPS4 at pH 4.0 showed well-defined oscillations characteristic of large aggregates in contrast to the SAXS curve of 5 mM TPPS4 at pH 9.0, where both a significant decrease in the intensity and the disappearance of the oscillation peaks suggest the dissociation of the aggregate. A 340-Å long “hollow” cylinder with shell thickness of 20 Å, compatible to the porphyrin molecule dimension, represents well the scattering curve of the aggregates at pH 4.0. According to the fitting parameters, 26 porphyrin molecules self-associate into a ringlike configuration in the plane of the cylinder cross-section. The total number of porphyrin molecules in the whole aggregate was also estimated as ∼3000. The model compatible to SAXS data of a hollow cylinder with J-aggregation in the cross-section and H-aggregation (columnar stacking) between the cylinder layers is consistent with optical absorption spectroscopic data both in the literature and obtained in this work.
INTRODUCTION
The importance of porphyrins and related compounds as therapeutic drugs and targeting agents has been widely recognized (Bonnett, 1995; Dougherty, 1993). Several potential applications have been reported for meso-tetrakis(4-sulfonatophenyl) porphyrin (TPPS4), e.g., as photosensitizers in photodynamic therapy (Kessel et al., 1987) and tumor localization (via fluorescence endoscopy) and for its metalloporphyrins as prototypes for tumor specific contrast agents in radiological and magnetic resonance imaging (Nelson and Schmiedl, 1991) as well as catalysts in oxidation processes (Labat et al., 1990). The biological effects mechanisms may involve their penetration through membranes (Ricchelli et al., 1993) and binding to proteins, e.g., to albumins in blood plasma (Datta-Gupta et al., 1989), while the porphyrin aggregation may decrease their activity as sensitizers (Keene et al., 1986) and contrast agents (Lyon et al., 1987).
The porphyrin TPPS4 (Fig. 1), is known to form aggregates in aqueous solution in acidic media due to its transition to the diacid form: H2TPPS44− + 2H+ ⇔ H4TPPS42−. The diprotonated species H4TPPS42− forms both J and H-aggregates, depending on its concentration, pH, and ionic strength. The J-aggregates have been described as horizontally displaced parallel planes of H4TPPS42− due to an edge-to-edge interaction, and the H-aggregates (stacked planes of H4TPPS42−) due to face-to-face aggregation (Ribó et al., 1994). Arrangements of porphyrin monomers in J-aggregates result in the formation of an intense narrow absorption band, red-shifted with respect to the absorption band of the monomer (434-nm Soret Band), while a characteristic blue-shift in the UV/VIS spectra is observed for monomers in H-aggregates. To explain the changes in the UV/VIS spectra of chromophore dimers, oligomers and heterodimers of porphyrin (Barber et al., 1991; Eichorn et al., 1997; Ribó et al., 2001; Kadish et al., 1989; Maiti et al., 1998) many authors have applied the exciton-coupling model in its simple exciton point-dipole form. J-aggregates (490 nm-Soret Band) are generally observed at porphyrin concentration >5 × 10⁻⁵M. At even higher porphyrin concentrations >1 × 10⁻⁴M, H-aggregates (420-nm Soret Band) are predominant (Kadish et al., 1989; Maiti et al., 1998). Ribó et. al. (1994) have described that UV-VIS spectra can only afford information about the type of aggregate but not on its size.
FIGURE 1.
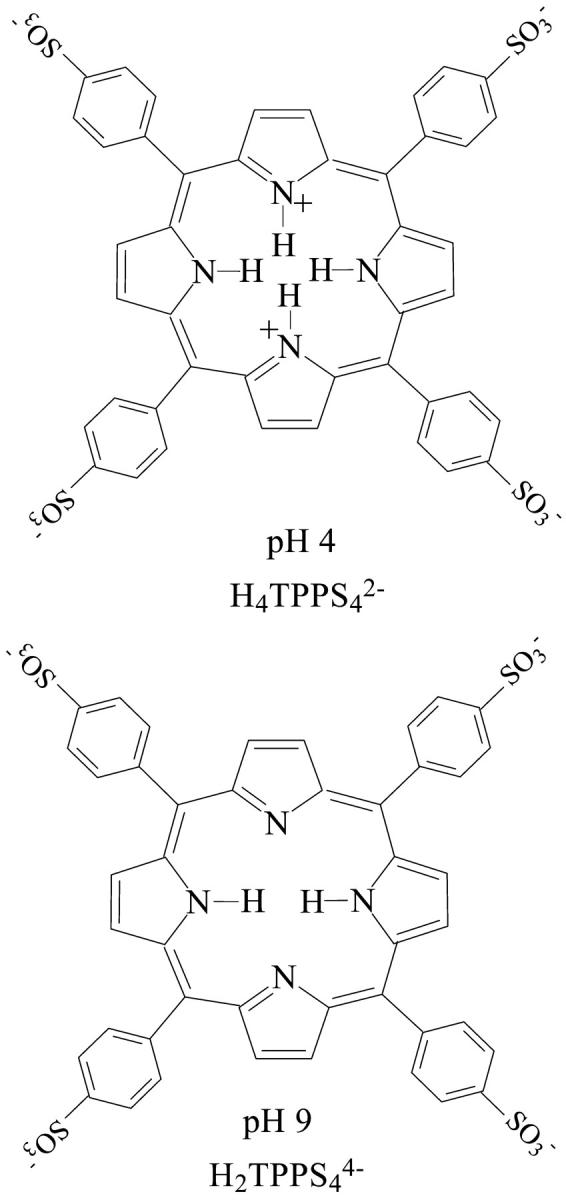
Structure of meso-tetrakis(4-sulfonatophenyl) porphyrin (TPPS4) used in this study, showing the equilibrium, H2TPPS44− + 2H+ ⇔ H4TPPS42−. At pH 4.0 the two nitrogens in the central ring are protonated, directing the NH bonds out of the plane (above and below, not shown in the figure). At pH 9.0, these nitrogens are not protonated.
In our previous article (Gandini et al., 1999) we have characterized the aggregation of the free base TPPS4 in acidic media both in homogeneous solution and in the presence of ionic surfactants. Optical absorption, fluorescence, resonance light scattering, and NMR spectroscopies monitored the aggregation process. Our results showed a considerable change of the optical absorption spectrum of TPPS4 in the range of pH 1–12 due to protonation equilibrium with pKa = 4.52. The protonation of nitrogens in the central porphyrin ring creates positively charged sites in the porphyrin macrocycle, thus promoting the electrostatic attraction to the negatively charged sulfonate groups that facilitates aggregation at acidic pHs.
The presence of hydrophobic phenyl groups in the porphyrins favors the aggregation. The polar sulfonate groups, which convert the porphyrin chromophore into a water-soluble molecule, can exhibit strong intermolecular interactions with the central part of neighbor protonated porphyrin molecules neutralizing its positive charge. This approach can be used in the design of self-assembling porphyrins into homo- and heterodimers, and homo- and heteroassociates (Rubires et al., 1999). Hydrophobic effect favors water-soluble porphyrin aggregation processes that lead to some difficulties in their application.
In this work, we use small angle x-ray scattering (SAXS) to study aggregation of anionic porphyrin in different concentrations at pH 4.0 (H4TPPS42−, diprotonated form) and at pH 9.0 (H2TPPS44−, free base form). The aim of this work is to investigate how these parameters (pH, concentration) affect the aggregate morphology in terms of its shape and size by using SAXS technique. A model is proposed for the aggregate at pH 4.0 that is very consistent with the SAXS data, and implies both the existence of J- and H-aggregates under the experimental conditions employed in this work.
EXPERIMENTAL SECTION
Materials
TPPS4 (Midcentury Chemicals), sodium acetate and potassium phosphate (Mallinckrodt) were used as received. The sample was prepared in acetate-phosphate buffer 20 mM using Milli-Q water. The pH values were adjusted with stock concentrated calibrated solutions of HCl and NaOH and measured using a Digimed pH meter. The samples were prepared in the following way: a weighted amount of TPPS4 was dissolved in appropriate buffer to obtain a final porphyrin stock solution of 10 mM. The other concentrations were obtained by dilution of stock solution at 5 mM and 2 mM. Each sample had a final volume of 0.6 ml. The mixture was equilibrated for at least 48 h before the experiments.
Methods
UV/VIS spectra were obtained by means of an Hitachi U-3501 spectrophotometer at room temperature in the range of 300–750 nm with a quartz cuvette of 0.1-cm optical path in the range of porphyrin concentration of 0.01–0.05 mM, and a spacer between two normal 1.0-cm quartz cells which gave an optical path of 0.001 cm for porphyrin concentrations in the range of 1–5 mM.
SAXS experiments were carried out at the National Synchrotron Light Laboratory, Campinas, Brazil, at room temperature of 23 ± 1°C, with radiation wavelength λ = 1.608 Å and a sample-to-detector distance of 731 mm. Samples were conditioned in sealed 1-mm-thick acrylic cells, with mica windows, perpendicular to the incident x-ray beam. The scattering curves (data collection of 15 min) were corrected for detector homogeneity (one-dimension position-sensitive detector) and normalized by taking into account the decrease of the x-ray beam intensity during the experiment. The parasitic background (buffer solution) was subtracted by considering the sample's attenuation.
It is well known that, for diluted systems where there is no correlation between the scattering particles, the SAXS intensity I(q) is directly given by the main particle features (shape and size) as
 |
(1) |
where k is related to both the instrumental factor and particle number density, and P(q) is the orientational average of the particle form factor and may be modeled according to the geometry of the particle. In our case, the scattering curves present very well-defined secondary maxima, indicating large aggregates in solution. Furthermore, of possible structural types (spherical, cylindrical, planar aggregates) the experimental data are best represented by the scattering of rodlike objects. In this context, P(q) was simulated by considering cylinders of length L with two shells of distinct electron densities relative to the solvent as
 |
(2) |
 |
(3) |
where ψ is the angle between the longest particle axis and the scattering vector q; and V1 and V2 correspond to the volumes of the inner (R1 radius) and the outer (R2 radius) regions, respectively. J1 is the first-order Bessel function, and ν1 = L/2R1 and ν2 = L/2R2. ρo, ρ1, and ρ2 are the electron densities of the bulk solvent (water), of the inner space associated to R1, and of the outer space associated to R2 − R1, and the shell thickness σ, respectively.
As one can see from Eq. 2, the scattering amplitude can be separated in two factors belonging to cylinder length L (in terms of ν) and cross-section. In the case of large L (for which, in our case, the cylinderlike aggregate is at least 340-Å long, as will be shown later in the data analysis) the axial factor drops to zero very rapidly, unless for those orientations where ψ is very small. It means that the rods make a contribution to the scattering only when they are nearly perpendicular to the scattering vector q. The essential point is that in these positions the cross-section remains nearly unaltered with a slight skipping of the axis (Guinier and Fournet, 1955; Glatter and Kratky, 1982). Therefore, in a first approximation, the two factors can be regarded as nearly independent and the scattering intensity I(q) can be given as a product of the scattering of the cylinder cross-section and its length in such a way that
 |
(4) |
or
 |
(5) |
where pc(r) corresponds to the distance distribution of the cylinder cross-section with maximum dimension Dmax (pc(r) = 0 for r ≥ Dmax); Jo is the zero-order Bessel function; and Ic(q) is the scattering intensity of the cross-section. This means that an I(q) × q plot gives direct information about Ic(q), in a first approximation.
In this work, we make use of the GIFT software package (Generalized Indirect Fourier Transform) developed by O. Glatter (Glatter, 1981; Fritz et al., 2000) to obtain the pc(r) functions, as performed in references (Itri and Amaral, 1994, 1991; Teixeira et al., 2000). An extension of the method (DECON program, also developed by O. Glatter; Glatter, 1981), allows subsequent determination of the electron-density distribution function (ρ(r)), since p(r) and ρ(r) are directly related as
p(r) = r2ρ(r) spherical symmetry;
pc(r) = rρc(r) cylindrical symmetry, related to the scattering density from the cylinder axis (or in the cylinder cross-section); and
p1(r) = ρ1(r) lamellar symmetry, related to the scattering density at the normal distance from the lamella plane.
Furthermore, the values of the total Rg and cross-sectional Rgc radius of gyration can be obtained from the distance distribution functions as
 |
(6a) |
and
 |
(6b) |
It should be remarked that, as the cylinder length evaluated from the data analysis is in the limit of our experimental resolution (qmin < π/L, where qmin is the minimum q-value accessible to the experiment), the Rg value evaluated from this analysis may be underestimated. This because p(r) function (Eq. 6a) is obtained by Fourier transform of I(q) that is limited in qmin. This aspect will be brought back into Discussion later in this text.
RESULTS AND DISCUSSION
Fig. 2 presents the experimental data of TPPS4 both at pH 4.0 and pH 9.0. At pH 4.0 the scattering curves of the porphyrin, in the diprotonated form (H4TPPS42−), display well-defined oscillations in the studied q-range, characteristic of large aggregates. Note that the scattering curves for 5 and 10 mM of porphyrin are very similar, even though there is a factor of 2 in the concentration value. On the other hand, the SAXS curves of 2 and 5 mM are identical by taking into account the concentration factor. We will return to this point later in the Discussion.
FIGURE 2.

SAXS curves of TPPS4 at pH 4.0 and pH 9.0. The separation in two pairs is just to make the changes more visible.
In contrast to the scattering data at pH 4.0, the SAXS curve from 5 mM porphyrin at pH 9.0, where the molecule is in the free base form H2TPPS44− (Fig. 1), is featureless with a significant decrease in the intensity, accompanied by the disappearance of the oscillation peaks. This finding evidences the dissociation of the aggregate. However, the SAXS curve is not properly fitted by a simple disk model (porphyrin monomer or even a dimer), suggesting that the sample must be composed of small aggregates made up of different molecular associations. The idea of dissociation is consistent with literature data for this porphyrin in solution at alkaline pH (Kadish et al., 1989; Maiti et al., 1998), as well as with the optical absorption data described below.
The optical absorption spectrum of TPPS4 (μM concentrations) is dramatically different for solution's pH values above or below the pKa of 4.52. At pH 9.0, the optical absorption spectrum of TPPS4 is that typical for the majority porphyrin free bases, consisting of an intense Soret band at 414 nm and four very weak Q-bands at 516, 552, 580, and 634 nm (Q4, Q3, Q2, and Q1, respectively). At pH 4.0, the porphyrin exists as a mixture of H4TPPS42− and free base (H2TPPS44−) due to the close proximity to the pKa of 4.52. Thus, it exhibits bands at 434 nm (Soret band), a shoulder at 413 nm, and two Q-bands at 594, and 645 nm and a shoulder at 550 nm (Gandini et al., 1999). The protonation process leads to a change of symmetry of the porphyrin. The absorption spectrum of protonated species consists of only two bands in the Q-band region of the spectrum due to the higher molecular symmetry (D4h) and degeneracy of the excited state (Janson and Katz, 1979). The molecular symmetry of the porphyrin at pH 9.0 is D2h and the absorption in the Q-band region consists of four bands. In H4TPPS42− solution, by increasing the porphyrin concentration (1 × 10⁻⁴ M), new species appear, and the optical absorption spectrum changes dramatically to a Q-band spectrum that is composed of an intense narrow absorption band at 490 nm; a weaker band at 706 nm; red-shifted with respect to the lowest energy Q1 band; and two closely-spaced bands in the Soret absorption region with maxima at 422 and 434 nm. As expected, the relative intensities of TPPS4 absorption bands in the acidic solutions are dependent on the bulk concentration of porphyrin. Fig. 3 shows the spectroscopic features of aqueous porphyrin solutions at pH 4.0 and 9.0 and different concentration conditions. At pH 4.0, the absorption Soret band of the monomer (434 nm) was not detected at concentrations >1.0 mM (Fig. 3). The monomer Soret band is transformed into two bands: one at ∼490 nm and the other at ∼420 nm. An additional, characteristic red-shifted Q-band, with maximum absorption at 706 nm, that has been associated with the formation of J-aggregates, is also apparent, increasing with the porphyrin concentration (Fig. 3). For H2TPPS44−, increase of the porphyrin concentration does not lead to significant changes in the energy of its UV/VIS spectra; only the absorption of the free base monomer (414 nm) shows a small blue shift (≈5 nm). At pH 9.0, the variation in absorbance of the Soret band of the monomer H2TPPS44− with concentration is clearly different from that of H4TPPS42− (Fig. 3) and can be explained by the increase of the negative charge at this pH, which promotes repulsion between porphyrin monomers. Therefore, our results indicate that H2TPPS44−, when compared with H4TPPS42−, does not seem to form J-aggregates, and perhaps the small blue shift of the Soret band can be an indication of formation of dimers in an H-arrangement.
FIGURE 3.

UV/VIS spectra of TPPS4 in 20 mM acetate-phosphate buffer at pHs 4.0 and 9.0 for several concentrations measured with optical path of 1 mm (0.01–0.05 mM) and 0.01 mm (1.0–5.0 mM).
X-ray crystallographic data for TPP diacid (Stone and Fleischer, 1968) shows that, upon protonation of the pyrrolic N atoms of the porphyrinate macrocycle, the peripheral phenyl groups are transformed from their near-perpendicular orientation relative to the macrocycle of the porphyrin free base to a nearly coplanar orientation. With this assumption, the intermolecular arrangement of aggregated TPPS4 is expected to be of sandwich-type.
To get more information on the features of the aggregate at pH 4.0, attempts were made to analyze the data by assuming the scattering particle either as a thin flat aggregate, i.e., as a pancakelike model (J-aggregate planar porphyrin association into a disk), or as a homogeneous cylinderlike aggregate (set of disks into a columnar stacking). Both trials were made without success. On the other hand, the scattering of a cylindrical shell with finite thickness resulted to be a very good representation to the SAXS curve. Fig. 4 shows the SAXS data (open squares) for 10 mM and 5 mM TPPS4 at pH 4.0 (the data for 2 mM are identical to those for 5 mM, unless a normalization factor is given by the concentration ratio, and hence not shown here), and the thick lines represent the best theoretical modelings. Table 1 presents the fitting parameters values related to the cross-section ρc(r) profiles depicted in Fig. 4's inserts. A perusal of the data given in Table 1 and Fig. 4 reveal that the main features of TPPS4 aggregates in solution, at pH 4.0, are independent of the concentration.
FIGURE 4.

Experimental (open squares) and theoretical fitting (Eqs. 1–3; thick line) of (A) TPPS4 = 10 mM, and (B) TPPS4 = 5 mM, both at pH 4.0. The inserts correspond to the ρc(r) functions (Fig. 2) obtained from the adjustment procedure. The fitting parameters are given in Table 1.
TABLE 1.
Values of the fitting parameters to the scattering curves of TPPS4 in 20 mM acetate-phosphate buffer at pH 4.0, using a hollow cylinder model (Eqs. 1–3)
| [TPPS4] mM | R1 (Å) | σ (Å) | L (Å) | ρ1 (a.u.) | ρ2 (a.u.) |
|---|---|---|---|---|---|
| 2 | 70.5 ± 0.5 | 21.0 ± 1.0 | 350 | −0.07 ± 0.01 | 0.85 ± 0.15 |
| 5 | 70.5 ± 0.5 | 21.0 ± 1.0 | 350 | −0.07 ± 0.01 | 0.85 ± 0.15 |
| 10 | 68 ± 1 | 19.5 ± 1.5 | 340 ± 15 | −0.08 ± 0.01 | 1.0 ± 0.2 |
Values of the fitting parameters: cylinder cross-section model, R1 and ρ1, are the radius and the electron density of the inner region, respectively; σ = R2 − R1 and ρ2 are the thickness and the electron density of the aggregate's outer region; ρ0 corresponds to the electron density of the solvent (ρ0 was set equal to ‘0’ in the model); and L is the cylinder length.
It is worthy of mention that the positions of the P(q) minima are intrinsically related to the cross-section dimension, whereas the minima's depths are related to the rodlike aggregate length. There are some factors such as polydispersity, cylinder cross-section nonuniformity, and interface structure that can smooth these minima. For 10 mM porphyrin at pH 4.0, the size of the aggregates is evaluated from the fitting procedure and amounted to L = 340 ± 15 Å, by taking into consideration the minimum values of scattering curve. Indeed, the good quality of the P(q) minima and maxima fittings to the scattering curve suggest that, under this particular experimental condition, the rodlike aggregates must be monodisperse in shape and size. However, for lower porphyrin concentrations (2 and 5 mM), the model fitting fails to reproduce the scattering curve in the P(q) minima, indicating that, in these cases, the solution must be composed of aggregates with some size polydispersity. The best average value of L = 350 Å was also obtained from the fitting procedure. Polydispersity can be one reason to explain why both scattering curves from 5 and 10 mM porphyrin present almost the same intensity, even though they differ by a factor of 2 in molar concentration. Such similarity must be due to the fact that even a small fraction of long columnar aggregates can significantly contribute to the scattering intensity, once I(q) is proportional to the square of the whole aggregate volume V2 (Eqs. 1–3). As we are interested in analyzing the main characteristics of the porphyrin molecular assembling in a layer, no attempt to obtain the aggregate's size distribution was made at this stage.
The cylinder cross-section ρc(r) electron density profiles have arbitrary units and the zero level is associated to the solvent density (in fact, ρwater = ρ0 = 0.327 e/Å3). We notice that ρc(r) shows an outer region with an impressive higher electron density value (ρ2) relative to the solvent, associated to a shell thickness of 20 Å (Table 1). Such value is compatible to the porphyrin molecule dimension. The inner region presents a slightly lower electron density (ρ1) than ρ0. A value of ρTPPS4 = 0.604 e/Å3 is obtained when the total number of the porphyrin molecule electrons, 468 e, and the hydrodynamic volume of TPPS4, 775 Å3 (Maiti et al., 1995), are accounted for. This justifies the high electron density ρ2 value found in the cylindrical shell in relation to the medium, even considering some hydration water inside this shell. As far as the inner region electron density ρ1 is concerned, although its value is very near the solvent, attempts to fix ρ1 = ρ0 do not lead to good fitting results as observed when ρ1 is slightly smaller than ρ0. At this point, we do not know the origin of this lower density, and we believe that only a more detailed knowledge of the internal structure of the aggregate detected by some other technique will allow us to explain this result.
To check the validity of our model, Fig. 5 A shows the best cross-section distribution function pc(r) and the correspondent theoretical fitting to the SAXS curve of 10 mM TPPS4 at pH 4.0 for cylindrical geometry, whereas Fig. 5 B presents the corresponding ρc(r) function (seven steps), obtained by GIFT and DECON programs, respectively. The ρc(r) profile obtained by DECON is very similar to those shown in the inserts of the Fig. 4, reinforcing our model. The radii of gyration Rg = 130 ± 2 Å and Rgc = 72 ± 1 Å for the total aggregate and its cross-section are obtained from p(r) and pc(r) functions, respectively.
FIGURE 5.
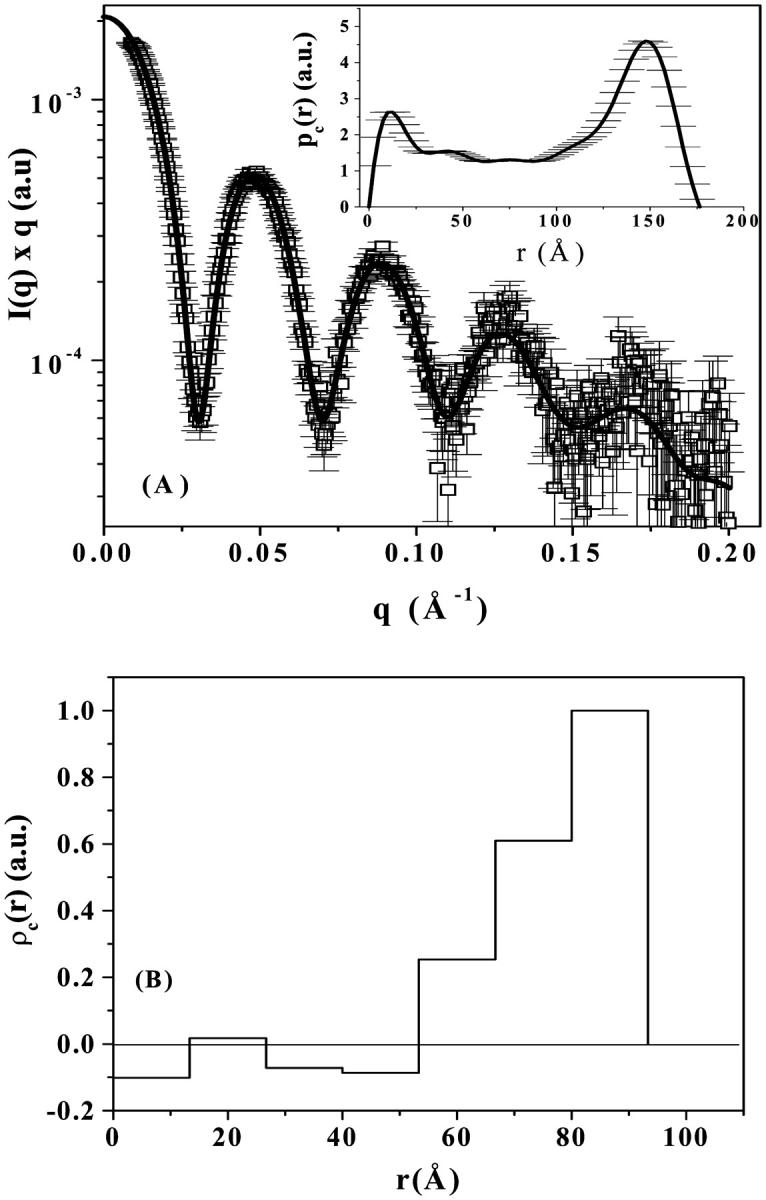
(A) Experimental data (open circles) of 10 mM TPPS4 at pH 4.0, and theoretical fitting (thick line) corresponding to the cylindrical cross-section distribution function pc(r) (insert) obtained by GIFT software; and (B) corresponding ρc(r) function obtained by DECON. See text for details.
As one can notice from pc(r) (Fig. 5 A), the cylinder cross-section presents a nonhomogeneous mass distribution with a greater frequency of distances at large r-values, and a maximum dimension of ∼180 Å, compatible with our modeling (R2 = 90 Å, Table 1). The electron density distribution (Fig. 5 B) is not constant in the porphyrin aggregate cross-section, being significantly higher in an outer shell. Such observation is also in agreement with the modeling presented in Fig. 4. Further, with the assumption of hollow-cylinder aggregates (height L and radii R1 and R2) the radius of gyration (Rg2 = (R12 + R22)/2 + L2/12; Glatter and Kratky, 1982) is ∼127 Å, taking into account the fitting parameters given in Table 1, which is in complete agreement with the value obtained from the p(r) function. Therefore, the obtained aggregate's dimensions seem to be consistent, although we are working in the limit of our experimental resolution.
It is clear, nevertheless, that the porphyrin association at pH 4.0 is rather complex, as some kind of planar association into a ringlike configuration must occur leading to a maximum extension in the plane of 180 Å; this association is triggered by a columnar packing of these planes. Fig. 6 represents such a model that could explain this aggregation of the diprotonated porphyrin (H4TPPS4)2−. An alternative model should be that of the porphyrins forming a kind of continuous shallow helix without disruption into separate layers as presented in our Fig. 6. This helix would be accommodated along the hollow cylinder surface. However, both models cannot be discriminated by SAXS data, as the technique is of low resolution and responds to the electron density contrast between the scattering particle and the continuous medium. It should be remarked that this kind of tubular structure has also been found for some other biological relevant systems as, for instance, in the bacterial antenna chlorophyll (Worcester et al., 1986) and guanosine nucleoside (Mezzina et al., 2001) self-assemblies, dependent on the environment conditions. Also worthy of notice is the very recently reported structure of melanin particles, which exhibited characteristics of sheetlike structures of a thickness of 11 Å, and were described by a scattering form factor of a pancakelike circular cylinder (Littrell et al., 2003). This is an interesting work, even though the aggregates are smaller than those described in our work for TPPS4 and of very different internal structure and molecular interactions.
FIGURE 6.


Proposed model for the aggregates that simulates the SAXS scattering curves at pH 4.0 of the diprotonated porphyrin (H4TPPS4)2−. (A) Top view of the cross-sectional area underlying a single porphyrin layer; (B) Overall view of the hollow cylinder underlying two separate porphyrin layers.
The values of the radii shown in Table 1 can also be used to estimate the monomer porphyrin number (aggregation number) present in the aggregate. The analysis starts with the determination of the perimeter of the cross-section from 2πR (R = R1 + (R2 − R1)/2 = 80 Å) and the size of porphyrin monomer, which is ∼19 Å (Ribó et al., 1994). This leads to an estimate of ≈26 porphyrin monomers in the cross-section of the aggregate. From the length of the cylinder (340 Å) one can estimate a number of ≈113 layers (Fig. 6) composing the whole aggregate, assuming that the distance between the porphyrin molecules in the different layers is ∼3 Å (Ribó et al., 1994) and that they are stacked face-to-face. The total number of porphyrins in the aggregate is 113 × 26 ≅ 2947.
It is worthy of mention that Collings et al. (1999) have made an attempt to use static and dynamic resonance light scattering to evaluate the size and shape of TPPS4 aggregates at acidic pH and at a micromolar porphyrin concentration. They obtained aggregation numbers in the range of 3 × 10⁵ to 6 × 10⁵ for an aggregate of porphyrin molecules with a thin rod shape and very large dimensions by several algebraic data analyses involving separation of scattering and absorption contributions. Certainly, this aggregate is very different from the one described in our present study, and it is not very clear to us how such large aggregates at such low porphyrin concentrations would remain stable in solution.
Therefore, the SAXS results for the TPPS4 are quite revealing, showing important structural information on the aggregates. Based on the experimental data, our model represents, in our opinion, an interesting advance in the understanding of the structure of the porphyrin aggregate which has been studied for quite a long time. Further experimental and theoretical work could be developed to make further tests and improvements of this model. One direction for such development is being currently explored in our laboratory and involves attempts to calculate the molecular contacts between porphyrin molecules in the aggregate to obtain a stable structure at a higher resolution.
CONCLUSIONS
TPPS4 molecules at pH 4.0 associate as a rodlike shell structure, while they are more dissociated at pH 9.0, in agreement with previous reports on changes in Soret band optical absorption spectroscopy (Ribó et al., 1994, 2001; Barber et al., 1991; Eichorn et al., 1997; Kadish et al., 1989). The diprotonated porphyrin ring (H4TPPS4)2− is deformed (each pair of protonated nitrogens in the central ring present the N-H bonds out of plane). This allows the formation of hydrogen bonds between two N-H and one sulfonate group on both faces of the porphyrin plane. The phenyl rings in relation to the porphyrin plane show a nearly planar conformation (35°), in contrast with the nearly orthogonal conformation (90°) of the free base species (H2TPPS4)4−. This effect allows the sulfonate group to reach the center of the porphyrin ring (Rubires et al., 1999). The formation of intermolecularly stabilized aggregated zwitterions in a ringlike conformation could justify the results shown here (out of plane N-H+ could also contribute to association by intermolecular hydrogen bonding with the negatively charged sulfonate groups). At pH 4.0, intermolecular electrostatic interaction forms the large aggregates due to the stabilization between negatively charged sulfonate anions and the positively charged porphyrin rings. The increase of the size of this zwitterionic aggregate leads to the association between chains forming the second aggregated species (H-aggregates; Rubires et al., 1999). The number of porphyrin molecules in the aggregate was estimated as 26 in the cylinder cross-section interacting as a J-aggregate, with a total number of ∼3000 molecules making H-aggregate type contact between the layers, which is schematically depicted in Fig. 6. Since SAXS technique is intrinsically low resolution, it is not possible to discriminate at this point between a “hollow” cylinder model or a helical model, where the porphyrin monomers would be accommodated along the cylinder surface forming the helix. This is certainly an interesting matter for further studies. At pH 9.0, the porphyrin rings are not positively charged and the aggregates are dissociated into small aggregates. Rubires et al. (1999) showed that the presence of two sulfonate groups (TPPS2) allowed the formation of H-aggregates with defined geometry, and in the case of three or four sulfonate groups (TPPS3 and TPPS4), this directive effect was lost and aggregates with a less defined geometry were obtained presenting probably a mixture of J- and H-aggregation. Our present model derived from the SAXS data is in agreement with these findings.
Acknowledgments
We are grateful to the staff of the SAXS beamline at the National Synchrotron Light Laboratory, Campinas, Brazil, for support in the experiments.
We thank Fundação de Amparo à Pesquisa do Estado de São Paulo (FAPESP), Coordenação e Aperfeiçoamento do Ensino Superior (CAPES), and Conselho Nacional de Pesquisas (CNPq) for partial financial support. S.C.M.G. and E.L.G. are grateful to FAPESP for their postdoctoral and PhD fellowships, respectively. R.I. and M.T. are grateful to CNPq for their research fellowships.
References
- Barber, D. C., R. A. Freitag-Beeston, and D. G. Whitten. 1991. Atropisomer-specific formation of premicellar porphyrin J-aggregates in aqueous surfactant solutions. J. Phys. Chem. 95:4074–4086. [Google Scholar]
- Bonnett, R. 1995. Photosensitizers of the porphyrin and phthalocyanine series for photodynamic therapy. Chem. Soc. Rev. 24:19–33. [Google Scholar]
- Collings, P. J., E. J. Gibbs, T. E. Starr, O. Vafek, C. Yee, L. A. Pomerance, and R. F. Pasternack. 1999. Resonance light scattering and its application in determining the size, shape, and aggregation number for supramolecular assemblies of chromophores. J. Phys. Chem. B. 103:8474–8481. [Google Scholar]
- Datta-Gupta, N., D. Malakar, and J. Dozier. 1989. Binding studies of four free-base porphyrins and six iron (+3) porphyrins with human-serum albumin. Res. Commun. Chem. Pathol. Pharmacol. 63:289–292. [PubMed] [Google Scholar]
- Dougherty, T. J. 1993. Photodynamic therapy. Photochem. Photobiol. 58:895–900. [DOI] [PubMed] [Google Scholar]
- Eichorn, H., D. Wachrle, and D. Pressner. 1997. Glasses of new 2,3,9,10,16,17,23,24-octasubstituted phthalocyanines forming thermotropic and lyotropic discotic mesophases. Liq. Cryst. 22:643–653. [Google Scholar]
- Fritz, G., A. Bergmann, and O. Glatter. 2000. Evaluation of small-angle scattering data of charged particles using the generalized indirect Fourier transformation technique. J. Chem. Phys. 113:9733–9740. [Google Scholar]
- Gandini, S. C. M., V. E. Yushmanov, I. E. Borissevitch, and M. Tabak. 1999. Interaction of the tetra (4-sulfonatophenyl)porphyrin with ionic surfactants: aggregation and location in micelles. Langmuir. 15:6233–6243. [Google Scholar]
- Glatter, O. 1981. Convolution square root of band-limited symmetrical functions and its application to small-angle scattering data. J. Appl. Crystallogr. 14:101–108. [Google Scholar]
- Glatter, O., and O. Kratky. 1982. Small Angle X-Rays Scattering. Academic Press, London.
- Guinier, A., and G. Fournet. 1955. Small Angle Scattering of X-Rays. Wiley, New York.
- Itri, R., and L. Q. Amaral. 1994. Small-angle x-ray scattering of systems with inhomogeneous particles. J. Appl. Crystallogr. 27:20–24. [Google Scholar]
- Itri, R., and L. Q. Amaral. 1991. Distance distribution function of sodium dodecyl sulfate micelles by x-ray scattering. J. Phys. Chem. 95:423–427. [Google Scholar]
- Janson, T. R., and J. J. Katz. 1979. The Porphyrin. D. Dolphin, editor. Academic Press, New York, Vol. IV, Ch. 1.
- Kadish, K. M., G. B. Maiya, C. Araullo, and R. Guilard. 1989. Micellar effects on the aggregation of tetraanionic porphyrins. spectroscopic characterization of free-base meso-tetrakis(4-sulfonatophenyl)porphyrin, (TPPS)H2, and (TPPS)M (M = zinc(II), copper(II), and vanadyl) in aqueous micellar media. Inorg. Chem. 28:2725–2731. [Google Scholar]
- Keene, J. P., D. Kessel, E. J. Land, R. W. Redmond, and T. G. Truscott. 1986. Direct detection of singlet oxygen sensitized by hematoporphyrin and related compounds. Photochem. Photobiol. 43:117–120. [DOI] [PubMed] [Google Scholar]
- Kessel, D., P. Thompson, K. Saatio, and K. D. Nantwi. 1987. Tumor localization and photosensitization by sulfonated derivatives of tetraphenylporphine. Photochem. Photobiol. 45:787–790. [DOI] [PubMed] [Google Scholar]
- Labat, G., J. L. Séris, and B. Meunier. 1990. Oxidative degradation of aromatic pollutants by chemical models of ligninase based on porphyrin complexes. Angew. Chem. Int. Ed. Engl. 29:1471–1473. [Google Scholar]
- Littrell, K. C., J. M. Gallas, G. W. Zajac, and P. Thiyagarajan. 2003. Structural studies of bleached melanin by synchrotron small angle x-ray scattering. Photochem. Photobiol. 77:115–120. [DOI] [PubMed] [Google Scholar]
- Lyon, R. C., P. J. Faustino, J. S. Cohen, A. Katz, F. Mornex, D. Colcher, C. Baglin, S. H. Koenig, and P. Hambright. 1987. Tissue distribution and stability of metalloporphyrin MRI contrast agents. Magn. Reson. Med. 4:24–33. [DOI] [PubMed] [Google Scholar]
- Maiti, N. C., M. Ravikanth, S. Mazumdar, and N. Periasamy. 1995. Fluorescence dynamics of noncovalently linked porphyrin dimers and aggregates. J. Phys. Chem. 99:17192–17197. [Google Scholar]
- Maiti, N. C., S. Mazundar, and N. Periasamy. 1998. J- and H- Aggregates of porphyrin-surfactant complexes: time-resolved fluorescence and other spectroscopic studies. J. Phys. Chem. B. 102:1528–1538. [Google Scholar]
- Mezzina, E., P. Mariani, R. Itri, S. Masiero, S. Pieraccini, G. P. Spada, F. Spinozzi, J. T. Davis, and G. Gotarelli. 2001. The self-assembly of a lipophilic guanosine nucleoside into polymeric columnar aggregates: the nucleoside structure contains sufficient information to drive the process towards a strikingly regular polymer. Chem. Eur. J. 7:388–395. [DOI] [PubMed] [Google Scholar]
- Nelson, J. A., and U. Schmiedl. 1991. Porphyrins as contrast media. Magn. Reson. Med. 22:366–371. [DOI] [PubMed] [Google Scholar]
- Ribó, J. M., J. Crusats, J. A. Farrera, and M. L. Valero. 1994. Aggregation in water solutions of tetrasodium diprotonated meso-tetrakis(4-sulfonatophenyl)porphyrin. J. Chem. Soc. Chem. Commun. 6:681–682. [Google Scholar]
- Ribó, J. M., J. M. Bofill, J. Crusats, and R. Rubires. 2001. Point-dipole approximation of the exciton coupling model versus type of bonding and of excitons in porphyrin supramolecular structures. Chem. Eur. J. 7:2733–2737. [DOI] [PubMed] [Google Scholar]
- Ricchelli, F., S. Gobbo, G. Jori, G. Moreno, F. Vinzens, and C. Salet. 1993. Photosensitization of mitochondria by liposome-bound porphyrins. Photochem. Photobiol. 58:53–58. [DOI] [PubMed] [Google Scholar]
- Rubires, R., J. Crusats, Z. El-Hachemi, T. Jaramillo, M. López, E. Valls, J. A. Farrera, and J. M. Ribó. 1999. Self-assembly in water of the sodium salts of meso-sulfonatophenyl substituted porphyrins. New J. Chem. 23:189–198. [Google Scholar]
- Stone, A., and E. B. Fleischer. 1968. The molecular and crystal structure of porphyrin diacids. J. Am. Chem. Soc. 90:2735–2748. [Google Scholar]
- Teixeira, C. V., R. Itri, and L. Q. Amaral. 2000. Micellar shape transformation induced by decanol: a study by small-angle x-ray scattering (SAXS). Langmuir. 16:6102–6109. [Google Scholar]
- Worcester, D. L., T. J. Michalski, and J. J. Katz. 1986. Small-angle neutron scattering studies of chlorophyll micelles: models for bacterial antenna chlorophyll. Proc. Natl. Acad. Sci. USA. 83:3791–3795. [DOI] [PMC free article] [PubMed] [Google Scholar]